133
Community Health and Wellness Promotion CH06100 Session 1 Concepts, History, Determinates & more May 10, 2011 David Beavers, M.Ed., D.C., M.P.H. Session 1
| Date post: | 29-Mar-2015 |
| Category: |
Documents |
| Upload: | aubrey-waites |
| View: | 217 times |
| Download: | 1 times |

Session 1
Community Healthand
Wellness PromotionCH06100
Session 1Concepts, History, Determinates & more
May 10, 2011
David Beavers, M.Ed., D.C., M.P.H.

Session 1 2
Determinants of HealthMajor Categories
• Physical factors• Social & Cultural factors• Community organization• Individual behaviors• Biological factors

3
Determinants of Health
Environmental Ambient Infectious Crime Stress Family
Individual Non-Modifiable Biological host Modifiable Health habits Diet Physical activity Tobacco use Use of health care
Health Care Access Quality
Social Determinants Income Poverty & Inequity Education Race & Ethnicity Community & Social cohesion
Session 1
Session 1 4
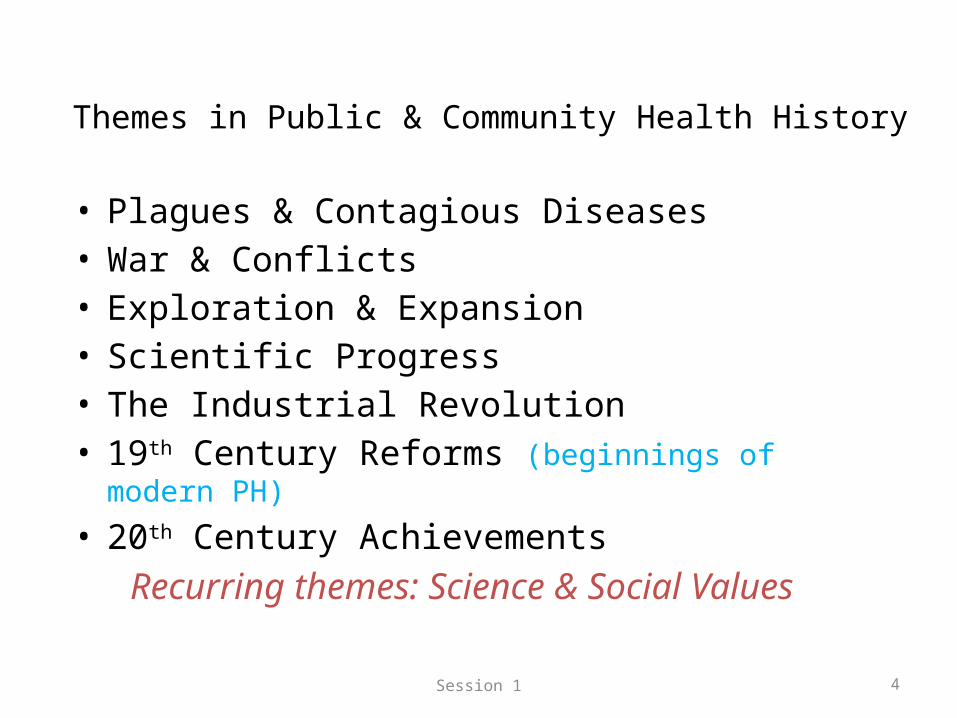
Themes in Public & Community Health History
• Plagues & Contagious Diseases• War & Conflicts• Exploration & Expansion• Scientific Progress• The Industrial Revolution• 19th Century Reforms (beginnings of modern PH)
• 20th Century Achievements Recurring themes: Science & Social Values

Session 1 5
Early Christian Period:30 - 300 AD
• Order of Deaconesses– Organized visiting of the sick– Forerunner of community
nursing concept• Rise of monasteries
– Tended to be built near reliable water source– Fed the hungry– Cared for the sick (forerunner of hospitals)– Repositories of learning

6
Middle Ages: 500 AD – 1400 AD
Quarantine: as a control measure, started in Venice, the chief port of entry from the Orient
Ships docking at the Lazzaretto Vecchio, Venice, 14th century
Session 1

Session 1 7
Renaissance & Enlightenment: 1300 - 1700
• Public Health administration is becoming a city council responsibility
• Gradual transfer of responsibility for institutional health care from the church to civil authorities
• By the 1600s towns in Europe had standards for cleanliness and rules for personal responsibility
• Late 1600s hospitals started became places not only to treat disease but to train doctors

Session 1 8
The Sanitary Movement:1830-1875
• Growth in scientific knowledge
• Connection between poverty and disease
• Importance of water supply & sewage removal

Session 1 9
British Reformers
Sir Edwin Chadwick1800-1890 “Good economics to prevent the evils”
• Assistant to Bentham• 1834 report led to reform of England’s Poor
Laws• 1842 Report on the Sanitary Conditions of
the Labouring Population – “Sanitary Report”
• 1847 - first Medical Officer of Health appointed in Liverpool
• 1848 Public Health Act established the principle that health care should be administered at a local level

Session 1 10
Four Phases of the Development of Modern Public Health
1. Addressing infectious diseases related to “urbanization, poverty and squalor” (1840s to the late 19th century)
2. Added personal preventive medical services related to immunization, family hygiene, health education and family planning which began with the development of vaccines (late 19th century until the 1930s)
3. Focus is on improving population health through the provision of organized medical services deploying effective therapeutic technologies (antibiotics)
4. Recognition that the ‘environment’ is also social, economic and psychological and needs to be considered as part society's health policy
Source: Ashton (1990)

Session 1 11
Part I: Understanding & Improving Health
• History• Determinants of
health model• How to use a
systematic approach• Leading Health
Indicators (LHI)

Session 2
Community Healthand
Wellness PromotionCH06100
Session 2Dimensions, Risks, Levels of Prevention, Professional
Literature, Related Theories & “Flags”May 17, 2011
David Beavers, M.Ed., D.C., M.P.H.

Session 2 13
Wellness Review
• Wellness is an active process of becoming aware of and making choices toward a more successful existence
• Wellness is a multidimensional state of being describing the existence of positive health in an individual as exemplified by quality of life and a sense of well-being

Session 2 14
Six Major Dimensions ofHealth & Wellness
1. Emotional – continuum of feelings, managing stress, transitioning major changes, work-life balance
2. Intellectual – stimulating mind & mental capacity, reasoning & creatively, continuing education
3. Occupational – contributing, using vocational skills/abilities, hobbies
4. Physical – taking action to maintain health, exercise, nutrition, ADLs, self-care

Session 2 15
Six Major Dimensions ofHealth & Wellness
5. Social – connecting & interacting with family, friends, co-workers & others
6. Spiritual – life purpose, seeking spiritual centered beliefs, nature, religion

Session 2 16
Health Problems &Intro to Risk Factors
• Health problem– a condition that can be represented in terms of measurable
• health status, or• quality of life indicators
• To intervene in a health problem requires ability to identify– risk factors– pathways of causation
• Risk factors in general:– Causative factors that increase likelihood of a condition or disease
• Direct Contributing Factors - affect the level of the condition• Indirect Contributing Factors - likely to be controllable and basis
for intervention

Session 2 17
Analyzing Health Problemsfor Risk Factors
• Determinant - scientifically established factor that relates directly (most proximal) to the level of the health problem. A health problem may have any number of determinants identified for it. Example: Low birth-weight is a prime determinant for the health problem of neonatal mortality
• Direct Contributing Factor - scientifically established factor that directly affects the level of the determinant. Example: Use of prenatal care is one factor that affects the low birth weight rate
• Indirect Contributing Factor – individual or community-specific factor that affects the level of a direct contributing factor. Such factors can vary considerably from one individual or community to another. Example: Availability of day care or transportation services within the community may affect the use of prenatal care services
NOTE: Work sheet example on later slide (#21)
Source: Definitions adapted from
Centers for Disease Control and Prevention Public H
ealth Practice Program O
ffice

Session 2 18
Health Problem Analysis Worksheet Indirect Contributing Factor
Direct Contributing Factor
Indirect Contributing Factor
Risk Factor Direct Contributing Factor
Indirect Contributing Factor
Direct Contributing Factor
Health Problem
Indirect Contributing Factor
Direct Contributing Factor
Indirect Contributing Factor
Risk Factor Direct Contributing Factor
Indirect Contributing Factor
Direct Contributing Factor
NutritionSmokingSubstance abuse
Access to care/ Insurance
Cultural beliefs
UninsuredKnowledge
Inadequate educationUnsafe home
Prematurity
Inadequate prenatal careLow birth weight
Transportation
Access to transportationAvailable daycare
Low BMITeen pregnancy
Post neonatal mortality
Infant Mortality
Preconceptional health
SIDS/injuries
Pediatric access
Health Problem Analysis Worksheet Example

Session 2 19
Ten Leading Causes of Death
• Depends on age group• Observable patterns• Overall age group ranking
– #1 = heart disease– #2 = malignant neoplasms– #3 = cardio-vascular

Session 2 20
Three Levels of Prevention
• Primary– Stop or delay onset
• Secondary– Early diagnosis & prompt treatment
• Tertiary– Retrain, re-education & rehabilitate

Session 2 21
Health “Flag” System
• Flags help explain risk factors• Guidelines to help make clinical
decision(s)– Evaluation, triage & augmentation of treatment
• Five types of flags

Session 3
Community Healthand
Wellness PromotionCH06100
Session 3Behavioral Health
May 24, 2011
David Beavers, M.Ed., D.C., M.P.H.
Session 3
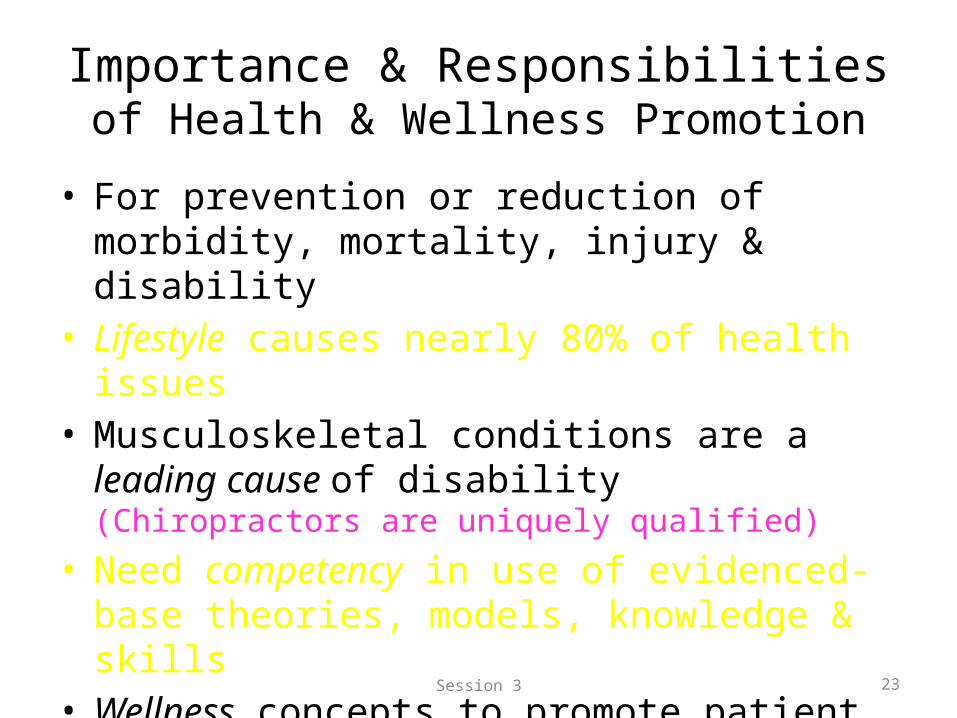
Importance & Responsibilities of Health & Wellness Promotion
• For prevention or reduction of morbidity, mortality, injury & disability
• Lifestyle causes nearly 80% of health issues• Musculoskeletal conditions are a leading cause of
disability (Chiropractors are uniquely qualified)
• Need competency in use of evidenced-base theories, models, knowledge & skills
• Wellness concepts to promote patient self-efficacy
23

Session 3
Definition of Terms
• Counseling– The act of giving advice about issues, challenges or health
problems– Attempts to clarify patient’s own thinking about a health
problem rather than solve the health problem
• Coaching– The act of directing, instructing and training with the aim to
achieve a specific health goal– Such as addressing health and adjusting lifestyle for wellness
24

Session 3
Theory vs. Model
• Theories comprise principles devised to explain a group of facts or phenomena; used to make predictions– Health behavior theories provide broader understanding
of behavior & its links to the general human condition• Models comprise representations of structures or
processes & the interactions among these; logically links phenomena together– Health models provides a framework for targeting system,
structural & process changes
25

Session 3
Ecological FrameworkBrief Introduction
• Ecology (“environment”) is the space outside the person
• Five levels of concentric influence:1. Intrapersonal (“self/individual”) factors2. Interpersonal (“primary groups”) processes3. Institutional factors4. Community Factors5. Public policy
26

Session 3
Models of Intrapersonal or Individual Health Behavior
• Health Belief Model• Theory of Reasoned Action & Planned
Behavior• Transtheoretical Model
– With Stages of Change
27

Session 3
Models of IndividualHealth Behavior
• Health Belief– Constructs
• Perceived susceptibility, severity, benefits & barriers
• Self-efficacy – confidence• Cues to Action – strategies, reminders, push to
take action, phone a friend, postcard
28

Session 3
Models of IndividualHealth Behavior
• Theory of Reasoned Action & Planned Behavior (two separate theories work together)– Foundation
• Individual motivational factors• Motivation
– Internal state activates & directs behavior– Desire energizes & directs goal orientation– Needs influence intensity & direction
29

Session 3
Models of IndividualHealth Behavior
• Theory of Reasoned Action & Planned Behavior (two separate theories work together)– Foundation (continued)
• Behavior is result of one’s intention• Intent is result of beliefs & attitudes• Suggests that attitude is better predictor of
behavior• Assumes people are rational
30

Session 3
Models of IndividualHealth Behavior
• Theory of Reasoned Action & Planned Behavior (two separate theories work together)– Constructs
• Behavioral intention• Attitude toward behavior
– Positive - strong beliefs that positively valued outcomes will result
– Negative - strong beliefs that negatively valued outcomes will result
31

Session 3
Models of IndividualHealth Behavior
• Theory of Reasoned Action & Planned Behavior (two separate theories work together)– Constructs
• Subjective norms– Normative beliefs– Referent others– Approval-Disapproval– Sum & Neutral
– Think – “Intention & Individual Intention”
32

Session 3
Models of IndividualHealth Behavior
• Theory of Reasoned Action & Planned Behavior (two separate theories work together)– Foundation – similar to TRA
– Constructs• Volitional control – large degree of control• Perceived behavioral control
– Influences of outside factors – Assumes person will exert more effort when
perception of control is high
33

Session 3
Theory of Reasoned Action (grey) & Planned Behavior (white)
34

Session 3
Models of IndividualHealth Behavior
• Transtheoretical Model & Stages of Change– Foundation
• People are generally in 1 of 5 stages of change (total of 6 stages)
• Used often with addictive behaviors
35

Session 3
Models of IndividualHealth Behavior
• Transtheoretical Model & Stages of Change• Six stages (only 5 are “active”)
1. Pre-contemplation – not intending2. Contemplation – intending within 6 months3. Preparation – intending/planning within 30 days4. Action – currently & within last 6 months5. Maintenance – actively doing/preventing
relapse6. Termination – no temptation, integrated into
lifestyle, “non-active”
36

Session 3
Models of InterpersonalHealth Behavior
• Social Cognitive theory– Foundation
• Principles of reinforcement & punishment– Learn by watching others = observational learning/modeling– Cognitive process mediates social learning– R & P affect motivation, not behavior itself
• Assumptions– Learning internal process – may/may not affect behavior– Behavior is directed toward particular goals– Behavior becomes self-regulated
37

Session 3
Models of InterpersonalHealth Behavior
• Social Cognitive theory– Constructs
• Reciprocal determinism– Personal factors (P)– Behavior (B)– Environmental (E)
• Environment– Physical-Social-Cognitive
• Observational learning– Attention-Retention-Motor Reproduction-Motivation
38

Session 3
Models of InterpersonalHealth Behavior
• Social Cognitive theory– Constructs (continued)
• Behavioral capacity– Must have knowledge/skill of a behavior before
one can perform behavior• Reinforcement
– Positive = reward– Removal of reward -> behavior reverts
• Reduce barriers
39

Session 3
Models of InterpersonalHealth Behavior
• Social Cognitive theory– Constructs (continued)
• Outcome expectations– Belief will lead to certain outcome– Maximize positive and minimize negative– Learned four ways
» Previous experience in similar situations» From observing others» Hearing about situations» From emotional/physical responses
40

Session 3
Models of InterpersonalHealth Behavior
• Social Cognitive theory– Constructs (continued)
• Self-efficacy = self-confidence that one can do the behavior
– Confidence in performing– Enhancing – similar to four ways of learning– Verbal persuasion for incremental changes– Physiological state
41

Session 3
Models of InterpersonalHealth Behavior
• Social Cognitive theory– Constructs (continued)
• Self-control– Evaluation of internal standards & external
perceptions (“reality”)• Emotional Coping Responses
– Have control over emotions» Psychological defenses of repression, denial» Cognitive techniques – restructuring, CBT» Treatment of symptoms – relaxation, stress
42

Session 3
Models of InterpersonalHealth Behavior
• Social Networks & Social Support– Social Support (continued)
• Important function of social relationships• Categories of supportive behaviors
– Emotional – empathy, love, trust, caring– Instrumental – tangible aid, service– Informational – advice, suggestions, information– Appraisal – information for self-evaluation
43

Session 3
Models of Community& Group Behavior
• Diffusion of Innovations– Adoption process – follows bell curve
• Innovators• Early adopters• Early majority• Late majority
– Think – iPad
44
Session 3
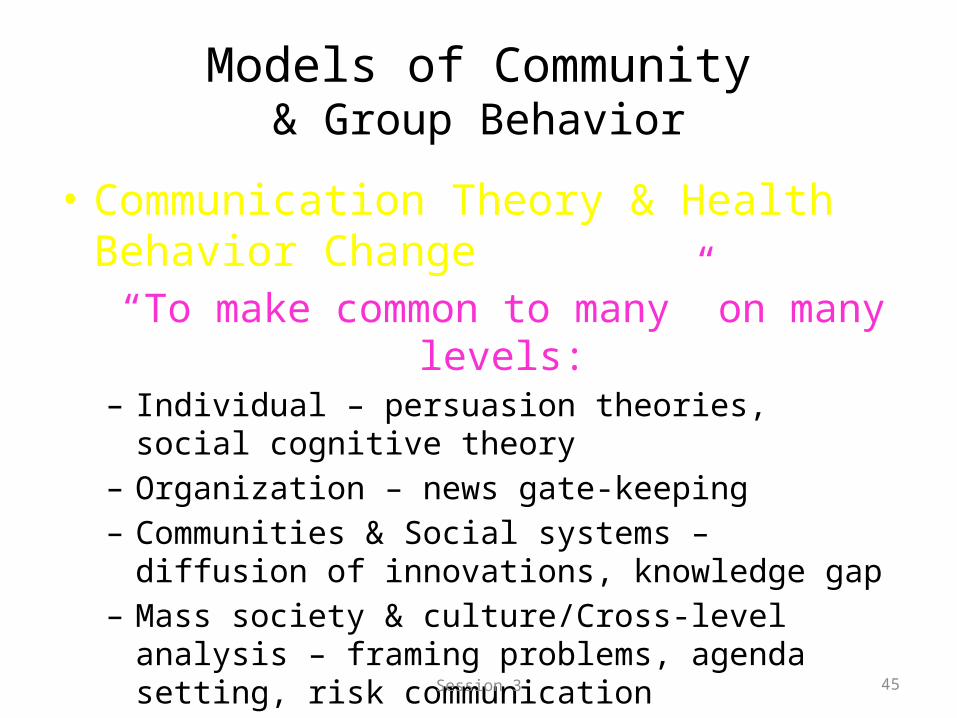
Models of Community& Group Behavior
• Communication Theory & Health Behavior Change
“To make common to many” on many levels:– Individual – persuasion theories, social cognitive theory– Organization – news gate-keeping– Communities & Social systems – diffusion of innovations,
knowledge gap– Mass society & culture/Cross-level analysis – framing
problems, agenda setting, risk communication
45
Session 3
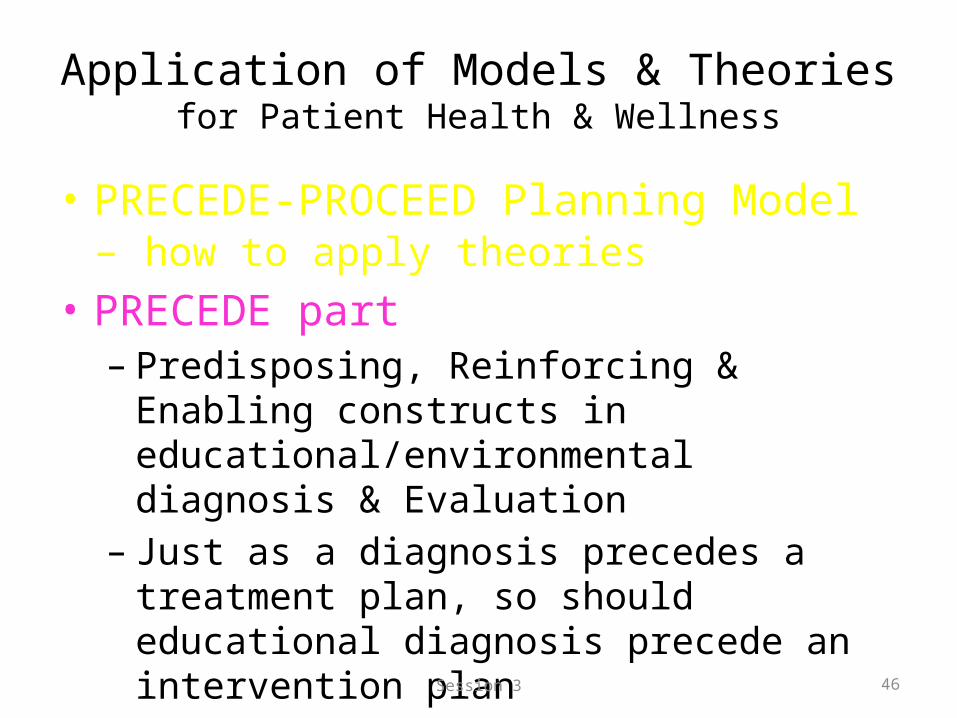
Application of Models & Theoriesfor Patient Health & Wellness
• PRECEDE-PROCEED Planning Model – how to apply theories
• PRECEDE part– Predisposing, Reinforcing & Enabling constructs in
educational/environmental diagnosis & Evaluation– Just as a diagnosis precedes a treatment plan, so
should educational diagnosis precede an intervention plan
46

Session 3
Application of Models & Theoriesfor Patient Health & Wellness
• PRECEDE-PROCEED Planning Model – how to apply theories
• PROCEED part– Policy, Regulatory & Organizational constructs in
Educational & Environmental Development– Adds determinants of health & health
behaviors/lifestyle factors
47
Session 3
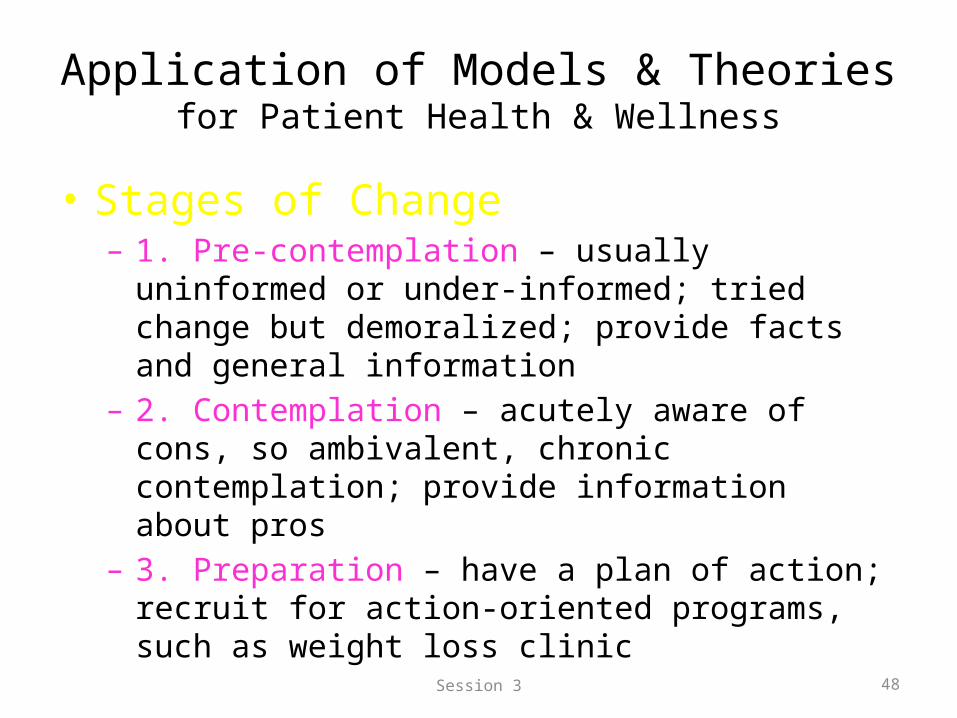
Application of Models & Theoriesfor Patient Health & Wellness
• Stages of Change– 1. Pre-contemplation – usually uninformed or under-
informed; tried change but demoralized; provide facts and general information
– 2. Contemplation – acutely aware of cons, so ambivalent, chronic contemplation; provide information about pros
– 3. Preparation – have a plan of action; recruit for action-oriented programs, such as weight loss clinic
48

Session 3
Application of Models & Theoriesfor Patient Health & Wellness
• Stages of Change (continued)– 4. Action – have taken some action, still have not obtained
sufficient level to reduce risks; encourage continued progress
– 5. Maintenance – for example 12 months of not smoking has 43% relapse, 5 years has only 7%; strive to prevent relapse
– 6. Termination – total self-efficacy; less than 20% reach this stage; encourage life-time of “maintenance” with continued check-ups
49

Session 4
Community Healthand
Wellness PromotionCH06100
Session 4Epidemiology
May 31, 2011
David Beavers, M.Ed., D.C., M.P.H.

Session 4
Why even bother to count
• Measuring: how many people get ill, have a dysfunction or die each year; who, when, why & where do they live– is one of the most important means of, . . – along with gauging how various “diseases” and
injuries are affecting the living, …– at assessing the effectiveness of a country’s health
system
51

Session 4
EpidemiologyDefinition (WHO)
The study of the distribution & determinants of health-related states or events (including disease & dysfunction), and the application of such study to the control of diseases and other health related problems
Disease in not randomly distributed Has patterns (risk factors) so can predict & control
Two chief methods are used to carry out epidemiological investigations Descriptive (& surveillance) studies are used to study distribution
patterns; organized by time, place & person Analytical studies are used to study determinants; concerned with
cause & effects
52

Session 4
Epidemiology overview“Population Medicine”
• All epidemiological studies involve sampling of population at risk
• Subject to sampling (random) error• P-values & confidence intervals (CI) used to
express degree of uncertainly or statistical variability in estimates
• This does not consider systematic (non-random) error or bias
53
Session 4
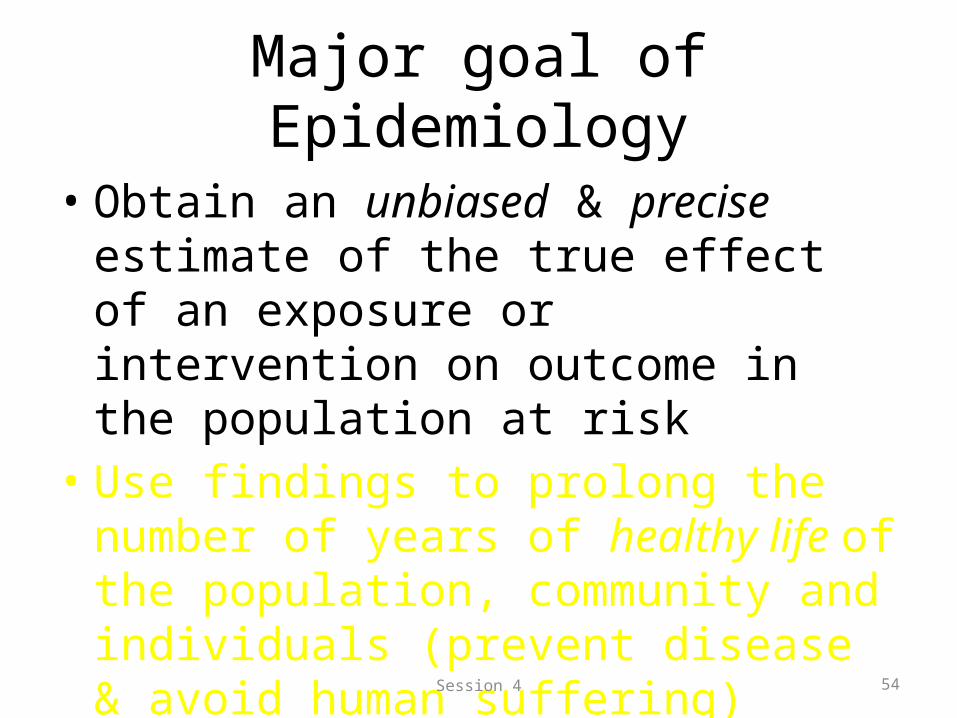
Major goal of Epidemiology
• Obtain an unbiased & precise estimate of the true effect of an exposure or intervention on outcome in the population at risk
• Use findings to prolong the number of years of healthy life of the population, community and individuals (prevent disease & avoid human suffering)
54

Session 4
EpidemiologyTerms & Descriptions
Variable Anything that can be measured & observed to vary A single value is a constant; therefore, not a variable
Data characterization Quantitative
Measured on a numeric scale Discrete integer – number of moles, shoe size Continuous scale – blood pressure, speed of driving
Qualitative No natural sense of ordering, aka “categorical” Can be coded as numeric (but have no meaning)
Hair color, race; male = 1 & female = 2; names Discrete values equal to an integer
55

Session 4
EpidemiologyVariables
• Two types of variables– Dependent variable - outcome of interest, variable being
affected, “depends on what we did”; example - spinal ROM– Independent variable - the “hypothesized” cause or
influence on dependent variable, “what or how much we did”; spinal manipulation
• Controllable factor – treatment/intervention; example - chiropractic manipulation
• Non-controllable factor – exposure, risk factor, demographic; example - slip, trip or fall type of injury
56

Session 4
Relationship betweenindependent & dependent variables
An example from a mathematical formula to convert temperature If: F = 1.8 x C + 32 (F is unknown)
C is independent F is dependent (changes in F depend on changes in C) Constants = 1.8 and 32
Now if: C = (F – 32)/1.8 C is now dependent F is now independent
57

Session 4
EpidemiologyTypes of Data
Continuous Any value within a defined range
Ratio – numbers can be compared as multiples of one another Interval - along a scale in which each position is equidistant from
one another, an “integer”
Categorical (Discrete) Only whole numbers
Nominal – Latin for “name”, can count but not order Ordinal – ranked in order, can count but not measure
Dichotomous categorical Only two options
Yes/No; Pass/Fail; Pregnant/Not Pregnant
58

Session 4
Data MeasurementVariable type determines subsequent
statistical analysis performed
Commonly used scales of measurement Nominal
Group qualitative into arbitrary categories 1 = white, 2 = Hispanic, 3 = American Indian
Ordinal Rank “categorical” data
Likert scale: 1 = strongly agree, 2 = agree, etc.
Interval Similar to ordinal, but has meaningful difference between
successive values; 70 to 80 same as 30 to 40
59

Session 4
Data Measurementcontinued
Commonly used scales of measurement Ratio
Similar to interval, with a meaningful zero Zero is absence of weight/matter, while zero degrees F is
totally arbitrary Significance of “meaningful” zero
Means ratio of two values is also meaningful 10 lbs. is twice as heavy as 5 lbs. But, an object with 10 degrees F is not twice as warm as
that object at 5 degrees F since the zero value point on the F scale is arbitrary
60

Session 4
EpidemiologyMajor Concepts
• Measures of Disease Frequency• Measures of Association• Disease Rates• Bias, Confounding & Effect Modification• Adjusted disease rates by standardization• Surveillance• Study designs• Hypothesis Testing
61

Session 4
Measures of Disease FrequencyPrimarily used for descriptive purposes to explore
trends & patterns
• Prevalence– Number of existing cases any given time
• Calculated by (# existing cases/total population)• Answer ranges from 0 to 1• No temporality – no info on when disease
developed• Key word = proportion• Point prevalence – one point in time• Period Prevalence – beginning date to ending date
62

Session 4
Measures of Disease Frequency
Incidence Number of new cases during a defined period
Cumulative Incidence (Incidence Risk/Attack Rate) Measures individuals who develop the disease Calculated by (# new cases / total population at risk) Answer ranges from 0 (no new cases) to 1 (everyone infected) Average risk (probability) of developing the disease
Incidence Density (Incidence Rate/Person-Time Incidence/Event rate) Measures rate that new cases occur in population Calculated by (# new cases / total person-time) Answer ranges from 0 to infinity & integrates time into
denominator of formula Average hazard rate of expected number of “events” per unit of
time 63
Session 4
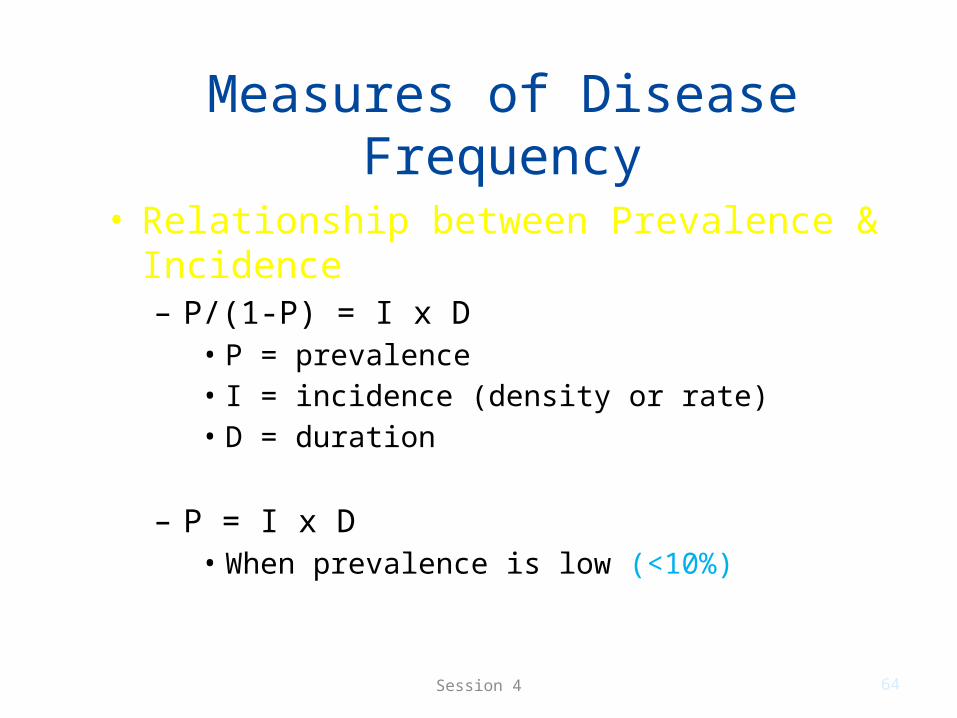
Measures of Disease Frequency
• Relationship between Prevalence & Incidence– P/(1-P) = I x D
• P = prevalence• I = incidence (density or rate)• D = duration
– P = I x D• When prevalence is low (<10%)
64

Session 4
CalculationChiropractic example
In a population of 1,000,an initial exam reveals 100individuals with scoliosis.Over next 10 years, 40 moresubjects develop scoliosis.
What is prevalence of scoliosis?
What is 10-year risk (cumulative incidence) of developing scoliosis?
65

Session 4
Calculation
In a population of 1,000,an initial exam reveals 100individuals with scoliosis.Over next 10 years, 40 moresubjects develop scoliosis.
What is prevalence of scoliosis? 100 initial cases / 1,000 people at risk = 10%
What is 10-year risk (cumulative incidence) of developing scoliosis? 40 new cases/900 people at risk = 4.4%
66

Session 4
Measures of AssociationEstimates relationship between possible risk factors & disease occurrence to make inferences about effects
of exposure Uses a “2 x 2” contingency table
• Ratio measures– Risk Ratio– Odds Ratio
• Difference measures– Attributable Risk (Risk Difference)– % Population Attributable Risk (Risk Difference)
67

Session 4
2 x 2 Contingency Tableaka “Cross Tabulation”
Record & analyze the relationship between two or more categorical variables
Displays the multivariate or frequency distribution of variables in a matrix format
Used also with case-control & cohort studies
68
Disease or risk factors (cases)
No Disease or no risk factors (controls)
Totals
Exposed a b a + b
Not Exposed c d c + d
Totals a + c b + d a + b + c + d
Session 4
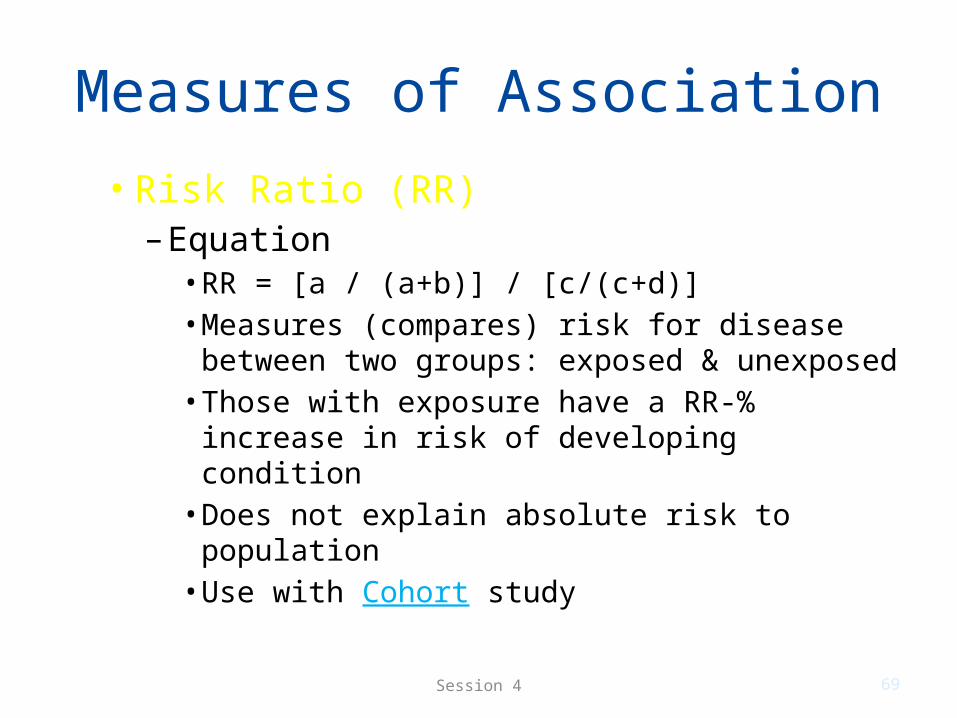
Measures of Association
• Risk Ratio (RR)– Equation
• RR = [a / (a+b)] / [c/(c+d)]• Measures (compares) risk for disease
between two groups: exposed & unexposed• Those with exposure have a RR-% increase
in risk of developing condition• Does not explain absolute risk to population• Use with Cohort study
69

Session 4
Measures of Association
• Odds Ratio (OR)– Equation
• OR = ad / bc• The odds of exposure among the cases (with
disease) are OR-times greater as compared to controls (subjects without disease)
• When exposure-specific risk or rates cannot be calculated since no true denominator
• If disease is rare then OR approximates RR• Use with Case-Control study
70

Session 4
Measures of Association“Non-independence”: Measures for impact of exposure
or intervention
Attributable Risk (Risk Difference) Estimates excess risk of disease in exposed that
is attributable to exposure % Population Attributable Risk (Risk
Difference) Estimates the proportion of disease in the total
population that is attributable to the exposure and that can be eliminated if the exposure is eliminated
71

Session 4
StandardizationUS Census is an example
• Adjusted or standardized rates are computed to remove the effect of other “factors” from crude (overall/total population) rates– Crude has “differences” mixed in – age, sex, etc.
• Need age-specific rates of sample population & age-structure of standard population
• Special formula to calculate72

Session 4
Surveillance
• Passive– Voluntary reporting of disease cases– Provider initiated– Example – Anthrax, Brucellosis, Rabies & various animal diseases
• State reportable infectious diseases
• Active– Mandated reporting of disease cases– Health department initiated– Extensive outreach– Example – HIV, TB
• Easier to spread & more life-threating73

Session 4
Study Design TypesTwo major types
• Performed when disease or death occurs in unexpected or unacceptable numbers
• Observational– Exposure status not influenced by investigator– “Natural experiment” – John Snow
• Experimental– Involve manipulation of exposure or intervention– Randomization is common
74

Session 4
Study Design TypesObservational (aka “Descriptive”)
• Observational - data at individual or group level & organized by time, place & person– Case Report/Case Study– Ecological Study– Cross-sectional– Case-Control– Cohort
75

Session 4
Study Design TypesExperimental (aka Analytic)
• Experimental - concerned with causes & effects of an event; tests hypotheses about relationships between health problems & risks
– Quasi-Experimental (non-random)– Cross-over (intervention order random)– Clinical– Hypothesis testing– Randomized Controlled Trial (RCT)
• Blinded & Double Blinded
76

Session 4
Major Observational StudiesCross-sectional (includes cases & non-cases)
Exposure & disease are measured simultaneously Snapshot of health experience for population at a specified
time, but no temporality Example - Behavioral Risk Factor Surveillance System (BRFSS) Strengths
Prevalence of exposure & disease can be estimated for study population
Can be completed quickly Generally used to generate a hypothesis
Limitations Temporality cannot be established Study participants are not randomly allocated to exposure group Does not provide concrete answers; no follow-up 77

Session 4
Major Observational StudiesCase-Control
Starts with disease status Compares frequency of prior exposure to a specific risk factor
between individuals with a specific disease (cases) & those without the same disease (controls)
Assessed retrospectively Strengths
Multiple exposures of a single disease can be studied More cost effective with long induction-latency disease More cost effective with rare “diseases”
Limitations Temporality may be difficult to establish Only prevalence rates can be calculated, not incidence rates Susceptible to bias
78

Session 4
Case-Control
79
Session 4
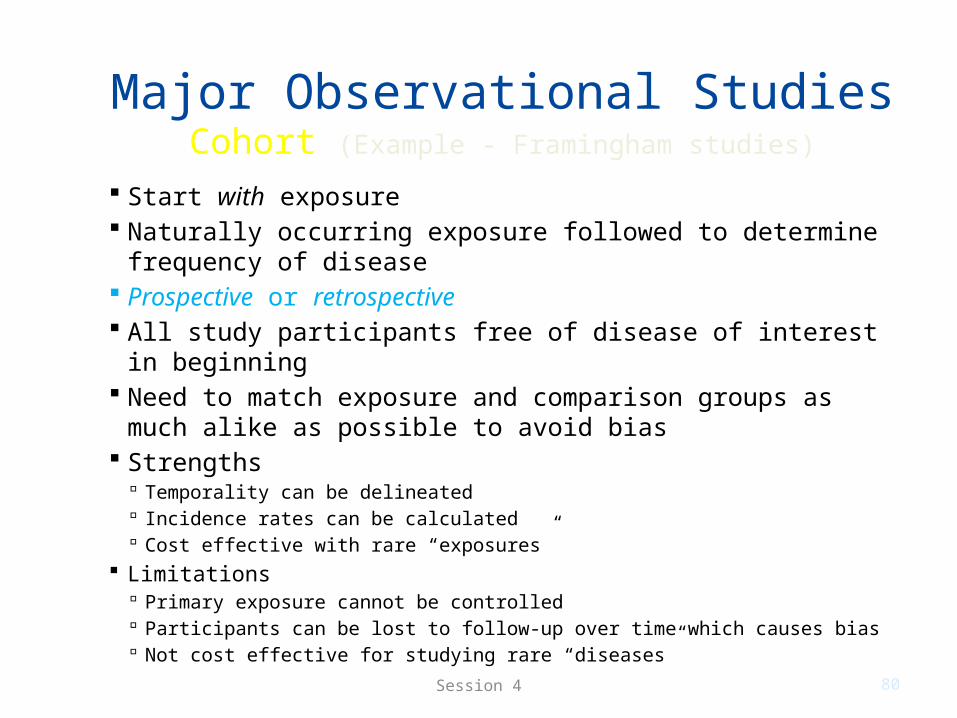
Major Observational StudiesCohort (Example - Framingham studies)
Start with exposure Naturally occurring exposure followed to determine frequency of
disease Prospective or retrospective All study participants free of disease of interest in beginning Need to match exposure and comparison groups as much alike
as possible to avoid bias Strengths
Temporality can be delineated Incidence rates can be calculated Cost effective with rare “exposures”
Limitations Primary exposure cannot be controlled Participants can be lost to follow-up over time which causes bias Not cost effective for studying rare “diseases” 80

Session 4
Cohort study
81
Retrospective looks backward from “future”/current to “present”/past)

Session 4
Major Experimental StudiesRandomized Control Trial (RCT)
Randomly allocates study participants to two or more groups
Considered “gold standard” in research Strengths
Strongest evidence for cause & effect relationship Random assignment eliminate selection & confounding bias
Limitations Requires larger sample sizes to detect statistically significant
differences in outcomes between intervention & control groups Generalizability of results to population my be limited due to
restrictive eligibility criteria Study design may not be appropriate or ethical to test efficacy of
some interventions82

Session 4
EpidemiologyBias, Confounding & Modification
Bias – systematic error in design, conduct or analysis Selection & information/observation Lack of internal validity
Confounding – third variable distorts measure of association Must be associated with exposure in source population, be a risk
factor, not be in causal pathway Try to eliminate
Modification – third variable changes relationship between independent & dependent variables Strata RR differ by level of third variable Try to explain
83

Session 4
Quality Assurance & ControlData collection & processing
• Validity– Accuracy – distinguish between who has a disease and does not– Absence of bias– As related to classification of individuals
• Sensitivity – ability to identify correctly those who do have the disease of interest
• Specificity – ability to identify correctly those who do not have the disease of interest
• Reliability– Precision – extent to which results obtained are replicated if test is
repeated– Reproducibility or repeatability
84

Session 4
Levels of Inference
• First level– Association between exposure & disease only requires accurate
measurements
• Second level– Plus no confounding
• Third level– Plus generalizability
• Fourth level– Plus ability to modify exposure
• Fifth level– Plus large attributable ratio (fraction)
85

Session 5
Community Healthand
Wellness PromotionCH06100
Session 5Biostatistics
June 7, 2011
David Beavers, M.Ed., D.C., M.P.H.

Session 5
The three “S”s (1)
• Survey– Method of monitoring:
• Behaviors associated with a disease, disorder or dysfunction• Attributes that affect disease risk• Knowledge or attitudes that influence health behaviors• Use of health services• Self-reported disease occurrence
– Relatively inexpensive– Provide reliable & reproducible method for getting
information from individuals– Examples – cross-section survey, census, poll
87

Session 5
The three “S”s (2)
• Surveillance– Systematic collection, analysis & dissemination
of disease data– From groups of people– Designed to detect early signs of disease– Cornerstone of preventive health care
• Prevent disease & injury to improve quality of life
– Active & Passive studies– Example – Framingham Heart Cohort Study, Nurses’
Health Study88

Session 5
The three “S”s (3)
• Sampling– Cost & logistics are constraints in collecting
measurements on entire target population– Use smaller segment of population for
extrapolation back to larger target population– Variety of sampling types – Must understand inherent limitations of
sampling when making generalizations to target population
– Therefore, need to use biostatistics89

Session 5
Sampling Error (1)
Two types• Difference between measurement in sample &
target population (target comes from “whole”)
• Main causes of error in sampling– Selection bias
• Using sample population with measurement characteristics not representative of target population
– Random variation• Measurement error attributable simple to chance
90

Session 5
Sampling Error (2)
Methods to reduce• Selection bias can be minimized by using a
randomized selection process– Simple random - each individual is chosen entirely by chance, such
that each individual has the same probability of being chosen
– Stratified random – from each group after homogeneous division
– Clustered random – of groups after homogeneous division
– Systematic random – every 10th, 20th, etc.
• Random variation is a random error (attributed to chance); therefore, not controllable
91

Session 5
Why randomizeIn sample selection
• Ensure sample is representative of overall target population
• Sampling process (not the sample itself) determines randomness
• Helps eliminate bias, thus leaving random variation as the only possible source of error
• Magnitude of that error determined by the size of sample & heterogeneity of population
92

Session 5
BiostatisticsWhat are all these formulas & numbers
• Framework for analysis & interpretation of data• Application of statistic principles to the biologic
sciences• Methodically distinguish between true differences
among observations & random variations caused by chance alone
• Knowledge of biostatistics & epidemiology allows valid conclusions from data sets about associations between risk factors & disease
93

Session 5
Measures of Dispersion (1)
• Describes distribution or “spread” of data• Used in conjunction with measures of central
tendency• Provide a more complete description of data• Four common measures
1. Range2. Interquartile range3. Variance4. Standard deviation
94

Session 5
Measures of Dispersion (2)
Common measures• 1. Range
– Difference between largest & smallest value in data distribution
• 2. Interquartile range– Describes the middle 50% of observations– Data that fall in the 25th to 75th percentiles
95

Session 5
Measures of Dispersion (3)
Common measures• 3. Variance (s2)
– Describes amount of overall variability around the mean (in all directions)
– Measured as the average of the squared distances between each variable & the mean (accounts for negative & positive values)
– Formula
96

Session 5
Measures of Dispersion (4)
Common measures• 4. Standard Deviation (s)
– Calculated as the positive square root of the variance
– Describes variability of data only in one direction– Has same units of measurement as the mean;
therefore, used more frequently than variance to describe the breath of data
– Formula
97

Session 5
Hypothesis TestingOh no not again
• How to perform statistical inference• Allows the drawing of conclusions & make
statements based upon the information obtained from the sample being analyzed
• Assumes mean of sample is same as mean of population from which sample is drawn
• Attempt to prove or disprove above statement– Example: A new intervention (therapy) is superior to the
current standard of care for a specific condition
98

Session 5
Null Hypothesis (H0)
• There is no difference in among groups being compared
• Any observed difference is random variation in data rather than a result of actual disparity
• By convention, assumed that null hypothesis is true at outset of study
• Investigators attempt to refute or reject this with statistical analysis of data gathered
99

Session 5
Alternative hypothesis (HA)
• Opposing option to the null hypothesis
• Contradicts null stating that there is “in fact” a true difference beyond the probable by random chance alone among groups being compared
100

Session 5
Screening vs. Predictive
• Sensitivity & specificity of screening are properties inherent to the test & do not vary with disease prevalence
• Predictive values vary directly with the prevalence of the disease within the tested group
101

Session 5
Statistical testing (1)
• z-Statistic inference procedure– “z” used when normal curve & SD of
population is known• Sample size of 30 or more
• t-Statistic inference procedure– “t” used when SD is unknown as in
health research• Sample size of less than 30
102

Session 5
Statistical testing (2)
• Descriptive statistics– Continuous
• Parametric tests– t-tests, analysis of variance (ANOVA),
Regression
– Categorical/Discrete• Non-Parametric tests
– Chi-square, Fisher’s exact test
103

Session 5
Statistical testing chartIf you want to Use Research Question Examples
Compare individual score to a group mean
z-scores How does my test score compare to class average
Compare mean of single group to a population or hypothesized mean
One sample t-test Is the average height of Logan students 64”
Compare means of 2 related measure on the same group
Paired samples t-test Do brothers & sisters living in same household watch the same hours of TV on average
Compare mean for one measure for 2 independent groups
Independent samples t-test Do men & women have same number of years of education
Compare means of a measure for more than 2 groups
One-way ANOVA Does income vary among those with HS diplomas, college degrees, & graduate degrees
Determine how 2 continuous variables are related
Correlation Coefficient Is years of education related to income
Predict value of one continuous variable from another
Simple linear regression Can income be predicted if years of education is known
Compare proportions for 2 categorical variables
Chi-squared Is proportion of men who have college degrees different from the proportion of women who have college degrees
104

Session 6
Community HealthandWellness PromotionCH06100
Session 6Federalism, Public Good,
Collaboration, Health Care SystemJune 14, 2011
David Beavers, M.Ed., D.C., M.P.H.

Session 6
Government Levelsof Public Health
• Federal– Provide leadership & guidance– Develop national health policies– Establish national standards– Conduct basic research– Offer technical assistance– Provide funding– DHHS, US Public Health Service, CDC, FDA, EPA,
OSHA, etc.
106
Session 6
Government Levelsof Public Health
• State– Primary responsibility is health of the population– Assess health needs on statewide data– Enact necessary state laws– Establish state health priorities & policies– Assure appropriate services are available– Support local service capacity– Common functions
• Vital stats, PH education, environmental sanitation, prevention & control communicable disease, etc.
107

Session 6
Government Levelsof Public Health
• Local – Assess & monitor local health issues & solutions– Provide leadership for local involvement– Assure access to quality services within context of
community• Can be county or city level• Sometimes a special district
– Independent tax base– Own elected Board of Trustees
108

Session 6 109
Public Sector Funding
• Federal Funding Source– Federal income tax
• State Funding Source– Sales tax & income tax
• Local Funding Source– Property tax

Session 6
Public Good
• Public health has characteristics of public, social & collective goods
• Free market place will not voluntary provide all necessary public health services
• Some public health interventions are required to address “bystander” well-being
• Collective action by government is required to assure the availability of such goods & services
110

Session 6
Health Care System Overview 3
• U.S. Health Care System Structure– No central governing agency– Focuses on acute care– Technology driven– Involves multiple players– Based on Market Justice NOT on Social Justice– Imperfect market condition– Driven by profit motive– Government serves as subsidiary to the private sector
111

Session 6
School Health Program
• Coordinated School Health Program (CSHP)
– Vast potential to affect health of school children, their families & community
• Organized set of policies, procedures & activities designed to:– Protect, promote & improve health & well-being
• Includes:– Health education & Health services– Counseling with psychological & social services– Physical education & Nutritional services
112

Session 6
Health Literacy
• The degree to which individuals have the capacity to obtain, process & understand basic health information and services needed to make appropriate health decisions (Healthy People 2010)
• Health literacy includes the ability to understand:– Instructions on prescription drug bottles & appointment slips– Medical education brochures, doctor’s directions & consent forms– Ability to negotiate the health care systems
113

Session 7
Community HealthandWellness PromotionCH06100
Session 7Public Health Organizations: Global to Local
June 21, 2011
David Beavers, M.Ed., D.C., M.P.H.

Session 7
Public Health Organizations:Global to Local
• Governmental– International to Local
• Quasi-Governmental– American Red Cross to National Science
Foundation
• Non-Governmental– Voluntary to Corporate
115

Session 7
Public Health Organizations:Governmental – WHO guided by 2 documents
Millennium Summit (2003) - 6 health goals1. Eradicate extreme poverty & hunger2. Reduce child mortality3. Improve maternal health4. Combat HIV/AIDS, Malaria & other diseases such
as TB5. Ensure environmental sustainability6. Develop a global partnership for development,
especially for essential drugs
116
Session 7
Public Health Organizations:Governmental – WHO guided by 2 documents
11th General Programme of Work - 5 areas for work priorities (2006 – 2015)1. Provide support to countries in moving to universal coverage
with effective PH interventions2. Strengthening global health security3. Generating & sustaining action across sectors to modify
behavioral, social, economic & environmental determinants of health
4. Increasing institutional capacities to deliver core public health functions under the strengthened governance of ministries of health
5. Strengthening WHO’s leadership at global & regional levels & by supporting work of governments at country level
117

Session 7
Public Health Organizations:Governmental
• National Agencies– Each national government has agency with
primary responsibility for protection of health & welfare of its citizens
– In US the primary agency is Department of Health & Human Services (HHS)
• Has 11 divisions & 10 regional offices– AHRQ, CDC, FDA, IHS, NIH, SAMHSA, etc.
– Other agencies include WIC, EPA, OSHA– Public Health Service (PHS)
118

Session 7
Public Health Organizations:Governmental
• US Department of Health & Human Services– Primary national health agency for US– Protects the health of all Americans– Provides essential human services,
especially for those who are least able to help themselves
119

Session 7
Public Health Organizations:Governmental
Concepts flow from top downDevelop guidelinesIOM through state to local agencies
Three Core Functions of US Public Health agencies1. Assessment2. Policy Development3. Assurance
120

Public Health 10 Essential ServicesBasis for Public Health Practice
• Link to the 3 core functions
• Sets a continuous processes
• Manages at a systems level
• Enhances through active research
• Provides an organizing framework for individual & collective practice
Session 7

Session 7
Public Health Organizations:Governmental
• State Agencies– All 50 states have public health agency– Guided by the 3 Core Functions– Direct the 10 Essential Services– Overall purpose
• Next slide
122

Session 7
Public Health Organizations:Governmental
Overall purpose of state agenciesPromote, protect and maintain the health & welfare of
their citizensRepresented in 3 core functions & the 10 essential servicesSets health prioritiesPromulgate health regulationsLaboratory services & technical supportEnvironmental health (generally crosses boundaries)Link between federal & local agencies
○ For expertise○ For funding
123

Session 7
Public Health Organizations:Governmental
Local Agencies - continued
Through LHDs public health services are provided to community
Major actors for 3 core functionsMajor provider of 10 essential servicesMandated services include
○ Inspection of food services○ Detect & report required diseases○ Collection of vital records○ Health education & promotion○ Some provide clinical services
124

Session 7
Public Health Organizations:Quasi-Governmental
Some responsibilities assigned by government Function under a charter or contract Funded by combination of
Tax dollarsGrantsPrivate sources
Operate relatively independent of government supervision
125
Session 7
Public Health Organizations:Quasi-Governmental
Best known at international levelInternational Red Cross
In various parts of world as known asRed CrescentRed Crystal
On US national level: American Red CrossWar & disaster reliefBlood drivesCPR classes
Others on US national levelNational Science FoundationNational Academy of Sciences (chartered 1863)
126
Session 7
Public Health OrganizationsNon-Governmental
Four basic objectives of voluntary agencies1. Raise money to fund their programs, with majority
going to research2. Provide education both to professionals & to the
public3. Provide service to those individuals & families that
are afflicted with a disease or health problem4. Advocate for beneficial policies, laws & regulations
that affect the work of the agency and in turn the people they are trying to help
127

Session 7
Health CommunicationStrategies
• Identify the health problem & determine whether communication should be part of the intervention
• Identify the audience for the program & determine the best ways to reach audience– Culturally & Linguistically Competent
• Develop & test communication concepts, messages & materials with representatives of the target (sample) audience
128

Session 7
Media Literacy
• Teaches target audience (often youth) to analyze media messages to identify the sponsors motives
• Teaches communicators how to create messages geared to the intended audience’s point of view
129

Session 7
Food Labeling
• Guidance & Regulatory control by U.S. Food & Drug Administration (FDA)
• FDA responsible for assuring that food sold in the U.S. are safe, wholesome & properly labeled
• Applies to all foods sold in U.S.– Produced domestically– Produced in foreign countries & imported
130

Session 7
Food Labeling
• Defines certain food stuffs– Juices vs. cocktails
• Net quantity of contents• Ingredients list
– Colors & Allergens• Nutrition labeling
– General & nutrient declaration– Separately packaged & assortments
131

Session 7
Claims on Label• Nutrient content claims
– Free• Zero, no, without, trivial source
– Low• Little, small amount, low source of
– Reduced/less• Lower, fewer, modified; 100 gram basis
– Comments• Free, very low, low must indicate if food meets
definition without benefit of special processing
132

Session 7
Structure & Function Claims
• Names such as "CarpalHealth" or "CircuCure" are disease claims because these are implied disease claims for carpal tunnel syndrome and circulatory disorders, respectively; context very important
• Example: "Soothing Sleep" could be considered a claim to treat insomnia, a disease, unless other context in the labeling makes clear that the claim relates to a non-disease condition, such as occasional sleeplessness
133


