SIP – Chapter 4 1 Community Services Sector CHAPTER 4 Community Infrastructure and Housing Introduction In a cover story on economic growth, the Financial Mail of 29 September 2005 spelt out various steps that need to be taken to put the economy onto a 6% growth path. The major issues pertinent to this report are: increased government spending; tackling government's lack of capacity; and cutting red tape. This section attempts to deal with these three issues in six areas of strategic importance, namely: town infrastructure; the construction sector; expanded public works programme; asset management; water Services; and housing. Town infrastructure Background Any analysis of town infrastructure in South Africa must be closely linked to the institutional policy framework of integrated development plans (IDPs) and the National Spatial Development Perspective (NSDP). In documents setting out these approaches municipal infrastructure is contextualised within a developmental framework of economic growth and human needs. Also important is the recent study on the “Growth potential of towns in the Western Cape” (Van der Merwe et al, 2005) in which the infrastructural component is placed within a multi-dimensional set of development indicators and associated town profiles. Outside of the Cape Metropolitan area, the Western Cape has many rural towns, some of which have a solid social and economic basis and are growing energetically, while others are relatively stagnant or are steadily losing economic power, service ability and infrastructure. The aim of this sub-section is to investigate the urban infrastructural profiles of the province’s 131 rural towns in relation to the development potential and human needs of these settlements. Based on this empirical diagnosis specific policy recommendations and strategic adjustments in infrastructural position are presented. Town development needs to be an integrated and sustained growth process, which embraces a positive change in all urban components – economic, social, environmental and infrastructural – thereby enhancing the quality of life for all its inhabitants. The NSDP document described the current situation as follows: In non-metropolitan areas a distinction can be drawn between a relatively small number of localities (towns) that have the economic potential to restructure, and a significantly large number that are ultimately likely to decline, since they seem to possess limited resources to generate sustainable economic activity.
Transcript
SIP – Chapter 4 1 Community Services Sector
CHAPTER 4 Community Infrastructure and Housing Introduction In a cover story on economic growth, the Financial Mail of 29 September 2005 spelt out various steps that need to be taken to put the economy onto a 6% growth path. The major issues pertinent to this report are: increased government spending; tackling government's lack of capacity; and cutting red tape.
This section attempts to deal with these three issues in six areas of strategic importance, namely: town infrastructure; the construction sector; expanded public works programme; asset management; water Services; and housing.
Town infrastructure Background Any analysis of town infrastructure in South Africa must be closely linked to the institutional policy framework of integrated development plans (IDPs) and the National Spatial Development Perspective (NSDP). In documents setting out these approaches municipal infrastructure is contextualised within a developmental framework of economic growth and human needs. Also important is the recent study on the “Growth potential of towns in the Western Cape” (Van der Merwe et al, 2005) in which the infrastructural component is placed within a multi-dimensional set of development indicators and associated town profiles. Outside of the Cape Metropolitan area, the Western Cape has many rural towns, some of which have a solid social and economic basis and are growing energetically, while others are relatively stagnant or are steadily losing economic power, service ability and infrastructure. The aim of this sub-section is to investigate the urban infrastructural profiles of the province’s 131 rural towns in relation to the development potential and human needs of these settlements. Based on this empirical diagnosis specific policy recommendations and strategic adjustments in infrastructural position are presented. Town development needs to be an integrated and sustained growth process, which embraces a positive change in all urban components – economic, social, environmental and infrastructural – thereby enhancing the quality of life for all its inhabitants. The NSDP document described the current situation as follows:
In non-metropolitan areas a distinction can be drawn between a relatively small number of localities (towns) that have the economic potential to restructure, and a significantly large number that are ultimately likely to decline, since they seem to possess limited resources to generate sustainable economic activity.
SIP – Chapter 4 2 Community Services Sector
The approach of the NSDP seeks to focus the bulk of fixed investment by government on those areas with the potential for sustainable economic development. In areas of limited potential, it is recommended that beyond a level of basic services to which all citizens are entitled, government should concentrate primarily on social investment, such as human-resource development, labour-market intelligence and social transfers. Potential in this context is not a product of size, but rather an indication of growth vitality and energy – regardless of whether the town is big or small. Developmental and infrastructural strategies at local level are for the most part embedded in their IDPs, which are drawn up in terms of the Municipal Systems Act (no 32 of 2000). The IDP is the institutional process and strategic planning instrument which guides all decisions with regard to planning, infrastructural management and development actions in a municipal area. The process is meant to ensure that all planning in the municipality is developmentally geared towards fulfilling the objectives and duties of the national Constitution, e.g. the right to a safe and healthy environment; protection of property; housing; health care; education; food; water and social security. All of these objectives and duties embrace infrastructural elements. City populations, their economic activities and the social services they access, need to be organised effectively in urban space in order to give rise to an optimal urban form. A town where the built environment overburdens the capacity of the available resources in terms of space, clean air, water, and heritage will not succeed as a ‘sustainable developing settlement’. Apartheid policies resulted in a historical legacy which left South African urban centres with inequalities and an urban form that is not resource- and infrastructurally efficient. The country’s low-density cities and towns have a high impact on available land relative to their population size. Urbanization will place further pressure on available water resources in the next two decades. The sewerage networks of many towns are already running at near full capacity, and infrastructure laid down in previous decades is reaching the end of its working life. The transport routes of South African settlements are increasingly congested. The technological revolution necessitates bold adjustments in the areas of provision and maintenance of civil engineering infrastructure. In addition, the ecological impact of the built environment is an increasing concern for the provision of municipal infrastructural services. Measuring infrastructure provision The research methodology for this infrastructural investigation was organised within an interdisciplinary context, of which the core consisted of urban-geographical concepts and methods. A variety of research tools was used in order to enhance the accuracy and depth of the study. The methodological procedures included a literature review, statistical data analysis, quantitative GIS techniques, and participatory survey methods. Initially, a set of 82 variables was identified for which information could be obtained for each of the 131 selected towns in the Western Cape. Because towns differ so much within a municipal region, towns rather than municipalities were used as spatial units of analysis. Ten groups of indices were quantitatively combined to produce three composite indices in line with the NSDP guidelines. These composite indices aggregate the major urban developmental dimensions to enable the classification of the towns into appropriate typologies. The three indices are: Infrastructure (16 indicators): Transportation and communication + institutional
services;
SIP – Chapter 4 3 Community Services Sector
Resources (14 indicators): Natural resources + human resources + human resources change;
At a higher level of aggregation, all 64 growth indicators were combined to create a single grand index of urban development potential. This was completed with a second major index of basic human needs extracted from 18 indicators which focused on the presence of vulnerability and poverty in the local communities. The municipality infrastructural component is the central theme of this sub-section. In the original study (Van der Merwe et al, 2005) the 16 infrastructural indicators were subdivided into the following two sub-components: Transportation and communication infrastructure was measured by seven variables,
which assessed the availability/presence and accessibility/distance to national or main roads, airports and commercial harbours, as well as access to cell phone coverage. This does not include the town’s internal transportation structure.
Institutional service infrastructure was measured by nine variables, emphasising types, strength and capacity of public service delivery to the communities. These indicators measure the presence of municipal or other governmental offices, value of the property tax base, municipal water usage, as well as the provision of a variety of institutional services such as tertiary education facilities, postal and police services, libraries and magistrate courts.
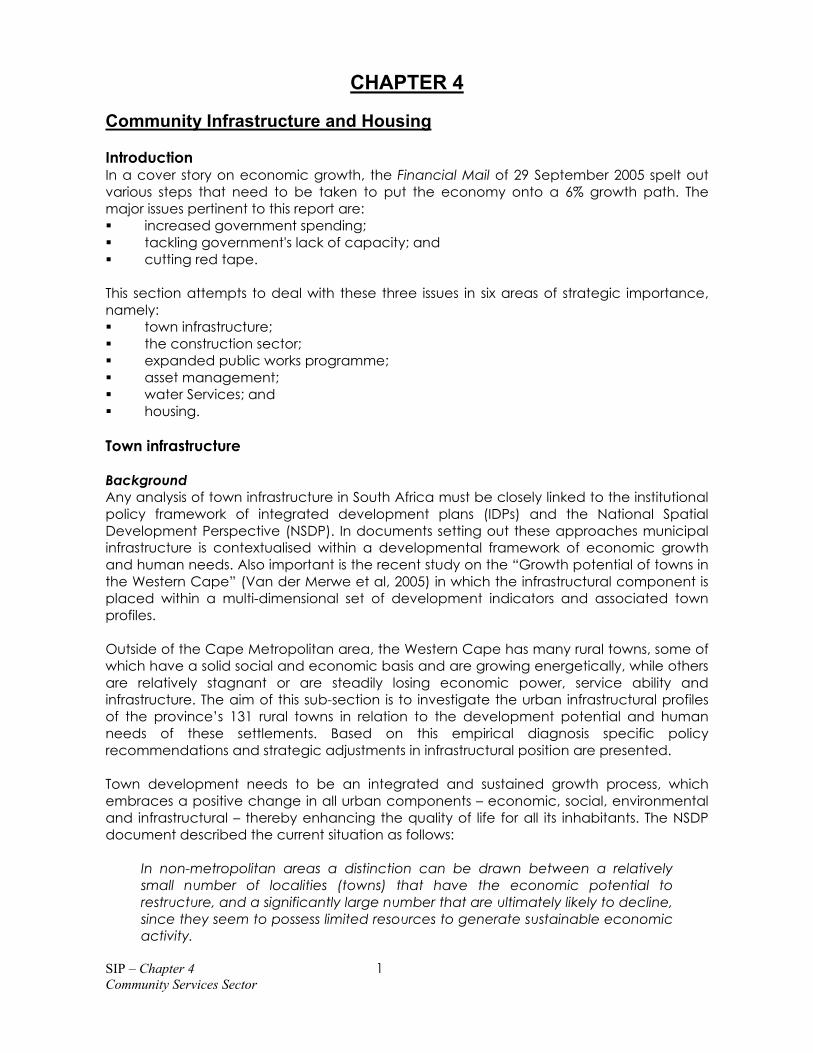
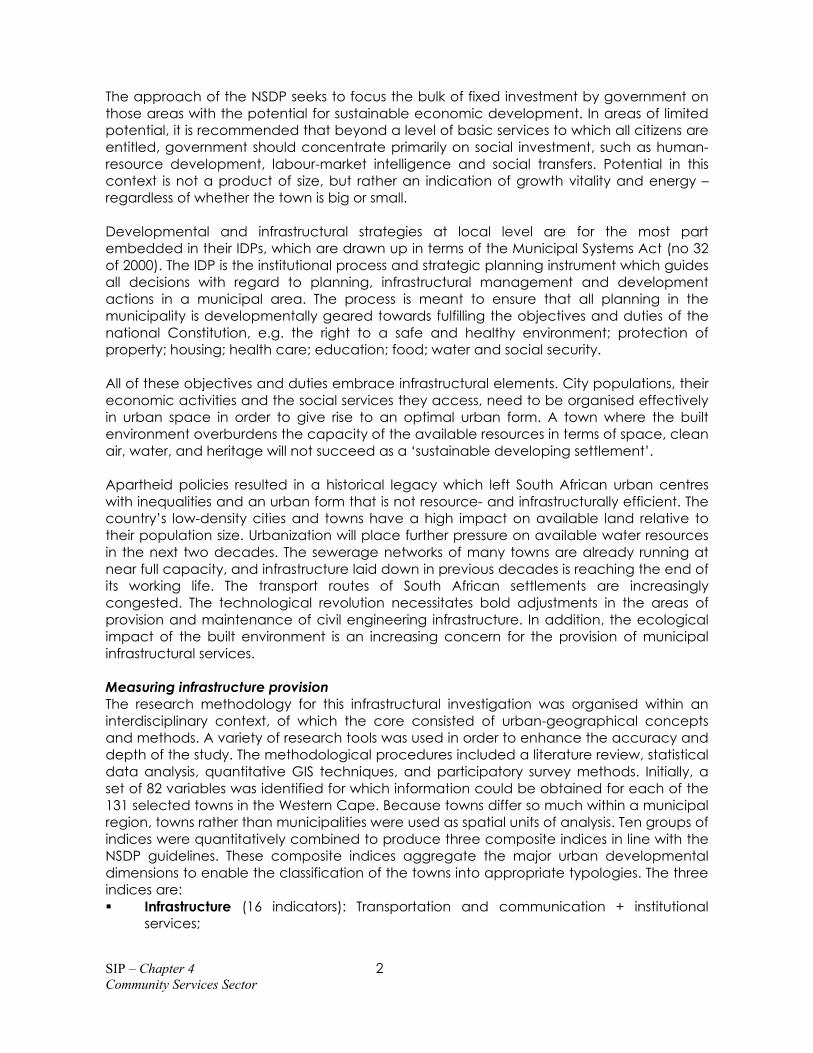
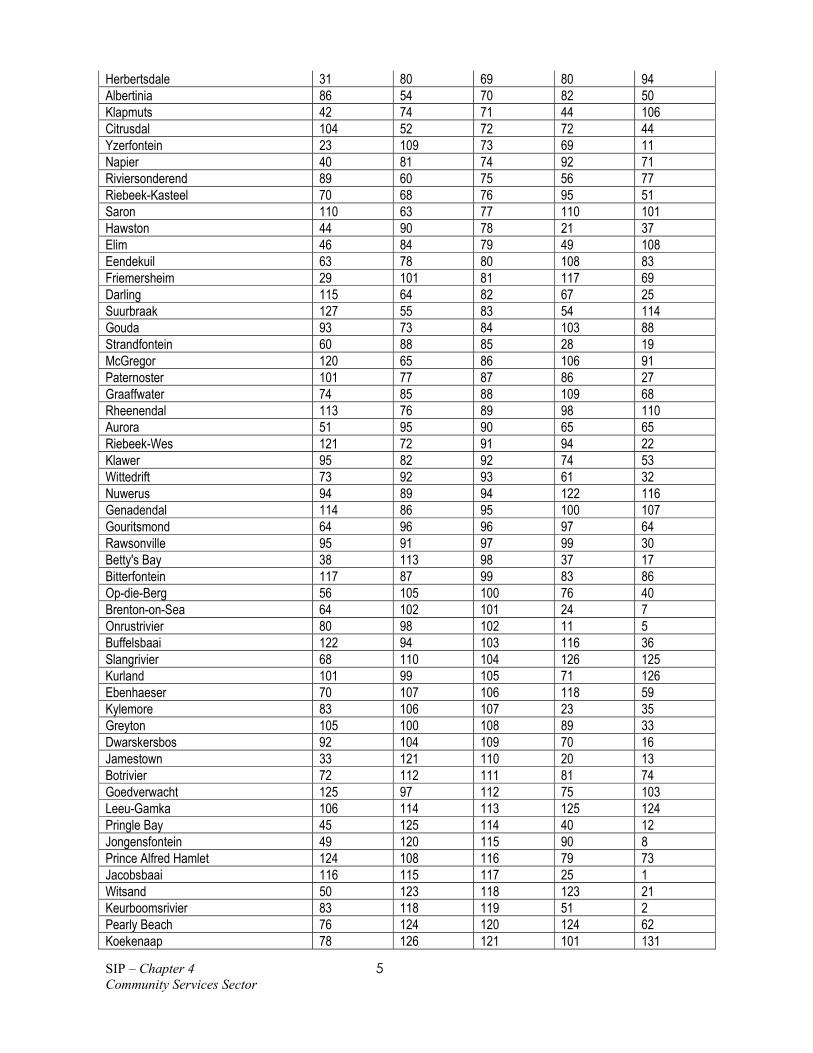
Table 1 lists Western Cape towns according to their respective infrastructure provision indices, as well as their corresponding development potential and human needs levels. Towns are ranked and listed from high to low according to their composite Infrastructural indices. Table 1 Ranking of towns on composite infrastructure
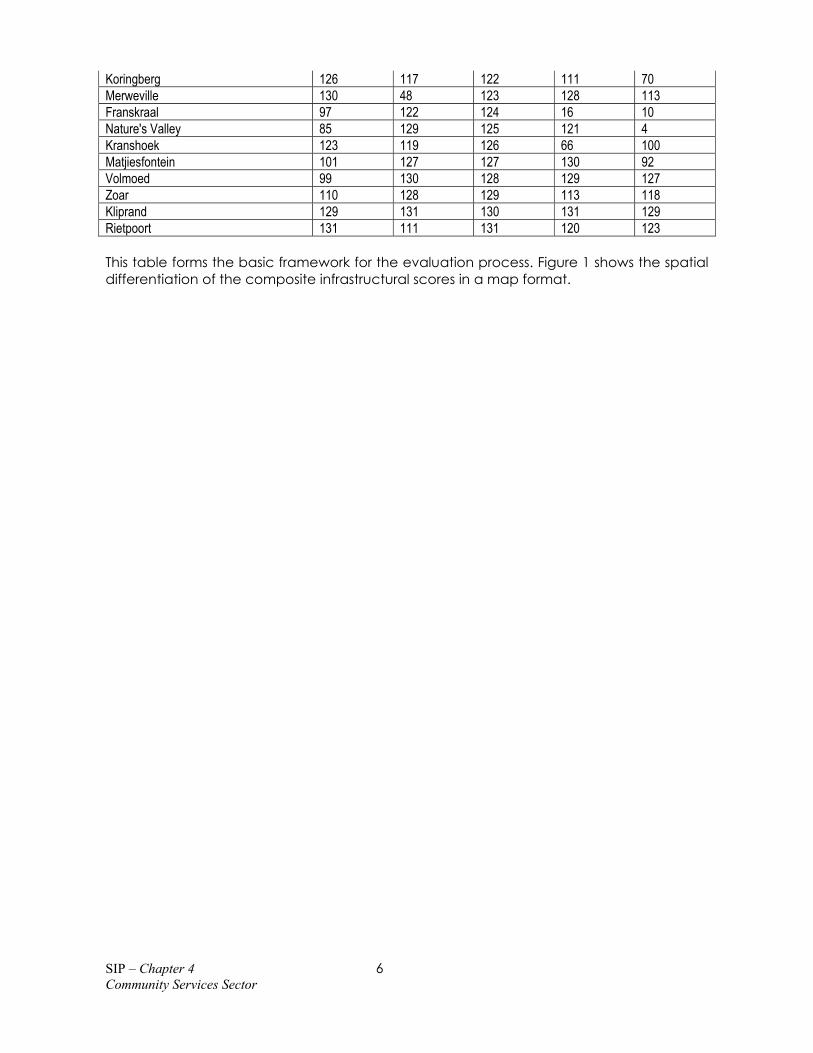
Koringberg 126 117 122 111 70 Merweville 130 48 123 128 113 Franskraal 97 122 124 16 10 Nature's Valley 85 129 125 121 4 Kranshoek 123 119 126 66 100 Matjiesfontein 101 127 127 130 92 Volmoed 99 130 128 129 127 Zoar 110 128 129 113 118 Kliprand 129 131 130 131 129 Rietpoort 131 111 131 120 123 This table forms the basic framework for the evaluation process. Figure 1 shows the spatial differentiation of the composite infrastructural scores in a map format.
#S
# S
#S
#S
# S
#S
#S
#S
#S
#S
# S
#S#S
# S
#S#S
#S
# S
#S#S
#S
#S
#S
#S
#S
#S
#S
#S
# S
#S
#S
# S
#S#S
#S
#S
#S
#S
# S#S
# S
#S
# S
#S
#S#S
#S
# S
#S#S
#S
# S
#S#S
#S
#S
#S
#S
#S
#S
#S
#S#S
# S
#S
#S
# S
#S
# S
#S
#S
#S
#S
#S
# S
#S
#S
#S
#S
#S
#S
#S
#S
#S
#S
#S
# S
# S#S# S
# S#S
#S
#S
#S
#S
#S#S
#S
# S#S# S
#S#S
# S#S
# S
# S
#S#S
#S
# S
#S# S
#S#S
# S
# S
# S
#S
#S
#S
# S
#S# S
#S
#S
# S
#S
#S#S
CAP
E T
OW
N
ME
TRO
Gro
ot B
rakr
ivie
r
Fran
skra
al
Rieb
eek-
Kas
teel
Plet
tenb
ergb
aai
Keur
boom
sriv
ier
Natu
res
Valle
y
Stra
ndfo
ntei
n
St H
elen
a Ba
y
Stel
lenb
osch
Moo
rrees
burg
Wem
mer
shoe
k
Pate
rnos
ter
Onr
usriv
ier
Hero
lds
Bay
Buffe
lsba
ai
Wild
erne
ss
Vred
enbu
rg
Oud
tsho
orn
Jaco
bsba
ai
Vred
enda
l
Klei
nmon
d
Sald
anha
Knys
na
Prin
ce A
lfred
Ham
let
Jong
ensf
onte
in
Rivi
erso
nder
end
Mat
jiesf
onte
in
Kurla
nd E
stat
e
Bren
ton-
on-S
ea
Prin
ce A
lber
t
Bitte
rfont
ein
Villie
rsdo
rp
Vanr
hyns
dorp
Rede
lingh
uys
Pear
ly B
each
Lam
berts
Bay
Herb
erts
dale
Goe
dver
wac
ht
Frie
mer
shei
m
Dwar
sker
sbos
Beau
fort-
Wes
Yzer
font
ein
Touw
srivi
er
Slan
grivi
er
Rieb
eek-
Wes
Raws
onvi
lle
Prin
gle
BayPo
rterv
ille
Op-
die-
Berg
Mur
rays
burg
Kalb
askr
aal
Gra
affw
ater
Gou
ritsm
ond
Fran
schh
oek
Dyss
elsd
orp
Clan
willi
am
Betty
's B
ay
Witt
edrif
t
Wel
lingt
on
Swel
lend
am
Stru
isba
ai
Sedg
efie
ldRi
vers
dale
Rhee
nend
al
Mos
selb
aai
Mer
wev
ille
Mal
mes
bury
Leeu
Gam
ka
Lain
gsbu
rgKo
ringb
erg
Heid
elbe
rg
Gen
aden
dal
Elan
dsba
ai
Eben
haes
ar
Dorin
gbaa
i
Calit
zdor
p
Bred
asdo
rp
Bonn
ieva
le
Albe
rtini
a
Wor
cest
er
Veld
drift
Unio
ndal
e
Suur
braa
k
Robe
rtson
Riet
poor
t
Pike
tber
g
Lutz
ville
Lang
ebaa
n
Ladi
smith
Kran
shoe
k
Koek
enaa
p
Jam
esto
wn
Hope
field
Eend
ekui
l
De D
oorn
s
Citru
sdal
Botri
vier
Barr
ydal
e
Wol
sele
y
Stilb
aai
Stan
ford
McG
rego
rKy
lem
ore
Klip
rand
Klap
mut
s
Herm
anus
Gan
sbaa
iAr
nist
on
Wits
and
Volm
oed
Tulb
agh
Nuwe
rus
Mon
tagu
Haws
ton
Haar
lem
Gre
yton
Gra
bouw
De R
ust
Darli
ng
Cale
don
Napi
er
Klaw
er
Geo
rge
Auro
ra
Asht
on
Saro
n
Pnie
l
Paar
l
Gou
daCe
res
Zoar
Elim50
050
Kilo
met
ers
SN
EW
#SVe
ry L
ow#S
Low
#SM
ediu
m
#SH
igh
#SVe
ry H
igh
Fi
gure
1: W
este
rn C
ape
tow
ns: C
ompo
site
infr
astru
ctur
e in
dex
SIP – Chapter 4 7 Community Services Sector
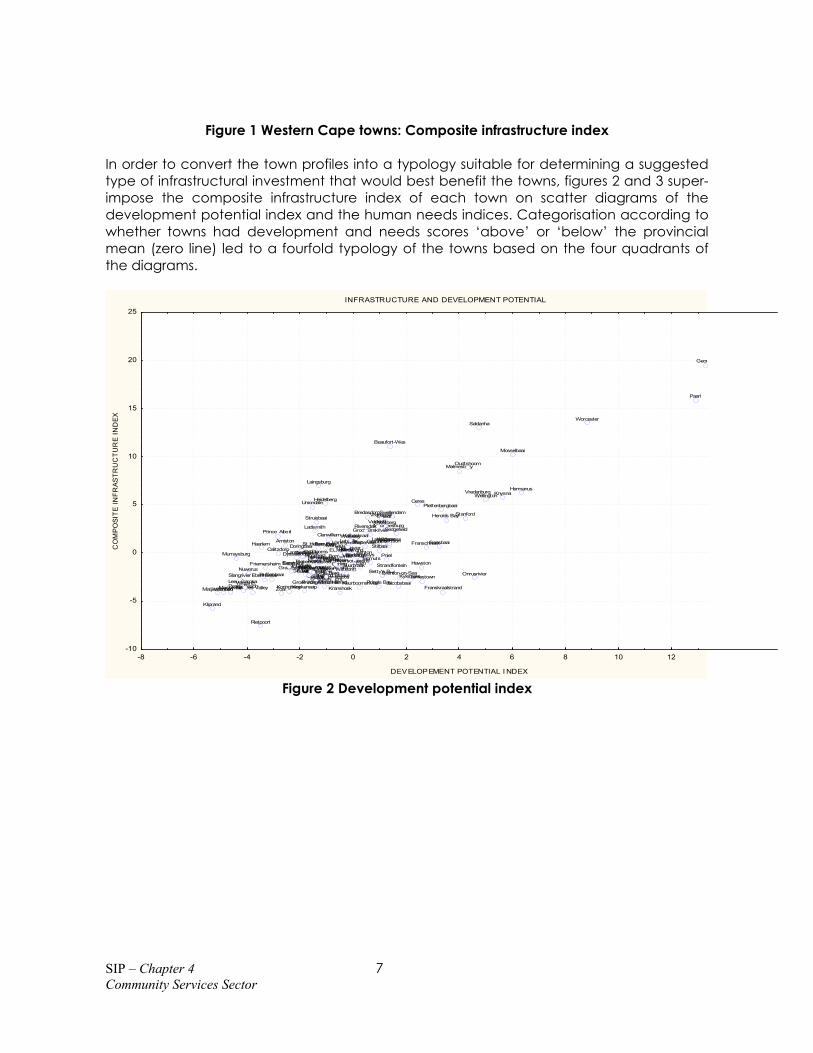
Figure 1 Western Cape towns: Composite infrastructure index In order to convert the town profiles into a typology suitable for determining a suggested type of infrastructural investment that would best benefit the towns, figures 2 and 3 super-impose the composite infrastructure index of each town on scatter diagrams of the development potential index and the human needs indices. Categorisation according to whether towns had development and needs scores ‘above’ or ‘below’ the provincial mean (zero line) led to a fourfold typology of the towns based on the four quadrants of the diagrams.
INFRASTRUCTURE AND DEVELOPMENT POTENTIAL
Albertinia
Arniston
Ashton
Aurora
Barrydale
Beaufort-Wes
Betty's BayBitterfontein
Bonnievale
Botrivier
Bredasdorp
Brenton-on-SeaBuffelsbaai
Caledon
Calitzdorp
Ceres
Citrusdal
Clanwilliam
Darling
De DoornsDe RustDoringbaai
Dwarskersbos
Dysselsdorp
Ebenhaesar
Eendekuil
Elandsbaai
Elim
Franschhoek
Franskraalstrand
Friemersheim
Gansbaai
Genadendal
Georg
Goedverwacht
GoudaGouritsmond
Graaffwater
Grabouw
Greyton
Groot Brakrivier
Groot-Jongensfontein
Haarlem
Hawston
Heidelberg
Herbertsdale
Hermanus
Herolds Bay
Hopefield
JacobsbaaiJamestown
Kalbaskraal
Keurboomsrivier
Klapmuts
Klawer
Kleinmond
Kliprand
Knysna
KoekenaapKoringberg Kranshoek
Kurland Estate Kylemore
Ladismith
Laingsburg
Lamberts Bay
Langebaan
Leeu Gamka
Lutzville
Malmesbury
Matjiesfontein
McGregor
Merweville
Montagu
Moorreesburg
Mosselbaai
MurraysburgNapier
Natures Valley
NuwerusOnrusrivierOp-die-Berg
Oudtshoorn
Paarl
Paternoster
Pearly Beach
Piketberg
Plettenbergbaai
Pniel
Porterville
Prince Albert
Prince Alfred Hamlet Pringle Bay
Rawsonville
Redelinghuys
RheenendalRiebeek-KasteelRiebeek-Wes
Rietpoort
Riversdale
Riviersonderend
Robertson
Saldanha
Saron
Sedgefield
Slangrivier
St Helena Bay
Stanford
Stilbaai
Strandfontein
Struisbaai
Suurbraak
Swellendam
TouwsrivierTulbagh
Uniondale
Vanrhynsdorp
Velddrift
Villiersdorp
Volmoed
Vredenburg
Vredendal
Wellington
Wilderness
Witsand
Wittedrift
Wolseley
Worcester
Yzerfontein
Zoar
-8 -6 -4 -2 0 2 4 6 8 10 12
DEVELOPEMENT POTENTIAL I NDEX
-10
-5
0
5
10
15
20
25
CO
MP
OSI
TE
INF
RAS
TR
UC
TUR
E IN
DEX
Figure 2 Development potential index
SIP – Chapter 4 8 Community Services Sector
INFRASTRUCTURE AND NEEDS
Albertinia
Arniston
Ashton
Aurora
Barrydale
Beaufort-Wes
Betty's Bay Bitterfontein
Bonnievale
Botrivier
Bredasdorp
Brenton-on-Sea Buffelsbaai
Caledon
Calitzdorp
Ceres
Citrusdal
Clanwilliam
Darling
De DoornsDe RustDoringbaai
Dwarskersbos
Dysselsdorp
Ebenhaesar
Eendekuil
Elandsbaai
Elim
Franschhoek
Franskraalstrand
Friemersheim
Gansbaai
Genadendal
George
Goedverwacht
GoudaGouritsmondGraaffwater
Grabouw
Greyton
Groot Brakrivier
Groot-Jongensfontein
Haarlem
Hawston
Heidelberg
Herbertsdale
Hermanus
Herolds Bay
Hopefield
JacobsbaaiJamestown
Kalbaskraal
Keurboomsrivier
Klapmuts
Klawer
Kleinmond
Kliprand
Knysna
KoKoringberg Kranshoek
Kurland EstateKylemore
Ladismith
Laingsburg
Lamberts Bay
Langebaan
Leeu Gamka
Lutzville
Malmesbury
Matjiesfontein
McGregor
Merweville
Montagu
Moorreesburg
Mosselbaai
MurraysburgNapier
Natures Valley
NuwerusOnrusrivier Op-die-Berg
Oudtshoorn
Paarl
Paternoster
Pearly Beach
Piketberg
Plettenbergbaai
Pniel
Porterville
Prince Albert
Prince Alfred HamletPringle Bay
Rawsonville
Redelinghuys
RheenendalRiebeek-Kasteel
Riebeek-Wes
Rietpoort
Riversdale
Riviersonderend
Robertson
Saldanha
Saron
Sedgefield
Slangrivier
St Helena Bay
Stanford
Stellenbosch
Stilbaai
Strandfontein
Struisbaai
Suurbraak
Swellendam
TouwsrivierTulbagh
Uniondale
Vanrhynsdorp
Velddrif t
Villiersdorp
Volmoed
Vredenburg
Vredendal
Wellington
Wilderness
Witsand
Wittedrift
Wolseley
Worcester
Yzerfontein
Zoar
-14 -12 -10 -8 -6 -4 -2 0 2 4 6 8
DEVELOPMENT NEED INDEX
-10
-5
0
5
10
15
20
25
CO
MP
OSI
TE
INFR
AST
RU
CT
UR
E IN
DEX
Figure 3 Development need index
Table 2 and Table 3 list the four groups of towns as clustered in the scatter diagrams. Using this NSDP-based categorisation as point of departure, fixed infrastructural investment can be directed to the towns with higher infrastructural potential when this is linked with a high development potential and high human needs levels. Table 2 Towns grouped by infrastructure and development potential classes Infra Low / Dev Low Infra Low / Dev High Infra High / Dev Low Infra High / Dev High Albertinia Ashton Arniston Beaufort-Wes Aurora Betty's Bay Barrydale Bredasdorp Bitterfontein Brenton-on-Sea Calitzdorp Caledon Bonnievale Elim Clanwilliam Ceres Botrivier Franskraalstrand Doringbaai Franschhoek Buffelsbaai Hawston Haarlem Gansbaai Citrusdal Jacobsbaai Heidelberg George Darling Jamestown Ladismith Grabouw De Doorns Keurboomsrivier Laingsburg Groot Brakrivier De Rust Klapmuts Lutzville Hermanus Dwarskersbos Kylemore Montagu Herolds Bay Dysselsdorp Onrusrivier Prince Albert Kalbaskraal Ebenhaesar Pniel St Helena Bay Knysna Eendekuil Pringle Bay Struisbaai Langebaan Elandsbaai Redelinghuys Touwsrivier Malmesbury Friemersheim Strandfontein Tulbagh Moorreesburg Genadendal Villiersdorp Uniondale Mosselbaai Goedverwacht Vanrhynsdorp Oudtshoorn Gouda Wolseley Paarl Gouritsmond Piketberg
SIP – Chapter 4 9 Community Services Sector
Graaffwater Plettenbergbaai Greyton Porterville Groot-Jongensfontein Riversdale Herbertsdale Robertson Hopefield Saldanha Klawer Sedgefield Kleinmond Stanford Kliprand Stellenbosch Koekenaap Stilbaai Koringberg Swellendam Kranshoek Velddrift Kurland Estate Vredenburg Lamberts Bay Vredendal Leeu Gamka Wellington Matjiesfontein Wilderness McGregor Worcester Merweville Murraysburg Napier Natures Valley Nuwerus Op-die-Berg Paternoster Pearly Beach Prince Alfred Hamlet Rawsonville Rheenendal Riebeek-Kasteel Riebeek-Wes Rietpoort Riviersonderend Saron Slangrivier Suurbraak Volmoed Witsand Wittedrift Yzerfontein Zoar Table 3 Towns grouped by infrastructure and development need classes Infra Low / Need Low Infra Low / Need High Infra High / Need Low Infra High / Need High Albertinia Ashton Arniston Beaufort-Wes Aurora Bitterfontein Barrydale Calitzdorp Betty's Bay Botrivier Bredasdorp Ceres Bonnievale De Doorns Caledon Clanwilliam Brenton-on-Sea De Rust Groot Brakrivier Doringbaai Buffelsbaai Dysselsdorp Herolds Bay Franschhoek Citrusdal Eendekuil Ladismith Gansbaai Darling Elandsbaai Langebaan George Dwarskersbos Elim Lutzville Grabouw Ebenhaesar Friemersheim Malmesbury Haarlem Franskraalstrand Genadendal Montagu Heidelberg
SIP – Chapter 4 10 Community Services Sector
Gouritsmond Goedverwacht Moorreesburg Hermanus Greyton Gouda Mosselbaai Kalbaskraal Groot-Jongensfontein Graaffwater Piketberg Knysna Hawston Herbertsdale Porterville Laingsburg Hopefield Klapmuts Riversdale Oudtshoorn Jacobsbaai Kliprand Saldanha Paarl Jamestown Koekenaap Sedgefield Plettenbergbaai Keurboomsrivier Koringberg St Helena Bay Prince Albert Klawer Kranshoek Stanford Robertson Kleinmond Kurland Estate Stellenbosch Touwsrivier Kylemore Leeu Gamka Stilbaai Tulbagh Lamberts Bay Matjiesfontein Struisbaai Uniondale Natures Valley McGregor Swellendam Wolseley Onrusrivier Merweville Vanrhynsdorp Worcester Op-die-Berg Murraysburg Velddrift Paternoster Napier Vredenburg Pearly Beach Nuwerus Vredendal Pniel Prince Alfred Hamlet Wellington Pringle Bay Redelinghuys Wilderness Rawsonville Rheenendal Riebeek-Kasteel Rietpoort Riebeek-Wes Riviersonderend Strandfontein Saron Witsand Slangrivier Wittedrift Suurbraak Yzerfontein Villiersdorp Volmoed Zoar Research results and observations The relatively strong development drive of the Boland and Overberg district municipalities compared to the Central Karoo and the West Coast emerges unambiguously. Meanwhile Boland and the Central Karoo regions experience the greatest needs levels compared with the relatively better off Overberg and the West Coast. Naturally there are many exceptions to this broad generalisation and these are highlighted in the tables and figures. Development potential: Table 1 shows that towns with higher potential are more
prevalent near the Cape metropole and along the West Coast and South Coast. The interior of the province is not well endowed with high-potential towns, except for a few medium-rated settlements at strategic locations. Low development potential is mainly concentrated in the Karoo, (including Little Karoo), the West Coast interior and former mission stations.
Human needs: Table 1 records the worst quality of life in the Karoo and Little Karoo, as well as in towns near the metropole with extensive informal housing occurrences. Namaqualand and certain former mission stations also experience extensive human needs and high levels of poverty. However, towns for which lower levels of human needs are recorded are only better in a relative sense when compared to the provincial mean. They may still have high absolute levels of need. The same principle applies for development potential and infrastructural provision.
Infrastructure provision: Figure 1 displays a relatively even spatial spread of towns with higher and lower infrastructural provision potential in the province. In general the larger and better established centres achieved the highest ratings on the composite infrastructure index (i.e. George, Stellenbosch, Paarl, Worcester,
SIP – Chapter 4 11 Community Services Sector
Saldanha, Beaufort West, Mossel Bay). On the two infrastructural sub-indices the relatively smaller centres (i.e. Herolds Bay, Kalbaskraal, Heidelberg, Laingsburg and Stanford) were the best performers on transportation and communication. However, it was the larger centres which outperformed the other towns on institutional services (i.e. George, Stellenbosch, Paarl, Worcester, Oudtshoorn and Beaufort West).
The highest rated towns on development potential and infrastructure provision will need to serve as the main growth engines for social and economic development in the province. Their spatial location should be considered carefully so as to mobilise optimal trickle-down benefits for the surrounding region and towns with marginal development/infrastructural potential and high community needs. Conclusions The challenge to devise a more equitable spatial development strategy for the province should be approached via rational choices in respect of municipal infrastructural development and appropriate investment strategies. In line with the evidence from Figures 2 and 3 and Tables 2 and 3 we recommend the following actions as a point of departure for a Western Cape infrastructural strategy: Towns with relatively high infrastructure provision in combination with high
development potential and high human needs not only have significant capacity for infrastructural investment, but also have the best chance for economic growth and efficient service delivery on a regional base. They are at present the best options and should as a first priority be supported with substantial fixed infrastructural investment. In this way the general development potential of these towns could be stimulated for intensified economic growth and job creation and the upliftment of peoples’ well-being. Towns that performed relatively high on infrastructure, development and needs were Beaufort West, Ceres, Franschoek, Gansbaai, George, Grabouw, Hermanus, Kalbaskraal, Knysna, Oudtshoorn, Paarl, Plettenberg Bay, Robertson and Worcester. When gauged only on the two conditions of high development and high infrastructure more towns could qualify, namely Stellenbosch, Mossel Bay, Malmesbury, Swellendam, Vredenburg and Vredendal.
Towns with relatively low infrastructural provision in combination with high development potential also have a good chance to grow economically, despite the fact that their level of infrastructure is low. In these towns economic and infrastructural growth can operate in a supportive capacity to the first priority towns. As second priority a strategy of selective infrastructural investment in the following towns is suggested: Ashton, Hawston, Jamestown, Klapmuts, Kylemore/Pniel, Redelinghuys and Villiersdorp. The coastal settlements also listed in the diagrams and tables do not fit this role effectively because they are seasonal towns and only active during certain times of the year. Supplying infrastructure for peak demand in towns such as Wilderness and Groot Brak thus involves non-optimal use of resources.
On a third level there are towns identified on the scatter diagrams as having relatively low infrastructure provision combined with low development potential and high human need levels. These towns should be looked after in a special way because they are not in a position to cope on their own. They have high poverty and needs levels, without effective infrastructure provision while their low development potential is not supportive to stimulate growth on their own. Although investment is important in these towns, the investment should rather be channelled towards building social capital and investing in people to provide for their basic infrastructural needs. Examples of towns that qualify for such treatment are Bitterfontein, Botrivier, De Doorns, De Rust, Dysselsdorp, Eendekuil, Elandsbaai, Friemersheim, Genadendal, Goedverwacht, Gouda, Graafwater, Herbertsdale,
SIP – Chapter 4 12 Community Services Sector
Kliprand, Koekenaap, Koringberg, Kranshoek, Kurland, Leeu Gamka, Matjiesfontein, McGregor, Merweville, Murraysburg, Napier, Nuwerus, Prince Albert Hamlet, Rheenendal, Rietpoort, Riviersonderend, Saron, Slangrivier, Suurbraak, Volmoed and Zoar.
On a fourth level the scatter diagrams demonstrate two groups of towns that probably would qualify only on a minimal scale for municipal infrastructural investment. They are (i) towns that are already well supplied with high infrastructure provision, but have either low development potential or low human needs; and (ii) towns with relatively low levels of infrastructural provision linked to low human needs scores. Regarding the second group, these more affluent towns should be in a position to provide for their own service needs, while the first group comprise towns that are mostly well enough supplied infrastructurally that they already exceed their relatively low development and needs levels. Examples of the first group are Arniston, Barrydale, Ladismith, Lutzville, Montagu, St Helena Bay, Struisbaai and Vanrhynsdorp. Examples of the second group are Betty’s Bay, Brenton-on-Sea, Franskraal, Jacobsbaai, Keurboomsrivier, Onrusrivier, Pringle Bay, Strandfontein, Aurora, Greyton, Darling and Riebeek-West.
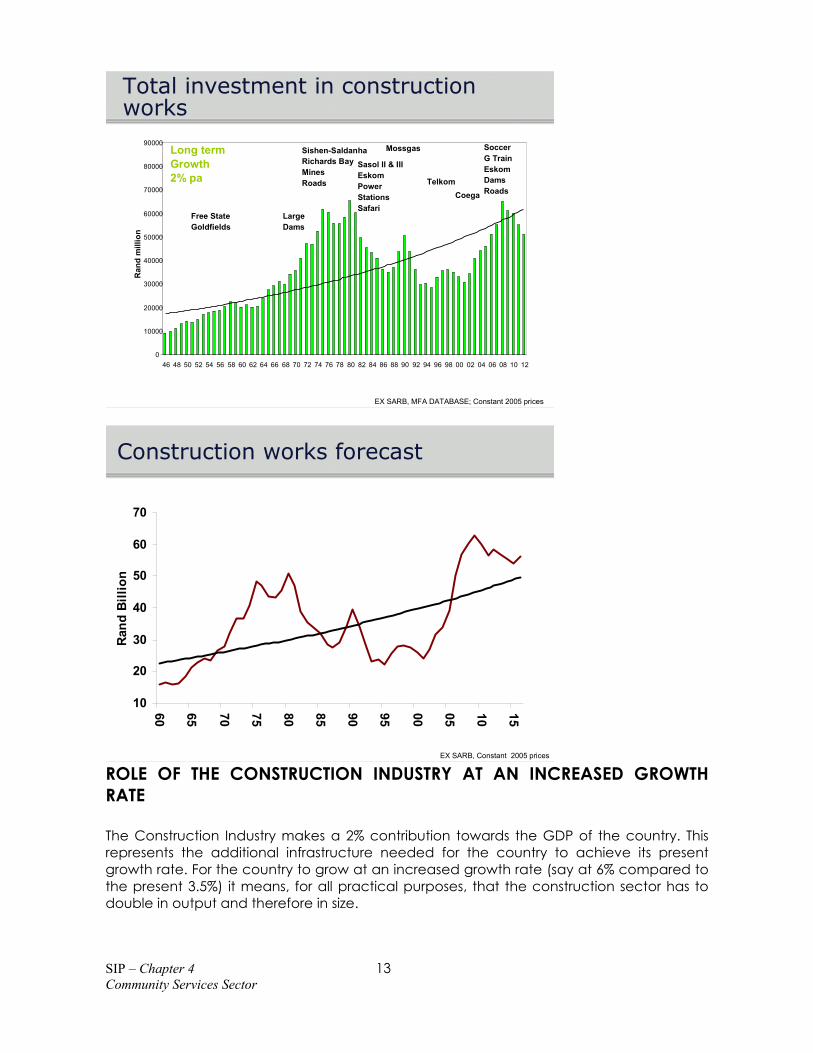
While the provincial government should align its future infrastructural investment strategy with the above typology, it should do so with appropriate caution so as not to jeopardise the unique context of specific urban settlements. This study presents the municipal infrastructural profiles relative to the individual towns’ development potential and human needs levels, as a point of departure for further deliberation and investigation. Municipalities could use the information as a guideline for gauging future development and infrastructural initiatives in their respective urban centres. But more detailed research should be undertaken before final conclusions are reached. In this way, specific types of infrastructure or municipal services could highlighted. CONSTRUCTION SECTOR INTRODUCION The purpose of this section is not to do an economic analysis the construction sector – the correct place for that would be the Economic Section – but rather to use aspects of such an economic analysis that has relevance to infrastructure creation and the development of the Strategic Infrastructure Plan. BASIC ECONOMIC TRENDS FOR THE INDUSTRY South Africa has experienced a prolonged phase of continued growth, a stable and relative low inflation rate, and therefore lower and stable interest rates. These factors have created the expectancy of a positive future scenario of continued growth in the constrution industry. The following is some of the facts and figures that reflects the positive outlook and was shared by various economists at the Construction Conference (9-11 October, North-West Province)
EX SARB, Constant 2005 prices ROLE OF THE CONSTRUCTION INDUSTRY AT AN INCREASED GROWTH RATE The Construction Industry makes a 2% contribution towards the GDP of the country. This represents the additional infrastructure needed for the country to achieve its present growth rate. For the country to grow at an increased growth rate (say at 6% compared to the present 3.5%) it means, for all practical purposes, that the construction sector has to double in output and therefore in size.
SIP – Chapter 4 14 Community Services Sector
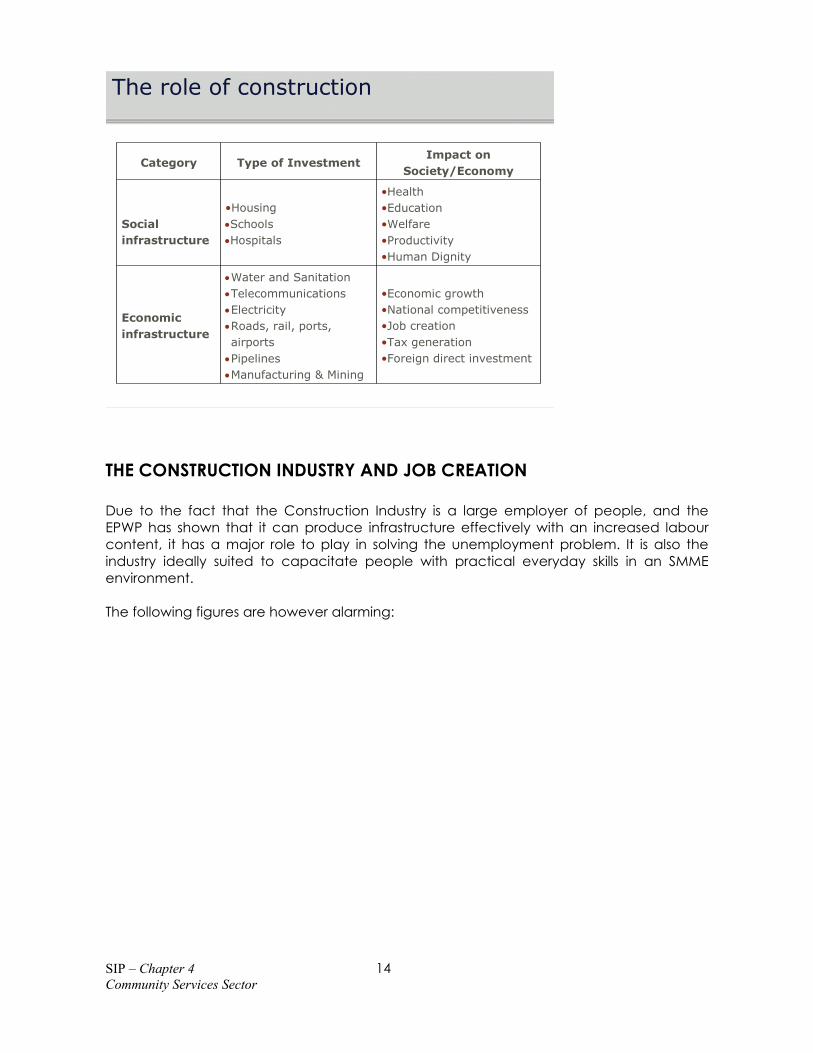
The role of construction
•Economic growth•National competitiveness•Job creation•Tax generation•Foreign direct investment
•Water and Sanitation•Telecommunications•Electricity•Roads, rail, ports, airports•Pipelines•Manufacturing & Mining
THE CONSTRUCTION INDUSTRY AND JOB CREATION Due to the fact that the Construction Industry is a large employer of people, and the EPWP has shown that it can produce infrastructure effectively with an increased labour content, it has a major role to play in solving the unemployment problem. It is also the industry ideally suited to capacitate people with practical everyday skills in an SMME environment. The following figures are however alarming:
SIP – Chapter 4 15 Community Services Sector
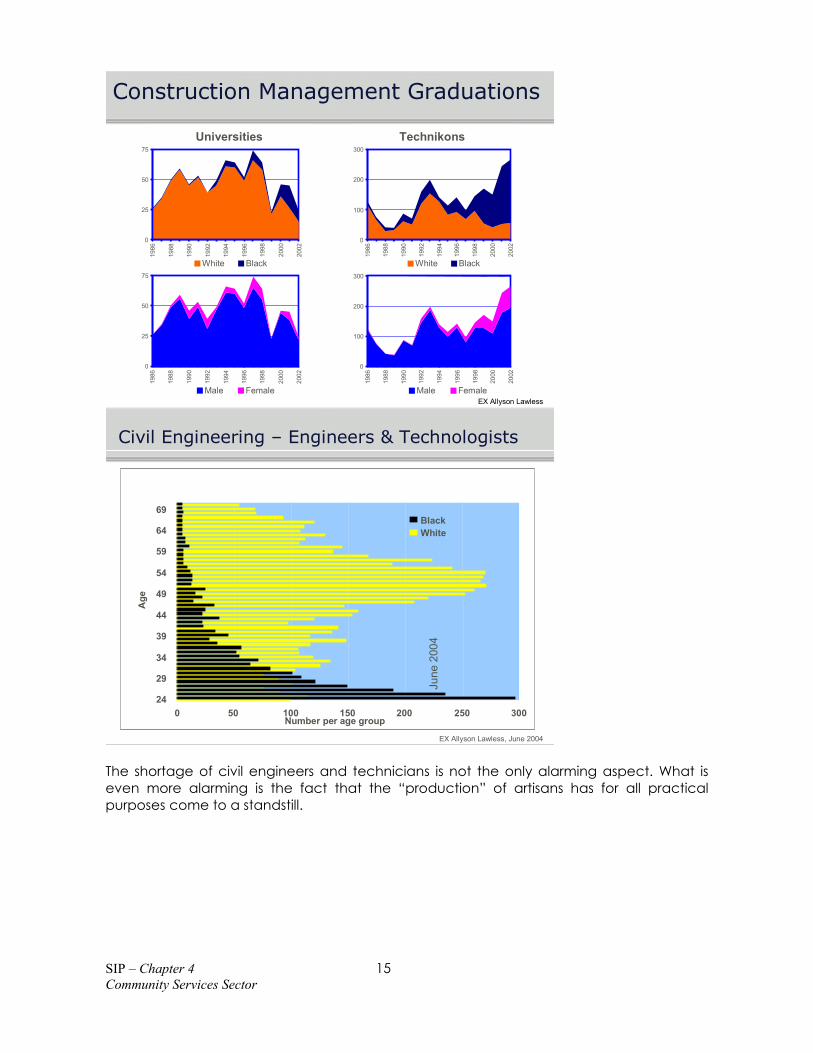
Construction Management Graduations
Universities Technikons
EX Allyson Lawless
0
25
50
7519
86
1988
1990
1992
1994
1996
1998
2000
2002
White Black
0
100
200
300
1986
1988
1990
1992
1994
1996
1998
2000
2002
White Black
0
25
50
75
1986
1988
1990
1992
1994
1996
1998
2000
2002
Male Female
0
100
200
300
1986
1988
1990
1992
1994
1996
1998
2000
2002
Male Female
Civil Engineering – Engineers & Technologists
0 50 100 150 200 250 30024
29
34
39
44
49
54
59
64
69
Age
Number per age group
BlackWhite
EX Allyson Lawless, June 2004
June
200
4
The shortage of civil engineers and technicians is not the only alarming aspect. What is even more alarming is the fact that the “production” of artisans has for all practical purposes come to a standstill.
SIP – Chapter 4 16 Community Services Sector
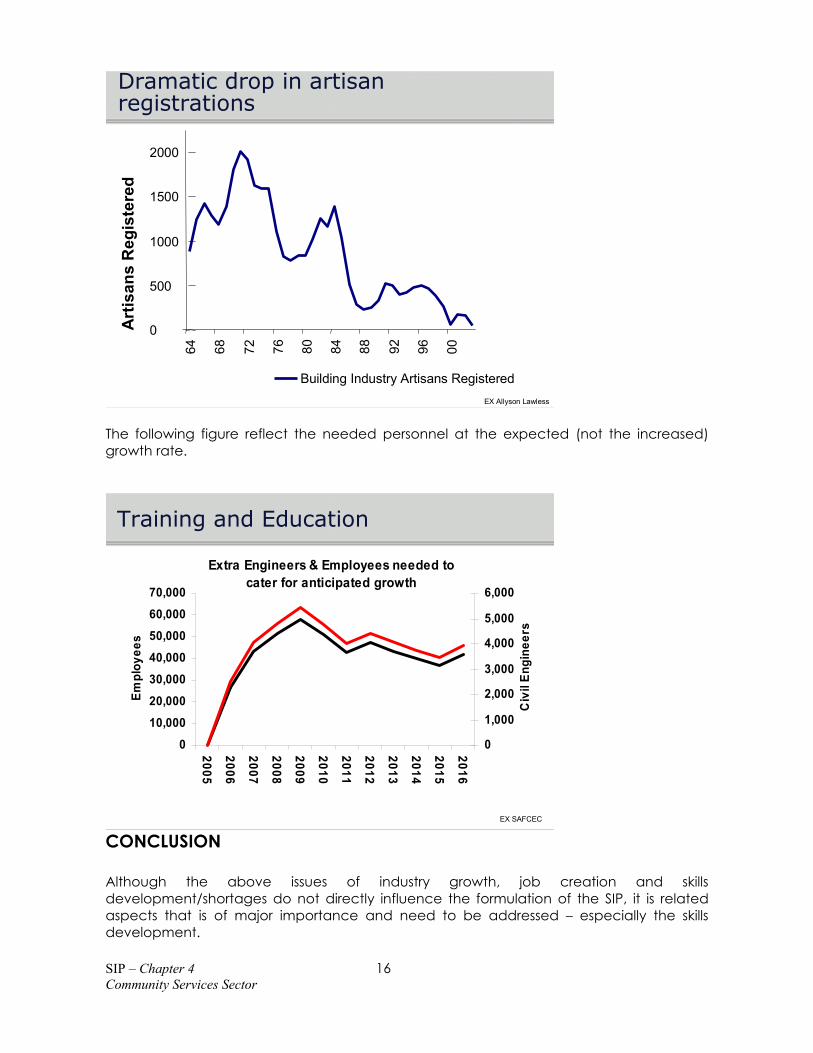
Dramatic drop in artisan registrations
EX Allyson Lawless
64 68 72 76 80 84 88 92 96 00
0
500
1000
1500
2000
Art
isan
s R
egis
tere
d
Building Industry Artisans Registered
The following figure reflect the needed personnel at the expected (not the increased) growth rate.
Extra Engineers & Employees needed to cater for anticipated growth
0
10,000
20,000
30,000
40,000
50,000
60,000
70,0002005
2006
2007
2008
2009
2010
2011
2012
2013
2014
2015
2016
Empl
oyee
s
0
1,000
2,000
3,000
4,000
5,000
6,000
Civ
il En
gine
ers
Training and Education
EX SAFCEC CONCLUSION Although the above issues of industry growth, job creation and skills development/shortages do not directly influence the formulation of the SIP, it is related aspects that is of major importance and need to be addressed – especially the skills development.
SIP – Chapter 4 17 Community Services Sector
Discussion Although the above issues of industry growth, job creation, skills development and skills shortages do not directly influence the formulation of the SIP, they will influence its successful implementation. Skills development, in particular, needs to be addressed and, given that this issue is not currently receiving adequate attention, support of the construction sector education and training authority (CETA) is required. CETA and the Civil Engineering Department of the University of Stellenbosch are in an advanced stage in concluding a memorandum of understanding in terms of which the university intends to establish a Construction Centre of Excellence or a School of Construction Management to support CETA and the construction industry regarding skills development. Eight programmes, inclusive of 23 projects, have been identified and scheduled at an estimated cost of R13,5 million. A co-funder is needed to provide bridging funds and contribute towards the support programme. It is recommended that the provincial government co-fund the Construction Centre of Excellence to the value of R2,5 million annually for five years as part of the SIP. Expanded Public Works Programme Background In his State of the Nation address in February 2003, the State President announced the launch of the expanded public works programme (EPWP). The programme constitutes one of government’s strategies responding to the widespread structural and endemic unemployment and poverty in South Africa, which has reached crisis proportions. The EPWP aims to reduce unemployment and alleviate poverty in the short to medium term through the provision of work opportunities coupled with training. The medium to longer term programmes of government aim to address unemployment by increasing economic growth, improving skills levels through education and training, and improving the enabling environment for industry to flourish. The EPWP is to continue until the medium to longer term programmes are successful. The EPWP aims to reorient government expenditure so that it results in more work opportunities, particularly for unskilled labour. As no additional funding was made available for the EPWP, the current public sector budgets need to be realigned towards the EPWP objectives. Opportunities for implementing EPWP have been identified in the following sectors: infrastructure; environment and culture; social; and economic.
All public bodies, including state-owned enterprises, are expected to contribute to the EPWP. In addition, as part of this initiative, national government has placed conditions on the provincial infrastructure grants and municipal infrastructure grants (MIG) through the Division of Revenue Act. EPWP in the Western Cape It is necessary to distinguish between the EPWP initiatives of the provincial government itself and those initiated within the province by other agencies, including national departments, municipalities and state-owned enterprises. The Department of Transport and Public Works has assumed the leadership for the EPWP within the provincial government. In this role of EPWP champion, it has engaged in bilateral discussions with
SIP – Chapter 4 18 Community Services Sector
other provincial departments. In August 2005 the department submitted a business plan for the Renewed Mandate for the EPWP in the Western Cape to the Western Cape Cabinet, which accepted the plan. This business plan calls for the upscaling of EPWP in the Western Cape, highlights certain deficiencies and sets out strategies for the renewed EPWP in the province. Table 4 shows the targets in respect of work opportunities reflected in the plan and agreed to at top management level in the province. Table 4 EPWP targets
Department % of total non-personnel expenditure
Equivalent number of work opportunities Targets for 2005/06
Dept of the Premier 4.03 967 120 Parliament 0.48 115 Bilateral o/s Treasury 1.78 427 Pending Community Safety 1.70 408 Bilateral o/s Education 12.14 2914 Bilateral o/s Health 9.90 2376 2376 Soc. Serv & PA 9.88 2371 2029 Loc. Gov & Housing 13.16 3158 3158 EADP 2.54 610 610 Transport & PW 36.75 8820 8820 Agriculture 2.77 665 1000 Econ. Dev 2.60 624 624 CA & Sport 2.27 545 545 Totals 100.00 24000 19282
As part of the upscaling from the above baseline, it is envisaged that the linkages between the EPWP, the provincial Micro-Economic Development Strategy and Human Resource Development Strategy will be strengthened. The business plan sets out eight strategies for upscaling the EPWP: Broadening ownership to all sectors and departments: In addition to the role played
by provincial departments, municipalities will be challenged to revisit their contribution to employment creation and skills development.
Revisiting and setting targets: Provincial departments and municipalities will be required to set EPWP targets, which will be monitored by the provincial EPWP Unit. The targets set by the Department of Transport and Public Works have already been reassessed and are shown in Table 5.
Table 5 Reassessed targets of Department of Transport and Public Works
Targeted interventions: Municipalities with the highest rates of unemployment will be prioritised for EPWP interventions. Likewise at the individual level groups most at risk, such as women, youth and single parents, will be targeted.
Focus on skills development: The regional economic development strategies and the Human Resources Development Strategy are to be analysed to identify the growth sectors and skills required. Beneficiaries will be tracked as they develop skills through EPWP projects and an exit strategy will be part of the development of each beneficiary. Skills development will also be undertaken for consultants and contractors.
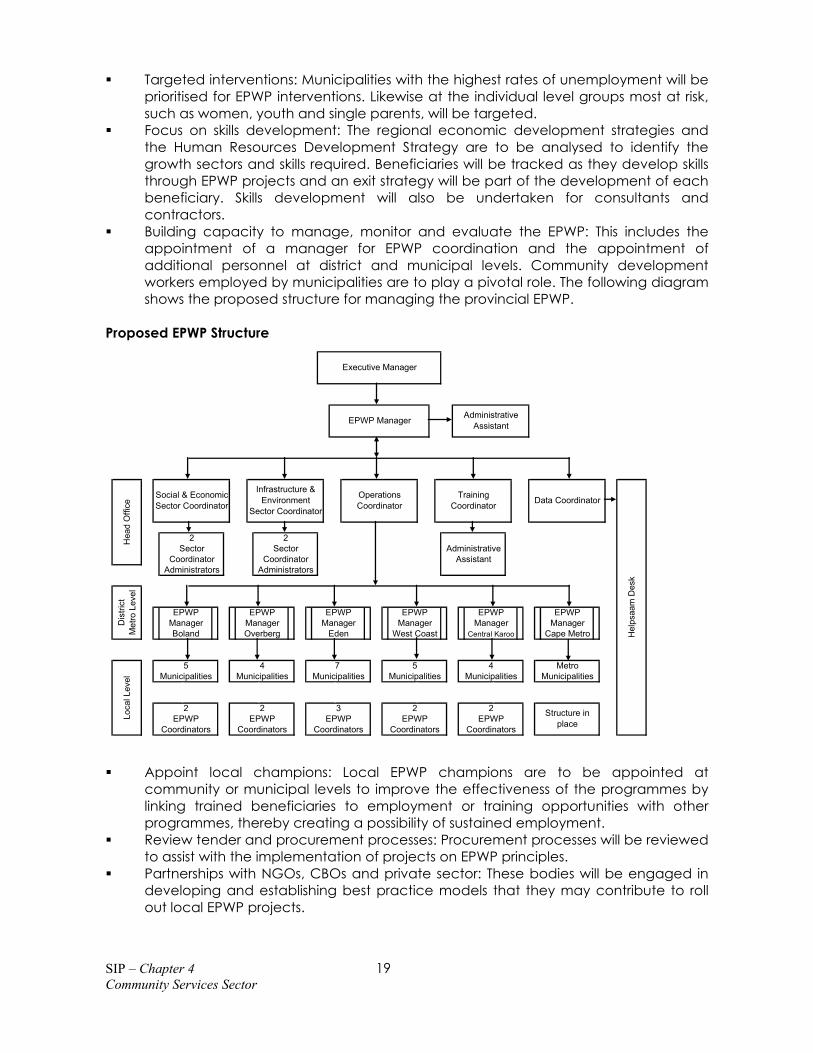
Building capacity to manage, monitor and evaluate the EPWP: This includes the appointment of a manager for EPWP coordination and the appointment of additional personnel at district and municipal levels. Community development workers employed by municipalities are to play a pivotal role. The following diagram shows the proposed structure for managing the provincial EPWP.
Proposed EPWP Structure
2EPWP
Coordinators
Structure in place
3EPWP
Coordinators
2EPWP
Coordinators
2EPWP
Coordinators
2EPWP
Coordinators
Municipalities MunicipalitiesMetro
MunicipalitiesMunicipalities4
Municipalities7
Municipalities
EPWPManager
Cape Metro
5 5 4
West Coast
EPWPManager
Central KarooOverberg
EPWPManager
Eden
AdministrativeAssistant
EPWPManager
EPWPManager
EPWPManager
2Sector
CoordinatorAdministrators
Executive Manager
EPWP Manager Administrative Assistant
Social & Economic Sector Coordinator
Infrastructure & Environment
Sector Coordinator
Operations Coordinator
Training Coordinator
Loca
l Lev
elD
istri
ct
Met
ro L
evel
Hea
d O
ffice
Hel
psaa
m D
esk
Data Coordinator
2Sector
CoordinatorAdministrators
Boland
Appoint local champions: Local EPWP champions are to be appointed at
community or municipal levels to improve the effectiveness of the programmes by linking trained beneficiaries to employment or training opportunities with other programmes, thereby creating a possibility of sustained employment.
Review tender and procurement processes: Procurement processes will be reviewed to assist with the implementation of projects on EPWP principles.
Partnerships with NGOs, CBOs and private sector: These bodies will be engaged in developing and establishing best practice models that they may contribute to roll out local EPWP projects.
SIP – Chapter 4 20 Community Services Sector
Table 6 shows the informal targets for learnerships offered by or through the provincial government by 2006. Given that learners would be paid approximately R1 000 per month plus other costs, over a 24-month period, this would require a commitment of at least R180 million. Table 6 Informal targets for learnships for 2006 Agency Number Type Municipal level 1500 Trade-specific Provincial departments 3000 Department-specific Municipal and other departments 2000 General, as required Total 6500 According to the CETA website, there are two training providers in the Western Cape accredited for EPWP training at NQF levels 2 and 4. However, the CETA has advised that the total has now increased to four accredited training providers. In addition, accredited training providers registered elsewhere are offering courses in the Western Cape. Presumably there are also training providers accredited with other Setas for labour-intensive work and learnerships along EPWP principles in other sectors, i.e. outside infrastructure. Table 7 shows the learnerships reflected for the Western Cape in the Fourth Quarterly Report on the EPWP, covering the period ending 31 March 2005. The figures reflect learnerships in respect of contractors and supervisors. The report notes that learnerships in Cape Agulhas and Overberg might have to be cancelled as there were not sufficient projects to sustain the learnerships over a 24-month period. Table 7 Learnerships established in Western Cape, March 2005 Mossel Bay Municipality 18 Cape Agulhas Municipality 6 * George Municipality 18 Overberg District Municipality 6 * Department of Public Works, Western Cape 60 Klipfontein Corridor Project 66 Subtotal Western Cape 174 Total South Africa 1 326 The learnerships are established in terms of a memorandum of agreement between the public body, the national Department of Public Works and CETA, as well as agreements with the learners themselves and possibly other parties such as mentors, ABSA and the Independent Development Trust. A group composed of one learner contractor and two learner supervisors constitutes a learner contracting unit. Importantly, the learner contracting unit is not in an employee-employer relationship with the public body, but in a contractual relationship. During the 24 month learnership period the contracting unit takes on increasingly more challenging work. Suggested values are: 1st project: R250 000 to R500 000 (total contract value) for 3-4 months; 2nd project: R500 000 to R2 000 000 (total contract value) for 6-12 months; 3rd project: R1 000 000 to R5 000 000 (total contract value) for 6-12 months.
There is concern that the volume of work in smaller municipalities is too low to sustain these learnerships. It thus seems unlikely that many of the new learnerships to be established would follow the EPWP emerging contractor learnership model. Instead, most of the
SIP – Chapter 4 21 Community Services Sector
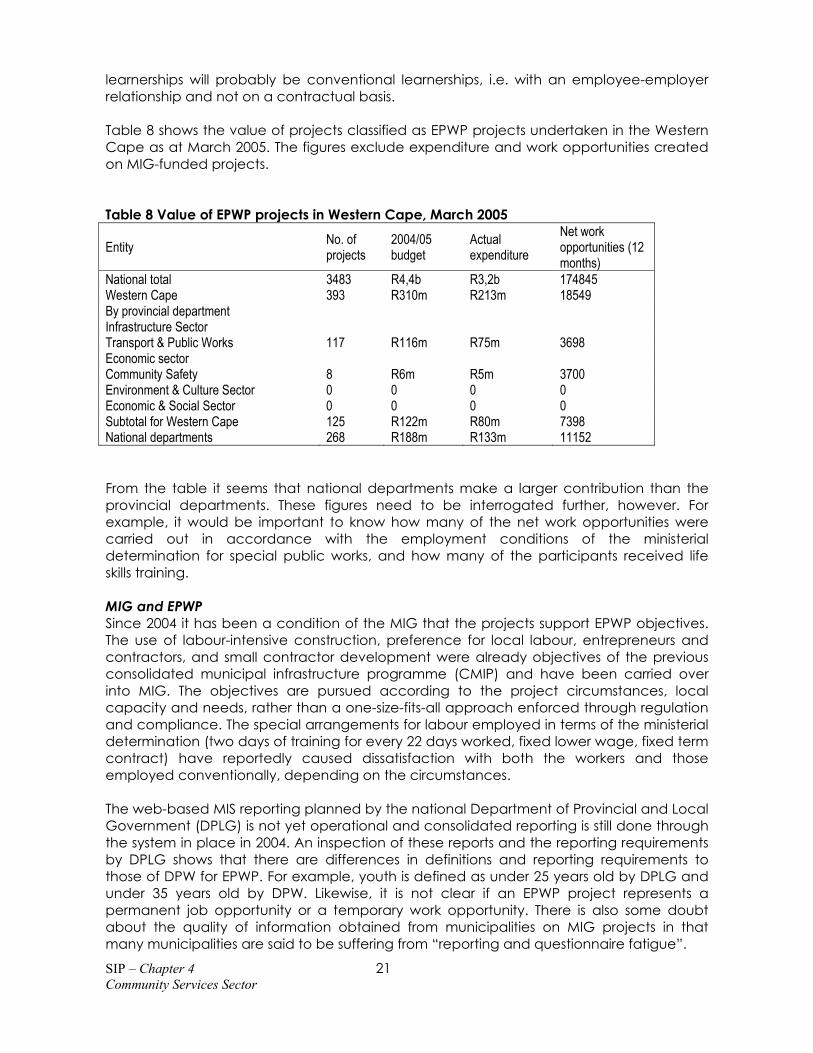
learnerships will probably be conventional learnerships, i.e. with an employee-employer relationship and not on a contractual basis. Table 8 shows the value of projects classified as EPWP projects undertaken in the Western Cape as at March 2005. The figures exclude expenditure and work opportunities created on MIG-funded projects. Table 8 Value of EPWP projects in Western Cape, March 2005
Entity No. of projects
2004/05 budget
Actual expenditure
Net work opportunities (12 months)
National total 3483 R4,4b R3,2b 174845 Western Cape 393 R310m R213m 18549 By provincial department Infrastructure Sector Transport & Public Works 117 R116m R75m 3698 Economic sector Community Safety 8 R6m R5m 3700 Environment & Culture Sector 0 0 0 0 Economic & Social Sector 0 0 0 0 Subtotal for Western Cape 125 R122m R80m 7398 National departments 268 R188m R133m 11152 From the table it seems that national departments make a larger contribution than the provincial departments. These figures need to be interrogated further, however. For example, it would be important to know how many of the net work opportunities were carried out in accordance with the employment conditions of the ministerial determination for special public works, and how many of the participants received life skills training. MIG and EPWP Since 2004 it has been a condition of the MIG that the projects support EPWP objectives. The use of labour-intensive construction, preference for local labour, entrepreneurs and contractors, and small contractor development were already objectives of the previous consolidated municipal infrastructure programme (CMIP) and have been carried over into MIG. The objectives are pursued according to the project circumstances, local capacity and needs, rather than a one-size-fits-all approach enforced through regulation and compliance. The special arrangements for labour employed in terms of the ministerial determination (two days of training for every 22 days worked, fixed lower wage, fixed term contract) have reportedly caused dissatisfaction with both the workers and those employed conventionally, depending on the circumstances. The web-based MIS reporting planned by the national Department of Provincial and Local Government (DPLG) is not yet operational and consolidated reporting is still done through the system in place in 2004. An inspection of these reports and the reporting requirements by DPLG shows that there are differences in definitions and reporting requirements to those of DPW for EPWP. For example, youth is defined as under 25 years old by DPLG and under 35 years old by DPW. Likewise, it is not clear if an EPWP project represents a permanent job opportunity or a temporary work opportunity. There is also some doubt about the quality of information obtained from municipalities on MIG projects in that many municipalities are said to be suffering from “reporting and questionnaire fatigue”.
SIP – Chapter 4 22 Community Services Sector
Given these caveats, the report for 31 March 2005 reflects a total of 19 MIG projects, with 2 643 work opportunities, over a twelve-month period, at an expenditure of R33 280 996. The Fourth Quarterly Report relates to the efforts made nationally in the environment, social and economic sectors, and reflects mainly training and learnerships. No information, other than on the Bambanani programme, could be obtained regarding these sectors in the Western Cape, as information on programmes such as Working for Water and Working for the Coast was not disaggregated by province. The report contains no information regarding the contribution of state-owned enterprises and the private sector to the EPWP. However, the report notes that the Business Trust has committed to establishing a facilitation fund of R100 million over the period 2005 to 2010. The Trust’s approach includes development of incentives to encourage achievement of targets. Findings The research for this sub-section was conducted mainly through telephonic interviews, a few meetings and desktop research. The following perceptions emerged: There is confusion about the definitions of EPWP and learnerships, work opportunities
(separate from job opportunities) and labour-intensive construction. It is not always clear whether a project is an EPWP project or not.
Although the programme has the best intentions, the management and administration within the province seems to be unduly complicated. This raises the question of whether the benefits will outweigh the additional cost of management and administration. The same or a better result could perhaps be achieved based on goal setting, incentives and rewards.
It is difficult to assess current progress if the latest quarterly report is more than six months old.
In smaller municipalities the volume of work is too low to sustain a learner contractor plus supervisors for 24 months which is the current learnership structure. There is a need for greater flexibility with respect to learnerships than the EPWP emergent contractor development programme allows for.
There is a need to include additional monitoring parameters that may be more easily understood and verified, Possibilities include number of memoranda of agreement signed by public bodies with the national Department and CETA; number of learnerships registered at the two levels; number of mentors appointed; number of ABSA credit facility agreements signed; value of ABSA credit facilities granted; value of CETA grants paid; number of training providers accredited with CETA; value of work done by contractors during learnerships; number of consultants, contractors and public sector officials accredited with NQF levels 5 and 7; number of unskilled persons participating in life skills training offered by Department of Labour.
The report on the EPWP website should include MIG-funded projects undertaken by municipalities as these projects hold much potential for employment creation and skills development, and are reported on by municipalities to the provincial MIG coordinator.
There is a need for harmonising the definitions between DPLG (for MIG) and the national Department of Works (for EPWP), for example in respect of youth, EPWP projects, and non-accredited training.
SIP – Chapter 4 23 Community Services Sector
We could not find a record of the number of persons who have received life skills training. Some persons consulted would only provide information if the request came in writing through the official channels.
The eight point strategy refers in passing to the involvement of the private sector, but with no specifics mentioned. The need to engage the private sector is clear, given the national crisis. The private sector needs to formulate its contributions and respond appropriately. As the private sector – especially smaller firms – responds more easily to incentives than regulation and compliance, there is a need for innovative proposals.
Recommendations It is recommended that the topic of EPWP be further researched to enable the drawing up of an action plan for the improved implementation of the EPWP with specific reference to the roll out and experience in local government.
ASSET MANAGEMENT INTRODUCTION In terms of the Municipal Finance Management Act the Municipal Manager is responsible:-
• To compile an asset register of all assets of the municipality. • Ensure the adequate maintenance of such assets.
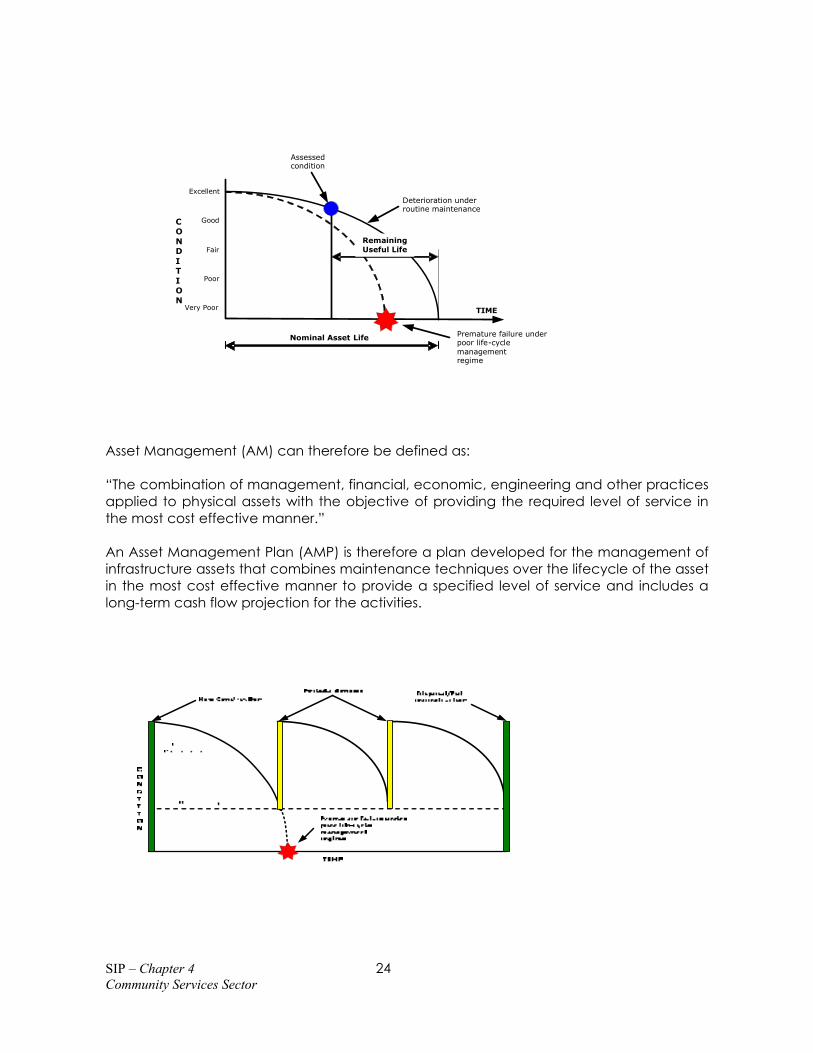
It includes all movable assets (e.g. vehicles, furniture, equipment), as well as fixed assets (e.g. land and buildings, streets, waste water treatment facilities, water pipelines, reservoirs, pump stations, the storm water system, etc.) BACKGROUND All local and district authorities are required to compile an Integrated Development Plan (IDP) that spans a period of five years. They are also required to revise the IDP annually. As part of the IDP the needs of the community are compared to the status quo, the gap is determined and a plan is developed to close the gap, of course, within the financial means of the Municipality. Emphasis is therefore placed on the creation of new infrastructure. Budgets are compiled, projects implemented and control mechanisms put in place to monitor performance against the approved IDP, based on the supply of new infrastructure. The maintenance and rehabilitation of existing infrastructure does not have the same prominence and does not receive the same attention. WHAT IS ASSET MANAGEMENT? Any asset has a life expectance and needs to be maintained (due to breakages or as part of a scheduled program) and rehabilitated at certain frequencies to reach such that life expectancy. If for any reason the maintenance and rehabilitation do not take place, the life of the asset is drastically reduced. The following is a graphical presentation.
SIP – Chapter 4 24 Community Services Sector
TIME
CONDITION
Poor
Assessed condition
Deterioration under routine maintenance
Very Poor
Fair
Good
Excellent
Premature failure under poor life-cycle management regime
Nominal Asset Life
RemainingUseful Life
Asset Management (AM) can therefore be defined as: “The combination of management, financial, economic, engineering and other practices applied to physical assets with the objective of providing the required level of service in the most cost effective manner.” An Asset Management Plan (AMP) is therefore a plan developed for the management of infrastructure assets that combines maintenance techniques over the lifecycle of the asset in the most cost effective manner to provide a specified level of service and includes a long-term cash flow projection for the activities.
SIP – Chapter 4 25 Community Services Sector
ASSET MANAGEMENT IN THE WESTERN CAPE “Significant deterioration of municipal infrastructure has been observed in the Western Cape Province. The loss of asset value of roads alone was estimated in 2004 at around R700 million.” (Report prepared for MIG Unit, May 2005) To make matters worse is the fact that backlog in, for instance, sub-terranean infrastructure (such as water, sewerage and storm water systems) has yet to be assessed. As a result of the above, an initiative was launched by the Provincial MIG office to embark on a process to improve asset management in the Province:
• The MIG office funded the compilation of water and sanitation master plans at all the less capacitated municipalities and all master plans will be completed by the end of the 2005/6 financial year.
• A uniform way of compiling an Asset Register was work shopped and agreed with all WC municipalities.
• Two pilot sites (Stellenbosch and Drakenstein) were identified to compile full blown Asset Registers, the purpose being:
to gain experience; to determine the depth to which it should be done, and to determine the cost of such an exercise.
Work on these pilot sites should be complete by the end of 2005.
In compiling the Asset Register, seventeen different variables are determined (e.g. present condition, life expectancy, critically, asset performance, etc.) Standard software was developed to complete Asset Management Plans. The software can be distributed from the MIG office to all municipalities to ensure consistence. Such standardization also ensures that province wide analysis can be made for all publicly owned assets.
ASSET MANAGEMENT NATIONALLY The Institute of Municipal Engineers in Southern Africa (IMESA) identified Asset Management as a major issue of strategic importance some time ago. IMESA has reached an agreement with the Association of Local Government Engineering New Zealand Inc., to distribute a SA version of the International Infrastructure Management Manual. The SA Infrastructure Management Manual should be ready for distribution at the end of 2005. Infrastructure Management Courses and trainees have also been registered at the LGSeta and training of relevant officials and politicians can start early in 2006. ASSET MANAGEMENT OBJECTIVE The importance of Asset Management and the compilation of Asset Management Plans is beyond debate and long overdue. An objective that all municipalities have completed Asset Registers and approved Asset Management Plans by the end of 2007 is not only feasible, but a must.
SIP – Chapter 4 26 Community Services Sector
ASSET MANAGEMENT STRATEGY Capacity in the compilation of an Asset Register, inclusive of the seventeen variables, is currently being created in the industry (locally and nationally, both in the public and in the private sector). Due to the fact that the WC MIG office has already taken the initiative in this regard, it is proposed that they continue to manage/facilitate the process in the Western Cape.
Furthermore, asset maintenance and rehabilitation is of such importance, and backlogs have accumulated to such an extent, that most local authorities will not have the capacity to fund an Asset Management Plan (or even a correctly compiled asset register). It is therefore recommended that a special and dedicated Infrastructure Maintenance and Rehabilitation Fund be created at the MIG office where LM’s and DM’s can apply for co-funding in the normal MIG format. It is also recommended that Local Authorities be requested to include a separate chapter in their IDP‘s containing:
the municipality’s Asset Management Plan; the long-term cash flow requirements of the Asset Management Plan; and funding and co-funding requirements.
PROJECTS
1. Complete Asset Management Plan at all municipalities by the end of 2007. 2. The backlog, how it should be addressed, inclusive of possible funding
arrangements, be further researched. 3. A dedicated Asset Maintenance and Rehabilitation Fund be created in the
2006/2007 provincial budget.
SIP – Chapter 4 27 Community Services Sector
WATER SERVICES INTRODUCTION
Towards the end of 2004 the Strategic Framework for Water Services – Water is Life, Sanitation is Dignity - was approved by Cabinet. In the framework, all spheres of government and parastatals agreed on a set of targets and benchmarks. The Department of Water Affairs and Forestry were also tasked to compile an annual report on the progress towards the said targets. The first report is still in draft form, but has useful information that the Western Cape can use to measure itself.
DISCUSSION
Attached as Annexure A is some of the important targets and the Western Cape’s relative performance. An evaluation is made as to whether performance is acceptable or not. Of the 14 targets in the Annexure, three received a thumbs down:
• Access to Services - Target 2: All people in South Africa have access to a
functioning basic sanitation facility by 2010. • Access to Services - Target 5: All bucket toilets are eradicated by 2006. • Quality of services provided - Target 3: Water quality.
BASIC SANITATION
Performance on this target has nationally been poor and the Western Cape has not been the exception. Precisely as to why performance has been so poor there is uncertainty. Few sanitation projects were undertaken, whether in the city or in the rural areas. The tendency has been to rather use available funding (municipal funding as well as national funding now consolidated under MIG) towards housing projects. Fact remains that basic sanitation facilities are not being supplied at a rate to address the backlog at 2010. It is suggested that a research project be undertaken to determine the reasons why this matter is not receiving the required attention and also to determine possible restraints or bottle necks which suffocates service delivery.
ERADICATION OF BUCKET SYSTEM
As is the case with Basic Sanitation, performance ha been poor and the target, to be achieved by the end of 2006, will not be reached. Funding allocation has not been adequate relative to the size and complexity of the problem. Bucket toilets cannot be replaced by VIP toilets – it requires a water based system to be acceptable to users, although not necessarily a full waterborne sewage system. In certain instances bucket systems are on private property and a toilet building,
SIP – Chapter 4 28 Community Services Sector
connections, sewerage network and main line needs to be constructed to solve the problem, making the available funding completely inadequate. It is suggested that a task team be appointed to investigate the problem of non-delivery on this target as a matter of urgency.
POTABLE WATER QUALITY 1. BACKGROUND
In almost all South African metropolitan areas, and those areas provided with drinking-water from the major water boards, some 20 million consumers are provided with high quality drinking-water services. These services are usually well managed, and drinking-water quality is monitored and maintained in structured scientific programmes. However, in the non-metro communities of South Africa, including those of the Western Cape, the situation is very different and drinking-water quality is often a threat to primary health. This situation principally arises from drinking-water quality management not being a prioritised concern for WSAs, and the resulting lack of drinking-water quality data preventing the necessary operational optimisation of drinking-water quality management from source, to treatment, through distribution to point-of-use. A recent DWAF-IMESA joint pilot initiative has rolled out a user-friendly drinking-water quality management (DWQM) tool at nine WSAs (and the metro), and where this DWQM tool has been used drinking-water quality has generally improved at no, or only nominal, additional manpower and running costs.
2. MASIBAMBANE STUDY
A status quo assessment of drinking water quality and service delivery was carried out in the Western Cape through Masibambane between late 2003 and mid 2004. The project involved all 24 non-metropolitan Water Service Authorities. A summary of the key findings were:
• Most Local Municipalities do not understand what is required for effective drinking-
water service delivery. o Lack of understanding of legislative requirements, water quality
standards/guidelines, requirements for effective monitoring, etc o Service delivery to smaller towns/communities is not as effective and
efficient as that in the larger towns of the same local municipality • Inadequate monitoring (and associated pro-active management) of drinking-
water services consistently results in drinking-water quality that fails legislated requirements.
o Lack of drinking-water quality data o Lack of basic laboratory equipment o Drinking-water quality is not always ideal or good o Through monitoring water quality issues are identified o Accurate laboratory analysis is essential to enable informed decision-making
SIP – Chapter 4 29 Community Services Sector
• Inadequate infrastructure management results in premature failure of drinking-water services.
o Maintenance budgets are not adequate to ensure sufficient asset maintenance
o Appropriate and sustainable technologies are not always implemented • Present Water Service Authority institutional capacity (staffing, funding, expertise,
education) is limiting adequate service provision. o Constant restructuring a staff stressed, demotivated, poor attitudes, no
initiative o Staff numbers are not adequate; too many ghost posts o Skilled staff leave to higher paying jobs; away from small towns o Water Service Authorities have difficulty in attracting suitably qualified staff o Not sufficiently supported by LGWSETA in training and capacity building
requirements
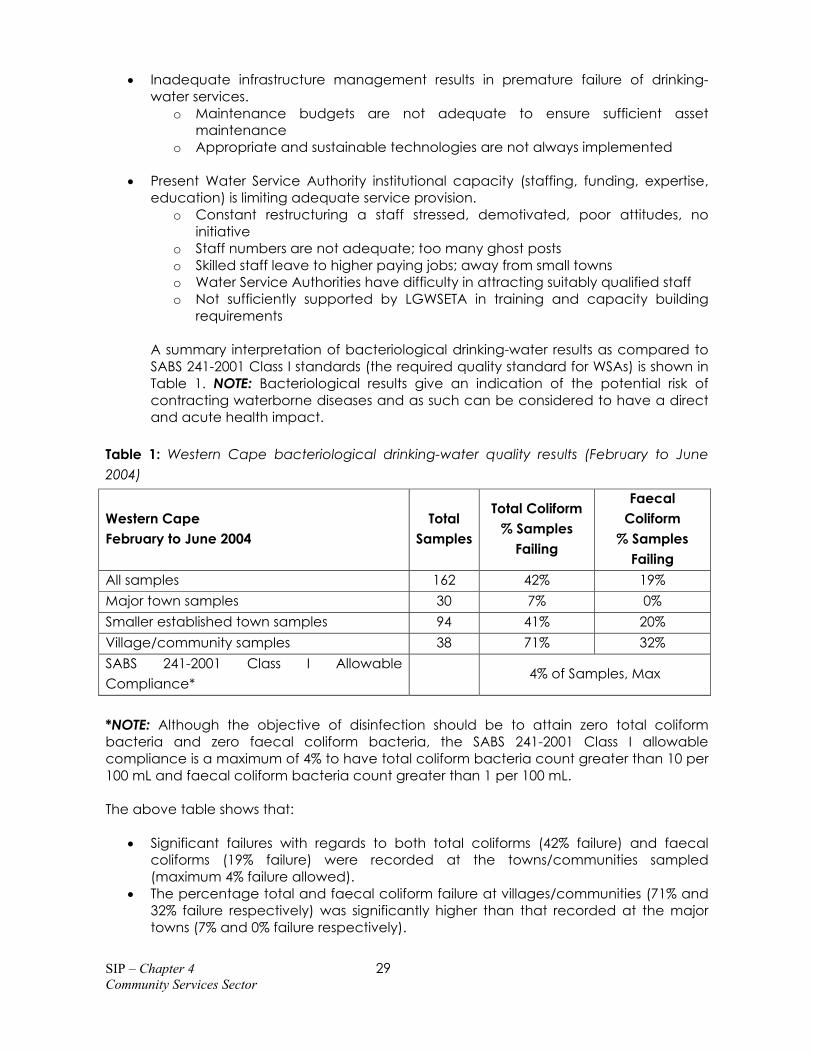
A summary interpretation of bacteriological drinking-water results as compared to SABS 241-2001 Class I standards (the required quality standard for WSAs) is shown in Table 1. NOTE: Bacteriological results give an indication of the potential risk of contracting waterborne diseases and as such can be considered to have a direct and acute health impact.
Table 1: Western Cape bacteriological drinking-water quality results (February to June 2004)
*NOTE: Although the objective of disinfection should be to attain zero total coliform bacteria and zero faecal coliform bacteria, the SABS 241-2001 Class I allowable compliance is a maximum of 4% to have total coliform bacteria count greater than 10 per 100 mL and faecal coliform bacteria count greater than 1 per 100 mL.
The above table shows that:
• Significant failures with regards to both total coliforms (42% failure) and faecal
coliforms (19% failure) were recorded at the towns/communities sampled (maximum 4% failure allowed).
• The percentage total and faecal coliform failure at villages/communities (71% and 32% failure respectively) was significantly higher than that recorded at the major towns (7% and 0% failure respectively).
Western Cape February to June 2004
Total Samples
Total Coliform % Samples
Failing
Faecal Coliform
% Samples Failing
All samples 162 42% 19% Major town samples 30 7% 0% Smaller established town samples 94 41% 20% Village/community samples 38 71% 32% SABS 241-2001 Class I Allowable Compliance*
4% of Samples, Max
SIP – Chapter 4 30 Community Services Sector
The percentage total and faecal coliform failure at smaller established towns (41% and 20% failure respectively) was also significantly higher than that recorded at the major towns (7% and 0% failure respectively). 3. DRINKING-WATER QUALITY MANAGEMENT BEST PRACTICE IN THE WESTERN CAPE
Besides the good DWQM practices generally carried out by the City of Cape Town in the metropolitan areas, useful examples of regional Best Practise by local government in the Western Cape which can be cross-referenced include:
• Stellenbosch Local Municipality (Western Cape) In Stellenbosch, approximately 100 samples are collected on a monthly basis from source, through treatment chain, reservoirs and distribution network to the consumers tap. These samples are analysed at CSIR’s SANAS Accredited Analytical Laboratory in Stellenbosch. The Technical Director: Engineering and Technical Services of Stellenbosch Municipality has stated that utilisation of an accredited laboratory ensures that the results are accurate. Through monitoring, analysis, interpretation and corrective action, the technical director can ensure that the quality of water supplied to the communities of Stellenbosch Municipality satisfies legislated requirements.
• Drakenstein Local Municipality (Western Cape)
In Paarl, approximately 30 drinking-water samples are collected on a fortnightly basis in the distribution network for analysis in Drakenstein Municipality’s In-House Laboratory. Cross-checks are regularly conducted at CSIR’s SANAS Accredited Analytical Laboratory in Stellenbosch. This programme has recently been extended to include the other towns in Drakenstein Municipality.
Experiences gained from the above DWQM programmes can be used to develop effective DWQM programmes for the various local municipalities in the Western Cape.
4. CASE STUDIES DEMONSTRATING THE BENEFITS OF A DWQM PROGRAMME
This section presents summary case studies demonstrating the efficacy of a simple, easy to use internet based DWQM system , which has been shown to significantly assist municipal engineers to improve DWQ.
4.1 Short Term Benefits arising
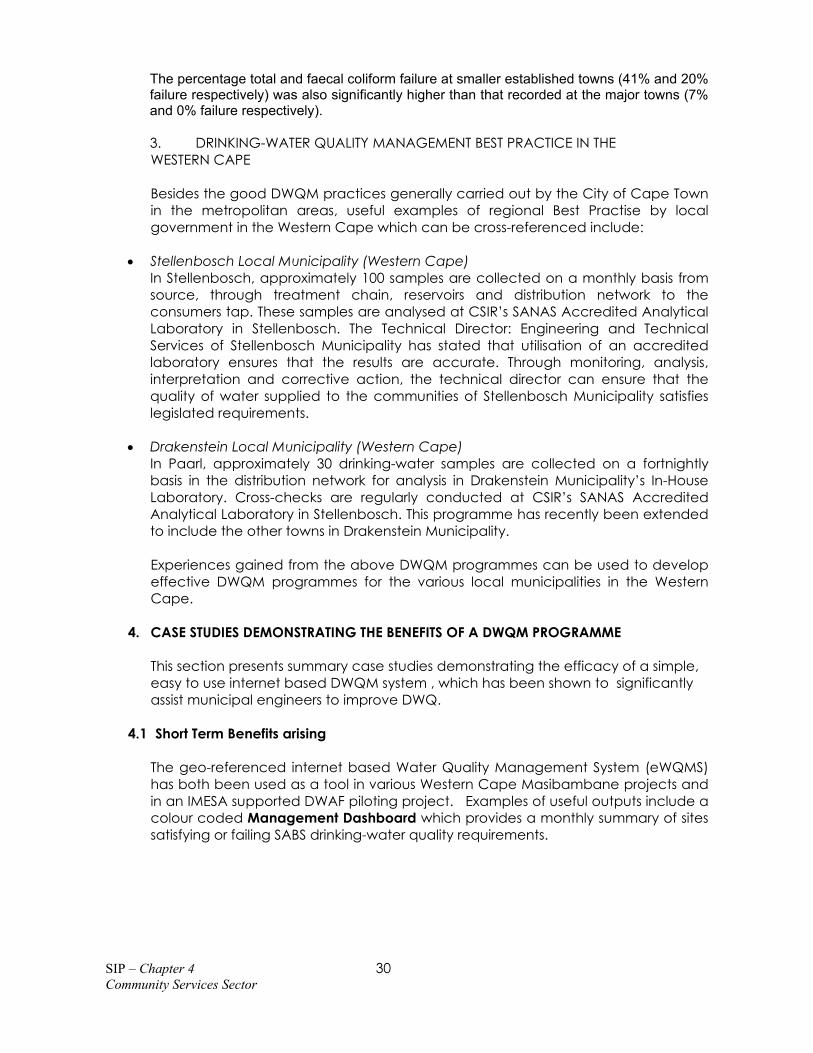
The geo-referenced internet based Water Quality Management System (eWQMS) has both been used as a tool in various Western Cape Masibambane projects and in an IMESA supported DWAF piloting project. Examples of useful outputs include a colour coded Management Dashboard which provides a monthly summary of sites satisfying or failing SABS drinking-water quality requirements.
SIP – Chapter 4 31 Community Services Sector
Figure 2: Example of the color coded dashboard for Bitou Local Municipality (June 2005)
• A further additional Technical perspective feature is an auto-notification by email of Maximum Allowable Limit failures, and the facility for tracking the resolution thereof.
• Quick-linked “on the fly” graphics can be used to track and manage sensitive determinands, including residual water treatment chemicals like aluminium, across the area of the WSA.
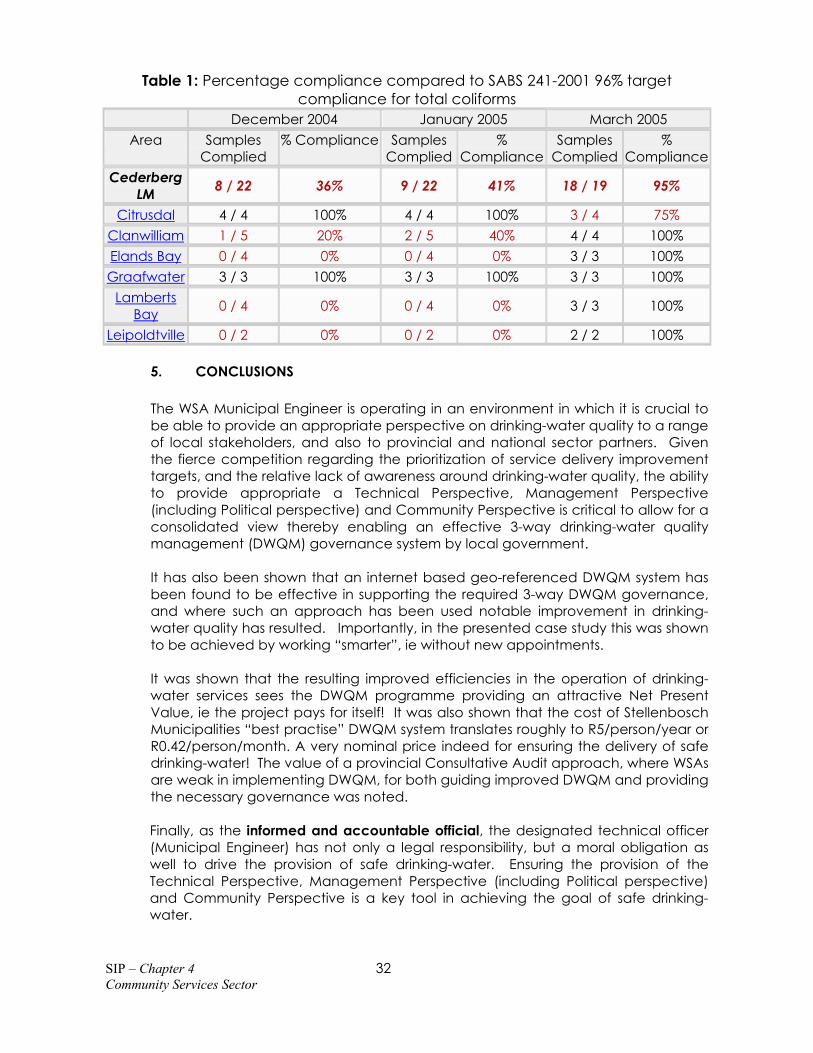
• Summary graphics also prove useful for interaction between the Technical and Management perspective. This is clearly illustrated in Figure 3 overleaf, which clearly shows the relative vulnerability of different communities within Bitou Municipality to bacteriological failures. Such perspectives are powerful motivators to secure the necessary backing from Management to enable appropriate technical intervention. The dramatic impact which improved DWQ data can result in is shown in Table 1 below. It can be very clearly seen as to how Cederberg LM achieved a significant improvement in compliance with SABS 241-2001 Total Coliform limits from 36% to 95% over a three month period. A key observation is that with the introduction of the DWQM system, DWQ achievements were achieved despite no additional capacity. Simply by working “smarter” with better information, the WSA became more effective and thus made better use of the capacity it already had.
SIP – Chapter 4 32 Community Services Sector
Table 1: Percentage compliance compared to SABS 241-2001 96% target compliance for total coliforms
December 2004 January 2005 March 2005 Area Samples
The WSA Municipal Engineer is operating in an environment in which it is crucial to be able to provide an appropriate perspective on drinking-water quality to a range of local stakeholders, and also to provincial and national sector partners. Given the fierce competition regarding the prioritization of service delivery improvement targets, and the relative lack of awareness around drinking-water quality, the ability to provide appropriate a Technical Perspective, Management Perspective (including Political perspective) and Community Perspective is critical to allow for a consolidated view thereby enabling an effective 3-way drinking-water quality management (DWQM) governance system by local government.
It has also been shown that an internet based geo-referenced DWQM system has been found to be effective in supporting the required 3-way DWQM governance, and where such an approach has been used notable improvement in drinking-water quality has resulted. Importantly, in the presented case study this was shown to be achieved by working “smarter”, ie without new appointments.
It was shown that the resulting improved efficiencies in the operation of drinking-water services sees the DWQM programme providing an attractive Net Present Value, ie the project pays for itself! It was also shown that the cost of Stellenbosch Municipalities “best practise” DWQM system translates roughly to R5/person/year or R0.42/person/month. A very nominal price indeed for ensuring the delivery of safe drinking-water! The value of a provincial Consultative Audit approach, where WSAs are weak in implementing DWQM, for both guiding improved DWQM and providing the necessary governance was noted.
Finally, as the informed and accountable official, the designated technical officer (Municipal Engineer) has not only a legal responsibility, but a moral obligation as well to drive the provision of safe drinking-water. Ensuring the provision of the Technical Perspective, Management Perspective (including Political perspective) and Community Perspective is a key tool in achieving the goal of safe drinking-water.


![[ Disability Sport Western Cape ]](https://static.documents.pub/doc/80x56/5681322c550346895d988a23/-disability-sport-western-cape-.jpg)


