158
A GUIDE TO COMMUNITY PARK AND RECREATION PLANNING FOR OREGON COMMUNITIES April 2013

A GUIDE TO
COMMUNITY PARK AND
RECREATION PLANNING
FOR OREGON COMMUNITIES
April 2013

1
ACKNOWLEDGEMENTS
This 2013-2017 SCORP appendix is a modified version
of the original publication, A Guide to Community
Park and Recreation Planning for Illinois Communities,
Second Edition, March 2001, developed by the Illinois
Department of Natural Resources. The state of Oregon
and the Oregon Parks and Recreation Department
gratefully acknowledges the Illinois Department of
Natural Resources' permission to use their publication.

2
Table of Contents
Introduction .................................................................................... 4
The Planning Process........................................................................ 5
Getting Started ................................................................................ 7
Steps in Preparing a Community Park and Recreation Plan
Step 1: Organize the Planning Team .................................................. 9
Step 2: Agree on a Planning Process and Schedule ............................. 10
Step 3: Develop a Public Participation Strategy ................................. 11
Step 4: Collect and Display Basic Information ................................... 12
Step 5: Identify Needs and Issues ...................................................... 14
Step 6: Focus on the Highest Priority Needs and Issues ..................... 17
Step 7: Develop a Vision .................................................................. 17
Step 8: Formulate Goals and Objectives............................................ 18
Step 9: Identify Strategies .................................................................. 19
Step 10: Prioritize Strategies and Develop an Action Program ........... 20
Follow-up ....................................................................................... 23
Sources of Planning Information and Assistance ................................ 24
Checklist for the Planning Process ..................................................... 25
Forms
Form 1: Resolution in Support of Planning ...................................... 26
Form 2: Interview Questions for Community Leaders ..................... 27
Form 3: Interview Questions for Park Board Members .................... 28
Form 4: Public Meeting Questionnaire ............................................ 29
Form 5: Parkland Inventory ............................................................ 30
Form 6: Site Inventory .................................................................... 31
Form 7: Community Inventory ....................................................... 33
Form 8: Community Parklands LOS Analysis ................................... 35
Form 9: Community Facilities LOS Analysis ..................................... 36
Form 10: Accessibility Checklist ........................................................ 37
Form 11: Socio-economic Information ............................................. 38
Form 12: Participation in Outdoor Recreation Activities .................. 39
Form 13: Priorities for the Future .................................................... 40
Form 14: Resolution to Adopt the Plan ........................................... 41

3
Appendices
Appendix A: Accessibility Mandates ............................................................42
Appendix B: Community Map ....................................................................43
Appendix C: Oregon Parkland Classification System and Suggested
Level Of Service Standards ...................................................................44
Appendix D: Oregon SCORP Planning Regions ...........................................55
Appendix E: Percent of Population Participating in Outdoor Recreation
Activities, Oregon Counties, 2011 .........................................................56
Appendix F: User Occasions by Activity in Oregon Counties Where
Occurred, 2011 .....................................................................................68
Appendix G: Percent of Population Participating in Outdoor Recreation
Activities, Oregon SCORP Regions, 2011 ..............................................84
Appendix H: User Occasions by Activity in Oregon SCORP Regions
Where Occurred, 2011 .........................................................................87
Appendix I: User Occasions and Participation in Outdoor Recreation
Activities, Oregon, 2011 .......................................................................95
Appendix J: Priorities For the Future By Oregon County .............................98
Appendix K: Priorities For the Future By Oregon SCORP Region .................102
Appendix L: SCORP Needs Assessment ........................................................103
Appendix M: Group Brainstorming Technique ............................................109
Appendix N: Example of a Vision Statement ...............................................111
Appendix O: Potential Funding Sources ......................................................112
Appendix P: Oregon Census Data ...............................................................125

4
Introduction
This guide is provided to assist units of local government in Oregon (cities, counties, special
districts, ports and regional districts) with a small staff, or no permanent staff at all, in preparing a
park and recreation plan for their jurisdiction. The guide is designed to be easily followed by
local agency staff and/or a designated group, such as an appointed planning team, given the
responsibility for preparing a plan. Although reference is made throughout this guide to a
community plan, the planning process described can apply to any agency-wide park and
recreation plan of a unit of local government.
Evidence of sound park and recreation planning is a critical factor considered by the Oregon
Parks and Recreation Department (OPRD) in evaluating requests for the grant funding available
annually to units of local government for the acquisition of public open space and development
of recreation facilities. OPRD believes park and recreation planning encourages:
provision of recreational
opportunities in an effective
and efficient manner,
conservation of open
space and natural and
cultural resources,
community quality of life,
environmental education,
sensible community growth, and
economic development,
especially recreation
related tourism.
Regional planning commissions
or local planning departments,
planning consultants, faculty at
local educational institutions
and others may be able to help
you develop a plan. This guide
is not intended to replace
professional planning expertise
that may be obtained by your
community. The information
and material in this guide can
either supplement such assistance
or provide enough guidance
to enable a local agency to
develop a basic park and recreation
plan where such expertise is not
available.

5
The Planning Process
Why should you plan? First, understand that everyone plans. In our personal life, we plan our
day's activities, the itinerary for a trip, and how to complete work assignments on time. Some of
our plans are longer range such as those for sending our children to college and ensuring financial
security for our retirement. Having a plan does not ensure success, but neglecting to plan often
leads to failure. It has been said that, "Failing to plan is planning to fail."
In organizations and agencies of government the need for planning is even more important
because:
Success usually depends on the efforts of a number of individuals, working together to meet
the needs of many other people, including those within the organization.
Defining success is often complex.
Plans usually must be longer range.
Public bodies, answerable to voters, have special responsibilities, for example, for the wise
use of public funds and to fulfill legal mandates.
The public must be provided opportunities for input in the planning process and expressing
their opinions.
For these reasons, it is critical that all members of an agency:
(1) are working toward the same outcomes, and
(2) agree on how to pursue these outcomes.
If an agency has not agreed on where it is going, its members are likely to find themselves
working toward different goals. Even if all agree on what the agency's goals are, without
agreement on how to achieve these goals, staff will again find themselves working at cross-
purposes.
Developing a park and recreation plan does not have to be complicated and costly. The planning
process presented is basically a common sense approach for identifying and deciding how to
meet the recreation and open space needs of your community.
Planning involves:
looking at where a community stands today,
envisioning where it wants to be tomorrow, and
determining how to best move from today's situation to the desired future.

6
There are Plans, and Then There are Plans.
There are many types of plans: comprehensive, strategic, master, site, etc. Unfortunately
these labels are sometimes used inconsistently, and plans are sometimes mislabeled. In many
cases, plans combine aspects of more than one type of planning.
Using the planning process in this guide will result in what is usually called a community
master plan for parks and recreation that combines aspects of both strategic and
comprehensive planning methods.
A park and recreation master plan provides an overall framework to guide the provision of
park and recreation services in a community. It should be consistent with the general plan of
the community. The general plan is a multi-purpose community plan containing interrelated
policies and actions for all major community governmental functions and responsibilities
such as transportation, land use and education.
Comprehensive planning usually describes an approach to planning that is inclusive and
considers, quantitatively if possible, all known factors, as well as the interrelationships
among these factors, that might influence the function(s) for which the plan is developed.
The resulting plans are usually long-range and general.
Strategic planning emphasizes developing a vision of a future condition the planning
jurisdiction wants to achieve and determining specifically what strategies will be used to
achieve this envisioned future. Strategic plans tend to be less quantitative, more focused
and action-oriented and have shorter time horizons.
Fortunately, these distinctions are not critical to developing your plan. This guide refers
simply to "a park and recreation plan" to avoid confusion.

7
Getting Started
When the decision has been made to develop a park and recreation plan, the following initial
tasks need to be accomplished:
1. The local city council or park board should adopt a formal resolution calling for and
supporting the planning process (See Form 1). The resolution will demonstrate to the
community that the governing body is committed to the park and recreation planning
effort and that it accepts its role in future plan implementation.
2. A park and recreation planning team, including at least one member from the
governing body, should be officially appointed to develop the plan. The planning
team will collect and analyze information, involve the public in the planning process,
develop the major elements of the plan itself and present the plan to the public for
review and the governing body for consideration and official adoption.
The planning team should include members from those community organizations and
interests that will be most affected by the plan's recommendations and whose support will
be necessary to implement the plan. Team members must have the time, commitment and
ability to stay with the planning process from start to finish. They should be familiar with the
community and its parks and recreation system and represent a cross-section of the commu-
nity: business, civic and educational leaders as well as members of the general public.
Residents that have a personal interest in local park and recreation opportunities, such as
those with young children or children active in sports, members of the disabled community
and seniors are often well suited for this responsibility.
In order to maintain the planning team at a workable size of about 15 members, it will be
necessary to distinguish between those community interests who will be represented on the
team and those whose input can be gained through the public participation process.
Community members who have special expertise in planning, natural resources management
or other areas relevant to plan development can be asked to participate as non-voting
advisors to the team.

8
3. A brief description of the role and responsibilities of the planning team, i.e., a "job
description" for planning team members should be prepared. For example, clarify that the
team will recommend a plan to the governing body, not adopt the plan themselves. Specify
the level of commitment expected of team members so that those invited will be able to
determine if they are able and willing to participate fully. (How the team members will
interact with each other to carry out their business usually can be left for the team themselves
to determine at their first meeting. See Step 1.)
4. Background material, which will be useful to planning team members in developing a
common base of community knowledge relevant to the plan, should be assembled. For
example, this material might include:
Descriptions of the community's present park and recreation areas, facilities and staff, as
well as the current park and recreation budget.
Information on the community, its residents and population trends.
Organizational chart that displays the governmental structure of your community and
clarifies where the responsibility for parks and recreation lies in relationship to other
government functions (see sample chart below).
Existing community park and recreation plans and statements of community park and
recreation mission and goals.
Park and recreation plans from communities like yours.
This planning guide.
Electorate
City Council
City Attorney City Clerk
Police Department Other Departments Park Department
Planning Team

9
Be selective and present information as concisely as possible, perhaps annotating it and
supplementing it with briefings at initial team meetings and as needed.
With the planning team formed, legitimized by ordinance and briefed, the team is now ready to
begin meeting and preparing the park and recreation plan. The following material provides a
step-by-step process that can be used as described or adapted to develop the plan.
STEPS IN PREPARING A
COMMUNITY PARK AND RECREATION PLAN
Step 1: Organize the Planning Team.
The planning team's first task is to organize itself. The team needs to:
1. Select a Chairperson (unless the governing body wishes to assign this responsibility) to
conduct team meetings and direct team activities. This election may be left for a later
meeting if team members do not yet know each other with someone designated to serve as
interim chairperson.
It may also be desirable to obtain the help of a person with experience in conducting group
problem-solving meetings to serve as a non-voting team facilitator. A facilitator can neutrally
guide discussion, allowing the chairperson to participate more in the substance of team
discussions.
2. Select someone to take notes, keep a record of group decisions, and prepare and
disseminate team products. If the team has a facilitator, this is often part of their
responsibilities. Otherwise a team member may be willing to do this, or the convening body
or a team member may be able to supply a member of their staff for this purpose.
However the team decides to divide, distribute and carry out their responsibilities, the team
must recognize that certain needs for effective and efficient team functioning exist and must
be met.
3. Agree on "ground rules" to enable the team to interact in a productive, non-confrontational
manner. Some ground rules are obvious, such as no side conversations, only one person
talks at a time and only when recognized by the facilitator or chair. Other rules may be
more difficult to decide on, such as whether a member can send a substitute when they can
not attend a meeting and whether the team will make decisions by consensus or majority
vote.
One rule that most well-functioning working teams adopt is that members may vigorously
criticize ideas, but not other team members personally. It is just as easy, and definitely more
conducive to team functioning, to say, "I disagree with that suggestion," than to state, "That's
the dumbest idea I've heard today." Getting personal is unnecessary and can quickly disrupt a
team.
Letting the team set its own rules encourages members to follow them.

10
STEPS IN PREPARING A
COMMUNITY PARK AND RECREATION PLAN
Step 2: Agree on a Planning Process and Schedule.
1. Agree on a planning process, either the one described in this guide, some adaptation of it, or
some other process the team is confident will effectively produce the type of plan they need.
As part of the planning process, consider where in the process public input will occur and
what type of input is needed at these points (See Step 3).
2. Agree on a time schedule for the plan based on the planning process. Identify any external
dates (e.g., grant application deadlines) that may affect the schedule. Consideration of the
schedule may prompt revisions in the planning process until some balance is reached
between the type of planning process used and the time and effort required from team
members for plan completion.
A chart such as the one below helps display the schedule.
It is important to understand that the planning process may be lengthy, taking six months to a
year. The time needed will vary among communities, and a realistic time schedule should be
established early in the process. How fast you can proceed will depend upon the level of
commitment of those participating in the planning and how well they are able to balance the
demands of the planning process with their other responsibilities. Important challenges that need
to be considered and met include (1) stimulating and maintaining participant interest and (2)
making participation as easy and efficient as possible.
Organize Team
Feb. March April May June July August Sept. Oct. Nov. Dec. Jan.
Gather and Analyze Input
Public Participation
Identify Priority Needs and Issues
Develop Vision
Goals, Objectives and Strategies
Action Program
Review and Revise Plan
Begin Implementing Action Plan

11
STEPS IN PREPARING A
COMMUNITY PARK AND RECREATION PLAN
Step 3: Develop a Public Participation Strategy.
To improve the quality of the plan and to ensure its widest acceptance, it is important that local
citizens have the opportunity to participate in the planning process and that citizen input is
responded to and incorporated into the plan.
Some key points to consider regarding public participation in the planning process include:
The members of the planning team may write an excellent community park and recreation
plan. However, in order for the plan to be implemented, it must be supported by the
community and especially the community's leaders and elected officials. Consider
arranging special meetings to obtain input from key civic groups and individuals, either
collectively or in individual interviews. Forms 2 and 3 provide examples of questionnaires
that can be used for interviews with community leaders and park board members or other
elected officials responsible for parks and recreation services.
The support necessary for implementation will not occur unless citizens believe that they
have had a real opportunity to make their needs and desires known and that the planning
team took the public input seriously in developing the plan. Form 4 is an example of a
questionnaire that can be used in conjunction with a public meeting.
The public participation strategy provides an opportunity to inform and involve residents in
their community's parks and recreation services now and as they could be in the future. An
aggressive and effective public participation strategy can mobilize active community
support for the plan and its implementation. This can be the most beneficial part of the
entire planning process.
Use media coverage (newspaper, radio, and television) to broaden interest in the plan.
Involve the park and recreation agency's own employees.
Different methods of obtaining public input may be more useful for some purposes than
others at certain points in the planning process. Different methods may reach different
segments of the community.
For example, consider:
Surveys conducted by mail, telephone or newspaper to collect broad citizen input.
2011 SCORP outdoor recreation survey results included in Appendices E-K.
SCORP public recreation provider needs survey results in Appendix L.
Workshops to generate ideas.
Personal interviews with key community members and/or elected officials.
Structured small groups to resolve conflict.
Public meetings to obtain community input and accept comments on drafts of the plan.

12
STEPS IN PREPARING A
COMMUNITY PARK AND RECREATION PLAN
Everyone must be given the opportunity to say whatever he or she wants. However, asking
the public to respond to specific questions can often result in more useful input.
Be open to criticism as well as praise.
The strategy used to obtain public review and input should be fully described in the plan,
usually in an appendix. The following information should be included:
1. A description of the strategy and the specific methods used to obtain public input (e.g.,
public meetings, SCORP survey results, questionnaire, phone survey) with samples of the
forms or questionnaires used.
2. The number of persons that provided input (e.g., the number surveyed and the number
who responded, the number invited to and the number in attendance and speaking at
meetings).
3. The dates and locations of meetings and/or surveys.
4. A summary of the input received.
5 The planning team's analysis and evaluation of the content of the input and how the input
was responded to (e.g., how the plan was changed to reflect input, suggestions not taken
with the reason given).
Step 4: Collect and Display Basic Information.
Local, county or state agencies or planning departments and commissions for your jurisdiction
may have already collected some of the basic information you need.
1. Inventory Existing Recreation Sites and Facilities.
A logical starting point for planning is to determine what recreation lands and facilities are
now available to community residents. The inventory should also include schools, church
properties, and civic and private recreation areas available to the public, as well as those
parks that may be outside the community but are commonly used by your residents.
The most effective park system to develop and manage is one made up of a variety of
different types of parks, open space areas, and recreational venues, each designed to provide
a specific type of recreation experience or opportunity. To assist with park system planning
in Oregon, Appendix C includes a parkland classification system including 11 standard
parkland classification types. After a review of Appendix C, use Form 5, or a similar form, to
inventory the type, acres, development status, and managing agency for all recreation lands
available to community residents.
Using a separate Form 6, or a similar form, for each park and recreation site within the
community, inventory the types and amount of facilities and activities provided at the site.

13
STEPS IN PREPARING A
COMMUNITY PARK AND RECREATION PLAN
Take the park and recreation facility information gathered on the individual Form 6's for each
public site and compile it using Form 7. Then do the same thing for all the private sites
inventoried using another copy of Form 7. Then total the public and private inventory for a
total community inventory of available recreation facilities. (Use columns 1 and 2 of Form 7
for the public and private sites' totals and the Total column for the community totals.)
These tables provide convenient overall summaries of existing park and recreation lands and
facilities in your community.
An evaluation of the accessibility of existing parks and recreation facilities to the disabled is an
important and necessary part of the site and community inventories. All communities are
required by federal and state law to address accessibility considerations for sites and facilities
within their jurisdiction and to include individuals with disabilities in their self-evaluation
assessment (See Appendix A). At a minimum, sites should be evaluated using the basic
accessibility concepts outlined on Form 10, Accessibility Checklist.
2. Collect Resource Information.
As a part of the Statewide Land Use Planning Program, Oregon's 240 cities and 36 counties
are responsible for adopting local comprehensive plans. Important natural and cultural
resource information from your local comprehensive plan (e.g., streams and their corridors,
forests, wildlife habitat, wetlands and historic and archeological sites) should be identified.
Knowledge of these resources helps identify natural and historic settings that may be potential
sites for community parks. It is also important information needed to prevent the unnecessary
and perhaps illegal damage of important resources protected by law when developing
recreation facilities.
Some of these identified resources may be unique to the community, region or even the state.
If so, consider protecting these resources as a public park with public access provided in a
manner compatible with protecting and enhancing the resources. Examples include a wetland
with walking paths and a viewing stand for wildlife observation and a historic home restored
to provide offices for park staff and to house a museum of community history. By
incorporating protection of a community's special resources and places in its mission, a local
park and recreation agency can gain broader community support for its overall mission,
while helping preserve those assets that make the community unique.
Note: After completion of this park and recreation planning effort, it may be necessary to
amend the recreation component of your current local comprehensive plan.
Recommendations from this recreational planning process should be compatible with those
included in your local comprehensive plan.

14
STEPS IN PREPARING A
COMMUNITY PARK AND RECREATION PLAN
3. Display Important Information on Maps.
To assist in planning, a good map of your community (jurisdiction) showing the location of
existing and planned parks and other important features, including natural and cultural
resources should be developed (See Appendix B). A legible street/road map can be used for
the base. Communities that do not have a good quality street map, may obtain such maps
from the Oregon Department of Transportation's Geographic Information Services Unit1.
Maps are currently available (in pdf and Microstation Design file formats) for 240 Oregon
cities on the ODOT's website at
http://cms.oregon.gov/ODOT/TD/TDATA/Pages/gis/citymaps.aspx
4. Collect Population Information.
Use Form 11 to collect basic socio-economic and population information for your com-
munity. Evaluation of census information from 1980 through 2010, as well as any additional
information on recent developments that may affect population trends, will enable the
planning team to forecast possible future population trends and estimate future recreation
needs. For your convenience, current Oregon Census Data for counties and communities is
included in Appendix P.
5. Consider Any Existing Community Plans.
The planning process should include a review of all existing park and recreation plans, as well
as other adopted community plans, for example, community general plans and plans for
other government functions such as transportation, which might affect the provision of park
and recreation services.
Step 5: Identify Needs and Issues.
1. Needs
One of the more challenging aspects of park and recreation planning is determining how
much open space or parkland and the types and quantities of recreation facilities a
community needs. When conducting park system planning, park and recreation providers
need to not only identify which parklands and facilities/services are important to community
members, but must also define what constitutes “adequate” provision. To determine
adequacy, park and recreation providers typically measure existing parklands and facilities
and compare them against established standards, typically Level of Service (LOS) standards.
LOS standards are measures of the amount of public recreation parklands and facilities being
provided to meet that jurisdiction’s basic needs and expectations. For example, the amount
of parkland currently needed in a particular jurisdiction may be determined by comparing the
ratio of existing park acres per 1,000 residents to the jurisdiction’s desired level
1 For more information contact the Oregon Department of Transportation's Geographic Information Services Unit at
555 13th. Street N.E., Suite 2, Salem, Oregon 97301-4178. Telephone: 503.986.4245.

15
STEPS IN PREPARING A
COMMUNITY PARK AND RECREATION PLAN
of parks relative to population. The gap between the two ratios is the currently needed park
acreage. As the population grows, the objective is to provide enough additional acreage to
maintain the jurisdiction’s desired ratio of park acres to 1,000 residents.
To assist with park system planning in Oregon, Appendix C includes recommended Oregon
LOS site guidelines for each of the 11 standard parkland classification types along with specific
park facility types. These guidelines were developed after a review of past National Park and
Recreation Association (NRPA) standards and results from a statewide survey of Oregon’s
public park and recreation providers. While these statewide site and facility guidelines
provide a useful framework for evaluating jurisdiction resources, it is recognized that
individual jurisdictions will need to develop their own LOS standards that reflect their unique
conditions, resources and needs.
The supply information that was collected in Step 4 can be used to calculate the current acres
of parkland and number of community recreation facilities for each thousand residents in
your community. Using projected population in ten years rather than existing population
may provide more useful averages for planning purposes, especially for growing
communities.
Use information from Form 5, to complete the Community Parklands LOS Analysis (Form 8).
Fill in the “Total Acres in Community” column for each parkland type. Using community
population data from Appendix P, calculate and record the “Current Community LOS for
Parkland(s)” for each parkland type. Current levels of service can be compared to
recommended Oregon LOS Site Guidelines in determining proposed site guidelines for your
plan.
Use information from Form 7 to complete the Community Facility LOS Analysis (Form 9). Fill
in the “Total Facilities in Community” column for each facility type. Again, using community
population data from Appendix P, calculate and record the “Current Community LOS for
Facility” for each facility type. Current levels of service can be compared to recommended
Oregon LOS Facility Guidelines in determining proposed facility guidelines for your plan.
To assist with determining proposed facility guidelines, OPRD has also collected information
on how often Oregon residents participate in 70 outdoor recreation activities (See
Appendices E-I). User occasions (number of times people engage in an activity) and percent
of the population that participates in an activity are estimated at the state, SCORP region,
and county scales. Use Form 12 to examine 2011 outdoor recreation participation related to
your facility guideline analysis. Resident opinions about need for future investment in
outdoor recreation facilities at the SCORP region and county scales are included in
Appendices J and K. Form 13 can be used to identify highest priority need for recreation
facilities in your service area. Appendix L includes the results of a survey of Oregon public
recreation providers to identify recreational need at the statewide and county scales for
parklands both within and outside of Urban Growth Boundaries. Note: County and Region
and county-level survey summary reports are available online at:
http://www.oregon.gov/oprd/PLANS/Pages/ORORDA.aspx

16
STEPS IN PREPARING A
COMMUNITY PARK AND RECREATION PLAN
Of course, communities vary in their outdoor recreation interests and population trends.
Experience with your community and how its residents differ from those of other
communities in Oregon will help you make informed decisions about needs suggested by this
type of analysis. However, be aware that research indicates that community recreation
interests may reflect to a large extent what facilities are currently available to residents. That
is, if facilities exist for some types of recreation, but not for other types, residents may express
wishes for even more facilities of the type already present simply because they have not had
the opportunity to experience the other, unsupplied or under-supplied types of recreation.
2. Issues
Recreation planners have found it useful to supplement numerically based types of
need information with information collected more directly from the community's
residents. This type of information can be obtained through the public input strategy
discussed in Step 3 above. It may consist of the results of a survey of the public and/or
community leaders and statements made at a public meeting about what residents
want and think their community needs.
The results of such input usually do not lend themselves to numerical analysis beyond
counting and averaging, but may provide important information. "Needs" identified
in this manner are often referred to as issues. These issues include concerns and
potential opportunities and challenges to which residents believe the community
should respond.
Issues are usually simply recorded. For example, for Pleasant Town, some issues
identified were:
Save the Historic Jones Farmstead and grounds.
We need organized softball leagues.
Clean up the riverbank downtown and use it for recreation.
Develop a bicycle and jogging trail.
More programs for teenagers are needed.
Other issues or concerns may derive from the planning team's analysis of community
facilities and resources. For example, Pleasant Town's planning team discovered that:
Facilities in City Park are run down and not usable by disabled residents.
The abandoned railroad through town intersects a trail being constructed by
OPRD three miles from town.
There were complaints that teens were rollerblading in areas not constructed
for this purpose.

17
STEPS IN PREPARING A
COMMUNITY PARK AND RECREATION PLAN
Step 6: Focus on the Highest Priority Needs and Issues.
The planning team should use the information provided by: (1) comparing supply and
participation information to identify needs and (2) issues identified through public
participation and other means to identify the most important community park and recreation
needs and issues.
The planning team should then focus the plan on addressing this limited number (often less
than ten, rarely more than twenty) of the highest priority items. The planning team has to
exercise its judgment in extracting what it believes are the most important community needs
and issues form the information it has collected. Focusing the plan this way will also help
efforts to implement the plan.
The needs and issues selected will probably not fully satisfy everyone in the community or
even all members of the planning team. However, there should be enough scope and
diversity in the items chosen that most residents will find something in the plan that is
important to them and stimulates them to support the plan.
These needs/issues might include:
More community parks
More opportunities for a particular type of recreation
More accessible facilities better distributed throughout the community
Protection of special community resources
Rehabilitation of existing areas and facilities
New and expanded recreation programs
A relatively simple policy change or administrative action may address some items. Other
items, probably most, will be more difficult to address and may require funding not yet in
place. The planning team might decide that some items are not immediately addressable for
reasons such as lack of authority or funds. However, if an issue is important to the public, the
planning team should hesitate before excluding it. It may be more advisable to include the
issue in the planning process in the hope that some practical way of at least beginning to
address it may be identified. Conditions change and it is always prudent to lay some
groundwork for the future. New opportunities might arise later to more fully address
important but difficult issues or needs.
A method the planning team can use to select the most important needs and issues for the
plan is described in Appendix M.
Step 7: Develop a Vision.
By this step in the planning process, the planning team will have collected and evaluated much
information about the community and its parks and recreation services. Citizens of the
community will have been heard from. The team will have analyzed, thought about and
discussed this input in identifying the most important planning issues.

18
STEPS IN PREPARING A
COMMUNITY PARK AND RECREATION PLAN
Now is the time for the planning team to develop a vision of the kind of parks and recreation
services their community should have in ten years (or whatever period is chosen for the
plan). The vision should excite and inspire the community's residents. However, the planning
team should try to achieve a balance between a vision that is ambitious and exciting and one
that is realistic and achievable. Attaining the vision may require hard work and commitment
from the community and its leaders, but it must not be seen as unreasonable and unattainable
or the vision and the plan to achieve it will be rejected.
The statement of the vision should focus on the highest priority parks and recreation needs
and concerns of the community. Where does the planning team envision the community will
stand with respect to these concerns in ten years? What will be the effect on the community
and its residents? What will your community look like to its residents and visitors? Describe a
future that community members will be able to visualize. A sample vision statement is given
in Appendix N.
The members of the planning team and the community must share the vision. Asking for
public comment on the vision statement to determine whether it accurately reflects the
aspirations of the community is recommended at this point.
Step 8: Formulate Goals and Objectives.
1. Goals
Goals embody the outcomes that will need to occur in order for the community to achieve its
vision. Goals are written as broad statements of long-range aspirations that set overall
direction for the community.
Goals may be stated in general, broad-brush terms that identify what the community should
be or what the community should look like. However, goals should be measurable at least in
principle. For example, "To make Pleasant Town a better place to live" is too general. "To
provide Pleasant Town's residents with increased and improved opportunities for popular
recreation opportunities" is more specific, measurable in principle and thus preferred. Most
plans focus on ten or fewer broad goals.
Other goal statements for Pleasant Town might include:
To provide more community parks for recreation purposes.
To rehabilitate existing recreation facilities and make them accessible to all residents.
To provide close-to-home nature play areas for all children in the community.
To provide recreation programs for all segments of the community.
The plan's goals should be linked to the community's highest priority needs and issues and the
elements of your vision statement. Goals can be generated by asking, "What will have to be
achieved in order to realize (the elements of) the vision statement and address the community's
highest priority needs and issues?"

19
STEPS IN PREPARING A
COMMUNITY PARK AND RECREATION PLAN
2. Objectives
Objectives are statements of outcomes that must be accomplished to enable the community
to fully achieve a goal. Objectives are more specific than goals and must be actually measur-
able. Usually each broad goal will have more than one objective. It may be necessary to limit
the number of objectives for each goal. Identifying only the most important ones helps the
plan retain its focus.
For example, in order for Pleasant Town to achieve the first goal above, "To provide more
open space for recreation purposes," several objectives might need to be met, including:
Acquire and develop a new community park.
Develop two new nature play areas.
The planning team may decide to accelerate this phase of plan development by dividing the
work yet to be done. Sub teams of the planning team can be formed with each responsible
for one or two goals. The sub teams can formulate objectives (and later strategies and
actions) for review by the entire planning team.
The process described in Appendix M can be used again, here to generate objectives for each
goal.
Step 9: Identify Strategies.
When the objectives for each goal have been identified, the planning team will have
identified what must occur for the vision to be realized. Now the team must focus on how
each objective will be accomplished. That is, what strategy or strategies should be used to
accomplish each objective?
Strategies should be:
narrowly focused,
quantifiable,
do-able, and
targeted to a timeframe.
The strategies may be both short and long-term. They may be relatively easy to accomplish
or require much effort. For the objective, "Acquire and develop a new community park"
some examples of strategies might include:
Identify and assess potential sites for a new community park.
Analyze potential funding sources for the new park (see Appendix O for a list of potential
funding sources).

20
STEPS IN PREPARING A
COMMUNITY PARK AND RECREATION PLAN
The What and How of Planning
One of the challenges that face any planning team is distinguishing between the "building
blocks" of a plan: goals, objectives, strategies and actions. Sometimes in practice the distinctions
among these are fine, perhaps even insignificant in the larger scheme of the plan. The most
important thing is that you first decide on WHAT YOU ARE TRYING TO ACHIEVE (vision,
goals and objectives) and then determine HOW YOU PROPOSE TO ACHIEVE THESE THINGS
(strategies and actions).
The process described in this guide is designed to systematically step down from a more general
vision statement to more specific statements of what needs to be accomplished (goals and
objectives). Then identifying how these objectives will be achieved is done by similarly stepping
down from more general strategies to very specific actions.
The essential elements of any plan are the two end points of the process: the vision of what you
want to occur in the future and the specific actions that describe how the vision will be
achieved. If the intermediate steps and terminology confuse the planning team, instead of
making it easier to move from vision to actions, consider omitting one or more of the steps.
In the extreme, if the elements of your vision are clearly laid out in specific terms in the vision
statement, the planning team may be able to proceed directly from the vision to generating
specific actions to achieve the vision. However, the reasoning behind actions that the full
planning process makes more systematic and explicit may be lost, and the plan may become
more difficult to develop and less understandable to its readers. This can be addressed to some
extent by providing brief narrative paragraphs for each goal or element of the vision statement
that explain the planning team's approach to the item and rationale for actions.
Remember this planning process is just one way to plan that can be adapted as necessary to
better fit your situation.
Step 10: Prioritize Strategies and Develop an Action Program.
Since each goal can have more than one objective and each objective more than one strategy,
strategies can multiply. For example, a plan with eight goals, each with four objectives, each of
which has three strategies will have 8 X 4 X 3 = 96 total strategies. Even if the planning team
places limits on the number of objectives per goal and the number of strategies per objective, a
large number of strategies can result. The resulting plan may be discouraging in its long list of
things that need to be done.

21
STEPS IN PREPARING A
COMMUNITY PARK AND RECREATION PLAN
When the plan results in more things to do than can be realistically accomplished within a single,
relatively short time frame, the planning team should prioritize. Choose a limited number of
strategies, perhaps ten, and develop an action program that specifies exactly what actions are
expected to occur in the first year or two of implementation, i.e., who is expected to do what by
when.
The planning team should consider choosing strategies for the action program that:
Can begin to be implemented at once and whose accomplishment will
substantially help achieve important objectives.
Allow results to be seen by the public in the first year of plan implementation.
Allow progress to be made toward each of the plan's goals.
Provide benefits to as many segments of the community as possible.
Generate excitement, enthusiasm and involvement in the community's park and
recreation future.
Involve both acquisition and development of land for parks, as well as renovation
of existing facilities.
Contain actions that can both be carried out with existing funding and depend on
generating new funds.
Address high priority organizational needs (e.g., staff and funding) in a way that
will not be seen as self serving.
Make sure that each action is stated in specific enough terms that it will be clear when it is
accomplished. Avoid actions that call for "more of" something. Specify "how much more"
or "how many." Be specific about who is responsible for leading the activities to
accomplish this action item. An action may require the contributions of several or even
many, persons or organizations to complete. However, in order to establish
accountability, some specific person or entity should be held responsible for carrying out
the action.
Establish reasonable but specific deadlines. Questions relating to responsibility and time
frames for actions are often negotiated with those primarily responsible for
implementation during the final drafting of the plan. For example, actions related to
Pleasant Town's new park might include:
The city will identify potential park sites in Pleasant Town by September 1, 201-.
The Pleasant Town City Council will appoint a New Park Task Force by May 1, 201-. The
Task Force will first identify potential funding sources and develop alternative funding
strategies for acquisition and development of the new park. The Task Force will consider
grant programs, community fund-raising, facility sponsorship and imposing an open space
impact fee for new development.

22
STEPS IN PREPARING A
COMMUNITY PARK AND RECREATION PLAN
Some communities find it most useful to prepare an annual action program, coordinated with the
community's budget cycle. Annual action program development can also be coordinated with
assessing progress in plan implementation, as well as reexamining the plan in view of changing
conditions.
How items will be funded will be an important consideration in implementing the plan and the
action programs developed from it. In preparing an action program, the cost of actions should be
estimated and potential funding sources recommended.
The Oregon Parks and Recreation Department urges you to familiarize yourself with the grant
programs it administers described in Appendix O. Participation in these programs has significantly
helped Oregon communities implement their plans and realize their visions for the park and
recreation future of their communities.
Note: Appendix O also includes information about Oregon Marine Board administered grant
programs and other potential funding sources.
Length is Not Necessarily Strength
As the planning team writes the plan, it is important to keep in mind that the plan
is intended to be a persuasive document. Prepare a plan that when read will
interest, and hopefully excite the reader to support it and work for the plan's
implementation.
If the plan is long, unattractive or otherwise difficult to read, the plan's intentions
for readership, let alone persuasion and implementation, will not be realized.
Therefore, keep your plan as brief and focused as possible. Place less important and
the more detailed material in appendices, or if lengthy, in a companion
publication. Always keep in mind who your primary audience is and write for
them. Remember the most important readers to persuade may also be the busiest.
Make the plan look so interesting that people want to pick it up and read it. Make
it as easy as possible for them to read the plan and focus on its most important
aspects. Prepare a short executive summary of the plan if necessary. If help in
preparing an attractive publication through utilizing a professional for layout and
graphics is available, use it.

23
Follow-up
1. Resolution to Adopt the Plan
When the plan is completed, it should be presented to the governing council or board
for formal approval (See Form 14). Upon approval, the plan becomes the official park
and recreation plan of the community. Approval indicates to OPRD and other
potential funding agencies that the community's elected officials are committed to the
plan and its implementation.
2. Plan Implementation
The momentum for plan implementation will be greatest immediately after the plan's
completion and official approval. Therefore, it is important that the plan's initial
action program be immediately prepared and vigorously pursued.
If the results of implementing the plan are visible to the public, especially where they
constitute actual improvements in recreation opportunity for residents, momentum
for implementation will increase. If little appears to be occurring after the plan is
completed, the plan soon will begin to lose credibility and support.
An excellent way to begin implementation is to submit an application to OPRD for
grant assistance from one or more of the programs described in Appendix O to help
fund an action (or actions) in the plan's action program.
3. Plan Updating
Communities and their park and recreation needs and issues change. As a
consequence, park and recreation plans should be evaluated and updated at least
every five years. The initial plan can itself acknowledge the need for updating and
even recommend a mechanism for the updating to occur. One possible mechanism,
discussed in Step 10, is to coordinate reexamination and updating of the plan with
annual action program development.
Many park and recreation agencies elicit feedback from their park users, as well as
non-users, on a regular basis to identify service issues and emerging needs that should
be addressed in plan updating.

24
Sources of Planning Information and Assistance
As indicated previously, much of the information needed to develop a community park and
recreation plan may have already been collected by other local, county, regional and state
agencies. Some of these agencies and organizations may also be willing to supply technical
assistance in planning, data collection and analysis, meeting facilitation, plan publication and
various aspects of the plan. In some cases, it may be helpful to make representatives of agencies
who have these capabilities members of or advisors to your planning team.
In addition to those sources already mentioned in the text, potential sources of planning
information include:
The 2013-2017 Oregon Statewide Comprehensive Outdoor Recreation Plan (Website:
http://www.oregon.gov/oprd/PLANS/Pages/planning_SCORP.aspx)
Regional Planning Commissions
County and Municipal Planning Departments
Planning consultants
United States Department of Agriculture, Natural Resources and Conservation Service
Oregon Recreation & Parks Association (Website: http://www.orpa.org/)
Oregon Parks Association
Special Districts Association of Oregon
Park and recreation agencies of neighboring communities
Oregon Tourism Commission (Website: http://www.traveloregon.com/)
Local Colleges and Universities
Center for Population Research and Census Portland State University
(Website: http://pdx.edu/prc/about-prc) Phone: 503.725.3922
U.S. Census Bureau (Website: http://www.census.gov/)

25
Checklist for the Planning Process
Board or Council Resolution Supporting Planning Effort Passed
Planning Team Appointed
Description of Roles and Responsibilities of Planning Team Prepared
Background Material for Planning Team Assembled
Planning Team Organized
Chairperson Selected
Facilitator or Secretary Selected
Ground Rules Agreed On
Planning Process Approved
Time Schedule Approved
Public Participation Strategy Developed
Basic Information Collected
Existing Recreation Sites Inventoried
Natural and Cultural Resources Identified
Community Map Prepared
Existing Plans Reviewed
Needs and Issues Identified
Community LOS Standards Prepared
Needs and Issues Prioritized
Vision Statement Prepared
Goals Stated
Objectives Formulated
Strategies Identified
Action Plan Developed
Board or Council Resolution Approving Plan Passed
Plan Implementation Underway
Strategy for Updating Plan Identified

26
Form 1:
Resolution in Support of Planning
The following sample resolution can be used by the appropriate elective body to support
the community park and recreation planning effort.
WHEREAS, the ________________________________________(Corporate Name)
recognizes the importance of parks and recreation to the quality of life of the residents of
______________, Oregon
WHEREAS, the need to provide quality park and recreation services for residents is
recognized, and
WHEREAS, the importance of sound planning in order to effectively meet the park and
recreation needs of its citizens is understood,
NOW, THEREFORE, BE IT RESOLVED THAT
THE__________________________________supports the preparation of a Park and
Recreation Plan, to be used upon adoption by this body as its official plan for the next __
years, to guide the provision of park and recreational services in our community.
Passed and signed this ___ day of________________, 201__.
ATTEST:
_______________________________ ________________________________
President / Mayor Clerk / Secretary

27
Form 2:
Interview Questions for Community Leaders
1. Are you familiar with the programs and facilities offered by the park and recreation
department?
2. Do you utilize park department programs and/or facilities?
3. Do existing programs and facilities meet the needs of all age groups?
4. Should existing programs be increased? If yes, identify.
5. Should new programs be added? If yes, can you explain?
6. How can the park and recreation department best serve the recreation needs of the residents
within its boundaries?
7. Do you believe the park and recreation department wisely allocates your tax dollars?
8. Do you believe park and recreation department facilities are properly maintained?
9. Would city residents support an increase in taxes or fees for:
increased land acquisition
park improvements (e.g., new restrooms, boat ramp, floral display, bikeways,
playground equipment, accessibility)
swimming pool renovation or replacement
new community center
10. What is the public's image of the park and recreation department?
11. What are some long-range goals you recommend that the park board consider?
Note: Communities without park and recreation department should adapt this form to reflect
their community's method of providing park and recreation services.

28
Form 3:
Interview Questions for Park Board Members
1. What are your long-range goals for the park and recreation department?
2. Should programs of the department be increased or expanded? If yes, identify.
3. Should new programs be developed? If yes, explain.
4. Is the department able to meet its current and projected financial obligations?
5. Do city residents believe their tax dollars are wisely utilized and allocated?
6. What are the highest priority capital improvements needed by the department? (pool,
community center, sports complex, playground equipment, restrooms)
7. Should the department acquire more land? If yes, do you have suggested locations or areas
for expansion?
8. Would city residents support increases in fees?
9. Would city residents support a tax increase for capital improvements?
10. Is the city maximizing its relationship with other governmental and private agencies (e.g.,
park and recreation district, county, school district, port district)?
11. What is the public's image of the department?
12. What are the greatest challenges facing the department in the next 5 to 10 years?
Note: Communities without park and recreation departments should adapt this form to reflect
their community's method of providing park and recreation services.

29
Form 4:
Public Meeting Questionnaire
PLEASANT TOWN PARK & RECREATION DEPARTMENT
PUBLIC INFORMATION MEETING
Thursday, December 9, 201-
7:00 p.m.- 9:00 p.m.
Questionnaire
Your input is important to this long-range planning process and to the future of your park department. We
would appreciate your answering the following questions:
1. Are you familiar with programs and facilities offered by the park department? Yes__ No__
2. Do you use department programs and/or facilities? Yes__ No__
3. Do existing programs and facilities meet the needs of all age groups? Yes__ No__
4. Should existing programs be increased? If yes, identify. Yes__ No__
5. Should new programs be added? If yes, please explain. Yes__ No__
6. Do you believe the department facilities are properly maintained? Yes__ No__
7. Should the department acquire more parkland? Yes__ No__
8. Should the department make park improvements? If yes, identify:
Children’s playgrounds Designated paddling routes
Picnic areas & shelters Restrooms
Walking trails Community centers
Bicycling trails Outdoor swimming pools
Community gardens Skateboard parks
Nature & wildlife viewing areas Disc golf courses
Sports fields Motorized boat ramps
Tennis courts Non-motorized boat launches
Basketball courts Campsites
Off-leash dog parks Other
Public access to waterways
9. What are some long-range goals that you recommend the park board consider for the next 3 to 5
years?
10. What are the greatest challenges facing the park department in the next 3 to 5 years?
Name______________________________________________________________
Address____________________________________________________________
Thank you for your input. We will summarize the information we receive from all returned questionnaires.
Note: Communities without park and recreation departments should adapt this form to reflect their
community's method of providing park and recreation services.

30
Form 5:
Parklands Inventory
Park Area Acres Development Status Managing Agency
Pocket Parks
Urban Plaza Parks
Neighborhood Parks
Community Parks
Regional Parks
Nature Parks
Special Use Parks
Trails, Pathways and Bikeways
(Miles):
Regional Sports Parks
Linear Parks
Destination Parks
Total Acres

31
Form 6:
Site Inventory
Park / Site Name Type Acreage Managing Agency
Recreation Facility
Amount Condition / ADA
Compiant
Comments
Baseball fields (Number)
Softball fields (Number)
Basketball courts (Number)
Soccer fields (Number)
Golf courses (Holes)
Lacrosse fields (Number)
Equestrian facilities (Number)
Football fields (Number)
Outdoor swimming pools (Number)
Volleyball courts (Number)
Tennis courts (Number)
Picnic shelters – small (Number)
Picnic shelters – large (Number)
Day-use picnic tables (Number)
Children’s playgrounds – made of
natural materials (Number)
Children’s playgrounds –
manufactured structures (Number)
Skateboard parks (Number)
Off-leash dog parks (Number)
Nature centers (Number)
Amphitheatres (Number)
Disc golf courses (Number)
Community walking trail/path – dirt of
other soft surface (miles)
Community walking trail/path – paved
hard surface (miles)
Off-street bicycle trails/paths (Miles)
Motorized boat ramps (Lanes)
Non-motorized boat launches
(Number)
Tent campsites (Number)
RV/trailer campsites (Number)
Community gardens (Number)
Nature and wildlife viewing areas
(Number)
Designated paddle routes for canoes,
kayaks, rafts, drift boats (Number)
Public access sites to waterways
(Number)
Other:
Continues on next page

32
Recreation Facility
Amount Condition / ADA
Compliant
Comments
Amenities
BBQ grills (Number)
Restrooms (Number)
Water fountains (Number)
Parking (Number of spaces)
Other:
Special Features
Archaeological sites (Number)
Historical sites & structures (Number)
Lakes or ponds (Number)
Prairie remnants (Number)
Rivers or streams (Number)
Wetlands (Number)
Woodlots / Forests (Number)
Other:
Note: For Type of Site or Park, use the Parkland Classification type described in Appendix C.
For Amount, use the measure described in parenthesis after the facility name in the first column.

33
Form 7:
Community Inventory
Site / Park 1 2 3 4 5 Total
Name
Type
Acreage
Recreation Facilities
Baseball fields (Number)
Softball fields (Number)
Basketball courts (Number)
Soccer fields (Number)
Golf courses (Holes)
Lacrosse fields (Number)
Equestrian facilities (Number)
Football fields (Number)
Outdoor swimming pools
(Number)
Volleyball courts (Number)
Tennis courts (Number)
Picnic shelters – small
(Number)
Picnic shelters – large
(Number)
Day-use picnic tables
(Number)
Children’s playgrounds –
made of natural materials
(Number)
Children’s playgrounds –
manufactured structures
(Number)
Skateboard parks (Number)
Off-leash dog parks
(Number)
Nature centers (Number)
Amphitheatres (Number)
Disc golf courses (Number)
Community walking
trail/path – dirt of other soft
surface (miles)
Community walking
trail/path – paved hard
surface (miles)
Off-street bicycle trails/paths
(Miles)
Motorized boat ramps
(Lanes)
Non-motorized boat
launches (Number)
Continues on next page

34
Site / Park 1 2 3 4 5 Total
Recreation Facilities
Tent campsites (Number)
RV/trailer campsites
(Number)
Community gardens
(Number)
Nature and wildlife viewing
areas (Number)
Designated paddle routes for
canoes, kayaks, rafts, drift
boats (Number)
Public access sites to
waterways (Number)
Other:
Amenities
BBQ grills (Number)
Restrooms (Number)
Water fountains (Number)
Parking (Number of spaces)
Other:
Special Features
Archaeological sites*
(Number)
Historical sites & structures*
(Number)
Lakes or ponds (Number)
Prairie remnants (Number)
Rivers or streams (Number)
Wetlands (Number)
Woodlots / Forests (Number)
Other:
Note: This table will need to be expanded to compile data for more than five sites.
*The State Historic Preservation Office is responsible for developing and maintaining inventories of historic
and prehistoric properties in the state. For information please contact:
For above ground historic resources:
Diana Painter, Survey Coordinator, Phone: 503-986-0068, Email: [email protected]
Ian Johnson, Survey Coordinator, Phone: 503-986-0678, Email: [email protected]
For below ground historic resources:
Dennis Griffin, State Archaeologist, Phone: 503-986-0674, Email: [email protected]

35
Form 8:
Community Parklands LOS Analysis
Parkland Type
Total Acres
in
Community
Current
Community
LOS for
Parkland(s)
(Acres/
1,000
population)
Recommended
Oregon LOS
Site Guildline
(Acres/ 1,000
population)
Proposed
Community
LOS Site
Guidline
(Acres/ 1,000
population)
Pocket Parks 0.25 to 0.50
acres
Urban Plaza Parks 0.1 to 0.2
acres
Neighborhood Parks 1.0 to 2.0
acres
Community Parks 2.0 to 6.0
acres
Regional Parks 5.0 to 10.0
acres*
Nature Parks 2.0 to 6.0
acres
Special Use Parks No guideline
recommended
Trails, Pathways and Bikeways 0.5 to 1.5
miles
Regional Sports Parks 5.0 to 10.0
acres
Linear Parks 0.5 to 1.5
acres*
Destination Parks 20.0 to 30.0
acres*
Total Acres 6.25 to 15.0
acres
*LOS based on local-use population estimates. If there is extensive out-of-area visitation to these parks,
recreation providers may consider exceeding these LOS guidelines.

36
Form 9:
Community Facility LOS Analysis
Facility Type
Total
Facilities in
Community
Current
Community
LOS for
Facility
(Facilities/
1,000
population)
Recommended
Oregon LOS
Facility
Guildline
(Facilities/
1,000
population)
Proposed
Community
LOS Facility
Guidline
(Facilities/
1,000
population)
Baseball fields 0.20
Softball fields 0.20
Basketball courts/ multi- use 0.20
Soccer fields 0.20
Golf courses (holes) 0.60
Lacrosse fields 0.15
Equestrian facilities 0.01
Football fields 0.10
Outdoor swimming pools 0.05
Beach areas for swimming 0.10
Volleyball courts 0.20
Tennis courts 0.35
Picnic shelters 0.30
Day-use picnic tables 10.0
Playgrounds 0.40
Skateboard parks 0.04
Off-leash dog parks 0.04
Nature centers 0.03
Amphitheaters 0.03
Disc golf courses 0.02
Boat ramp lanes 0.25
Non-motorized boat launches 0.25
Tent campsites 3.60
RV/ trailer campsites 13.30

37
Form 10:
Accessibility Checklist
1. Is parking in compliance with the Americans with Disabilities Act (ADA)?
2. Does a path of travel from parking, street or sidewalk to the recreation area or facility exist
and meet ADA requirements?
3. Are conveniences (e.g., water fountains) along the path of travel accessible?
4. Is the entrance signed appropriately? Does it meet ADA requirements?
5. Are use areas (e.g., ball fields, spectator areas, concessions, passive areas) able to be used by a
person with a disability?
6. Are use areas designed to encourage and maximize interaction among people with and
without disabilities?
7. Can existing facilities and experiences be modified for use by persons with a disability? Have
such modifications been made?
8. Does the surfacing allow unassisted, unimpeded travel by a person in a wheelchair?
9. When an area and facility is not readily accessible to and usable by a person with a disability
is another area or facility providing similar experiences nearby and accessible?
10. When an area is not readily accessible to and usable by a person with a disability, is this area
scheduled to be made accessible and included in a transition plan?
Source: McGovern, 1992

38
Form 11:
Socio-Economic Information
A. Census data*:
Population
Jurisdiction 1980 1990 2000 2010
County______________
Community:__________
B. What population trends are evident?
C. Is this trend expected to continue? Why?
D. Population age breakdown*:
Under 5 years__________ 45-64 years_______________
5-19 years_____________ 65-84 years________________
20-24 years____________ 85 years and more__________
25-44 years____________
E. What minority groups are present in the community*?
What percentage of the population does each comprise?
F. Does the community have disabled residents with special needs?
G. What are the major types of occupations in the community?
H. What is the average income and income distribution of the population*?
What percentage of the community's households have an income below the poverty
level*?
I. Are there other features of your community that might affect resident's recreation
needs (e.g., single-parent households with children below the poverty level)*?
J. What are the sources of the information entered in this form (e.g., Regional or
County Planning Commission, Center for Population Research and CensusPortland
State University, US Census Bureau)?
* See Appendix P: Oregon Census Data

39
Form 12:
Participation in Outdoor Recreation Activities
Region and county-level survey summary reports are available online at:
http://www.oregon.gov/oprd/PLANS/Pages/ORORDA.aspx
Activity
% of
Population
Participation
in Your
County2
User
Occasions
in Your
County3
% of Population
Participation in
Your SCORP
Planning Region4
User
Occasions in
Your SCORP
Planning
Region5
Baseball/softball
Outdoor court games other than tennis
(basketball, beach volleyball, badminton)
Football, soccer, lacrosse, rugby, ultimate
frisbee
Golf
Horseback riding
Swimming/ playing in outdoor pools/ spray
parks
Beach activities – lake, reservoirs, rivers
Tennis (played outdoors)
Picnicking
General play at a neighborhood park/
playground
Skateboarding, inline skating, roller skating,
roller skiing
Dog walking/ going to dog parks/ off-leash
areas
Visiting nature centers
Attending outdoor concerts, fairs, festivals
Disc golf
Walking on local trails/ paths
Jogging/ running on trails/ paths
Bicycling on paved trails
Power boating (cruising/ water skiing)
Fishing from a boat (other than fly fishing)
Flat-water canoeing, sea kayaking, rowing,
stand-up paddling, tubing / floating
Car camping with a tent
RV/ motorhome/ trailer camping
2 Please record county population participation percentage from Appendix E.
3 Please record county user occasions from Appendix F.
4 Please record region population participation percentage from Appendix G.
5 Please record region user occasions from Appendix H.

40
Form 13:
Priorities For The Future
Region and county-level survey summary reports are available online at:
http://www.oregon.gov/oprd/PLANS/Pages/ORORDA.aspx
Mean For 5-Point Likert (1=”Lowest priority need” and 5= “Highest priority need”)
Item
Statewide
Your
SCORP
Region6
Your
County7
Children’s playgrounds and play areas made of natural
materials (logs, water, sand, boulders, hills, trees) 3.3
Children’s playgrounds and play areas built with
manufactured structures like swing sets, slides, and
climbing apparatuses
2.8
Picnic areas and shelters for small visitor groups 3.3
Picnic areas and shelters for large visitor groups 2.8
Paved / hard surface walking trails and paths 3.0
Dirt / other soft surface walking trails and paths 3.8
Off-street bicycle trails and pathways 3.3
Community gardens 3.0
Nature and wildlife viewing areas 3.4
Multi-use fields for soccer, football, lacrosse, etc. 2.7
Baseball / softball fields 2.4
Outdoor tennis courts 2.2
Basketball courts 2.4
Off-leash dog areas 3.0
Designated paddling routes for canoes, kayaks, rafts,
driftboats 2.8
Public access sites to waterways 3.5
Off-highway vehicle trails / areas 2.5
6 Please record region scores from Appendix K.
7 Please record county scores from Appendix J.

41
Form 14:
Resolution to Adopt the Plan
The following sample resolution can be used by the appropriate elective body to adopt
the completed community park and recreation plan.
WHEREAS, the ________________________________________(Corporate Name)
recognizes the importance of parks and recreation to the quality of life of the residents of
______________, Oregon
WHEREAS, the need to provide quality park and recreation services for residents is
recognized, and
WHEREAS, the importance of sound planning in order to effectively meet the park and
recreation needs of its citizens is understood,
NOW, THEREFORE, BE IT RESOLVED THAT THE ____________________________ does
adopt the Park and Recreation Plan, to be its official plan for the next ___ years, to guide
the provision of park and recreational services in our community.
Passed and signed this ___ day of________________,201__.
ATTEST:
______________________________ _________________________________
President / Mayor Clerk / Secretary

42
Appendix A: Accessibility Mandates
Section 504
The 1973 Federal Rehabilitation Act was amended in 1978 by adding Section 504. This
section prohibits discrimination against individuals with disabilities (mobility, visual,
hearing or mental) in all programs receiving federal financial assistance. Each federal
agency subject to this act has developed and enforces regulations for federally assisted
programs under their authority. Section 504 requires the self-evaluation of facilities and
programs to assess the extent to which regulations are met.
The Americans with Disabilities Act (ADA)
ADA is a comprehensive law that took effect in 1992, making access to recreation and
play settings a guaranteed civil right for all Americans.
Design that approaches site and facility planning from the perspective of use for all, not
just able-bodied users, is called universal design. The key to universal design is awareness
and flexibility in the park environment to meet different accessibility needs.
If an organization's accessibility self-evaluations (See Form 10) indicate that site and facility
modifications are necessary, a transition plan to accomplish the adaptations must be
prepared. Many local organizations have already complied with accessibility
requirements. If your agency has done so, you should briefly describe your evaluation
and findings in the community park and recreation plan. Any necessary structural changes
to park and recreation facilities should be included in the plan's action program.
Facilities constructed with federal or state assistance or located on land acquired with
federal or state assistance must be designed and constructed in conformance with ADA.
For assistance on architectural specifications outlined in ADA and accessibility guidelines
for play areas, recreational facilities and outdoor developed areas contact:
U.S. Architectural & Transportation Barriers Compliance Board
Suite 1000, 1331 F. Street, NW
Washington, D.C. 20004-1111
Phone: 800.872.2253
Website: http://www.access-board.gov/
For accessibility guidance regarding recreational facilities in Oregon contact:
Northwest ADA Center
Center for Continuing Education in Rehabilitation
6912 220th St. SW, Suite 105
Mountlake Terrace, WA. 98043
Phone: 800.494.4232
Email: [email protected]
Website: http://www.dbtacnorthwest.org/

43
Appendix B: Community Map
Base maps of this type are available from the Oregon Department of Transportation.

44
Appendix C: Oregon Parkland Classification System and Suggested Level of
Service Standards
Introduction
The most effective park system to develop and manage is one made up of a variety of different
types of parks, open space areas, and recreational venues, each designed to provide a specific
type of recreation experience or opportunity. A park system that is classified and used properly is
easier to maintain, encounters less conflicts between user groups, and minimizes negative impacts
on adjoining neighbors. A good park classification system also helps assess what facilities are
available for current use and what types of parks will be needed to serve the community in the
future.
A wide variety of parkland classifications typologies can be found throughout the state, region,
and country for the development of park land and open space systems. In order to better assess
the park system and specific parkland needs in Oregon, this chapter includes parkland
classification categories recommended for use in the state. The classification system is intended as
a set of recommended guidelines and not intended as a mandated standard.
When conducting park system planning, park and recreation providers need to not only identify
which parklands and facilities/services are important to community members, but must also
define what constitutes “adequate” provision of parklands. To determine adequacy, park and
recreation providers typically measure existing parklands and facilities and compare them against
established standards, typically Level of Service (LOS) Standards. LOS standards are measures of
the amount of public recreation parklands and facilities being provided to meet that jurisdiction’s
basic needs and expectations. For example, the amount of parkland currently needed in a
particular jurisdiction may be determined by comparing the ratio of existing developed park
acres per 1,000 residents (by all providers within the jurisdiction) to the jurisdiction’s desired level
of parks relative to population. The gap between the two ratios is the currently needed park
acreage. As the population grows, the objective is to provide enough additional acreage to
maintain the jurisdiction’s desired ratio of park acres to 1,000 residents. For the purposes of this
chapter, we will first focus on LOS site guidelines, which are used primarily for estimating acreage
needs for park and recreation jurisdictions, and conclude with LOS facility guidelines for specific
types of recreation facilities. Since the need for non-motorized trails is a top statewide issue, trails,
pathways and bikeways were added to the list of parkland types and measured in trail miles per
1,000 residents. It is important to note that, in addition to LOS quantity standards, other factors
such as quality, condition, location, and convenience (e.g., walking and biking distances) may
also be considered in determining future service need.
Park providers should carefully consider the effects of setting, lowering or raising LOS standards ‒
especially additional operation and maintenance costs for new parklands and facilities. This
decision will affect both the quality of service provided, as well as the amount of investment for
new facilities that is, or will be, needed in the future to provide the desired LOS.
To assist with park system planning in Oregon, this appendix includes recommended Oregon LOS
guidelines for each of the 11 standard parkland classification types along with specific park facility
types. These guidelines were developed after a review of past National Park and Recreation
Association (NRPA) standards, results from a statewide survey of Oregon’s public park and

45
recreation providers, and a benchmarking report completed by Leisure Vision for the Oregon
Recreation and Park Association (ORPA). While these statewide site guidelines provide a useful
framework for evaluating jurisdiction resources, it is recognized that individual jurisdictions will
need to develop their own LOS standards that reflect their unique conditions, resources and
needs.
Parkland Classification System
This classification system applies to all local and state parks, including city, county, regional and
state park systems in Oregon. It does not include federal lands other than state or local parks that
are located on federal lands. For local implementation, parkland standards should be largely
based upon identified purpose and a set of development considerations both of which influenced
by local need, fiscal constraints, and other considerations such as residential and traffic patterns,
road access, convenience, and the availability of land. As a result, every park system will not
need to offer one of all park classification types within their system (i.e., a small community may
not need a Regional Sports Park).
Walking times included in the description below are times that it takes a typical adult to walk to
the park. Park acre size recommendations are based on standard planning practices. However,
there will be situations where development considerations result in a park of a size either smaller
or larger than standard size recommendations.
Pocket Parks
A pocket park is the smallest park classification. Pocket parks provide basic recreation
opportunities on small lots, within residential areas serving an area within approximately 5-10
minutes walking time (approximately ¼ mile). Typically less than two acres in size (¼ to 2 acres),
these parks are designed to serve residents in immediately adjacent neighborhoods. Pocket parks
provide limited recreation amenities, such as playgrounds, benches, and picnic tables. Pocket
parks do not normally provide off-street parking.
Pocket Park in Portland, Oregon
Examples of pocket parks in Oregon include Hillside Park – Grants Pass, Piccolo Park – Portland,
and Thorp Park – Beaverton.

46
Urban Plaza Parks
Urban plaza parks are public gathering spaces in urban spaces that foster community interaction
and civic pride. They are small in size (¼ to 3 acres) and intensely developed. Visitors will tend
to be those who are already in the neighborhood for other purposes, such as shopping, work,
dining and/or those who live in or near densely developed urban areas. Urban plaza parks
typically include amenities such as drinking fountains, benches, litter receptacles, trees and shrubs,
paved walkways and plazas.
Urban Plaza Park in Portland, Oregon
Examples of urban plaza parks in Oregon include Pioneer Courthouse Square – Portland, Park
Blocks – Eugene, Peace Plaza – Salem, and Lovejoy Plaza – Portland.
Neighborhood Parks
Neighborhood parks provide close-to-home recreation opportunities primarily for non-
supervised, non-organized recreation activities. They are located within approximately 5-10
minute walking time (approximately ¼ - ½ mile) without crossing major thoroughfares and/or
other structures and easy bicycling distance of residents. They serve up to a one-half-mile radius,
and are generally 2-20 acres in size (Service area is also influenced by neighborhood
configuration and various geographical and transportation barriers). Neighborhood parks
typically include amenities such as playgrounds, outdoor sports courts, sports fields, picnic tables,
pathways, and multi-use open grass areas. They may or may not provide off-street parking.
Neighborhood parks can, when practical, be located next to elementary schools in order to
provide more efficient use of public resources.
Neighborhood Park in Eugene, Oregon
Examples of neighborhood parks in Oregon include Tyson Park – Springfield, Bush’s Pasture Park
– Salem, Grant Park – Portland, and Forest Hills Park – Beaverton.

47
Community Parks
Community parks are typically larger in size and serve a broader purpose than neighborhood
parks. Their focus is on meeting the recreation needs of several neighborhoods or large sections
of the community, as well as preserving unique landscapes and open spaces. Community parks
are typically 15-100 acres, depending on the spatial requirements of the facilities provided and
the amount of land dedicated to natural resource protection. Community parks provide both
active and passive recreation opportunities that appeal to the entire community serving an area
within approximately 15 minutes driving time. While a community park may be proximate to a
neighborhood and can provide typical neighborhood park amenities, they are normally designed
as a “drive-to sites.” Community parks typically accommodate large numbers of people, and
offer a wide variety of facilities, such as group picnic areas and large shelters, sports fields and
courts, children’s play areas, swimming pools and splash pads, community gardens, extensive
pathway systems, community festival or event space, and green space or natural areas.
Community parks require additional support facilities, such as off-street parking and restrooms
and as such can also serve as regional trailheads.
Community Park in Medford, Oregon
Examples of community parks in Oregon include Willamette Park – Portland, Riverfront Park –
Salem, Bethel Community Park – Eugene, and Hawthorne Park – Medford.
Regional Parks
Regional parks are large parks that provide access to unique natural or cultural features and
regional-scale recreation facilities. Typically 100 acres or more in size, regional parks serve areas
within a 45 minute driving time. These parks often include significant green space to preserve
unique natural areas, riverfront corridors, wetlands, and agricultural or forested areas. Regional
parks may include properties for which there are no immediate development plans and that are
situated in such a way as to primarily serve the surrounding neighborhood (land banked
properties). Regional parks also may accommodate large group activities and often have
infrastructure to support sporting events, festivals, and other revenue-generating events to
enhance the City’s economic vitality and identity. Activities available in regional parks may
include picnicking, boating, fishing, swimming, camping, trail use, etc. Regional parks include
supporting facilities, such as restrooms and parking.

48
Regional Park in Foster, Oregon
Examples of regional parks in Oregon include Alton Baker Park – Eugene, Lithia Park – Ashland,
Shevlin Park – Bend, and Oxbow Regional Park Park – Troutdale.
Nature Parks
Nature parks are lands set aside for preservation of significant natural resources, remnant
landscapes, open space, and visual aesthetics/buffering. They may preserve or protect
environmentally sensitive areas, such as wildlife habitats, stream and creek corridors, or unique
and/or endangered plant species. Nature parks may vary in size from small parcels (less than 10
acres) to large properties of more than 200 acres. Nature parks typically serve a community-wide
population and include greenways, natural areas, and preserves. Public access to natural areas
may be limited at these sites, which often include wetlands, steep hillsides, or other similar spaces.
Some nature parks may be managed secondarily to provide passive recreation opportunities.
These sites may contain trails, interpretive displays, viewpoints, and seating areas.
Nature Park in Beaverton, Oregon
Examples of nature parks in Oregon include Forest Park – Portland, Tualatin Hills Nature Park –
Beaverton, Ridgeline Parks – Eugene, and Mount Talbert Nature Park – Clackamas.
Special Use Parks
The Special Use classification covers a broad range of park and recreation lands that are
specialized or single-purpose in nature. Parks in this category include waterfront or ocean access
parks, boat ramps, memorials, historic sites, waysides, swimming areas, single purpose sites used
for a particular field sport, dog parks, skate parks, display gardens, sites occupied by buildings, or
protect some significant geologic or scenic feature. Special use parks that have a community or
regional draw may require supporting facilities such as parking or restrooms. Park size is
dependent on the special use and can vary from very small to many acres.

49
Special Use Park in Pendleton, Oregon
Examples of special use parks in Oregon include Rudy Rada Skatepark – Pendleton, Veteran’s
Memorial Park - Klamath Falls, River Play Discovery Village – Eugene, and Swan Island Boat
Ramp – Portland.
Trails, Pathways and Bikeways
Trails, pathways, and bikeways include a number of trail types including multi-use, pedestrian,
and soft surface trails to accommodate a variety of activities such as walking, running, biking, dog
walking, rollerblading, skateboarding, and horseback riding. Such trails may be located within
parks or along existing streets and roadways as part of the citywide transportation system. Multi-
use trails are designed for use by pedestrians, bicyclists, skateboarders, wheelchairs, and other
non-motorized vehicle users. These trails are hard surfaced to accommodate bicycles and provide
accessibility for people with disabilities. Hard surfaced pedestrian trails are generally found within
smaller parks and as secondary trails within larger parks. Soft surfaced trails are composed of soft-
surface materials, such as soil, crushed rock, hog fuel, and wood chips. Most soft surfaces do not
provide accessibility for people with disabilities but are preferable for some recreation activities,
such as running and hiking. Trails, pathways, and bikeways may include amenities such as
directional and control signage, gates, benches, overlooks, drinking fountains, lighting, trailhead
kiosks, and interpretive signs.
Park trail in Salem, Oregon
Examples of Trails, Pathways, and Bikeways in Oregon include the Avery Park Trail – Corvallis,
Riverfront Park Trail - Salem, Cathedral Tree Trail – Astoria, and the Trillium Trail – Portland.
Regional Sports Parks
Regional sports parks typically consolidate heavily programmed athletic facilities for activities
such as soccer, football, baseball/softball into a few strategically located sites throughout the
community. Regional sports parks could also include facilities such as race tracks, shooting ranges

50
and equestrian areas. The location of these facilities is important due to the traffic, lighting, and
noise that are often associated with them. They typically require large parking areas and
restroom facilities. They also may have other park amenities, such as play areas or picnic facilities
that serve non-participant family members and others while events are taking place. Regional
sports parks normally require a minimum of 25 acres, with 40-80 acres being optimal.
Regional Sports Park in Beaverton, Oregon
Examples of regional sports parks in Oregon include Big Sky Luke Damon Sports Complex –
Bend, U.S. Cellular Community Park – Medford, Howard M. Terpenning Recreation Complex –
Beaverton, and Sheldon Sports Park – Eugene.
Linear Parks
Linear parks include natural or built corridors that connect parks and neighborhoods, provide
linkages through the city, and preserve open space. Linear parks may include abandoned railroad
lines, utility rights-of-way, wildlife corridors, or elongated natural areas defined by drainage
features or topographical changes, such as riparian corridors. Linear parks typically support trail-
oriented activities, including walking, jogging, biking, skateboarding, and roller skating, which
play a major role in health and fitness. Trails, pathways, and bikeways located in other types of
park settings (e.g., neighborhood, community, natural area parks) where the trail is not the
primary purpose of the park or along existing streets or roadways may be connected to, but are
excluded from this park category. Linear parks typically include amenities such as rest benches,
picnic tables, trailhead kiosks, parking at major trailheads, and way finding markers, but may also
incorporate smaller-scale neighborhood park amenities such as play areas, picnic areas, and
exercise stations. Linear park size is dependent on the corridor length and opportunity.
Linear Park in Central Point, Oregon
Examples of linear parks in Oregon include the Deschutes River Trail – Bend, Bear Creek
Greenway – Medford, Springwater Corridor – Portland, and the Rogue River Greenway –
Central Point.

51
Destination Parks
Destination Parks can include the same characteristics as Regional Parks, Natural Area Parks,
Special Use Parks and Linear Parks, but offer such outstanding natural, historic, scenic or
recreational attractions that visitors travel more than an hour to several days, by car, to reach
them. They are usually well known statewide and even nationally. They can have a wide range
of acreage sizes and levels of development, but generally have a moderate to very intensive level
of visitation. They can be day-use parks or can offer overnight camping or cabins.
Most of the parks in the Oregon State Park system are Destination Parks. Some county and
regional park systems also operate Destination Parks.
Destination Park in Sublimity, Oregon
Examples of destination parks in Oregon include Silver Falls State Park – Sublimity, Tryon Creek
State Park – Portland, Fort Stevens State Park – Hammond, and Smith Rock State Park –
Terrebonne.
Suggested Parkland Level of Service Standards
The recommended total parkland acres site guideline for local park and recreation
jurisdictions in Oregon is 6.25 to 12.5 acres per 1,000 population, which represents a
minimum acreage that should be exceeded when possible. Though these
recommendations are sufficient for the inventory and development of parks in rural and
less densely populated areas, it is more difficult to meet this standard in an urban setting.
Where you have more extensive development, higher population numbers in a small
area, and a lack of available and affordable open space, recreational development must
be planned to accommodate the needs of as large and diverse a user group as possible. It
is important to disperse park opportunities evenly throughout the locality so that each
sector has convenient access to parks and open space. The planning and development
process should also provide as many different kinds of activities as the resources will
allow.
In meeting the 6.25 to 10.5 acres per 1,000 population total parkland site guideline, park
planners should consider each of the 11 park classification types. Each of the parkland
types has its own unique function and service radius within the jurisdiction. The

52
following table summarizes site guidelines for each Oregon parkland type. It is important
to note that site guidelines are for developed parklands.
Summary of the Oregon Parkland Classification System and Suggested LOS Standards
Parkland Type Space
Requirements Service Radius
Recommended
Oregon LOS Site
Guidelines
(Acres/ 1,000
population)
Park Development Features
Pocket Parks ¼ to 2 acres
5-10 minutes walking
time (approximately
¼ mile)
0.25 to 0.50 acres
Limited amenities such as playgrounds,
benches, and picnic tables. They do not
normally provide off street parking.
Urban Plaza
Parks
¼ to 3 acres
Entire community –
visitors tend to be
those who are
already in the
neighborhood for
other purposes, such
as shopping, work,
and dining.
0.1 to 0.2 acres
Intensely developed with amenities
such as drinking fountains, benches,
litter receptacles, trees and shrubs, and
paved walkways and plazas.
Neighborhood
Parks
2 to 20 acres
5-10 minutes walking
time (approximately
¼ - ½ mile)
1.0 to 2.0 acres
Amenities such as playgrounds,
outdoor sports courts, sports fields,
picnic tables, pathways, and multi-use
open grass areas. They may or may not
provide off-street parking.
Community
Parks
15 to 100 acres 15 minute driving
time 2.0 to 6.0 acres
A wide variety of facilities such as off-
street parking, restrooms, group picnic
areas and large shelters, sports fields
and courts, children’s play areas,
swimming pools and splash pads,
community gardens, extensive
pathway systems, community festival
or event space, and green space or
natural areas. They can also serve as
regional trailheads.
Regional Parks 100 acres or
more
45 minute driving
time 5.0 to 10.0 acres*
Often include significant green space to
preserve unique natural areas,
riverfront corridors, wetlands, and
agricultural or forested areas. May
accommodate large group activities
and often have infrastructure to
support sporting events, festivals, and
other revenue-generating events.
Activities available may include
picnicking, boating, fishing, swimming,
camping and trail use. They include
support facilities such as restrooms and
parking.
Nature Parks
Vary in size from
less than 10 acres
to more than
200 acres
Serve a community-
wide population 2.0 to 6.0 acres
Include greenways, natural areas, and
preserves. Sites may contain trails,
interpretive displays, viewpoints, and
seating areas.

53
Parkland Type Space
Requirements Service Radius
Recommended
Oregon LOS Site
Guidelines
(Acres/ 1,000
population)
Park Development Features
Special Use
Parks
Dependent on
the special use
and can vary
from very small
to many acres
Variable No guideline
recommended
Include waterfront or ocean access
parks, boat ramps, memorials, historic
sites, waysides, swimming areas, single
purpose sites used for a particular field
sport, dog parks, skate parks, display
gardens, sites occupied by buildings, or
protect some significant geologic or
scenic feature. Those with a
community or regional draw may
require support facilities such as
parking or restrooms.
Trails, Pathways
and Bikeways
Variable.
Function of
available parks,
natural areas,
open spaces or
other public
properties where
trails could be a
component
Serve community-
wide population
0.5 to 1.5 miles
per 1,000
population
Include a number of trail types (multi-
use, pedestrian, and soft surface trails)
to accommodate a variety of activities
such as walking, running, biking, dog
walking, rollerblading, skateboarding,
and horseback riding. May include
amenities such as directional and
control signage, gates, benches,
overlooks, drinking fountains, lighting,
trailhead kiosks, and interpretive signs.
Regional Sports
Parks
Minimum of 25
acres, with 40-80
acres being
optimal
Serve community or
region-wide
population
5.0 to 10.0 acres
Consolidate heavily programmed
athletic facilities for activities such as
soccer, football, baseball/softball into
strategically located sites. They
typically require large parking areas
and restroom facilities. May have other
park amenities such as play areas or
picnic facilities serving non-participant
family members.
Linear Parks
Dependent on
the corridor
length and
opportunity.
Serve community or
region-wide
population
0.5 to 1.5 acres*
May include natural or built corridors
that connect parks and neighborhoods,
provide linkages through the city, and
preserve open space. Typically support
trail-oriented activities including
walking, jogging, biking,
skateboarding, and roller skating.
Typically include amenities such as rest
benches, picnic tables, trailhead kiosks,
and way finding markers, but may also
incorporate smaller-scale
neighborhood park amenities such as
play areas, picnic areas, and exercise
stations.
Destination
Parks
Wide range of
acreage sizes
Serve a region, state,
or nation-wide
population. More
than an hour to
several days driving
time
20.0 to 30.0
acres*
Include the same facilities and activities
as regional or natural area parks, but
offer outstanding natural, historic,
scenic, or recreational attractions. They
can be day-use parks or can offer
overnight camping or cabins.
* LOS based on local-use population estimates. If there is extensive out-of-area visitation to these parks,
recreation providers may consider exceeding these LOS guidelines.

54
Suggested LOS Facility Guidelines
Acreage alone does not assure a well-balanced park system. Sites should be designed and
developed with a balance of facilities according to the recommended classification type.
Therefore, a proper relationship in the size, number, location, and type of facilities
developed for each park site is critical to a relevant system for parks and recreation in
Oregon communities. The following table includes suggested facility guidelines for
recreation facilities in Oregon communities.
Suggested Oregon LOS Facility Guidelines
Name of Facility
Recommended
Oregon LOS
Facility
Guidelines
(Facilities/ 1,000
population)
Baseball fields 0.20
Softball fields 0.20
Basketball courts/multi-use 0.20
Soccer fields 0.20
Golf courses (holes) 0.60
Lacrosse fields 0.15
Equestrian facilities 0.01
Football fields 0.10
Outdoor swimming pools 0.05
Beach areas for swimming 0.10
Volleyball courts 0.20
Tennis courts 0.35
Picnic shelters 0.30
Day-use picnic tables 10.00
Playgrounds 0.40
Skateboard parks 0.04
Off-leash dog parks 0.04
Nature centers 0.03
Amphitheaters 0.03
Disc golf courses 0.02
Boat ramp lanes 0.25
Non-motorized boat
launches 0.25
Tent campsites 3.60
RV/trailer campsites 13.30
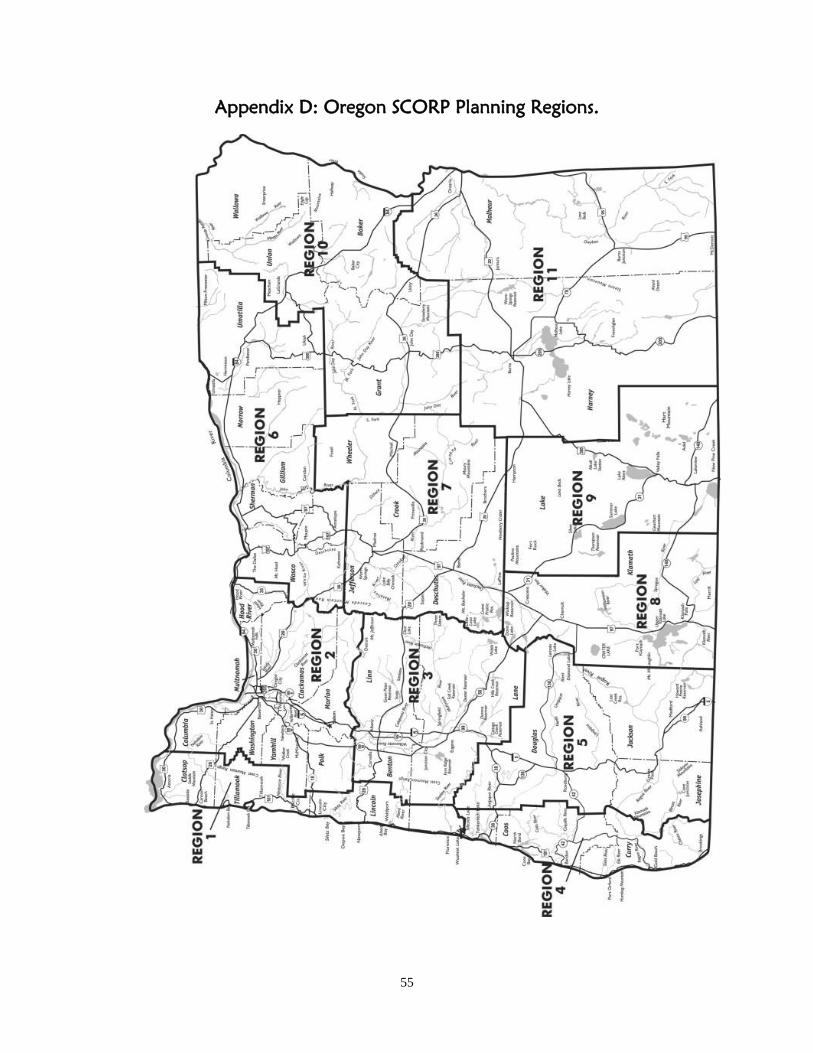
55
Appendix D: Oregon SCORP Planning Regions.

56
Appendix E: Percent of Population Participating in Outdoor Recreation Activities, Oregon Counties, 2011.
Activity Baker Benton Clackamas Clatsop Columbia Coos Crook Curry Deschutes
Non-motorized Trail Activities
Walking on local streets / sidewalks 79.7 72.8 58.0 64.2 62.9 64.6 58.5 59.1 74.5
Walking on local trails / paths 74.1 69.7 56.3 61.7 49.0 57.8 50.7 61.2 69.6
Walking / day hiking on non-local trails / paths 53.9 53.8 45.0 42.5 34.6 39.6 40.0 38.4 53.2
Long-distance hiking (back packing) 38.5 18.3 7.9 9.5 7.9 9.8 9.4 5.9 21.8
Jogging / running on streets / sidewalks 26.9 22.4 15.8 10.6 12.5 10.2 14.2 5.6 22.3
Jogging / running on trails / paths 25.1 20.0 9.3 10.6 10.3 10.1 11.4 3.6 20.0
Horseback riding 16.2 4.0 5.7 4.5 7.3 5.5 6.5 4.4 4.1
Bicycling on unpaved trails 16.0 17.0 6.6 10.2 6.0 10.6 11.7 7.5 25.0
Bicycling on paved trails 17.9 32.9 20.9 28.0 15.2 15.0 15.2 10.1 31.0
Bicycling on roads, streets / sidewalks 45.8 42.7 22.3 28.0 26.2 21.1 25.4 18.6 36.7
Bicycle touring on paved roads / paths (long day / multi-
day rides) 5.9 18.1 14.6 11.7 12.9 3.3 9.8 6.4 22.4
Motorized Activities
Class I – All-terrain vehicle riding (3 & 4 wheel ATVs,
straddle seat and handle bars) 32.1 9.6 8.8 11.1 17.6 29.4 18.3 15.0 12.9
Class II – Off-road 4-wheel driving (jeeps, pick-ups,
dune buggies, SUVs) 37.2 9.7 8.4 8.8 16.4 30.7 13.8 17.5 12.9
Class III – Off-road motorcycling 5.9 2.5 4.1 2.3 4.6 8.7 3.4 3.5 6.2
Class IV – Riding UTVs / side-by-side ATVs (non-
straddle seat, driver and passenger sit side-by-side in the
vehicle, steering wheel for steering control)
6.5 1.3 1.2 1.1 5.6 7.5 5.4 1.2 3.3
Snowmobiling 17.3 3.2 1.5 1.7 3.9 1.8 2.2 1.9 10.0
Personal water craft – jet ski 4.7 3.4 3.3 2.1 6.3 4.9 1.4 3.1 11.3
Power boating (cruising / water skiing) 19.7 17.5 16.2 17.5 26.0 24.7 26.4 16.7 23.1
Non-motorized Snow Activities
Downhill (alpine) skiing / snowboarding 16.6 23.0 14.7 9.7 10.4 9.5 7.8 2.8 20.2
Cross-country / Nordic skiing / skijoring on groomed
trails 4.8 6.2 4.3 1.9 2.4 1.7 2.5 1.3 14.4
Cross-country / Nordic skiing / skijoring on ungroomed
trails / off designated trails 6.2 6.1 2.1 3.2 <1.0 1.6 4.9 1.1 7.9
Snowshoeing 14.6 9.4 5.5 3.6 4.6 4.3 8.6 1.1 19.0
Sledding, tubing, or general snow play 45.6 29.5 24.6 21.4 24.0 17.8 18.9 16.1 35.4
Outdoor Leisure / Sporting Activities
Sightseeing / driving or motorcycling for pleasure 69.4 55.3 52.9 61.6 64.7 61.4 64.7 57.8 59.8
Picnicking 66.6 52.0 46.1 50.4 51.6 50.3 37.3 46.7 53.4
General play at a neighborhood park / playground 41.9 46.3 39.2 35.6 48.6 44.9 37.6 35.2 46.6
Dog walking / going to dog parks / off-leash areas 36.2 31.7 27.4 32.3 26.4 28.5 24.4 32.5 41.1

57
Activity Baker Benton Clackamas Clatsop Columbia Coos Crook Curry Deschutes
Relaxing, hanging out, escaping heat / noise, etc. 52.8 57.8 44.9 52.6 56.2 52.7 46.9 49.1 57.4
Attending outdoor concerts, fairs, festivals 49.4 60.2 49.0 43.0 51.4 36.5 49.1 46.1 59.6
Tennis (played outdoors) 5.5 8.0 4.6 2.7 2.0 2.9 4.1 5.2 8.9
Outdoor court games other than tennis (basketball,
beach volleyball, badminton, etc.) 13.8 10.9 10.0 7.4 6.6 6.1 3.4 4.9 11.0
Baseball / softball 16.4 12.8 6.7 8.7 10.9 5.3 7.9 8.7 6.9
Football, soccer, lacrosse, rugby, ultimate frisbee 20.7 16.5 7.8 5.5 20.4 4.6 7.9 6.3 8.7
Golf 10.1 13.3 14.6 10.5 8.9 10.8 9.2 11.9 15.7
Disc golf 1.7 15.2 6.5 4.9 9.5 10.3 2.0 4.4 5.6
Skateboarding, inline skating, roller skating, roller
skiing 4.2 2.4 3.0 4.8 7.4 2.1 2.3 4.2 9.3
Rock climbing, bouldering, mountaineering 13.2 5.6 1.7 2.0 2.0 4.0 2.0 4.7 15.9
Orienteering, geocaching 2.2 5.7 4.0 5.2 4.8 5.1 4.2 4.3 11.5
Hang gliding, sky diving, paragliding <1.0 <1.0 <1.0 1.5 <1.0 <1.0 <1.0 <1.0 <1.0
Visiting historic sites / history-themed parks (history-
oriented museums, outdoor displays, visitor centers,
etc.)
47.2 40.2 42.0 57.5 61.8 29.0 40.0 45.3 43.8
Nature Study Activities
Bird watching 13.1 16.5 9.7 21.8 15.7 13.2 17.1 21.5 18.1
Whale watching 2.5 19.4 12.0 17.9 10.0 26.4 10.0 30.8 8.4
Exploring tidepools 12.4 39.8 27.7 32.1 27.6 39.0 19.7 41.9 32.0
Other nature / wildlife / forest / wildflower observation 39.3 37.5 22.3 33.1 32.6 24.3 23.0 35.7 31.1
Visiting botanical gardens 3.7 13.9 9.4 7.5 10.2 31.5 5.1 13.3 9.0
Visiting nature centers 6.3 18.3 12.1 9.4 13.2 15.6 6.9 11.5 16.6
Outdoor photography, painting, drawing 19.9 19.8 13.6 18.7 17.9 15.8 12.9 21.3 17.9
Collecting (rocks, plants, mushrooms, berries) 47.3 24.0 13.0 32.8 28.8 37.2 20.0 36.3 21.9
Vehicle-based Camping Activities
RV / motorhome / trailer camping 44.9 15.8 17.4 19.8 28.5 43.9 40.9 32.6 29.8
Car camping with a tent 45.0 40.9 31.2 22.5 36.1 32.4 23.1 22.2 39.9
Motorcycle camping with a tent <1.0 1.5 1.5 <1.0 <1.0 3.3 1.0 2.7 5.0
Yurts / camper cabins 6.4 8.8 6.5 5.6 5.4 4.9 3.0 5.4 4.5
Fishing, Hunting, Shooting Activities
Fly fishing 11.3 4.4 3.2 3.8 2.5 9.1 7.4 7.1 13.0
Fishing from a boat (other than fly fishing) 29.5 18.2 14.6 22.5 20.5 22.6 16.2 22.2 21.1
Fishing from a bank or shore (other than fly fishing) 49.5 16.4 12.4 25.0 23.7 24.1 25.5 22.7 19.4
Crabbing 6.4 10.4 11.3 23.6 15.5 28.8 5.0 16.8 11.1
Shellfishing / clamming 3.3 4.4 6.9 26.6 17.6 14.0 1.8 13.6 2.6
Big game hunting with a gun 29.1 6.4 7.1 12.2 15.0 15.8 19.2 12.9 8.7
Big game hunting with a bow 13.2 1.4 1.9 3.3 3.1 1.9 5.6 2.5 2.5
Waterfowl hunting 3.8 1.7 2.0 4.8 4.2 2.3 2.0 1.0 2.5

58
Activity Baker Benton Clackamas Clatsop Columbia Coos Crook Curry Deschutes
Upland bird or small game hunting 19.6 2.7 2.9 4.5 5.1 2.3 6.2 3.7 3.6
Target / skeet shooting / archery 23.2 10.5 7.1 10.9 8.6 19.2 16.5 17.8 18.2
Non-motorized Water-based and Beach Activities
White-water canoeing, kayaking, rafting 9.7 11.1 11.1 6.1 7.0 22.4 9.5 16.0 13.5
Flat-water canoeing, sea kayaking, rowing, stand-up
paddling, tubing / floating 8.9 14.4 11.2 11.0 9.7 24.7 11.0 16.0 31.5
Surfing / ocean stand-up paddling <1.0 2.1 <1.0 4.0 2.9 <1.0 <1.0 2.6 4.2
Windsurfing / kiteboarding <1.0 <1.0 <1.0 <1.0 <1.0 <1.0 <1.0 1.7 <1.0
Sailing <1.0 3.0 2.8 2.2 5.0 1.3 <1.0 1.0 <1.0
Beach activities – ocean 25.2 60.1 51.4 61.7 56.9 53.5 28.0 53.6 48.1
Beach activities – lakes, reservoirs, rivers 33.5 28.4 29.0 38.3 31.7 31.9 29.4 33.6 55.3
Swimming / playing in outdoor pools / spray parks 16.0 21.5 18.9 11.8 22.0 12.1 10.8 11.3 27.8
Snorkeling / SCUBA diving 1.1 1.9 <1.0 <1.0 1.4 2.0 1.9 2.2 1.0
*Values reported for Gilliam, Grant, Harney, Lake, Morrow, Sherman, Wallowa and Wheeler Counties are respective SCORP Regional values due to low samples sizes
for these counties.

59
Activity Douglas Gilliam* Grant* Harney* Hood
River Jackson Jefferson Josephine Klamath
Non-motorized Trail Activities
Walking on local streets / sidewalks 61.6 61.8 76.1 56.7 67.5 67.7 64.8 63.3 57.9
Walking on local trails / paths 53.2 52.2 63.7 35.2 63.6 65.8 57.0 63.0 53.5
Walking / day hiking on non-local trails / paths 40.7 36.4 49.4 27.1 55.0 47.1 50.8 45.9 37.5
Long-distance hiking (back packing) 9.8 7.1 26.3 6.4 18.3 12.3 10.2 9.5 14.1
Jogging / running on streets / sidewalks 6.1 10.0 20.2 14.0 24.1 14.8 14.5 15.3 12.7
Jogging / running on trails / paths 4.5 7.2 14.5 7.2 23.5 12.7 11.1 12.0 14.2
Horseback riding 7.3 10.8 18.9 15.5 3.9 7.0 10.2 6.7 7.0
Bicycling on unpaved trails 8.9 11.2 15.4 7.8 28.7 14.4 13.5 9.9 17.7
Bicycling on paved trails 17.4 16.6 18.4 5.1 33.1 22.5 18.5 14.0 25.0
Bicycling on roads, streets / sidewalks 21.4 25.6 37.0 21.5 40.4 28.2 21.0 21.3 23.0
Bicycle touring on paved roads / paths (long day /
multi-day rides) 11.4 8.3 8.5 10.2 27.3 15.1 6.5 8.7 11.6
Motorized Activities
Class I – All-terrain vehicle riding (3 & 4 wheel
ATVs, straddle seat and handle bars) 19.3 25.2 40.1 35.5 4.8 10.3 19.3 10.2 21.1
Class II – Off-road 4-wheel driving (jeeps, pick-
ups, dune buggies, SUVs) 24.5 17.0 35.1 20.1 10.1 8.4 14.5 16.3 16.6
Class III – Off-road motorcycling 5.3 4.4 10.1 6.1 3.7 5.5 3.3 5.6 3.9
Class IV – Riding UTVs / side-by-side ATVs
(non-straddle seat, driver and passenger sit side-
by-side in the vehicle, steering wheel for steering
control)
7.4 4.7 8.8 9.2 1.1 1.4 2.4 1.2 5.6
Snowmobiling 4.4 9.3 18.7 7.1 2.9 2.2 2.7 3.2 5.9
Personal water craft – jet ski 3.0 4.9 5.4 3.4 5.1 2.6 4.5 9.0 6.6
Power boating (cruising / water skiing) 23.3 16.6 26.9 21.8 14.0 17.0 18.7 16.5 21.6
Non-motorized Snow Activities
Downhill (alpine) skiing / snowboarding 7.4 9.0 16.3 8.2 37.1 12.0 10.6 7.7 10.8
Cross-country / Nordic skiing / skijoring on groomed
trails 1.0 1.9 7.2 1.6 20.1 6.5 3.3 1.0 2.0
Cross-country / Nordic skiing / skijoring on
ungroomed trails / off designated trails <1.0 1.1 7.3 1.8 13.6 4.4 3.7 1.7 4.8
Snowshoeing 2.1 5.8 16.4 2.5 21.7 8.7 5.4 1.6 11.9
Sledding, tubing, or general snow play 31.4 35.4 44.8 30.7 30.5 21.6 26.8 25.2 37.5
Outdoor Leisure / Sporting Activities
Sightseeing / driving or motorcycling for pleasure 66.8 58.6 73.6 56.3 51.5 57.3 64.2 59.4 56.5
Picnicking 46.5 50.8 72.7 49.6 42.3 53.3 58.5 62.5 48.3
General play at a neighborhood park / playground 43.1 46.3 53.9 36.7 39.6 47.3 43.5 37.2 37.4
Dog walking / going to dog parks / off-leash areas 29.5 29.1 33.6 17.7 30.4 19.9 22.2 28.6 26.5

60
Activity Douglas Gilliam* Grant* Harney* Hood
River Jackson Jefferson Josephine Klamath
Relaxing, hanging out, escaping heat / noise, etc. 50.9 46.4 61.2 41.7 57.3 55.1 44.7 53.3 44.7
Attending outdoor concerts, fairs, festivals 56.2 40.8 53.0 31.2 60.3 54.3 47.5 57.8 34.4
Tennis (played outdoors) 4.0 11.7 5.7 4.4 9.9 9.2 4.0 9.2 3.2
Outdoor court games other than tennis (basketball,
beach volleyball, badminton, etc.) 8.2 13.3 14.0 9.8 5.7 8.5 6.1 16.7 6.7
Baseball / softball 6.5 10.4 16.5 8.9 7.8 6.5 13.4 18.2 10.1
Football, soccer, lacrosse, rugby, ultimate frisbee 13.4 9.3 16.7 11.0 13.6 7.2 5.7 7.2 8.0
Golf 10.1 12.6 10.1 11.5 12.4 11.0 16.5 14.7 14.0
Disc golf 9.6 6.5 7.9 1.5 7.3 3.4 6.4 15.0 4.5
Skateboarding, inline skating, roller skating, roller
skiing 3.1 5.9 4.4 5.5 7.4 2.4 4.5 4.7 2.3
Rock climbing, bouldering, mountaineering 3.6 2.0 10.0 3.2 8.7 3.3 3.1 3.5 4.9
Orienteering, geocaching 3.2 4.6 4.4 3.1 6.3 2.4 5.3 13.0 3.6
Hang gliding, sky diving, paragliding <1.0 <1.0 <1.0 <1.0 <1.0 <1.0 <1.0 <1.0 <1.0
Visiting historic sites / history-themed parks (history-
oriented museums, outdoor displays, visitor centers,
etc.)
39.0 45.9 48.9 40.5 43.8 40.8 52.1 49.3 37.9
Nature Study Activities
Bird watching 13.2 12.6 23.5 18.8 15.9 17.9 16.4 19.0 30.8
Whale watching 17.5 8.7 7.8 10.6 10.0 16.6 8.3 20.1 11.5
Exploring tidepools 31.1 18.5 18.7 15.7 32.2 36.6 16.7 28.3 21.8
Other nature / wildlife / forest / wildflower
observation 28.4 23.0 40.9 19.6 34.2 33.1 20.5 35.9 27.6
Visiting botanical gardens 22.0 5.0 6.3 3.5 10.2 12.5 8.9 19.0 6.8
Visiting nature centers 10.6 7.3 8.6 7.0 13.6 13.9 12.8 21.4 15.4
Outdoor photography, painting, drawing 19.9 12.5 21.4 14.7 18.7 19.7 18.4 24.2 19.6
Collecting (rocks, plants, mushrooms, berries) 30.4 27.6 47.1 20.7 21.0 24.9 21.0 30.1 24.2
Vehicle-based Camping Activities
RV / motorhome / trailer camping 31.7 35.8 41.9 31.4 19.6 19.1 44.9 24.2 34.9
Car camping with a tent 31.1 28.8 39.8 27.8 33.8 36.6 24.8 39.2 36.4
Motorcycle camping with a tent 1.2 2.6 1.2 1.5 1.2 <1.0 1.0 1.1 1.6
Yurts / camper cabins 8.0 8.5 5.1 6.5 6.5 12.5 3.3 10.4 9.1
Fishing, Hunting, Shooting Activities
Fly fishing 2.6 5.7 11.9 4.7 6.3 5.5 9.5 5.4 11.6
Fishing from a boat (other than fly fishing) 23.8 18.7 29.8 22.6 16.9 13.4 25.3 21.3 30.1
Fishing from a bank or shore (other than fly fishing) 26.4 30.3 46.2 39.5 11.6 16.2 27.9 25.6 35.4
Crabbing 21.6 9.3 9.3 5.0 7.4 12.6 8.1 16.0 9.9
Shellfishing / clamming 5.5 5.1 3.5 2.5 6.4 3.7 2.4 2.2 5.4
Big game hunting with a gun 17.0 15.6 36.9 22.7 8.6 7.4 16.5 12.5 19.7

61
Activity Douglas Gilliam* Grant* Harney* Hood
River Jackson Jefferson Josephine Klamath
Big game hunting with a bow 2.5 3.6 16.4 8.0 1.3 2.7 3.7 3.1 4.9
Waterfowl hunting <1.0 2.8 7.9 4.6 1.3 3.1 1.2 1.6 8.2
Upland bird or small game hunting 4.0 6.7 19.5 15.0 2.1 3.8 5.6 5.3 10.5
Target / skeet shooting / archery 22.0 14.4 29.1 23.5 11.3 12.4 13.1 13.4 16.4
Non-motorized Water-based and Beach Activities
White-water canoeing, kayaking, rafting 11.2 8.9 12.4 5.3 14.3 28.7 9.9 29.4 16.3
Flat-water canoeing, sea kayaking, rowing, stand-up
paddling, tubing / floating 15.8 10.1 11.6 2.8 19.7 10.5 10.1 10.7 11.3
Surfing / ocean stand-up paddling <1.0 <1.0 <1.0 <1.0 6.7 1.5 <1.0 1.0 <1.0
Windsurfing / kiteboarding <1.0 <1.0 <1.0 <1.0 14.1 <1.0 <1.0 <1.0 <1.0
Sailing 1.3 <1.0 1.3 <1.0 7.6 3.2 <1.0 4.1 <1.0
Beach activities – ocean 50.7 31.1 34.3 25.3 42.8 51.9 36.2 47.4 35.0
Beach activities – lakes, reservoirs, rivers 37.2 26.8 33.6 19.3 39.1 31.8 33.3 43.2 33.5
Swimming / playing in outdoor pools / spray parks 18.8 28.8 19.7 17.3 11.7 22.7 15.8 13.5 12.8
Snorkeling / SCUBA diving 4.3 <1.0 1.5 <1.0 <1.0 1.7 <1.0 1.6 1.6
*Values reported for Gilliam, Grant, Harney, Lake, Morrow, Sherman, Wallowa and Wheeler Counties are respective SCORP Regional values due to low samples sizes
for these counties.

62
Percent of Population Participating in Outdoor Recreation Activities, Oregon Counties, 2011, continued. Activity Lake* Lane Lincoln Linn Malheur Marion Morrow* Multnomah Polk
Non-motorized Trail Activities
Walking on local streets / sidewalks 58.5 65.2 63.8 60.6 54.1 72.7 61.8 74.8 74.5
Walking on local trails / paths 53.4 57.6 58.3 54.8 31.1 70.3 52.2 65.1 64.6
Walking / day hiking on non-local trails / paths 39.3 47.4 41.1 39.2 23.4 50.4 36.4 55.4 51.3
Long-distance hiking (back packing) 14.2 8.8 8.0 7.4 5.4 11.8 7.1 12.4 12.8
Jogging / running on streets / sidewalks 13.6 14.7 10.7 10.4 15.3 18.9 10.0 24.1 18.0
Jogging / running on trails / paths 14.0 11.9 11.1 7.9 7.3 13.9 7.2 20.4 13.2
Horseback riding 7.6 2.1 5.6 3.5 14.6 3.7 10.8 2.7 3.9
Bicycling on unpaved trails 17.3 10.9 6.9 14.3 6.9 11.9 11.2 11.4 10.2
Bicycling on paved trails 23.5 27.0 8.5 20.9 4.7 25.3 16.6 28.4 18.7
Bicycling on roads, streets / sidewalks 23.1 33.5 18.1 30.7 20.2 29.8 25.6 38.3 28.7
Bicycle touring on paved roads / paths (long day / multi-day
rides) 11.6 9.9 8.9 6.0 10.0 15.6 8.3 22.7 10.0
Motorized Activities
Class I – All-terrain vehicle riding (3 & 4 wheel ATVs,
straddle seat and handle bars) 21.8 5.9 8.6 16.8 35.7 10.6 25.2 1.5 13.3
Class II – Off-road 4-wheel driving (jeeps, pick-ups, dune
buggies, SUVs) 19.1 9.6 9.3 14.2 19.4 6.1 17.0 4.9 7.8
Class III – Off-road motorcycling 5.0 2.8 2.6 4.2 7.2 1.2 4.4 1.3 1.7
Class IV – Riding UTVs / side-by-side ATVs (non-straddle
seat, driver and passenger sit side-by-side in the vehicle,
steering wheel for steering control)
5.7 1.7 2.9 2.4 9.4 <1.0 4.7 <1.0 <1.0
Snowmobiling 6.7 1.5 <1.0 3.7 6.6 1.6 9.3 3.0 2.4
Personal water craft – jet ski 6.3 4.2 3.3 6.9 3.6 6.7 4.9 2.1 7.0
Power boating (cruising / water skiing) 21.2 15.1 13.9 24.8 25.6 16.9 16.6 9.1 17.8
Non-motorized Snow Activities
Downhill (alpine) skiing / snowboarding 11.5 14.8 6.9 13.7 8.5 13.9 9.0 19.6 13.5
Cross-country / Nordic skiing / skijoring on groomed trails 2.3 4.1 3.8 <1.0 1.3 1.0 1.9 8.5 2.7
Cross-country / Nordic skiing / skijoring on ungroomed trails /
off designated trails 5.3 4.7 2.4 <1.0 <1.0 1.4 1.1 4.4 1.3
Snowshoeing 11.9 6.1 3.0 4.3 1.9 9.5 5.8 13.3 3.2
Sledding, tubing, or general snow play 38.1 19.6 13.9 31.2 30.8 35.8 35.4 22.1 20.8
Outdoor Leisure / Sporting Activities
Sightseeing / driving or motorcycling for pleasure 57.6 63.1 58.7 62.1 53.7 63.4 58.6 51.3 54.6
Picnicking 49.0 54.4 47.3 50.8 47.0 47.5 50.8 47.0 44.9
General play at a neighborhood park / playground 38.4 47.2 38.2 45.6 35.1 54.5 46.3 55.0 48.2
Dog walking / going to dog parks / off-leash areas 27.1 26.5 33.2 29.8 16.5 34.3 29.1 35.0 36.3
Relaxing, hanging out, escaping heat / noise, etc. 45.3 58.2 53.9 56.7 39.2 50.6 46.4 55.0 57.8
Attending outdoor concerts, fairs, festivals 36.7 53.3 40.7 42.5 29.0 54.0 40.8 55.2 61.8

63
Activity Lake* Lane Lincoln Linn Malheur Marion Morrow* Multnomah Polk
Tennis (played outdoors) 3.3 6.1 5.4 3.4 4.6 9.0 11.7 14.4 10.2
Outdoor court games other than tennis (basketball, beach
volleyball, badminton, etc.) 8.6 7.2 7.9 8.7 10.3 12.7 13.3 11.9 13.9
Baseball / softball 9.7 10.6 7.7 5.5 9.0 10.4 10.4 5.7 7.1
Football, soccer, lacrosse, rugby, ultimate frisbee 11.9 7.9 6.4 6.7 12.3 13.5 9.3 10.8 6.4
Golf 13.5 9.3 11.7 8.7 12.3 6.6 12.6 7.2 7.7
Disc golf 4.1 4.9 4.4 6.1 <1.0 13.4 6.5 4.9 10.6
Skateboarding, inline skating, roller skating, roller skiing 2.1 4.2 7.1 3.9 5.8 3.8 5.9 5.0 5.0
Rock climbing, bouldering, mountaineering 5.4 4.0 1.6 2.8 2.4 4.4 2.0 3.4 2.9
Orienteering, geocaching 4.1 3.9 4.9 4.7 3.0 3.8 4.6 4.0 6.5
Hang gliding, sky diving, paragliding <1.0 <1.0 <1.0 <1.0 <1.0 <1.0 <1.0 2.8 <1.0
Visiting historic sites / history-themed parks (history-oriented
museums, outdoor displays, visitor centers, etc.) 39.2 43.5 48.8 41.0 40.8 49.0 45.9 40.8 40.3
Nature Study Activities
Bird watching 29.0 13.3 23.8 13.2 14.4 11.3 12.6 12.2 16.1
Whale watching 10.6 13.9 34.2 12.2 10.9 17.6 8.7 10.5 17.3
Exploring tidepools 21.3 31.1 47.6 27.8 15.8 27.0 18.5 30.7 40.2
Other nature / wildlife / forest / wildflower observation 29.5 30.3 36.5 28.9 16.2 27.1 23.0 26.1 30.0
Visiting botanical gardens 6.2 13.2 11.5 8.9 3.9 15.9 5.0 16.7 13.1
Visiting nature centers 13.8 16.2 18.9 10.3 6.4 11.9 7.3 17.3 11.7
Outdoor photography, painting, drawing 19.3 17.3 23.5 20.3 13.4 14.9 12.5 15.9 18.1
Collecting (rocks, plants, mushrooms, berries) 26.1 26.6 36.0 25.5 18.6 14.0 27.6 20.8 24.7
Vehicle-based Camping Activities
RV / motorhome / trailer camping 34.5 18.1 19.4 31.0 31.7 21.8 35.8 8.3 23.0
Car camping with a tent 37.9 34.6 27.1 32.5 25.4 32.4 28.8 38.6 43.0
Motorcycle camping with a tent 1.4 1.7 1.2 2.3 1.8 <1.0 2.6 <1.0 1.2
Yurts / camper cabins 8.6 5.8 4.5 10.8 7.4 11.5 8.5 8.8 6.9
Fishing, Hunting, Shooting Activities
Fly fishing 11.8 6.9 5.0 5.3 3.5 4.7 5.7 6.4 6.1
Fishing from a boat (other than fly fishing) 30.2 19.6 19.3 22.8 21.5 16.7 18.7 7.0 15.6
Fishing from a bank or shore (other than fly fishing) 36.5 21.9 21.8 25.3 38.2 13.0 30.3 11.0 18.1
Crabbing 9.2 19.4 24.3 17.5 4.8 14.0 9.3 6.2 14.1
Shellfishing / clamming 5.1 3.3 11.7 5.7 1.5 1.3 5.1 3.1 5.0
Big game hunting with a gun 20.5 9.8 10.4 15.9 19.2 6.4 15.6 1.8 10.4
Big game hunting with a bow 5.3 2.8 1.8 3.3 7.5 1.2 3.6 <1.0 <1.0
Waterfowl hunting 8.7 2.7 <1.0 2.8 5.2 1.0 2.8 1.1 1.1
Upland bird or small game hunting 11.4 3.9 2.7 5.4 16.4 1.0 6.7 1.7 2.8
Target / skeet shooting / archery 21.7 11.5 11.7 13.6 24.7 7.6 14.4 5.1 10.9

64
Non-motorized Water-based and Beach Activities
White-water canoeing, kayaking, rafting 14.8 13.1 10.0 9.4 5.3 10.6 8.9 9.2 13.1
Flat-water canoeing, sea kayaking, rowing, stand-up
paddling, tubing / floating 12.4 13.1 12.0 10.5 2.6 7.2 10.1 11.7 8.1
Surfing / ocean stand-up paddling <1.0 1.0 3.0 <1.0 <1.0 1.9 <1.0 2.1 <1.0
Windsurfing / kiteboarding <1.0 <1.0 <1.0 <1.0 <1.0 <1.0 <1.0 <1.0 <1.0
Sailing <1.0 1.8 4.1 <1.0 1.1 <1.0 <1.0 1.9 <1.0
Beach activities – ocean 34.0 52.5 55.3 55.9 24.6 64.6 31.1 56.7 68.0
Beach activities – lakes, reservoirs, rivers 32.9 39.6 34.0 33.7 18.1 30.2 26.8 31.9 31.2
Swimming / playing in outdoor pools / spray parks 14.3 16.8 8.4 23.7 18.3 22.7 28.8 20.5 16.2
Snorkeling / SCUBA diving 1.4 1.3 <1.0 1.2 <1.0 1.7 <1.0 <1.0 3.1
*Values reported for Gilliam, Grant, Harney, Lake, Morrow, Sherman, Wallowa and Wheeler Counties are respective SCORP Regional values due to low samples sizes
for these counties.

65
Activity Sherman* Tillamook Umatilla Union Wallowa* Wasco Washington Wheeler* Yamhill
Non-motorized Trail Activities
Walking on local streets / sidewalks 61.8 53.5 62.3 77.1 76.1 62.3 66.9 56.4 57.3
Walking on local trails / paths 52.2 59.8 53.0 61.9 63.7 53.7 59.9 28.3 48.5
Walking / day hiking on non-local trails /
paths 36.4 34.4 36.6 49.2 49.4 38.9 47.7 31.9 45.8
Long-distance hiking (back packing) 7.1 4.6 5.8 20.5 26.3 10.6 15.7 8.2 9.3
Jogging / running on streets / sidewalks 10.0 7.2 9.2 17.3 20.2 12.4 25.3 15.6 15.5
Jogging / running on trails / paths 7.2 5.4 6.6 9.1 14.5 10.2 19.3 10.0 9.6
Horseback riding 10.8 6.5 12.6 16.8 18.9 6.5 8.7 4.9 7.9
Bicycling on unpaved trails 11.2 10.9 13.1 18.1 15.4 9.2 14.8 2.9 9.4
Bicycling on paved trails 16.6 12.1 15.4 20.5 18.4 24.1 30.6 1.5 24.6
Bicycling on roads, streets / sidewalks 25.6 22.8 28.3 37.3 37.0 21.9 35.6 15.9 31.5
Bicycle touring on paved roads / paths (long
day / multi-day rides) 8.3 5.9 7.0 10.7 8.5 13.7 21.2 8.3 12.9
Motorized Activities
Class I – All-terrain vehicle riding (3 & 4
wheel ATVs, straddle seat and handle bars) 25.2 16.4 28.4 42.7 40.1 16.3 4.3 19.1 10.8
Class II – Off-road 4-wheel driving (jeeps,
pick-ups, dune buggies, SUVs) 17.0 13.6 17.5 34.3 35.1 14.2 6.8 3.9 9.5
Class III – Off-road motorcycling 4.4 4.6 4.1 12.5 10.1 4.4 1.9 3.0 2.8
Class IV – Riding UTVs / side-by-side ATVs
(non-straddle seat, driver and passenger sit
side-by-side in the vehicle, steering wheel for
steering control)
4.7 <1.0 3.8 10.6 8.8 2.1 <1.0 <1.0 2.0
Snowmobiling 9.3 1.4 11.6 21.7 18.7 2.0 1.7 <1.0 1.4
Personal water craft – jet ski 4.9 1.1 5.9 5.9 5.4 3.8 3.6 <1.0 4.3
Power boating (cruising / water skiing) 16.6 13.6 16.4 32.7 26.9 16.2 12.0 6.4 13.3
Non-motorized Snow Activities
Downhill (alpine) skiing / snowboarding 9.0 6.7 8.1 16.7 16.3 10.5 23.8 19.6 12.1
Cross-country / Nordic skiing / skijoring on
groomed trails 1.9 2.0 1.4 10.9 7.2 3.0 3.9 2.0 4.0
Cross-country / Nordic skiing / skijoring on
ungroomed trails / off designated trails 1.1 <1.0 <1.0 7.0 7.3 2.3 2.9 5.4 1.1
Snowshoeing 5.8 1.5 5.6 19.8 16.4 7.4 6.5 6.3 4.8
Sledding, tubing, or general snow play 35.4 13.1 38.9 46.0 44.8 28.9 17.9 27.7 27.4
Outdoor Leisure / Sporting Activities
Sightseeing / driving or motorcycling for
pleasure 58.6 58.0 58.7 72.9 73.6 55.7 57.8 39.1 53.5
Picnicking 50.8 43.7 53.3 75.6 72.7 46.3 49.1 37.2 52.0

66
Activity Sherman* Tillamook Umatilla Union Wallowa* Wasco Washington Wheeler* Yamhill
General play at a neighborhood park /
playground 46.3 31.5 46.5 64.8 53.9 43.8 48.3 23.4 53.5
Dog walking / going to dog parks / off-leash
areas 29.1 21.4 30.2 34.9 33.6 26.6 27.6 32.0 27.1
Relaxing, hanging out, escaping heat / noise,
etc. 46.4 40.9 46.4 66.8 61.2 46.6 53.9 30.7 52.0
Attending outdoor concerts, fairs, festivals 40.8 37.0 38.1 54.3 53.0 47.0 48.9 35.5 44.3
Tennis (played outdoors) 11.7 3.9 15.3 5.1 5.7 4.2 10.2 12.0 6.2
Outdoor court games other than tennis
(basketball, beach volleyball, badminton,
etc.)
13.3 6.6 14.3 12.9 14.0 7.9 14.4 5.9 6.3
Baseball / softball 10.4 5.5 9.8 18.0 16.5 11.2 10.4 9.8 8.7
Football, soccer, lacrosse, rugby, ultimate
frisbee 9.3 3.7 6.8 18.7 16.7 13.8 12.4 6.3 12.5
Golf 12.6 9.9 12.8 10.6 10.1 8.2 18.9 5.2 10.1
Disc golf 6.5 1.8 5.5 13.6 7.9 10.2 8.1 6.3 8.5
Skateboarding, inline skating, roller skating,
roller skiing 5.9 2.9 7.3 4.9 4.4 3.8 4.4 <1.0 4.0
Rock climbing, bouldering, mountaineering 2.0 1.5 <1.0 10.4 10.0 5.3 5.9 6.3 2.9
Orienteering, geocaching 4.6 3.3 3.3 6.0 4.4 9.1 4.9 12.7 3.8
Hang gliding, sky diving, paragliding <1.0 <1.0 <1.0 <1.0 <1.0 1.0 2.2 <1.0 1.4
Visiting historic sites / history-themed parks
(history-oriented museums, outdoor displays,
visitor centers, etc.)
45.9 44.2 48.1 50.0 48.9 41.8 43.6 28.3 44.3
Nature Study Activities
Bird watching 12.6 24.4 12.3 30.3 23.5 14.0 10.2 15.0 14.9
Whale watching 8.7 26.6 7.7 10.0 7.8 11.4 11.2 <1.0 23.5
Exploring tidepools 18.5 38.6 18.1 23.8 18.7 21.0 27.6 14.7 37.3
Other nature / wildlife / forest / wildflower
observation 23.0 30.4 23.0 40.5 40.9 20.8 26.6 21.7 29.3
Visiting botanical gardens 5.0 11.9 5.2 9.3 6.3 4.5 13.5 2.0 10.7
Visiting nature centers 7.3 16.9 7.4 8.3 8.6 6.7 18.3 4.7 18.4
Outdoor photography, painting, drawing 12.5 20.0 11.6 22.8 21.4 14.8 13.5 18.2 14.6
Collecting (rocks, plants, mushrooms,
berries) 27.6 31.7 29.8 48.6 47.1 24.4 9.7 27.6 22.2
Vehicle-based Camping Activities
RV / motorhome / trailer camping 35.8 26.5 37.4 40.6 41.9 26.3 8.7 32.0 27.6
Car camping with a tent 28.8 25.7 26.1 42.0 39.8 37.4 31.7 30.3 34.7
Motorcycle camping with a tent 2.6 1.8 3.4 1.2 1.2 1.0 1.8 <1.0 1.6
Yurts / camper cabins 8.5 2.8 9.4 5.1 5.1 6.5 5.4 2.0 10.8
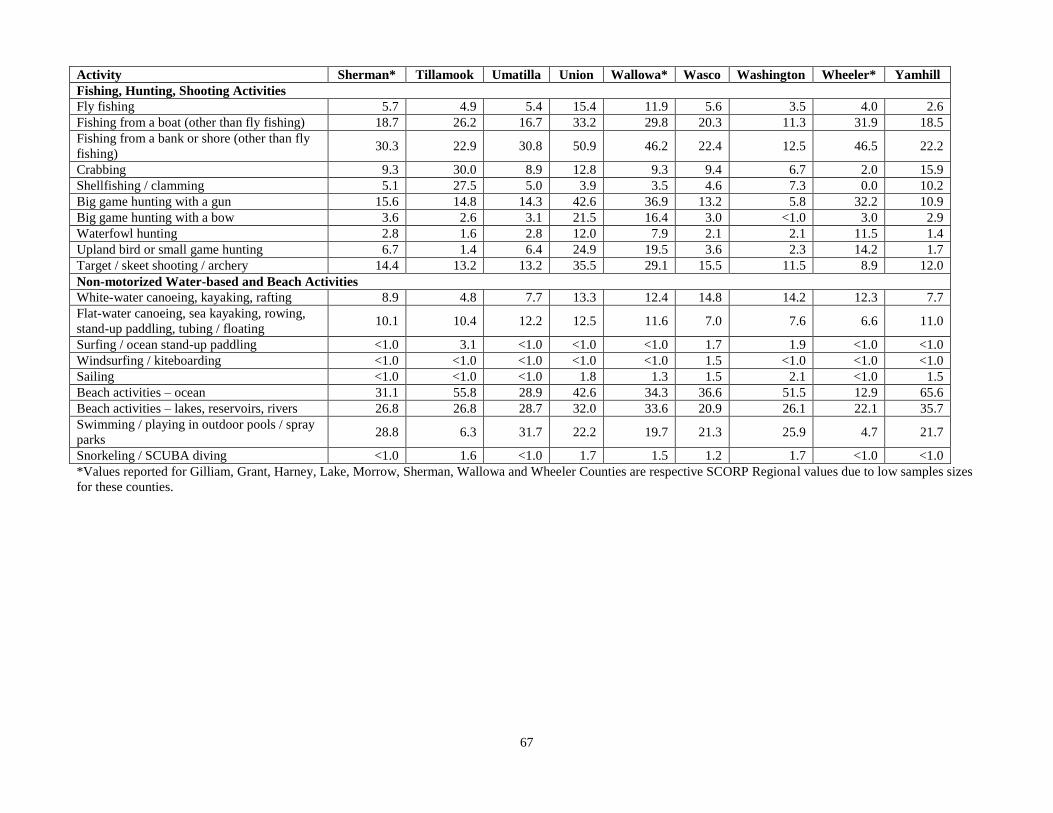
67
Activity Sherman* Tillamook Umatilla Union Wallowa* Wasco Washington Wheeler* Yamhill
Fishing, Hunting, Shooting Activities
Fly fishing 5.7 4.9 5.4 15.4 11.9 5.6 3.5 4.0 2.6
Fishing from a boat (other than fly fishing) 18.7 26.2 16.7 33.2 29.8 20.3 11.3 31.9 18.5
Fishing from a bank or shore (other than fly
fishing) 30.3 22.9 30.8 50.9 46.2 22.4 12.5 46.5 22.2
Crabbing 9.3 30.0 8.9 12.8 9.3 9.4 6.7 2.0 15.9
Shellfishing / clamming 5.1 27.5 5.0 3.9 3.5 4.6 7.3 0.0 10.2
Big game hunting with a gun 15.6 14.8 14.3 42.6 36.9 13.2 5.8 32.2 10.9
Big game hunting with a bow 3.6 2.6 3.1 21.5 16.4 3.0 <1.0 3.0 2.9
Waterfowl hunting 2.8 1.6 2.8 12.0 7.9 2.1 2.1 11.5 1.4
Upland bird or small game hunting 6.7 1.4 6.4 24.9 19.5 3.6 2.3 14.2 1.7
Target / skeet shooting / archery 14.4 13.2 13.2 35.5 29.1 15.5 11.5 8.9 12.0
Non-motorized Water-based and Beach Activities
White-water canoeing, kayaking, rafting 8.9 4.8 7.7 13.3 12.4 14.8 14.2 12.3 7.7
Flat-water canoeing, sea kayaking, rowing,
stand-up paddling, tubing / floating 10.1 10.4 12.2 12.5 11.6 7.0 7.6 6.6 11.0
Surfing / ocean stand-up paddling <1.0 3.1 <1.0 <1.0 <1.0 1.7 1.9 <1.0 <1.0
Windsurfing / kiteboarding <1.0 <1.0 <1.0 <1.0 <1.0 1.5 <1.0 <1.0 <1.0
Sailing <1.0 <1.0 <1.0 1.8 1.3 1.5 2.1 <1.0 1.5
Beach activities – ocean 31.1 55.8 28.9 42.6 34.3 36.6 51.5 12.9 65.6
Beach activities – lakes, reservoirs, rivers 26.8 26.8 28.7 32.0 33.6 20.9 26.1 22.1 35.7
Swimming / playing in outdoor pools / spray
parks 28.8 6.3 31.7 22.2 19.7 21.3 25.9 4.7 21.7
Snorkeling / SCUBA diving <1.0 1.6 <1.0 1.7 1.5 1.2 1.7 <1.0 <1.0
*Values reported for Gilliam, Grant, Harney, Lake, Morrow, Sherman, Wallowa and Wheeler Counties are respective SCORP Regional values due to low samples sizes
for these counties.

68
Appendix F: User Occasions by Activity in Oregon Counties Where Occurred, 2011.
Non-motorized Trail or Related Activities
County
Walking on local streets /
sidewalks
Walking on local trails /
paths
Walking / day hiking on
non-local trails / paths
Long-distance hiking
(backpacking)
Jogging / running on streets
/ sidewalks
# % # % # % # % # %
Baker 1,386,270 <1% 614,385 1% 303,737 1% 41,853 1% 501,942 1%
Benton 21,202,522 5% 7,227,822 6% 3,008,077 7% 116,435 3% 5,286,603 8%
Clackamas 29,253,655 8% 7,148,333 6% 3,963,481 10% 403,243 9% 4,755,087 7%
Clatsop 3,720,619 1% 1,629,869 1% 893,743 2% 153,718 3% 420,170 1%
Columbia 3,722,610 1% 1,184,928 1% 184,854 <1% 13,269 <1% 396,638 1%
Coos 4,821,142 1% 2,168,049 2% 1,251,010 3% 30,763 1% 551,757 1%
Crook 967,951 <1% 364,131 <1% 119,762 <1% 18,679 <1% 171,218 <1%
Curry 1,710,757 <1% 938,364 1% 328,944 1% 20,205 <1% 148,759 <1%
Deschutes 14,727,615 4% 11,237,435 9% 3,276,188 8% 617,452 14% 2,174,641 3%
Douglas 6,508,849 2% 2,091,957 2% 681,374 2% 149,890 3% 578,985 1%
Gilliam 194,328 <1% 38,904 <1% <1,000 <1% <1,000 <1% <1,000 <1%
Grant 743,322 <1% 203,210 <1% 1,111,258 3% 21,843 <1% 116,045 <1%
Harney 369,876 <1% 141,769 <1% 162,641 <1% 10,930 <1% 33,778 <1%
Hood River 2,079,104 1% 887,732 1% 1,540,578 4% 163,374 4% 365,029 1%
Jackson 16,254,394 4% 5,619,676 5% 2,384,296 6% 811,704 18% 2,544,572 4%
Jefferson 966,676 <1% 380,445 <1% 384,255 1% 77,321 2% 194,202 <1%
Josephine 6,261,026 2% 1,418,540 1% 447,961 1% 64,615 1% 882,373 1%
Klamath 4,548,217 1% 1,865,675 2% 608,746 2% 176,068 4% 647,410 1%
Lake 511,616 <1% 199,284 <1% 102,923 <1% 7,053 <1% 71,103 <1%
Lane 28,303,125 7% 10,025,646 8% 3,117,720 8% 485,916 11% 3,302,786 5%
Lincoln 4,437,537 1% 1,317,397 1% 1,550,976 4% 14,088 <1% 376,084 1%
Linn 10,732,980 3% 2,798,795 2% 646,819 2% 30,669 1% 616,764 1%
Malheur 1,986,914 1% 372,194 <1% 119,612 <1% 17,286 <1% 431,959 1%
Marion 23,614,016 6% 7,136,002 6% 2,152,780 5% 173,235 4% 2,324,921 3%
Morrow 581,868 <1% 105,460 <1% 50,417 <1% 1,940 <1% 93,099 <1%
Multnomah 119,544,889 31% 33,631,567 28% 6,725,626 17% 199,715 4% 27,528,213 41%
Polk 4,768,423 1% 1,222,461 1% 306,391 1% 1,945 <1% 608,756 1%
Sherman 154,689 <1% 25,661 <1% <1,000 <1% <1,000 <1% <1,000 <1%
Tillamook 1,642,142 <1% 964,517 1% 973,390 2% 92,021 2% 52,740 <1%
Umatilla 6,305,623 2% 1,288,922 1% 260,732 1% 22,090 <1% 1,167,604 2%
Union 3,503,480 1% 699,769 1% 362,521 1% 113,166 3% 511,480 1%
Wallowa 775,660 <1% 224,769 <1% 147,816 <1% 107,891 2% 78,690 <1%
Wasco 2,166,734 1% 460,304 <1% 278,280 1% 10,731 <1% 110,234 <1%
Washington 50,015,549 13% 13,636,046 11% 2,613,927 6% 277,433 6% 9,166,337 14%
Wheeler 124,547 <1% <1,000 <1% 28,873 <1% <1,000 <1% <1,000 <1%
Yamhill 7,884,409 2% 2,095,836 2% 156,353 <1% 1,224 <1% 950,707 1%
Total 386,493,133 121,365,856 40,246,062 4,447,768 67,160,686

69
County
Jogging / running on trails /
paths Horseback riding Bicycling on unpaved trails Bicycling on paved trails
Bicycling on roads, streets,
sidewalks
# % # % # % # % # %
Baker 133,209 <1% 200,731 2% 54,100 <1% 146,224 <1% 432,036 <1%
Benton 3,479,504 11% 125,530 1% 658,329 4% 4,374,898 11% 8,326,776 9%
Clackamas 1,521,214 5% 1,114,532 11% 426,078 3% 862,654 2% 2,848,907 3%
Clatsop 364,865 1% 94,616 1% 102,967 1% 432,029 1% 683,467 1%
Columbia 279,335 1% 131,721 1% 329,807 2% 261,480 1% 728,239 1%
Coos 230,274 1% 199,692 2% 207,190 1% 415,815 1% 904,123 1%
Crook 47,109 <1% 86,715 1% 28,090 <1% 65,011 <1% 205,574 <1%
Curry 121,301 <1% 76,342 1% 100,718 1% 62,279 <1% 174,365 <1%
Deschutes 2,660,552 8% 4,088,719 42% 1,237,823 8% 5,653,773 14% 3,547,849 4%
Douglas 442,004 1% 194,885 2% 67,454 <1% 466,221 1% 1,274,906 1%
Gilliam <1,000 <1% <1,000 <1% <1,000 <1% <1,000 <1% 44,894 <1%
Grant 47,431 <1% 28,979 <1% 3,137 <1% 14,449 <1% 79,167 <1%
Harney 17,474 <1% 83,444 1% 38,461 <1% <1,000 <1% 53,828 <1%
Hood River 254,186 1% 35,209 <1% 408,037 3% 257,041 1% 689,640 1%
Jackson 1,091,418 3% 337,301 3% 655,001 4% 2,029,518 5% 3,204,324 4%
Jefferson 88,254 <1% 54,995 1% 65,618 <1% 102,909 <1% 197,044 <1%
Josephine 445,858 1% 11,877 <1% 203,397 1% 407,103 1% 1,035,571 1%
Klamath 743,646 2% 133,661 1% 409,339 3% 417,445 1% 835,650 1%
Lake 23,852 <1% 59,820 1% 28,609 <1% 11,327 <1% 81,669 <1%
Lane 2,174,831 7% 136,693 1% 1,216,551 8% 5,269,383 14% 8,612,779 10%
Lincoln 165,722 1% 44,052 <1% 74,018 1% 57,727 <1% 392,275 <1%
Linn 337,653 1% 54,482 1% 207,015 1% 845,259 2% 2,989,932 3%
Malheur 154,937 <1% 703,709 7% 45,788 <1% 28,570 <1% 587,652 1%
Marion 502,700 2% 410,726 4% 289,893 2% 1,171,126 3% 4,157,994 5%
Morrow 32,105 <1% 21,626 <1% 11,810 <1% 26,012 <1% 129,334 <1%
Multnomah 11,248,598 35% 42,545 <1% 5,957,298 40% 10,864,451 28% 32,721,855 37%
Polk 193,743 1% 39,304 <1% 57,797 <1% 142,993 <1% 924,021 1%
Sherman <1,000 <1% 12,179 <1% <1,000 <1% <1,000 <1% <1,000 <1%
Tillamook 34,052 <1% 45,882 <1% 80,025 1% 54,488 <1% 136,581 <1%
Umatilla 130,614 <1% 229,560 2% 82,452 1% 164,498 <1% 1,438,659 2%
Union 108,505 <1% 232,101 2% 169,738 1% 283,424 1% 990,422 1%
Wallowa 26,919 <1% 175,750 2% 16,179 <1% 6,879 <1% 96,088 <1%
Wasco 75,497 <1% 87,091 1% 59,692 <1% 198,549 1% 383,061 <1%
Washington 4,830,263 15% 323,439 3% 1,351,680 9% 3,484,027 9% 6,982,282 8%
Wheeler <1,000 <1% <1,000 <1% <1,000 <1% <1,000 <1% 3,858 <1%
Yamhill 185,171 1% 97,311 1% 122,342 1% 443,579 1% 1,914,359 2%
Total 32,192,793 9,715,218 14,766,435 39,021,140 87,809,182

70
Motorized Activities
County
Class I – All-terrain vehicle
riding
Class II – Off-road 4-wheel
driving
Class III – Off-road
motorcycling
Class IV – Riding UTVs or
side-by-side ATVs Snowmobiling
# % # % # % # % # %
Baker 317,788 3% 365,867 5% 43,517 1% 32,895 2% 75,807 8%
Benton 76,178 1% 178,443 2% 104,327 3% <1,000 <1% <1,000 <1%
Clackamas 744,803 8% 336,916 5% 247,187 7% 25,022 2% 6,009 1%
Clatsop 135,281 1% 111,794 2% 2,035 <1% 26,318 2% <1,000 <1%
Columbia 75,646 1% 83,985 1% 13,237 <1% 2,098 <1% <1,000 <1%
Coos 1,151,243 12% 944,646 13% 206,821 6% 516,611 32% <1,000 <1%
Crook 89,038 1% 47,451 1% 12,035 <1% 11,538 1% <1,000 <1%
Curry 144,084 2% 82,652 1% 11,242 <1% <1,000 <1% <1,000 <1%
Deschutes 366,183 4% 251,479 4% 188,354 5% 104,345 7% 360,913 38%
Douglas 401,538 4% 575,978 8% 87,765 2% 140,021 9% 63,829 7%
Gilliam 7,151 <1% <1,000 <1% <1,000 <1% <1,000 <1% <1,000 <1%
Grant 138,093 1% 106,154 1% 21,143 1% 22,667 1% 9,245 1%
Harney 95,978 1% 62,845 1% <1,000 <1% 20,673 1% <1,000 <1%
Hood River 56,640 1% 103,788 1% 17,454 <1% <1,000 <1% 16,851 2%
Jackson 432,108 5% 161,937 2% 402,097 11% 28,652 2% 14,969 2%
Jefferson 114,451 1% 52,834 1% 14,757 <1% <1,000 <1% 1,325 <1%
Josephine 86,475 1% 194,988 3% 153,927 4% <1,000 <1% 18,167 2%
Klamath 341,856 4% 181,897 3% 43,477 1% 64,884 4% 79,756 8%
Lake 168,891 2% 252,236 4% 22,545 1% 6,772 <1% 7,267 1%
Lane 819,075 9% 668,728 9% 1,358,246 37% 105,918 7% 13,874 1%
Lincoln 125,371 1% 49,326 1% 36,075 1% 23,388 1% <1,000 <1%
Linn 273,797 3% 158,472 2% 31,278 1% 55,166 3% 17,361 2%
Malheur 446,570 5% 236,264 3% 150,071 4% 99,801 6% 7,326 1%
Marion 687,559 7% 82,816 1% 4,904 <1% 36,770 2% <1,000 <1%
Morrow 63,205 1% 32,099 <1% 10,731 <1% 49,636 3% 8,261 1%
Multnomah 81,638 1% 108,302 2% 21,875 1% <1,000 <1% 1,637 <1%
Polk 93,534 1% 15,053 <1% 5,627 <1% <1,000 <1% 1,168 <1%
Sherman <1,000 <1% 12,532 <1% <1,000 <1% <1,000 <1% <1,000 <1%
Tillamook 369,513 4% 386,453 5% 281,018 8% 7,277 <1% <1,000 <1%
Umatilla 374,923 4% 119,478 2% 18,938 1% 74,119 5% 90,805 10%
Union 541,218 6% 718,115 10% 43,014 1% 23,185 1% 58,581 6%
Wallowa 235,908 2% 259,206 4% 46,270 1% 30,716 2% 87,916 9%
Wasco 98,375 1% 59,925 1% 18,854 1% <1,000 <1% 1,488 <1%
Washington 206,541 2% 102,697 1% <1,000 <1% <1,000 <1% <1,000 <1%
Wheeler 23,130 <1% 6,931 <1% <1,000 <1% <1,000 <1% <1,000 <1%
Yamhill 104,617 1% 71,669 1% 9,934 <1% 84,553 5% <1,000 <1%
Total 9,488,396 7,183,955 3,628,755 1,593,024 943,416
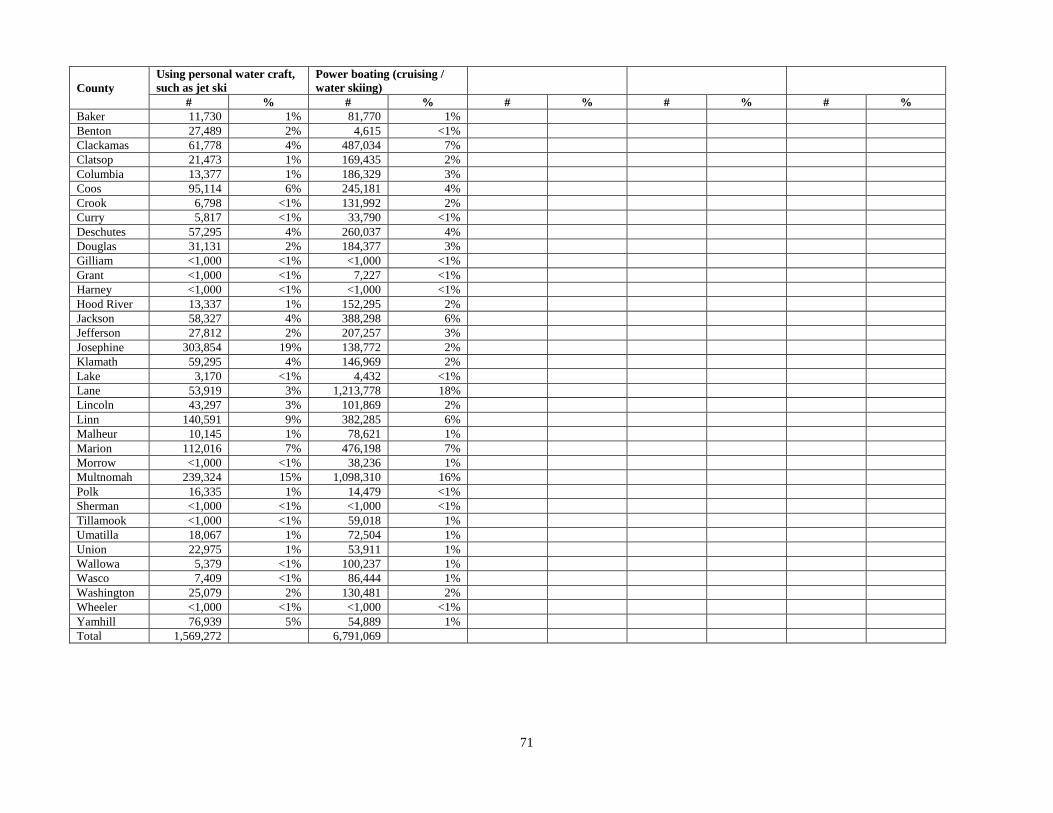
71
County
Using personal water craft,
such as jet ski
Power boating (cruising /
water skiing)
# % # % # % # % # %
Baker 11,730 1% 81,770 1%
Benton 27,489 2% 4,615 <1%
Clackamas 61,778 4% 487,034 7%
Clatsop 21,473 1% 169,435 2%
Columbia 13,377 1% 186,329 3%
Coos 95,114 6% 245,181 4%
Crook 6,798 <1% 131,992 2%
Curry 5,817 <1% 33,790 <1%
Deschutes 57,295 4% 260,037 4%
Douglas 31,131 2% 184,377 3%
Gilliam <1,000 <1% <1,000 <1%
Grant <1,000 <1% 7,227 <1%
Harney <1,000 <1% <1,000 <1%
Hood River 13,337 1% 152,295 2%
Jackson 58,327 4% 388,298 6%
Jefferson 27,812 2% 207,257 3%
Josephine 303,854 19% 138,772 2%
Klamath 59,295 4% 146,969 2%
Lake 3,170 <1% 4,432 <1%
Lane 53,919 3% 1,213,778 18%
Lincoln 43,297 3% 101,869 2%
Linn 140,591 9% 382,285 6%
Malheur 10,145 1% 78,621 1%
Marion 112,016 7% 476,198 7%
Morrow <1,000 <1% 38,236 1%
Multnomah 239,324 15% 1,098,310 16%
Polk 16,335 1% 14,479 <1%
Sherman <1,000 <1% <1,000 <1%
Tillamook <1,000 <1% 59,018 1%
Umatilla 18,067 1% 72,504 1%
Union 22,975 1% 53,911 1%
Wallowa 5,379 <1% 100,237 1%
Wasco 7,409 <1% 86,444 1%
Washington 25,079 2% 130,481 2%
Wheeler <1,000 <1% <1,000 <1%
Yamhill 76,939 5% 54,889 1%
Total 1,569,272 6,791,069

72
Non-motorized Snow Activities
County
Downhill (alpine) skiing /
snowboarding
Cross-country / Nordic
skiing / skijoling on
groomed trails
Cross-country / Nordic
skiing / skijoling on
ungroomed trails or off
designated trails
Snowshoeing Sledding, tubing, general snow
play
# % # % # % # % # %
Baker 83,332 1% 18,627 2% 8,734 1% 33,187 3% 75,281 2%
Benton <1,000 <1% <1,000 <1% 1,668 <1% 1,944 <1% 70,335 2%
Clackamas 1,774,887 28% 115,702 13% 106,901 16% 196,685 19% 551,123 13%
Clatsop <1,000 <1% <1,000 <1% <1,000 <1% <1,000 <1% 29,228 1%
Columbia 2,397 <1% 2,492 <1% <1,000 <1% <1,000 <1% 39,371 1%
Coos <1,000 <1% <1,000 <1% <1,000 <1% <1,000 <1% 18,377 <1%
Crook <1,000 <1% <1,000 <1% 4,600 1% <1,000 <1% 10,291 <1%
Curry <1,000 <1% <1,000 <1% <1,000 <1% <1,000 <1% 5,312 <1%
Deschutes 1,927,253 30% 346,554 40% 229,157 34% 203,364 20% 748,328 18%
Douglas 6,792 <1% 1,258 <1% 6,580 1% 7,027 1% 125,738 3%
Gilliam <1,000 <1% <1,000 <1% <1,000 <1% <1,000 <1% <1,000 <1%
Grant <1,000 <1% <1,000 <1% 1,291 <1% <1,000 <1% 25,924 1%
Harney <1,000 <1% <1,000 <1% 2,612 <1% <1,000 <1% 18,322 <1%
Hood River 1,642,604 26% 177,542 21% 87,750 13% 183,909 18% 370,950 9%
Jackson 248,762 4% 49,593 6% 59,474 9% 23,564 2% 131,623 3%
Jefferson 37,831 1% <1,000 <1% 2,916 <1% 5,133 <1% 59,561 1%
Josephine 15,996 <1% <1,000 <1% 1,887 <1% 7,204 1% 63,450 2%
Klamath 41,005 1% 11,240 1% 20,389 3% 73,491 7% 102,676 2%
Lake 12,972 <1% <1,000 <1% 1,568 <1% 2,575 <1% 17,693 <1%
Lane 235,637 4% 94,020 11% 103,866 15% 186,086 18% 320,179 8%
Lincoln <1,000 <1% <1,000 <1% <1,000 <1% <1,000 <1% 11,104 <1%
Linn 55,358 1% 8,985 1% 14,741 2% 3,902 <1% 121,997 3%
Malheur 8,398 <1% <1,000 <1% <1,000 <1% <1,000 <1% 93,358 2%
Marion 10,951 <1% 9,885 1% 3,772 1% 15,268 1% 206,243 5%
Morrow <1,000 <1% <1,000 <1% <1,000 <1% <1,000 <1% 18,397 <1%
Multnomah 236,992 4% 11,863 1% <1,000 <1% 30,850 3% 234,157 6%
Polk <1,000 <1% <1,000 <1% <1,000 <1% <1,000 <1% 42,008 1%
Sherman <1,000 <1% <1,000 <1% <1,000 <1% <1,000 <1% 4,097 <1%
Tillamook <1,000 <1% <1,000 <1% <1,000 <1% <1,000 <1% 21,815 1%
Umatilla 8,409 <1% 1,197 <1% 4,514 1% 9,090 1% 102,656 2%
Union 56,526 1% 13,202 2% 11,749 2% 33,685 3% 171,834 4%
Wallowa 13,532 <1% <1,000 <1% 8,714 1% 6,453 1% 94,225 2%
Wasco <1,000 <1% <1,000 <1% <1,000 <1% 9,703 1% 58,481 1%
Washington <1,000 <1% <1,000 <1% <1,000 <1% <1,000 <1% 120,619 3%
Wheeler <1,000 <1% <1,000 <1% <1,000 <1% <1,000 <1% <1,000 <1%
Yamhill <1,000 <1% <1,000 <1% <1,000 <1% <1,000 <1% 34,757 1%
Total 6,420,325 862,734 682,881 1,034,870 4,119,510

73
Outdoor Leisure and Sporting Activities
County
Sightseeing / driving or
motorcycling for pleasure Picnicking
General play at a
neighborhood park /
playground
Dog walking / going to dog
parks / off-leash areas
Relaxing, hanging out,
escaping heat / noise, etc.
# % # % # % # % # %
Baker 351,701 1% 192,377 1% 160,326 <1% 538,749 1% 436,603 1%
Benton 1,109,969 2% 386,765 2% 1,814,512 3% 4,239,446 4% 2,491,932 3%
Clackamas 2,893,600 6% 2,621,670 13% 6,731,166 9% 8,837,299 8% 6,891,721 9%
Clatsop 2,691,679 6% 380,320 2% 473,094 1% 1,138,564 1% 1,881,919 2%
Columbia 2,349,553 5% 142,566 1% 1,202,892 2% 997,290 1% 671,970 1%
Coos 1,257,292 3% 443,801 2% 894,026 1% 1,202,281 1% 1,403,950 2%
Crook 250,275 1% 60,024 <1% 87,223 <1% 193,108 <1% 279,861 <1%
Curry 418,663 1% 196,365 1% 184,468 <1% 587,924 1% 1,016,344 1%
Deschutes 2,206,758 5% 724,194 3% 1,581,253 2% 3,628,798 3% 4,140,522 5%
Douglas 1,369,424 3% 460,474 2% 732,341 1% 1,568,821 1% 2,157,627 3%
Gilliam 37,389 <1% <1,000 <1% <1,000 <1% <1,000 <1% <1,000 <1%
Grant 192,696 <1% 48,674 <1% 266,562 <1% 222,110 <1% 231,479 <1%
Harney 222,260 <1% 68,596 <1% 99,081 <1% 137,263 <1% 207,103 <1%
Hood River 781,723 2% 162,714 1% 274,112 <1% 752,870 1% 800,505 1%
Jackson 1,820,600 4% 940,258 5% 2,476,561 3% 2,429,734 2% 3,132,262 4%
Jefferson 252,557 1% 70,778 <1% 114,745 <1% 167,737 <1% 464,802 1%
Josephine 1,017,169 2% 466,116 2% 1,441,448 2% 788,959 1% 2,173,852 3%
Klamath 669,360 1% 451,493 2% 700,671 1% 1,273,549 1% 1,869,988 2%
Lake 262,329 1% 100,491 <1% 35,781 <1% 96,455 <1% 187,923 <1%
Lane 5,306,364 11% 2,880,041 14% 7,458,638 10% 9,526,924 9% 8,290,263 11%
Lincoln 2,093,709 4% 824,997 4% 315,096 <1% 1,049,240 1% 1,978,770 3%
Linn 1,306,301 3% 478,495 2% 1,926,261 3% 2,985,967 3% 3,467,504 5%
Malheur 254,665 1% 97,644 <1% 408,497 1% 389,405 <1% 534,152 1%
Marion 3,136,912 7% 1,296,761 6% 4,625,631 6% 7,397,653 7% 4,537,367 6%
Morrow 111,764 <1% 35,487 <1% 108,800 <1% 142,158 <1% 163,180 <1%
Multnomah 4,755,828 10% 3,813,902 18% 20,111,728 28% 37,293,501 35% 12,106,547 16%
Polk 858,899 2% 207,466 1% 1,245,124 2% 1,069,213 1% 1,318,295 2%
Sherman 38,588 <1% <1,000 <1% 60,899 <1% <1,000 <1% 271,394 <1%
Tillamook 1,182,036 3% 313,983 2% 655,520 1% 832,206 1% 1,188,593 2%
Umatilla 775,062 2% 513,502 2% 1,283,830 2% 1,147,352 1% 1,502,908 2%
Union 1,063,609 2% 367,555 2% 851,950 1% 885,022 1% 1,278,372 2%
Wallowa 287,990 1% 77,974 <1% 51,458 <1% 205,195 <1% 223,067 <1%
Wasco 470,399 1% 140,665 1% 568,896 1% 543,076 1% 746,527 1%
Washington 4,495,794 10% 1,488,280 7% 10,737,234 15% 12,741,817 12% 5,914,454 8%
Wheeler 10,856 <1% 9,171 <1% <1,000 <1% 82,194 <1% 46,185 <1%
Yamhill 820,197 2% 300,697 1% 1,791,955 3% 1,623,736 2% 1,351,149 2%
Total 47,123,967 20,764,294 71,471,779 106,715,614 75,359,088

74
County
Attending outdoor concerts,
fairs, festivals Tennis (played outdoors)
Outdoor court games other than
tennis (basketball, beach
volleyball, badminton, etc.)
Baseball or softball Football, soccer, lacrosse,
rugby, ultimate frisbee
# % # % # % # % # %
Baker 26,274 <1% 3,505 <1% 36,499 <1% 46,072 1% 43,316 <1%
Benton 222,682 2% 113,014 3% 417,506 4% 363,265 4% 877,182 6%
Clackamas 687,999 6% 128,563 3% 561,372 5% 614,296 7% 849,694 6%
Clatsop 120,724 1% 18,876 <1% 58,736 1% 93,181 1% 44,116 <1%
Columbia 122,295 1% 9,291 <1% 13,957 <1% 119,543 1% 70,892 1%
Coos 346,479 3% 26,181 1% 55,510 1% 78,334 1% 81,447 1%
Crook 37,248 <1% <1,000 <1% 10,536 <1% 11,349 <1% 15,560 <1%
Curry 35,941 <1% 28,281 1% 38,493 <1% 32,107 <1% 58,144 <1%
Deschutes 865,369 8% 264,108 7% 277,087 3% 187,360 2% 411,947 3%
Douglas 277,744 3% 78,786 2% 48,240 <1% 205,544 2% 279,860 2%
Gilliam <1,000 <1% <1,000 <1% <1,000 <1% <1,000 <1% <1,000 <1%
Grant 9,033 <1% <1,000 <1% 38,185 <1% 39,274 <1% 28,699 <1%
Harney 10,958 <1% <1,000 <1% 38,151 <1% 34,107 <1% 32,123 <1%
Hood River 65,139 1% 84,110 2% 9,990 <1% 32,302 <1% 67,113 <1%
Jackson 538,233 5% 232,250 6% 202,812 2% 308,000 3% 364,371 3%
Jefferson 22,579 <1% 22,945 1% 20,873 <1% 22,239 <1% 63,088 <1%
Josephine 269,806 2% 172,846 4% 314,128 3% 158,597 2% 305,595 2%
Klamath 98,337 1% 83,241 2% 310,176 3% 73,231 1% 57,128 <1%
Lake 24,550 <1% 4,353 <1% <1,000 <1% 6,484 <1% 11,340 <1%
Lane 1,194,789 11% 341,729 9% 1,896,635 17% 1,097,134 12% 572,985 4%
Lincoln 80,732 1% 13,226 <1% 57,979 1% 87,101 1% 116,918 1%
Linn 298,257 3% 70,906 2% 251,100 2% 338,140 4% 164,906 1%
Malheur 50,516 <1% 19,812 <1% 93,021 1% 108,144 1% 82,239 1%
Marion 502,093 5% 286,140 7% 1,670,705 15% 903,922 10% 1,601,232 12%
Morrow 10,248 <1% 3,590 <1% 37,627 <1% 59,255 1% 52,550 <1%
Multnomah 3,835,864 35% 1,143,507 29% 2,540,562 23% 1,095,078 12% 2,591,889 19%
Polk 146,688 1% 23,327 1% 237,438 2% 186,451 2% 67,766 <1%
Sherman <1,000 <1% <1,000 <1% <1,000 <1% <1,000 <1% <1,000 <1%
Tillamook 39,748 <1% 4,438 <1% 17,816 <1% 23,945 <1% 12,666 <1%
Umatilla 145,037 1% 114,634 3% 190,294 2% 324,544 4% 296,347 2%
Union 61,491 1% 14,797 <1% 166,679 2% 144,077 2% 211,066 2%
Wallowa 23,299 <1% 1,683 <1% 12,586 <1% 24,987 <1% 11,035 <1%
Wasco 52,644 <1% 8,143 <1% 40,442 <1% 57,860 1% 97,386 1%
Washington 543,565 5% 632,468 16% 1,246,258 11% 1,780,678 20% 3,756,317 28%
Wheeler <1,000 <1% <1,000 <1% <1,000 <1% <1,000 <1% <1,000 <1%
Yamhill 151,825 1% 42,759 1% 68,963 1% 301,638 3% 282,202 2%
Total 10,918,188 3,991,507 10,980,357 8,958,239 13,579,119

75
County Golf Disc golf
Skateboarding, inline skating,
roller skating, roller skiing
Rock climbing, bouldering,
mountaineering Orienteering, geocaching
# % # % # % # % # %
Baker 14,863 <1% <1,000 <1% 13,391 <1% 43,964 3% 7,505 <1%
Benton 368,372 5% 508,021 11% 78,342 1% 47,987 3% 40,866 1%
Clackamas 499,100 7% 153,757 3% 159,260 3% 38,403 2% 225,023 8%
Clatsop 50,477 1% 15,364 <1% 82,840 1% 3,508 <1% 13,744 <1%
Columbia 74,882 1% 7,316 <1% 60,540 1% 1,046 <1% 179,920 6%
Coos 93,275 1% 104,296 2% 67,956 1% 16,085 1% 25,085 1%
Crook 26,750 <1% <1,000 <1% 11,692 <1% 52,549 3% 85,403 3%
Curry 30,774 <1% <1,000 <1% 7,731 <1% 8,215 1% 26,844 1%
Deschutes 727,846 10% 235,560 5% 260,058 4% 411,647 27% 273,567 10%
Douglas 120,026 2% 266,952 6% 81,277 1% 70,739 5% 30,172 1%
Gilliam 12,557 <1% <1,000 <1% <1,000 <1% <1,000 <1% <1,000 <1%
Grant 16,311 <1% <1,000 <1% 4,532 <1% 1,591 <1% <1,000 <1%
Harney 15,015 <1% <1,000 <1% <1,000 <1% <1,000 <1% <1,000 <1%
Hood River 44,057 1% 11,222 <1% 24,818 <1% 35,130 2% 4,605 <1%
Jackson 435,947 6% 39,983 1% 74,746 1% 95,508 6% 103,041 4%
Jefferson 56,567 1% 21,527 <1% 27,155 <1% 2,677 <1% 3,132 <1%
Josephine 212,476 3% 150,475 3% 67,988 1% 109,957 7% 147,866 5%
Klamath 84,167 1% 16,502 <1% 303,902 5% 246,037 16% 93,180 3%
Lake 5,716 <1% <1,000 <1% <1,000 <1% 2,503 <1% 16,239 1%
Lane 668,138 9% 338,262 7% 378,518 6% 97,632 6% 204,769 7%
Lincoln 76,882 1% <1,000 <1% 48,506 1% <1,000 <1% 10,354 <1%
Linn 45,033 1% 155,255 3% 720,081 12% 27,077 2% 205,886 7%
Malheur 64,316 1% 8,789 <1% 220,002 4% 8,072 1% 4,742 <1%
Marion 268,081 4% 184,337 4% 840,070 14% 28,437 2% 133,056 5%
Morrow 40,563 1% <1,000 <1% 81,316 1% <1,000 <1% <1,000 <1%
Multnomah 1,356,477 19% 1,241,609 26% 1,061,726 18% 68,294 4% 585,447 21%
Polk 44,136 1% 191,549 4% 231,459 4% <1,000 <1% 3,181 <1%
Sherman <1,000 <1% <1,000 <1% <1,000 <1% <1,000 <1% <1,000 <1%
Tillamook 28,302 <1% <1,000 <1% 2,136 <1% 14,349 1% 33,484 1%
Umatilla 102,907 1% 192,321 4% 81,049 1% 1,333 <1% 85,073 3%
Union 67,552 1% 49,780 1% 171,846 3% 46,242 3% 7,150 <1%
Wallowa 10,920 <1% <1,000 <1% <1,000 <1% 18,246 1% 18,892 1%
Wasco 42,120 1% 97,954 2% 29,017 <1% 7,323 <1% 11,233 <1%
Washington 1,457,892 20% 644,543 14% 604,077 10% 39,518 3% 216,426 8%
Wheeler <1,000 <1% <1,000 <1% <1,000 <1% <1,000 <1% <1,000 <1%
Yamhill 142,898 2% 57,843 1% 239,023 4% <1,000 <1% 56,301 2%
Total 7,305,394 4,693,627 6,035,054 1,544,070 2,852,185

76
County
Hang gliding, sky diving,
paragliding
Visiting historic sites /
history-themed parks
# % # % # % # % # %
Baker <1,000 <1% 271,615 3%
Benton <1,000 <1% 86,012 1%
Clackamas 7,919 5% 443,659 5%
Clatsop 59,508 36% 766,688 8%
Columbia 1,807 1% 54,445 1%
Coos <1,000 <1% 125,129 1%
Crook <1,000 <1% 30,042 <1%
Curry <1,000 <1% 155,112 2%
Deschutes <1,000 <1% 542,235 6%
Douglas <1,000 <1% 157,344 2%
Gilliam <1,000 <1% <1,000 <1%
Grant <1,000 <1% 98,419 1%
Harney <1,000 <1% 29,734 <1%
Hood River <1,000 <1% 216,867 2%
Jackson 31,895 19% 334,359 4%
Jefferson <1,000 <1% 24,701 <1%
Josephine <1,000 <1% 184,884 2%
Klamath <1,000 <1% 231,534 3%
Lake <1,000 <1% 34,892 <1%
Lane 8,308 5% 681,560 7%
Lincoln 23,850 15% 326,717 4%
Linn 2,215 1% 138,026 2%
Malheur <1,000 <1% 70,866 1%
Marion 6,788 4% 611,186 7%
Morrow <1,000 <1% 13,937 <1%
Multnomah 21,354 13% 2,213,680 24%
Polk <1,000 <1% 83,088 1%
Sherman <1,000 <1% 12,414 <1%
Tillamook <1,000 <1% 202,467 2%
Umatilla <1,000 <1% 99,082 1%
Union <1,000 <1% 82,855 1%
Wallowa <1,000 <1% 55,097 1%
Wasco <1,000 <1% 59,258 1%
Washington <1,000 <1% 419,511 5%
Wheeler <1,000 <1% 87,021 1%
Yamhill <1,000 <1% 196,321 2%
Total 163,643 9,140,757

77
Nature Study Activities
County Bird watching Whale watching Exploring tidepools
Other nature / wildlife /
forest / wildflower
observation
Visiting botanical gardens
# % # % # % # % # %
Baker 207,002 1% 0 0% 0 0% 357,165 1% 1,210 <1%
Benton 928,139 3% 0 0% 0 0% 1,157,038 5% 50,645 3%
Clackamas 1,297,761 5% 0 0% 0 0% 1,636,015 6% 17,437 1%
Clatsop 572,069 2% 278,553 14% 992,709 16% 529,052 2% 29,914 2%
Columbia 588,482 2% 0 0% 0 0% 609,751 2% 17,753 1%
Coos 590,321 2% 192,237 10% 637,894 10% 590,455 2% 220,317 13%
Crook 315,927 1% 0 0% 0 0% 157,811 1% <1,000 <1%
Curry 380,760 1% 219,926 11% 482,829 8% 425,804 2% 56,332 3%
Deschutes 1,376,851 5% 0 0% 0 0% 1,637,867 6% 8,152 <1%
Douglas 1,218,893 4% 19,567 1% 30,676 1% 591,539 2% 7,310 <1%
Gilliam <1,000 <1% 0 0% 0 0% <1,000 <1% <1,000 <1%
Grant 226,489 1% 0 0% 0 0% 199,198 1% <1,000 <1%
Harney 73,822 <1% 0 0% 0 0% 145,078 1% <1,000 <1%
Hood River 122,405 <1% 0 0% 0 0% 371,952 1% <1,000 <1%
Jackson 1,642,165 6% 0 0% 0 0% 1,239,535 5% 15,707 1%
Jefferson 343,565 1% 0 0% 0 0% 301,972 1% <1,000 <1%
Josephine 1,549,690 6% 0 0% 0 0% 684,264 3% 18,936 1%
Klamath 1,448,752 5% 0 0% 0 0% 1,285,746 5% 1,031 <1%
Lake 38,750 <1% 0 0% 0 0% 80,366 <1% <1,000 <1%
Lane 3,168,767 12% 76,607 4% 518,988 8% 2,849,965 11% 92,394 5%
Lincoln 1,083,113 4% 945,457 49% 2,564,634 42% 1,382,942 5% 31,627 2%
Linn 1,312,036 5% 0 0% 0 0% 868,364 3% 18,065 1%
Malheur 183,382 1% 0 0% 0 0% 161,020 1% 3,691 <1%
Marion 1,634,962 6% 0 0% 0 0% 1,760,986 7% 156,432 9%
Morrow 68,299 <1% 0 0% 0 0% 75,757 <1% <1,000 <1%
Multnomah 1,677,679 6% 0 0% 0 0% 2,226,447 9% 899,101 52%
Polk 570,821 2% 0 0% 0 0% 491,826 2% 23,355 1%
Sherman <1,000 <1% 0 0% 0 0% <1,000 <1% <1,000 <1%
Tillamook 456,258 2% 164,578 9% 636,491 10% 544,916 2% 7,838 <1%
Umatilla 458,556 2% 0 0% 0 0% 290,295 1% <1,000 <1%
Union 312,140 1% 0 0% 0 0% 289,263 1% <1,000 <1%
Wallowa 105,187 <1% 0 0% 0 0% 170,138 1% <1,000 <1%
Wasco 228,781 1% 0 0% 0 0% 182,249 1% 4,157 <1%
Washington 2,586,628 9% 0 0% 0 0% 2,055,107 8% 40,585 2%
Wheeler <1,000 <1% 0 0% 0 0% 18,525 <1% <1,000 <1%
Yamhill 720,446 3% 0 0% 0 0% 227,896 1% 1,906 <1%
Total 27,488,894 1,934,260 6,130,359 25,596,300 1,723,894

78
County Visiting nature centers
Outdoor photography,
painting, drawing
Collecting (rocks, plants,
mushrooms, berries)
# % # % # % # % # %
Baker 3,652 <1% 200,432 1% 283,737 2%
Benton 33,296 1% 732,069 5% 409,760 3%
Clackamas 170,857 6% 1,074,764 7% 853,904 7%
Clatsop 79,573 3% 390,452 3% 407,582 3%
Columbia 2,431 <1% 412,891 3% 233,136 2%
Coos 70,047 2% 315,286 2% 497,265 4%
Crook <1,000 <1% 46,224 <1% 50,624 <1%
Curry 32,041 1% 186,640 1% 421,194 3%
Deschutes 172,487 6% 663,562 4% 458,747 4%
Douglas 34,414 1% 508,512 3% 441,605 3%
Gilliam 932 <1% <1,000 <1% <1,000 <1%
Grant 60,356 2% 48,718 <1% 49,670 <1%
Harney 3,086 <1% 33,160 <1% 47,168 <1%
Hood River 8,262 <1% 360,718 2% 96,644 1%
Jackson 108,346 4% 792,778 5% 304,506 2%
Jefferson 4,766 <1% 108,019 1% 66,008 1%
Josephine 51,705 2% 317,439 2% 246,168 2%
Klamath 28,280 1% 893,979 6% 958,949 8%
Lake <1,000 <1% 36,417 <1% 46,083 <1%
Lane 149,608 5% 1,469,722 10% 1,524,568 12%
Lincoln 235,182 8% 509,908 3% 1,076,690 9%
Linn 13,508 <1% 552,797 4% 499,401 4%
Malheur 4,369 <1% 184,869 1% 88,407 1%
Marion 185,089 6% 1,202,225 8% 523,555 4%
Morrow <1,000 <1% 42,777 <1% 18,929 <1%
Multnomah 1,067,659 36% 1,649,290 11% 1,181,812 9%
Polk 18,843 1% 258,352 2% 249,147 2%
Sherman <1,000 <1% <1,000 <1% <1,000 <1%
Tillamook 52,811 2% 402,439 3% 290,224 2%
Umatilla 6,440 <1% 250,327 2% 293,439 2%
Union 13,517 <1% 176,460 1% 407,888 3%
Wallowa 4,484 <1% 123,345 1% 78,680 1%
Wasco 6,929 <1% 117,800 1% 100,023 1%
Washington 313,723 11% 378,713 3% 191,467 2%
Wheeler <1,000 <1% 26,457 <1% 22,733 <1%
Yamhill 9,877 <1% 324,385 2% 223,603 2%
Total 2,946,570 14,791,928 12,643,316

79
Vehicle-based Camping Activities
County
RV / motorhome / trailer
camping Car camping with a tent Motorcycle camping with a tent Yurts / camper cabins
# % # % # % # % # %
Baker 136,726 2% 125,959 2% 9,263 2% 6,160 1%
Benton 33,209 1% 37,226 <1% <1,000 <1% 2,976 <1%
Clackamas 357,432 6% 595,934 7% 128,179 32% 62,837 9%
Clatsop 499,219 8% 108,132 1% 6,645 2% 43,700 6%
Columbia 17,839 <1% 51,812 1% <1,000 <1% <1,000 <1%
Coos 494,067 8% 245,194 3% 6,512 2% 55,987 8%
Crook 101,155 2% 43,929 1% 4,904 1% <1,000 <1%
Curry 140,007 2% 123,018 1% 12,188 3% 32,819 5%
Deschutes 554,538 9% 1,805,756 22% 60,774 15% 40,096 6%
Douglas 392,299 6% 297,461 4% 2,794 1% 16,562 2%
Gilliam <1,000 <1% 4,364 <1% <1,000 <1% <1,000 <1%
Grant 163,083 3% 46,214 1% 3,620 1% 2,768 <1%
Harney 53,217 1% 65,161 1% 5,777 1% <1,000 <1%
Hood River 70,517 1% 191,652 2% <1,000 <1% 9,845 1%
Jackson 93,932 2% 229,776 3% 933 <1% 9,506 1%
Jefferson 83,691 1% 164,193 2% <1,000 <1% 8,875 1%
Josephine 212,423 3% 209,509 3% 3,484 1% 22,937 3%
Klamath 195,112 3% 200,528 2% 10,958 3% 1,346 <1%
Lake 54,617 1% 37,781 <1% 269 <1% <1,000 <1%
Lane 528,389 9% 894,358 11% 21,969 5% 22,838 3%
Lincoln 385,116 6% 559,205 7% 1,528 <1% 166,056 24%
Linn 254,788 4% 241,373 3% <1,000 <1% 10,895 2%
Malheur 50,588 1% 33,410 <1% <1,000 <1% 3,382 <1%
Marion 222,508 4% 350,893 4% 2,772 1% 80,800 12%
Morrow 74,572 1% 45,700 1% <1,000 <1% <1,000 <1%
Multnomah 54,038 1% 222,849 3% <1,000 <1% 7,226 1%
Polk <1,000 <1% 24,981 <1% <1,000 <1% <1,000 <1%
Sherman 12,114 <1% 6,350 <1% <1,000 <1% <1,000 <1%
Tillamook 379,810 6% 557,549 7% 106,690 26% 46,375 7%
Umatilla 124,241 2% 84,026 1% 4,828 1% 23,113 3%
Union 130,423 2% 72,724 1% 4,461 1% <1,000 <1%
Wallowa 155,304 3% 323,563 4% 4,461 1% 2,602 <1%
Wasco 103,854 2% 108,709 1% <1,000 <1% <1,000 <1%
Washington 5,126 <1% 84,439 1% <1,000 <1% 2,274 <1%
Wheeler 31,226 1% 40,582 <1% <1,000 <1% <1,000 <1%
Yamhill 14,863 <1% 45,699 1% <1,000 <1% 15,219 2%
Total 6,180,044 8,280,008 404,123 698,126

80
Fishing, Hunting, and Shooting Activities
County Fly fishing
Fishing from a boat
(other than fly fishing)
Fishing from a bank / shore
(other than fly fishing) Crabbing Shellfishing / clamming
# % # % # % # % # %
Baker 25,874 1% 83,281 1% 277,087 3% 0 0% 0 0%
Benton 19,377 1% 26,328 <1% 116,463 1% 0 0% 0 0%
Clackamas 63,725 2% 195,652 3% 635,862 7% 0 0% 0 0%
Clatsop 12,261 <1% 399,031 6% 208,372 2% 280,999 13% 686,417 36%
Columbia <1,000 <1% 130,433 2% 137,614 1% 0 0% 0 0%
Coos 47,732 2% 340,690 5% 411,329 4% 584,444 28% 582,883 30%
Crook 29,226 1% 75,908 1% 69,312 1% 0 0% 0 0%
Curry 30,539 1% 108,511 2% 141,494 1% 79,250 4% 53,098 3%
Deschutes 601,253 21% 413,954 6% 313,490 3% 0 0% 0 0%
Douglas 49,234 2% 331,723 5% 374,462 4% 59,194 3% 13,431 1%
Gilliam <1,000 <1% <1,000 <1% 5,690 <1% 0 0% 0 0%
Grant 9,098 <1% 37,059 1% 88,273 1% 0 0% 0 0%
Harney 9,122 <1% 13,281 <1% 27,675 <1% 0 0% 0 0%
Hood River 49,582 2% 42,974 1% 81,108 1% 0 0% 0 0%
Jackson 195,279 7% 359,478 5% 535,613 6% 0 0% 0 0%
Jefferson 60,300 2% 26,272 <1% 134,177 1% 0 0% 0 0%
Josephine 149,329 5% 185,654 3% 167,100 2% 0 0% 0 0%
Klamath 514,766 18% 588,419 9% 596,191 6% 0 0% 0 0%
Lake 32,306 1% 47,510 1% 50,378 1% 0 0% 0 0%
Lane 313,805 11% 726,471 11% 933,174 10% 236,906 11% 112,012 6%
Lincoln 27,991 1% 344,424 5% 219,139 2% 490,914 23% 103,192 5%
Linn 29,056 1% 249,914 4% 605,025 6% 0 0% 0 0%
Malheur 15,978 1% 113,994 2% 235,224 2% 0 0% 0 0%
Marion 23,175 1% 157,595 2% 458,273 5% 0 0% 0 0%
Morrow 20,733 1% 60,063 1% 81,375 1% 0 0% 0 0%
Multnomah 93,712 3% 1,086,831 16% 949,100 10% 0 0% 0 0%
Polk 6,746 <1% 24,518 <1% 48,100 1% 0 0% 0 0%
Sherman <1,000 <1% <1,000 <1% 4,585 <1% 0 0% 0 0%
Tillamook 116,887 4% 153,851 2% 132,870 1% 321,775 15% 199,554 10%
Umatilla 17,166 1% 118,336 2% 251,231 3% 0 0% 0 0%
Union 97,663 3% 50,637 1% 268,744 3% 0 0% 0 0%
Wallowa 73,237 3% 33,071 <1% 109,917 1% 0 0% 0 0%
Wasco 108,970 4% 86,660 1% 197,933 2% 0 0% 0 0%
Washington 23,375 1% 180,820 3% 549,872 6% 0 0% 0 0%
Wheeler <1,000 <1% 2,288 <1% 97,851 1% 0 0% 0 0%
Yamhill <1,000 <1% 31,484 <1% 95,550 1% 0 0% 0 0%
Total 2,867,497 6,827,347 9,609,651 2,108,043 1,925,022

81
County
Big game hunting with a
gun
Big game hunting with a
bow Waterfowl hunting
Upland bird / small game
hunting
Target / skeet shooting /
archery
# % # % # % # % # %
Baker 45,949 2% 43,665 5% 4,342 1% 43,483 3% 115,499 2%
Benton 60,443 2% 18,613 2% 18,982 2% 19,703 2% 143,640 2%
Clackamas 51,705 2% 6,421 1% 152,488 18% 3,373 <1% 539,843 8%
Clatsop 72,842 2% 15,145 2% 31,945 4% 29,178 2% 84,812 1%
Columbia 51,442 2% 23,947 3% 40,814 5% 13,363 1% 38,826 1%
Coos 131,677 4% 18,644 2% 14,321 2% 11,991 1% 177,350 3%
Crook 23,038 1% 28,107 3% 4,521 1% 5,033 <1% 36,982 1%
Curry 29,158 1% 9,222 1% <1,000 <1% 5,669 <1% 90,576 1%
Deschutes 52,685 2% 9,313 1% 22,314 3% 26,704 2% 557,067 8%
Douglas 166,072 6% 61,899 7% 7,672 1% 58,194 5% 209,704 3%
Gilliam 2,306 <1% <1,000 <1% <1,000 <1% 1,495 <1% <1,000 <1%
Grant 88,009 3% 37,585 4% 3,104 <1% 20,526 2% 37,689 1%
Harney 28,743 1% 10,182 1% <1,000 <1% 13,503 1% 23,825 <1%
Hood River 44,597 1% 3,539 <1% <1,000 <1% 4,753 <1% 30,717 <1%
Jackson 107,191 4% 105,645 11% 6,676 1% 92,122 7% 262,982 4%
Jefferson 10,523 <1% 3,035 <1% 1,188 <1% 2,791 <1% 30,666 <1%
Josephine 71,666 2% 15,223 2% 3,246 <1% 21,848 2% 330,419 5%
Klamath 270,233 9% 79,692 9% 129,073 15% 103,406 8% 824,110 12%
Lake 19,867 1% 4,341 <1% 30,194 4% 30,084 2% 46,830 1%
Lane 508,931 17% 97,064 10% 24,632 3% 114,741 9% 334,557 5%
Lincoln 41,747 1% 15,164 2% <1,000 <1% 5,934 <1% 53,446 1%
Linn 198,700 7% 56,778 6% 25,060 3% 92,151 7% 312,312 5%
Malheur 93,465 3% 7,152 1% 24,443 3% 160,594 13% 136,534 2%
Marion 60,029 2% 2,883 <1% 24,473 3% 8,655 1% 141,292 2%
Morrow 36,356 1% 6,563 1% 9,661 1% 16,795 1% 33,546 <1%
Multnomah 7,978 <1% 65,913 7% 91,735 11% 154,877 12% 100,425 1%
Polk 107,652 4% 14,787 2% 54,689 6% 23,844 2% 209,035 3%
Sherman 7,122 <1% <1,000 <1% <1,000 <1% 2,148 <1% <1,000 <1%
Tillamook 99,485 3% 7,955 1% 9,714 1% 11,137 1% 74,295 1%
Umatilla 99,798 3% 21,959 2% 22,455 3% 38,116 3% 102,538 2%
Union 127,280 4% 116,789 12% 63,727 7% 42,760 3% 200,904 3%
Wallowa 61,542 2% 9,380 1% 4,204 <1% 11,965 1% 19,990 <1%
Wasco 31,467 1% 7,562 1% 8,756 1% 71,515 6% 55,404 1%
Washington 147,954 5% <1,000 <1% 3,956 <1% <1,000 <1% 1,339,440 20%
Wheeler 26,463 1% 5,383 1% <1,000 <1% 10,435 1% <1,000 <1%
Yamhill 24,812 1% 5,483 1% 14,502 2% 624 <1% 125,054 2%
Total 3,008,931 935,034 852,885 1,273,510 6,820,307

82
Non-motorized Water-based and Beach Activities
County
White-water canoeing,
kayaking, rafting
Flat-water canoeing, sea
kayaking, rowing, stand-
up paddling, tubing /
floating
Surfing / ocean stand-up
paddling Windsurfing / kiteboarding Sailing
# % # % # % # % # %
Baker 2,761 <1% 11,327 <1% 0 0% <1,000 <1% <1,000 <1%
Benton 18,350 1% 48,105 1% 0 0% <1,000 <1% <1,000 <1%
Clackamas 260,848 9% 344,994 9% 0 0% <1,000 <1% 1,467 <1%
Clatsop 12,030 <1% 432,478 11% 529,738 58% 510,720 73% 19,932 2%
Columbia 8,176 <1% 29,759 1% 0 0% <1,000 <1% 10,353 1%
Coos 30,404 1% 174,481 4% 124,964 14% 1,096 <1% 8,578 1%
Crook 9,581 <1% 21,641 1% 0 0% <1,000 <1% <1,000 <1%
Curry 18,075 1% 29,524 1% 33,385 4% 7,143 1% 2,992 <1%
Deschutes 1,196,799 41% 503,834 13% 0 0% 1,991 <1% 2,648 <1%
Douglas 48,505 2% 80,122 2% <1,000 <1% <1,000 <1% 5,196 <1%
Gilliam <1,000 <1% <1,000 <1% 0 0% <1,000 <1% <1,000 <1%
Grant 8,627 <1% 2,848 <1% 0 0% <1,000 <1% <1,000 <1%
Harney <1,000 <1% <1,000 <1% 0 0% <1,000 <1% <1,000 <1%
Hood River 27,869 1% 59,033 1% 0 0% 176,012 25% 12,255 1%
Jackson 183,137 6% 160,396 4% 0 0% <1,000 <1% 6,307 1%
Jefferson 18,100 1% 26,082 1% 0 0% <1,000 <1% <1,000 <1%
Josephine 152,507 5% 14,222 <1% 0 0% <1,000 <1% <1,000 <1%
Klamath 25,587 1% 105,992 3% 0 0% <1,000 <1% 420,293 34%
Lake <1,000 <1% 13,817 <1% 0 0% <1,000 <1% <1,000 <1%
Lane 130,095 4% 359,911 9% 3,951 <1% <1,000 <1% 149,874 12%
Lincoln 33,821 1% 71,395 2% 81,544 9% <1,000 <1% 40,179 3%
Linn 273,963 9% 48,192 1% 0 0% <1,000 <1% 6,585 1%
Malheur 2,577 <1% 1,709 <1% 0 0% <1,000 <1% <1,000 <1%
Marion 30,947 1% 67,937 2% 0 0% <1,000 <1% <1,000 <1%
Morrow <1,000 <1% 21,485 1% 0 0% <1,000 <1% <1,000 <1%
Multnomah 155,777 5% 1,173,062 29% 0 0% <1,000 <1% 478,942 39%
Polk <1,000 <1% 3,392 <1% 0 0% <1,000 <1% <1,000 <1%
Sherman <1,000 <1% <1,000 <1% 0 0% <1,000 <1% <1,000 <1%
Tillamook 10,466 <1% 63,770 2% 81,218 9% <1,000 <1% 2,618 <1%
Umatilla 4,853 <1% 31,964 1% 0 0% <1,000 <1% <1,000 <1%
Union 16,746 1% 23,164 1% 0 0% <1,000 <1% <1,000 <1%
Wallowa 9,804 <1% 9,980 <1% 0 0% <1,000 <1% <1,000 <1%
Wasco 215,569 7% 9,071 <1% 0 0% <1,000 <1% <1,000 <1%
Washington 3,715 <1% 23,010 1% 0 0% <1,000 <1% 67,233 5%
Wheeler 2,071 <1% <1,000 <1% 0 0% <1,000 <1% <1,000 <1%
Yamhill <1,000 <1% 15,962 <1% 0 0% <1,000 <1% <1,000 <1%
Total 2,911,759 3,982,657 906,839 696,961 1,235,451

83
County Beach activities - ocean
Beach activities – lakes,
reservoirs, rivers, etc.
Swimming / playing in outdoor
pools / spray parks Snorkeling / SCUBA diving
# % # % # % # % # %
Baker 0 0% 59,028 <1% 41,001 <1% <1,000 <1%
Benton 0 0% 191,342 1% 389,839 3% <1,000 <1%
Clackamas 0 0% 1,469,374 10% 1,078,274 7% 420,281 41%
Clatsop 4,396,791 25% 946,764 6% 185,945 1% 2,416 <1%
Columbia 0 0% 212,510 1% 83,397 1% <1,000 <1%
Coos 1,518,498 9% 604,807 4% 424,039 3% 14,740 1%
Crook 0 0% 81,334 1% 11,401 <1% <1,000 <1%
Curry 1,274,728 7% 344,391 2% 34,721 <1% 15,391 2%
Deschutes 0 0% 1,054,530 7% 900,024 6% 20,757 2%
Douglas 224,567 1% 464,461 3% 351,358 2% 69,509 7%
Gilliam 0 0% <1,000 <1% <1,000 <1% <1,000 <1%
Grant 0 0% 21,158 <1% 23,579 <1% <1,000 <1%
Harney 0 0% 11,657 <1% 29,236 <1% <1,000 <1%
Hood River 0 0% 422,269 3% 60,169 <1% 11,819 1%
Jackson 0 0% 1,242,047 8% 870,670 6% 4,034 <1%
Jefferson 0 0% 139,704 1% 103,024 1% 5,213 1%
Josephine 0 0% 394,982 3% 551,191 4% 22,829 2%
Klamath 0 0% 294,328 2% 92,965 1% 10,747 1%
Lake 0 0% 54,941 <1% 34,536 <1% <1,000 <1%
Lane 1,425,211 8% 2,561,091 17% 1,386,065 9% 150,901 15%
Lincoln 6,152,827 36% 935,877 6% 104,114 1% 33,160 3%
Linn 0 0% 524,650 3% 503,173 3% 78,131 8%
Malheur 0 0% 61,973 <1% 126,942 1% <1,000 <1%
Marion 0 0% 425,451 3% 922,822 6% 132,822 13%
Morrow 0 0% 53,498 <1% 31,506 <1% <1,000 <1%
Multnomah 0 0% 1,497,062 10% 2,663,200 18% 9,316 1%
Polk 0 0% 61,902 <1% 220,013 1% <1,000 <1%
Sherman 0 0% <1,000 <1% <1,000 <1% <1,000 <1%
Tillamook 1,929,171 11% 368,987 2% 34,645 <1% 8,486 1%
Umatilla 0 0% 209,941 1% 449,610 3% <1,000 <1%
Union 0 0% 79,649 1% 134,018 1% <1,000 <1%
Wallowa 0 0% 218,901 1% 57,543 <1% 2,575 <1%
Wasco 0 0% 133,934 1% 222,908 2% <1,000 <1%
Washington 0 0% 187,610 1% 2,309,893 16% <1,000 <1%
Wheeler 0 0% 13,286 <1% <1,000 <1% <1,000 <1%
Yamhill 0 0% 71,566 <1% 345,174 2% <1,000 <1%
Total 17,274,553 15,415,008 14,776,997 1,013,127

84
Appendix G: Percent of Population Participating in Outdoor Recreation Activities, Oregon SCORP Regions, 2011.
Activity SCORP Region
1 2 3 4 5 6 7 8 9* 10 11
Non-motorized Trail Activities
Walking on local streets / sidewalks 61.6 68.9 65.7 63.3 65.2 61.8 71.9 57.9 58.5 76.1 56.7
Walking on local trails / paths 59.9 62.1 59.2 58.6 61.8 52.2 66.3 53.5 53.4 63.7 35.2
Walking / day hiking on non-local trails / paths 40.1 50.2 46.9 39.3 45.1 36.4 51.5 37.5 39.3 49.4 27.1
Long-distance hiking (back packing) 7.7 12.2 10.2 8.9 11.1 7.1 19.4 14.1 14.2 26.3 6.4
Jogging / running on streets / sidewalks 9.9 21.6 15.2 9.1 12.5 10.0 20.7 12.7 13.6 20.2 14.0
Jogging / running on trails / paths 9.7 16.6 12.5 8.6 10.3 7.2 18.2 14.2 14.0 14.5 7.2
Horseback riding 5.4 5.1 2.7 5.2 7.0 10.8 4.9 7.0 7.6 18.9 15.5
Bicycling on unpaved trails 9.0 11.4 12.6 9.9 12.0 11.2 22.4 17.7 17.3 15.4 7.8
Bicycling on paved trails 16.2 26.6 26.8 13.9 19.4 16.6 28.0 25.0 23.5 18.4 5.1
Bicycling on roads, streets / sidewalks 22.7 33.1 34.5 20.5 25.0 25.6 34.0 23.0 23.1 37.0 21.5
Bicycle touring on paved roads / paths (long day / multi-day
rides) 5.6 19.3 10.6 4.0 12.9 8.3 19.8 11.6 11.6 8.5 10.2
Motorized Activities
Class I – All-terrain vehicle riding (3 & 4 wheel ATVs,
straddle seat and handle bars) 11.3 5.6 8.7 26.0 12.8 25.2 14.0 21.1 21.8 40.1 35.5
Class II – Off-road 4-wheel driving (jeeps, pick-ups, dune
buggies, SUVs) 10.1 6.6 10.5 27.7 14.4 17.0 13.1 16.6 19.1 35.1 20.1
Class III – Off-road motorcycling 2.9 2.1 3.0 7.5 5.5 4.4 5.6 3.9 5.0 10.1 6.1
Class IV – Riding UTVs / side-by-side ATVs (non-straddle
seat, driver and passenger sit side-by-side in the vehicle,
steering wheel for steering control)
1.8 <1.0 1.7 6.0 3.0 4.7 3.4 5.6 5.7 8.8 9.2
Snowmobiling 1.3 2.2 2.2 1.8 3.0 9.3 8.5 5.9 6.7 18.7 7.1
Personal water craft – jet ski 2.4 3.6 4.6 4.5 4.0 4.9 9.6 6.6 6.3 5.4 3.4
Power boating (cruising / water skiing) 15.1 12.8 17.4 22.8 18.6 16.6 22.9 21.6 21.2 26.9 21.8
Non-motorized Snow Activities
Downhill (alpine) skiing / snowboarding 7.8 18.5 16.0 8.0 9.9 9.0 18.0 10.8 11.5 16.3 8.2
Cross-country / Nordic skiing / skijoring on groomed trails 2.7 5.3 3.8 1.6 3.9 1.9 12.1 2.0 2.3 7.2 1.6
Cross-country / Nordic skiing / skijoring on ungroomed
trails / off designated trails 2.3 3.0 4.2 1.5 2.9 1.1 7.2 4.8 5.3 7.3 1.8
Snowshoeing 2.8 9.1 6.3 3.5 5.4 5.8 16.6 11.9 11.9 16.4 2.5
Sledding, tubing, or general snow play 16.4 23.6 23.5 17.4 25.1 35.4 33.0 37.5 38.1 44.8 30.7
Outdoor Leisure / Sporting Activities
Sightseeing / driving or motorcycling for pleasure 59.6 55.2 61.5 60.6 60.3 58.6 60.6 56.5 57.6 73.6 56.3
Picnicking 47.6 47.6 53.3 49.4 53.2 50.8 52.2 48.3 49.0 72.7 49.6
General play at a neighborhood park / playground 35.8 50.2 46.8 42.6 44.2 46.3 45.3 37.4 38.4 53.9 36.7
Dog walking / going to dog parks / off-leash areas 30.3 31.4 28.0 29.5 24.3 29.1 37.6 26.5 27.1 33.6 17.7

85
Activity SCORP Region
1 2 3 4 5 6 7 8 9* 10 11
Relaxing, hanging out, escaping heat / noise, etc. 50.6 52.6 57.8 51.9 53.6 46.4 54.9 44.7 45.3 61.2 41.7
Attending outdoor concerts, fairs, festivals 40.7 52.3 52.4 38.7 55.5 40.8 57.3 34.4 36.7 53.0 31.2
Tennis (played outdoors) 4.1 10.3 5.9 3.5 7.8 11.7 8.0 3.2 3.3 5.7 4.4
Outdoor court games other than tennis (basketball, beach
volleyball, badminton, etc.) 7.4 12.0 8.2 5.8 10.1 13.3 9.8 6.7 8.6 14.0 9.8
Baseball / softball 7.5 7.9 10.0 6.1 8.8 10.4 7.6 10.1 9.7 16.5 8.9
Football, soccer, lacrosse, rugby, ultimate frisbee 5.5 11.2 9.2 5.0 8.9 9.3 8.4 8.0 11.9 16.7 11.0
Golf 10.9 11.3 9.9 11.1 11.5 12.6 15.1 14.0 13.5 10.1 11.5
Disc golf 4.0 7.5 7.0 8.9 7.4 6.5 5.3 4.5 4.1 7.9 1.5
Skateboarding, inline skating, roller skating, roller skiing 5.4 4.4 3.8 2.6 3.0 5.9 8.1 2.3 2.1 4.4 5.5
Rock climbing, bouldering, mountaineering 1.7 3.8 4.1 4.1 3.4 2.0 13.3 4.9 5.4 10.0 3.2
Orienteering, geocaching 4.6 4.3 4.4 4.9 4.7 4.6 10.2 3.6 4.1 4.4 3.1
Hang gliding, sky diving, paragliding <1.0 1.7 <1.0 <1.0 <1.0 <1.0 <1.0 <1.0 <1.0 <1.0 <1.0
Visiting historic sites / history-themed parks (history-
oriented museums, outdoor displays, visitor centers, etc.) 50.9 43.3 42.4 32.8 42.0 45.9 44.1 37.9 39.2 48.9 40.5
Nature Study Activities
Bird watching 23.2 11.6 13.8 15.2 16.8 12.6 17.8 30.8 29.0 23.5 18.8
Whale watching 26.7 12.6 14.6 27.4 17.6 8.7 8.5 11.5 10.6 7.8 10.6
Exploring tidepools 40.1 29.5 32.0 39.7 33.4 18.5 29.3 21.8 21.3 18.7 15.7
Other nature / wildlife / forest / wildflower observation 33.9 26.2 31.3 26.9 32.4 23.0 29.2 27.6 29.5 40.9 19.6
Visiting botanical gardens 10.2 14.1 12.5 27.3 16.4 5.0 8.5 6.8 6.2 6.3 3.5
Visiting nature centers 15.1 15.7 15.4 14.6 14.5 7.3 15.2 15.4 13.8 8.6 7.0
Outdoor photography, painting, drawing 21.0 14.9 18.3 17.1 20.6 12.5 17.5 19.6 19.3 21.4 14.7
Collecting (rocks, plants, mushrooms, berries) 33.9 16.3 26.0 37.0 27.5 27.6 21.7 24.2 26.1 47.1 20.7
Vehicle-based Camping Activities
RV / motorhome / trailer camping 21.2 13.4 20.2 41.3 23.6 35.8 32.3 34.9 34.5 41.9 31.4
Car camping with a tent 25.1 34.8 35.3 30.0 35.6 28.8 36.8 36.4 37.9 39.8 27.8
Motorcycle camping with a tent 1.0 1.0 1.8 3.2 <1.0 2.6 4.2 1.6 1.4 1.2 1.5
Yurts / camper cabins 4.5 7.9 7.3 5.0 10.8 8.5 4.2 9.1 8.6 5.1 6.5
Fishing, Hunting, Shooting Activities
Fly fishing 4.5 4.7 6.2 8.6 4.7 5.7 12.1 11.6 11.8 11.9 4.7
Fishing from a boat (other than fly fishing) 22.0 11.7 20.0 22.5 17.8 18.7 21.1 30.1 30.2 29.8 22.6
Fishing from a bank or shore (other than fly fishing) 23.1 12.8 21.6 23.8 20.9 30.3 21.0 35.4 36.5 46.2 39.5
Crabbing 25.3 9.1 17.5 26.0 15.7 9.3 10.2 9.9 9.2 9.3 5.0
Shellfishing / clamming 20.5 5.2 3.9 13.9 3.9 5.1 2.5 5.4 5.1 3.5 2.5
Big game hunting with a gun 12.0 5.2 10.4 15.1 11.0 15.6 10.6 19.7 20.5 36.9 22.7
Big game hunting with a bow 2.5 <1.0 2.6 2.0 2.7 3.6 2.9 4.9 5.3 16.4 8.0
Waterfowl hunting 2.3 1.6 2.6 2.0 2.1 2.8 2.4 8.2 8.7 7.9 4.6
Upland bird or small game hunting 3.0 2.1 3.9 2.6 4.1 6.7 4.1 10.5 11.4 19.5 15.0

86
Activity SCORP Region
1 2 3 4 5 6 7 8 9* 10 11
Target / skeet shooting / archery 11.7 7.9 11.7 18.9 15.2 14.4 17.5 16.4 21.7 29.1 23.5
Non-motorized Water-based and Beach Activities
White-water canoeing, kayaking, rafting 7.4 10.9 12.1 20.9 24.0 8.9 12.8 16.3 14.8 12.4 5.3
Flat-water canoeing, sea kayaking, rowing, stand-up
paddling, tubing / floating 11.3 9.9 12.8 22.7 12.0 10.1 27.3 11.3 12.4 11.6 2.8
Surfing / ocean stand-up paddling 3.4 1.7 1.0 1.3 1.2 <1.0 3.5 <1.0 <1.0 <1.0 <1.0
Windsurfing / kiteboarding <1.0 <1.0 <1.0 <1.0 <1.0 <1.0 <1.0 <1.0 <1.0 <1.0 <1.0
Sailing 2.6 2.0 1.7 1.2 2.9 <1.0 <1.0 <1.0 <1.0 1.3 <1.0
Beach activities – ocean 57.7 56.3 54.5 53.5 50.7 31.1 44.8 35.0 34.0 34.3 25.3
Beach activities – lakes, reservoirs, rivers 33.9 30.0 36.5 32.3 35.6 26.8 50.4 33.5 32.9 33.6 19.3
Swimming / playing in outdoor pools / spray parks 9.2 21.7 19.0 11.9 19.8 28.8 24.8 12.8 14.3 19.7 17.3
Snorkeling / SCUBA diving <1.0 1.1 1.4 2.1 2.4 <1.0 1.0 1.6 1.4 1.5 <1.0
*Region 9 values reported are combined with Region 8 values due to low sample size for Region 9.

87
Appendix H: User Occasions by Activity in Oregon SCORP Region Where Occurred, 2011.
Non-motorized Trail or Related Activities
Region
Walking on local streets /
sidewalks
Walking on local trails /
paths
Walking / day hiking on
non-local trails / paths
Long-distance hiking
(backpacking)
Jogging / running on
streets / sidewalks
# % # % # % # % # %
1 9,800,298 3% 3,911,783 3% 3,418,109 8% 259,827 6% 848,994 1%
2 240,882,655 62% 66,942,906 55% 17,643,990 44% 1,233,440 28% 46,095,688 69%
3 60,238,627 16% 20,052,263 17% 6,772,616 17% 633,021 14% 9,206,153 14%
4 6,531,899 2% 3,106,413 3% 1,579,953 4% 50,968 1% 700,516 1%
5 29,024,269 8% 9,130,174 8% 3,513,631 9% 1,026,209 23% 4,005,929 6%
6 9,403,242 2% 1,919,251 2% 589,429 1% 34,762 1% 1,370,937 2%
7 16,786,789 4% 11,982,011 10% 3,809,079 9% 713,451 16% 2,540,061 4%
8 4,548,217 1% 1,865,675 2% 608,746 2% 176,068 4% 647,410 1%
9 511,616 <1% 199,284 <1% 102,923 <1% 7,053 <1% 71,103 <1%
10 6,408,731 2% 1,742,132 1% 1,925,332 5% 284,753 6% 1,208,157 2%
11 2,356,790 1% 513,963 <1% 282,253 1% 28,216 1% 465,737 1%
Total 386,493,133 121,365,856 40,246,062 4,447,768 67,160,686
Region
Jogging / running on
trails / paths Horseback riding
Bicycling on unpaved
trails Bicycling on paved trails
Bicycling on roads,
streets, sidewalks
# % # % # % # % # %
1 564,639 2% 184,550 2% 257,011 2% 544,244 1% 1,212,323 1%
2 19,015,209 59% 2,194,786 23% 8,942,933 61% 17,487,350 45% 50,967,296 58%
3 5,991,988 19% 316,705 3% 2,081,896 14% 10,489,540 27% 19,929,488 23%
4 351,575 1% 276,033 3% 307,908 2% 478,094 1% 1,078,488 1%
5 1,979,280 6% 544,064 6% 925,852 6% 2,902,842 7% 5,514,801 6%
6 238,217 1% 350,456 4% 153,954 1% 389,059 1% 1,995,948 2%
7 2,795,916 9% 4,230,429 44% 1,331,531 9% 5,821,693 15% 3,954,325 5%
8 743,646 2% 133,661 1% 409,339 3% 417,445 1% 835,650 1%
9 23,852 <1% 59,820 1% 28,609 <1% 11,327 <1% 81,669 <1%
10 316,063 1% 637,561 7% 243,153 2% 450,975 1% 1,597,713 2%
11 172,411 1% 787,153 8% 84,249 1% 28,570 <1% 641,480 1%
Total 32,192,793 9,715,218 14,766,435 39,021,140 87,809,182

88
Motorized Activities
Region
Class I – All-terrain
vehicle riding (3 & 4
wheel ATVs, straddle
seat, handle bars)
Class II – Off-road 4-
wheel driving (jeeps,
pick-ups, dune buggies,
SUVs)
Class III – Off-road
motorcycling
Class IV – Riding UTVs
or side-by-side ATVs
(non-straddle seat, driver
/ passenger sit side-by-
side in the vehicle,
steering wheel for
steering control)
Snowmobiling
# % # % # % # % # %
1 630,164 7% 547,573 8% 319,128 9% 56,983 4% <1,000 <1%
2 2,050,977 22% 905,227 13% 320,218 9% 148,442 9% 25,664 3%
3 1,169,050 12% 1,005,643 14% 1,493,851 41% 161,083 10% 31,235 3%
4 1,295,327 14% 1,027,299 14% 218,064 6% 516,611 32% <1,000 <1%
5 920,121 10% 932,902 13% 643,789 18% 168,673 11% 96,965 10%
6 543,653 6% 224,034 3% 48,523 1% 123,755 8% 100,554 11%
7 592,801 6% 358,693 5% 215,146 6% 115,883 7% 362,238 38%
8 341,856 4% 181,897 3% 43,477 1% 64,884 4% 79,756 8%
9 168,891 2% 252,236 4% 22,545 1% 6,772 <1% 7,267 1%
10 1,233,006 13% 1,449,342 20% 153,944 4% 109,463 7% 231,548 25%
11 542,549 6% 299,108 4% 150,071 4% 120,473 8% 7,899 1%
Total 9,488,396 7,183,955 3,628,755 1,593,024 943,416
Region
Using personal water
craft, such as jet ski
Power boating (cruising /
water skiing)
# % # % # % # % # %
1 64,771 4% 330,322 5%
2 558,185 36% 2,600,014 38%
3 221,999 14% 1,600,679 24%
4 100,932 6% 278,970 4%
5 393,311 25% 711,447 10%
6 25,476 2% 197,184 3%
7 91,905 6% 599,286 9%
8 59,295 4% 146,969 2%
9 3,170 <1% 4,432 <1%
10 40,085 3% 243,145 4%
11 10,145 1% 78,621 1%
Total 1,569,272 6,791,069

89
Non-motorized Snow Activities
Region
Downhill (alpine) skiing /
snowboarding
Cross-country / Nordic
skiing / skijoling on
groomed trails
Cross-country / Nordic
skiing / skijoling on
ungroomed trails or off
designated trails
Snowshoeing Sledding, tubing, general
snow play
# % # % # % # % # %
1 <1,000 <1% <1,000 <1% <1,000 <1% <1,000 <1% 62,147 2%
2 3,667,832 57% 318,057 37% 198,423 29% 426,713 41% 1,599,228 39%
3 291,683 5% 103,006 12% 120,275 18% 191,932 19% 512,511 12%
4 <1,000 <1% <1,000 <1% <1,000 <1% <1,000 <1% 23,689 1%
5 271,550 4% 50,851 6% 67,940 10% 37,795 4% 320,811 8%
6 8,409 <1% 1,197 <1% 4,514 1% 18,793 2% 183,632 4%
7 1,965,085 31% 346,554 40% 236,673 35% 209,496 20% 818,180 20%
8 41,005 1% 11,240 1% 20,389 3% 73,491 7% 102,676 2%
9 12,972 <1% <1,000 <1% 1,568 <1% 2,575 <1% 17,693 <1%
10 153,390 2% 31,829 4% 30,488 4% 73,326 7% 367,265 9%
11 8,398 <1% <1,000 <1% 2,612 <1% 749 <1% 111,680 3%
Total 6,420,325 862,734 682,881 1,034,870 4,119,510
Outdoor Leisure and Sporting Activities
Region
Sightseeing / driving or
motorcycling for
pleasure
Picnicking
General play at a
neighborhood park /
playground
Dog walking / going to
dog parks / off-leash
areas
Relaxing, hanging out,
escaping heat / noise, etc.
# % # % # % # % # %
1 5,967,424 13% 1,519,300 7% 1,443,710 2% 3,020,009 3% 5,049,282 7%
2 20,092,505 43% 10,034,056 48% 46,719,843 65% 70,713,378 66% 33,592,007 45%
3 7,722,634 16% 3,745,301 18% 11,199,412 16% 16,752,337 16% 14,249,700 19%
4 1,675,954 4% 640,166 3% 1,078,493 2% 1,790,206 2% 2,420,294 3%
5 4,207,192 9% 1,866,848 9% 4,650,349 7% 4,787,514 4% 7,463,741 10%
6 1,433,202 3% 689,653 3% 2,022,426 3% 1,832,586 2% 2,684,008 4%
7 2,720,445 6% 864,166 4% 1,783,221 2% 4,071,836 4% 4,931,369 7%
8 669,360 1% 451,493 2% 700,671 1% 1,273,549 1% 1,869,988 2%
9 262,329 1% 100,491 <1% 35,781 <1% 96,455 <1% 187,923 <1%
10 1,895,996 4% 686,580 3% 1,330,295 2% 1,851,077 2% 2,169,521 3%
11 476,925 1% 166,240 1% 507,578 1% 526,667 <1% 741,254 1%
Total 47,123,967
20,764,294
71,471,779
106,715,61
4
75,359,088

90
Region
Attending outdoor
concerts, fairs, festivals Tennis (played outdoors)
Outdoor court games other
than tennis (basketball,
beach volleyball,
badminton, etc.)
Baseball or softball Football, soccer, lacrosse,
rugby, ultimate frisbee
# % # % # % # % # %
1 241,205 2% 36,539 1% 134,531 1% 204,226 2% 173,700 1%
2 6,055,468 55% 2,350,165 59% 6,349,244 58% 5,033,908 56% 9,287,106 68%
3 1,715,728 16% 525,649 13% 2,565,242 23% 1,798,538 20% 1,615,073 12%
4 382,420 4% 54,462 1% 94,002 1% 110,441 1% 139,591 1%
5 1,085,784 10% 483,881 12% 565,180 5% 672,142 8% 949,826 7%
6 207,929 2% 126,367 3% 268,363 2% 441,659 5% 446,284 3%
7 925,197 8% 287,053 7% 308,496 3% 220,948 2% 490,594 4%
8 98,337 1% 83,241 2% 310,176 3% 73,231 1% 57,128 <1%
9 24,550 <1% 4,353 <1% <1,000 <1% 6,484 <1% 11,340 <1%
10 120,097 1% 19,985 1% 253,950 2% 254,410 3% 294,116 2%
11 61,473 1% 19,812 <1% 131,172 1% 142,251 2% 114,361 1%
Total 10,918,188 3,991,507 10,980,357 8,958,239 13,579,119
Region Golf Disc golf
Skateboarding, inline
skating, roller skating,
roller skiing
Rock climbing,
bouldering,
mountaineering
Orienteering, geocaching
# % # % # % # % # %
1 155,661 2% 15,775 <1% 133,483 2% 17,857 1% 57,583 2%
2 3,887,522 53% 2,492,176 53% 3,220,973 53% 210,827 14% 1,403,959 49%
3 1,081,543 15% 1,001,538 21% 1,176,941 20% 172,696 11% 451,521 16%
4 124,050 2% 104,296 2% 75,687 1% 24,301 2% 51,929 2%
5 768,448 11% 457,410 10% 224,011 4% 276,203 18% 281,078 10%
6 198,148 3% 290,274 6% 191,382 3% 8,656 1% 96,306 3%
7 811,162 11% 257,086 5% 298,905 5% 466,873 30% 362,102 13%
8 84,167 1% 16,502 <1% 303,902 5% 246,037 16% 93,180 3%
9 5,716 <1% <1,000 <1% <1,000 <1% 2,503 <1% 16,239 1%
10 109,646 2% 49,780 1% 189,769 3% 110,044 7% 33,547 1%
11 79,331 1% 8,789 <1% 220,002 4% 8,072 1% 4,742 <1%
Total 7,305,394 4,693,627 6,035,054 1,544,070 2,852,185

91
Region
Hang gliding, sky diving,
paragliding
Visiting historic sites /
history-themed parks
(history-oriented
museums, outdoor
displays, visitor centers,
etc.)
# % # % # % # % # %
1 83,357 51% 1,295,871 14%
2 37,868 23% 4,238,756 46%
3 10,523 6% 905,598 10%
4 <1,000 <1% 280,241 3%
5 31,895 19% 676,587 7%
6 <1,000 <1% 184,691 2%
7 <1,000 <1% 684,000 7%
8 <1,000 <1% 231,534 3%
9 <1,000 <1% 34,892 <1%
10 <1,000 <1% 507,985 6%
11 <1,000 <1% 100,600 1%
Total 163,643 9,140,757
Nature Study Activities
Region Bird watching Whale watching Exploring tidepools
Other nature /
wildlife / forest /
wildflower
observation
Visiting botanical
gardens
# % # % # % # % # %
1 2,111,440 8% 1,465,195 76% 4,712,823 77% 2,456,910 10% 69,379 4%
2 9,199,183 33% 0 0% 0 0% 9,379,979 37% 1,156,568 67%
3 5,408,942 20% 0 0% 0 0% 4,875,367 19% 161,105 9%
4 971,081 4% 431,730 22% 1,151,398 19% 1,016,259 4% 276,648 16%
5 4,410,747 16% 0 0% 0 0% 2,515,338 10% 41,952 2%
6 755,636 3% 0 0% 0 0% 548,301 2% 4,157 <1%
7 2,036,342 7% 0 0% 0 0% 2,116,174 8% 8,152 <1%
8 1,448,752 5% 0 0% 0 0% 1,285,746 5% 1,031 <1%
9 38,750 <1% 0 0% 0 0% 80,366 <1% <1,000 <1%
10 850,817 3% 0 0% 0 0% 1,015,763 4% 1,210 <1%
11 257,204 1% 0 0% 0 0% 306,098 1% 3,691 <1%
Total 27,488,894 967,130
6,130,359
25,596,30
0
1,723,894

92
Region Visiting nature centers
Outdoor photography,
painting, drawing
Collecting (rocks, plants,
mushrooms, berries)
# % # % # % # % # %
1 367,566 12% 1,302,799 9% 1,774,496 14%
2 1,776,741 60% 5,661,339 38% 3,553,268 28%
3 196,411 7% 2,754,587 19% 2,433,729 19%
4 102,088 3% 501,927 3% 918,459 7%
5 194,465 7% 1,618,729 11% 992,280 8%
6 14,300 <1% 410,903 3% 412,391 3%
7 177,253 6% 844,262 6% 598,111 5%
8 28,280 1% 893,979 6% 958,949 8%
9 <1,000 <1% 36,417 <1% 46,083 <1%
10 82,009 3% 548,956 4% 819,975 6%
11 7,455 <1% 218,029 1% 135,575 1%
Total 2,946,570 14,791,928 12,643,316
Vehicle-based Camping Activities
Region
RV / motorhome / trailer
camping Car camping with a tent
Motorcycle camping with a
tent
Yurts / camper
cabins
# % # % # % # % # %
1 1,264,146 20% 1,224,886 15% 114,863 28% 256,130 37%
2 742,323 12% 1,568,258 19% 131,758 33% 179,135 26%
3 816,387 13% 1,172,958 14% 22,276 6% 36,709 5%
4 634,073 10% 368,212 4% 18,700 5% 88,807 13%
5 698,655 11% 736,746 9% 7,211 2% 49,004 7%
6 314,780 5% 249,149 3% 4,828 1% 23,113 3%
7 770,610 12% 2,054,459 25% 65,678 16% 48,971 7%
8 195,112 3% 200,528 2% 10,958 3% 1,346 <1%
9 54,617 1% 37,781 <1% <1,000 <1% <1,000 <1%
10 585,536 9% 568,459 7% 21,804 5% 11,530 2%
11 103,805 2% 98,571 1% 5,777 1% 3,382 <1%
Total 6,180,044 8,280,008 404,123 698,126

93
Fishing, Hunting, and Shooting Activities
Region Fly fishing
Fishing from a boat
(other than fly fishing)
Fishing from a bank / shore
(other than fly fishing) Crabbing Shellfishing / clamming
# % # % # % # % # %
1 157,139 5% 897,306 13% 560,381 6% 1,330,594 63% 1,101,175 57%
2 260,315 9% 1,850,306 27% 2,955,479 31% 0 0% 0 0%
3 362,238 13% 1,002,713 15% 1,654,661 17% 0 0% 0 0%
4 78,271 3% 449,202 7% 552,823 6% 722,888 34% 649,412 34%
5 393,841 14% 876,855 13% 1,077,175 11% 0 0% 0 0%
6 146,869 5% 265,292 4% 540,814 6% 0 0% 0 0%
7 690,778 24% 518,422 8% 614,830 6% 0 0% 0 0%
8 514,766 18% 588,419 9% 596,191 6% 0 0% 0 0%
9 32,306 1% 47,510 1% 50,378 1% 0 0% 0 0%
10 205,872 7% 204,047 3% 744,021 8% 0 0% 0 0%
11 25,100 1% 127,275 2% 262,899 3% 0 0% 0 0%
Total 2,867,497 6,827,347 9,609,651 2,108,043 1,925,022
Region
Big game hunting with a
gun
Big game hunting with a
bow Waterfowl hunting
Upland bird / small
game hunting
Target / skeet shooting /
archery
# % # % # % # % # %
1 214,074 7% 38,265 4% 41,659 5% 46,249 4% 212,552 3%
2 496,169 16% 122,973 13% 382,657 45% 209,488 16% 2,524,633 37%
3 768,075 26% 172,456 18% 68,674 8% 226,595 18% 790,509 12%
4 160,835 5% 27,866 3% 14,321 2% 17,660 1% 267,926 4%
5 344,929 11% 182,768 20% 17,593 2% 172,164 14% 803,105 12%
6 177,050 6% 36,084 4% 40,872 5% 130,068 10% 191,487 3%
7 112,709 4% 45,837 5% 28,023 3% 44,964 4% 624,715 9%
8 270,233 9% 79,692 9% 129,073 15% 103,406 8% 824,110 12%
9 19,867 1% 4,341 <1% 30,194 4% 30,084 2% 46,830 1%
10 322,781 11% 207,419 22% 75,376 9% 118,734 9% 374,082 5%
11 122,208 4% 17,334 2% 24,443 3% 174,097 14% 160,359 2%
Total 3,008,931 935,034 852,885 1,273,510 6,820,307

94
Non-motorized Water-based and Beach Activities
Region
White-water canoeing,
kayaking, rafting
Flat-water canoeing, sea
kayaking, rowing, stand-
up paddling, tubing /
floating
Surfing / ocean stand-up
paddling
Windsurfing /
kiteboarding Sailing
# % # % # % # % # %
1 56,317 2% 567,643 14% 696,451 77% 510,720 73% 62,729 5%
2 487,332 17% 1,717,149 43% 0 0% 176,012 25% 570,248 46%
3 422,408 15% 456,208 11% 0 0% <1,000 <1% 156,459 13%
4 48,479 2% 204,004 5% 158,349 17% 8,239 1% 11,570 1%
5 384,149 13% 254,739 6% 0 0% <1,000 <1% 11,503 1%
6 220,422 8% 62,520 2% 0 0% <1,000 <1% <1,000 <1%
7 1,226,550 42% 551,557 14% 0 0% 1,991 <1% 2,648 <1%
8 25,587 1% 105,992 3% 0 0% <1,000 <1% 420,293 34%
9 <1,000 <1% 13,817 <1% 0 0% <1,000 <1% <1,000 <1%
10 37,938 1% 47,319 1% 0 0% <1,000 <1% <1,000 <1%
11 2,577 <1% 1,709 <1% 0 0% <1,000 <1% <1,000 <1%
Total 2,911,759 3,982,657 906,839 696,961 1,235,451
Region Beach activities - ocean
Beach activities – lakes,
reservoirs, rivers, etc.
Swimming / playing in
outdoor pools / spray parks
Snorkeling / SCUBA
diving
# % # % # % # % # %
1 13,600,912 79% 4,127,041 27% 324,704 2% 44,062 4%
2 273,605 0% 3,728,314 24% 7,682,942 52% 574,238 57%
3 48,470 0% 2,810,191 18% 2,279,078 15% 229,032 23%
4 3,289,161 19% 813,964 5% 458,760 3% 30,131 3%
5 7,061 0% 1,802,086 12% 1,773,219 12% 96,373 10%
6 16,583 0% 340,759 2% 704,025 5% <1,000 <1%
7 25,264 0% 1,105,229 7% 1,014,448 7% 25,970 3%
8 3,386 0% 252,394 2% 92,965 1% 10,747 1%
9 <1,000 0% 47,114 <1% 34,536 <1% <1,000 <1%
10 7,747 0% 324,777 2% 256,141 2% 2,575 <1%
11 2,365 0% 63,139 <1% 156,178 1% <1,000 <1%
Total 17,274,553 15,415,008 14,776,997 1,013,127

95
Appendix I: User Occasions and Participation in Outdoor Recreation Activities, Oregon, 2011.
Activity User Occasions % Population
Participating
Average #
Times for
Participants
Average #
Household
Members
Participating
Non-motorized Trail Activities
Walking on local streets / sidewalks 386,493,133 67.5 152.0 2.1
Walking on local trails / paths 121,365,856 61.0 50.9 2.2
Walking / day hiking on non-local trails / paths 40,246,062 48.0 20.9 2.3
Long-distance hiking (back packing) 4,447,768 12.0 9.4 1.9
Jogging / running on streets / sidewalks 67,160,686 18.7 78.5 1.5
Jogging / running on trails / paths 32,192,793 14.8 45.5 1.5
Horseback riding 9,715,218 5.4 39.3 1.8
Bicycling on unpaved trails 14,766,435 12.2 26.1 1.9
Bicycling on paved trails 39,021,140 24.9 40.6 2.1
Bicycling on roads, streets / sidewalks 87,809,182 31.6 71.4 1.8
Bicycle touring on paved roads / paths (long day / multi-day rides) ---- 16.2 ---- ----
Motorized Activities
Class I – All-terrain vehicle riding (3 & 4 wheel ATVs, straddle seat and handle bars) 9,488,396 9.3 25.3 2.2
Class II – Off-road 4-wheel driving (jeeps, pick-ups, dune buggies, SUVs) 7,183,955 9.8 17.2 2.2
Class III – Off-road motorcycling 3,628,755 3.1 23.7 1.7
Class IV – Riding UTVs / side-by-side ATVs (non-straddle seat, driver and passenger
sit side-by-side in the vehicle, steering wheel for steering control) 1,593,024 1.6 25.1 2.3
Snowmobiling 943,416 3.1 7.1 2.3
Personal water craft – jet ski 1,569,272 4.2 8.1 2.2
Power boating (cruising / water skiing) 6,791,069 15.3 11.1 2.6
Non-motorized Snow Activities
Downhill (alpine) skiing / snowboarding 6,420,325 16.3 9.3 2.0
Cross-country / Nordic skiing / skijoring on groomed trails 862,734 5.0 4.5 1.8
Cross-country / Nordic skiing / skijoring on ungroomed trails / off designated trails 682,881 3.4 4.9 1.9
Snowshoeing 1,034,870 8.5 3.3 1.9
Sledding, tubing, or general snow play 4,119,510 24.8 3.5 3.0
Outdoor Leisure / Sporting Activities
Sightseeing / driving or motorcycling for pleasure 47,123,967 57.5 22.5 2.4
Picnicking 20,764,294 49.7 10.4 2.8
General play at a neighborhood park / playground 71,471,779 48.0 33.5 2.6
Dog walking / going to dog parks / off-leash areas 106,715,614 30.2 102.0 2.0
Relaxing, hanging out, escaping heat / noise, etc. 75,359,088 53.2 36.4 2.5
Attending outdoor concerts, fairs, festivals 10,918,188 51.5 5.4 2.4
Tennis (played outdoors) 3,991,507 8.8 11.3 2.2
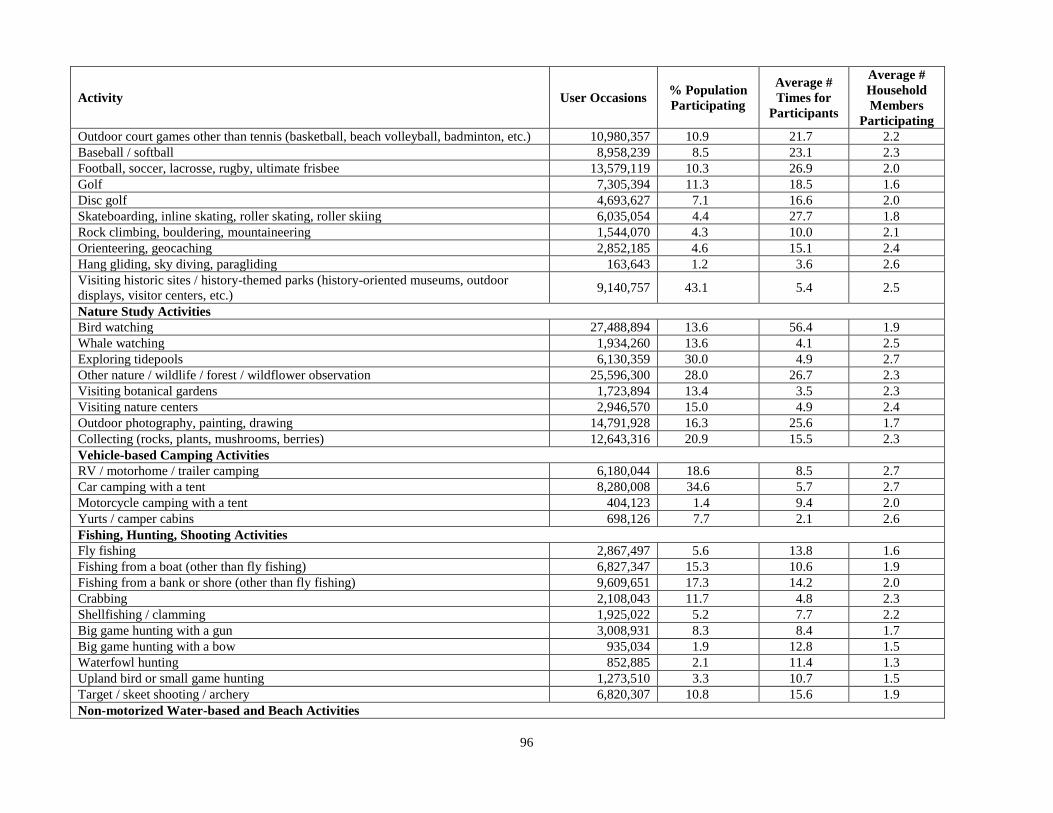
96
Activity User Occasions % Population
Participating
Average #
Times for
Participants
Average #
Household
Members
Participating
Outdoor court games other than tennis (basketball, beach volleyball, badminton, etc.) 10,980,357 10.9 21.7 2.2
Baseball / softball 8,958,239 8.5 23.1 2.3
Football, soccer, lacrosse, rugby, ultimate frisbee 13,579,119 10.3 26.9 2.0
Golf 7,305,394 11.3 18.5 1.6
Disc golf 4,693,627 7.1 16.6 2.0
Skateboarding, inline skating, roller skating, roller skiing 6,035,054 4.4 27.7 1.8
Rock climbing, bouldering, mountaineering 1,544,070 4.3 10.0 2.1
Orienteering, geocaching 2,852,185 4.6 15.1 2.4
Hang gliding, sky diving, paragliding 163,643 1.2 3.6 2.6
Visiting historic sites / history-themed parks (history-oriented museums, outdoor
displays, visitor centers, etc.) 9,140,757 43.1 5.4 2.5
Nature Study Activities
Bird watching 27,488,894 13.6 56.4 1.9
Whale watching 1,934,260 13.6 4.1 2.5
Exploring tidepools 6,130,359 30.0 4.9 2.7
Other nature / wildlife / forest / wildflower observation 25,596,300 28.0 26.7 2.3
Visiting botanical gardens 1,723,894 13.4 3.5 2.3
Visiting nature centers 2,946,570 15.0 4.9 2.4
Outdoor photography, painting, drawing 14,791,928 16.3 25.6 1.7
Collecting (rocks, plants, mushrooms, berries) 12,643,316 20.9 15.5 2.3
Vehicle-based Camping Activities
RV / motorhome / trailer camping 6,180,044 18.6 8.5 2.7
Car camping with a tent 8,280,008 34.6 5.7 2.7
Motorcycle camping with a tent 404,123 1.4 9.4 2.0
Yurts / camper cabins 698,126 7.7 2.1 2.6
Fishing, Hunting, Shooting Activities
Fly fishing 2,867,497 5.6 13.8 1.6
Fishing from a boat (other than fly fishing) 6,827,347 15.3 10.6 1.9
Fishing from a bank or shore (other than fly fishing) 9,609,651 17.3 14.2 2.0
Crabbing 2,108,043 11.7 4.8 2.3
Shellfishing / clamming 1,925,022 5.2 7.7 2.2
Big game hunting with a gun 3,008,931 8.3 8.4 1.7
Big game hunting with a bow 935,034 1.9 12.8 1.5
Waterfowl hunting 852,885 2.1 11.4 1.3
Upland bird or small game hunting 1,273,510 3.3 10.7 1.5
Target / skeet shooting / archery 6,820,307 10.8 15.6 1.9
Non-motorized Water-based and Beach Activities

97
Activity User Occasions % Population
Participating
Average #
Times for
Participants
Average #
Household
Members
Participating
White-water canoeing, kayaking, rafting 2,911,759 12.5 5.8 2.2
Flat-water canoeing, sea kayaking, rowing, stand-up paddling, tubing / floating 3,982,657 11.7 10.0 2.2
Surfing / ocean stand-up paddling 906,839 1.6 13.6 1.9
Windsurfing / kiteboarding 696,961 <1.0 32.7 1.4
Sailing 1,235,451 1.8 16.3 2.2
Beach activities – ocean 17,274,553 53.2 8.3 2.8
Beach activities – lakes, reservoirs, rivers 15,415,008 32.5 11.8 2.8
Swimming / playing in outdoor pools / spray parks 14,776,997 20.7 15.2 2.7
Snorkeling / SCUBA diving 1,013,127 1.3 15.0 1.7

98
Appendix J: Priorities For The Future By Oregon County.
Priorities for the future, what park and forest agencies should invest in, Oregon Counties—mean for 5-point Likert (1 = “Lowest priority need”
to 5 = “Highest priority need”). Items with priority scores of 3.0 and higher are highlighted in grey.
Item
Baker Benton Clackam
as Clatsop Columbia Coos Crook Curry Deschutes
Children’s playgrounds and play areas made
of natural materials (logs, water, sand,
boulders, hills, trees)
3.0 3.1 3.3 3.3 3.4 3.3 3.0 3.2 3.2
Children’s playgrounds and play areas built
with manufactured structures like swing sets,
slides, and climbing apparatuses
2.3 2.7 2.8 2.8 2.9 2.9 2.5 2.5 2.7
Picnic areas and shelters for small visitor
groups 3.2 3.3 3.4 3.4 3.3 3.4 3.0 3.3 3.2
Picnic areas and shelters for large visitor
groups 2.7 2.7 2.9 2.9 2.9 3.2 2.7 2.7 2.7
Paved / hard surface walking trails and paths 2.7 2.9 3.1 3.1 2.9 2.9 2.7 2.7 2.8
Dirt / other soft surface walking trails and
paths 3.4 3.9 3.8 3.7 3.7 3.6 3.4 3.7 3.6
Off-street bicycle trails and pathways 2.9 3.6 3.2 3.4 3.1 3.3 2.8 3.0 3.3
Community gardens 2.6 3.0 2.8 2.9 3.1 2.9 2.7 2.8 3.0
Nature and wildlife viewing areas 3.0 3.4 3.2 3.4 3.4 3.2 3.1 3.4 3.1
Multi-use fields for soccer, football, lacrosse,
etc. 2.2 2.7 2.8 2.4 2.6 2.6 2.4 2.4 2.7
Baseball / softball fields 2.2 2.3 2.6 2.3 2.3 2.5 2.2 2.3 2.4
Outdoor tennis courts 1.9 2.2 2.2 2.0 2.1 2.2 2.0 1.9 2.2
Basketball courts 2.1 2.4 2.4 2.3 2.2 2.4 2.2 2.2 2.3
Off-leash dog areas 2.9 2.8 3.0 2.9 3.1 3.1 2.7 3.1 3.0
Designated paddling routes for canoes,
kayaks, rafts, driftboats 2.4 2.9 2.9 2.7 2.8 2.8 2.5 2.7 2.9
Public access sites to waterways 3.6 3.4 3.5 3.7 3.8 3.8 3.4 3.6 3.5
Off-highway vehicle trails / areas 3.3 2.2 2.6 2.6 2.7 3.2 2.9 2.8 2.5

99
Douglas Gilliam* Grant*
Harney
*
Hood
River Jackson Jefferson Josephine Klamath
Children’s playgrounds and play areas made
of natural materials (logs, water, sand,
boulders, hills, trees)
3.3 3.3 3.1 3.2 3.3 3.4 3.1 3.3 3.4
Children’s playgrounds and play areas built
with manufactured structures like swing sets,
slides, and climbing apparatuses
2.9 3.0 2.6 2.7 2.6 2.6 2.7 2.7 2.8
Picnic areas and shelters for small visitor
groups 3.6 3.5 3.1 3.3 3.1 3.2 3.3 3.4 3.2
Picnic areas and shelters for large visitor
groups 3.3 3.1 2.7 3.0 2.7 2.8 3.0 3.1 2.9
Paved / hard surface walking trails and paths 3.2 3.1 2.7 2.8 2.9 2.7 2.9 3.0 2.7
Dirt / other soft surface walking trails and
paths 3.8 3.7 3.4 3.6 3.8 3.8 3.5 3.8 3.6
Off-street bicycle trails and pathways 3.2 3.1 3.0 2.9 3.6 3.3 3.2 3.3 3.2
Community gardens 2.9 2.7 2.6 2.8 3.2 3.3 2.9 3.2 3.0
Nature and wildlife viewing areas 3.4 3.2 3.0 3.3 3.3 3.5 3.3 3.6 3.4
Multi-use fields for soccer, football, lacrosse,
etc. 2.7 2.7 2.5 2.8 3.0 2.6 2.5 2.7 2.7
Baseball / softball fields 2.5 2.5 2.3 2.7 2.6 2.3 2.4 2.4 2.5
Outdoor tennis courts 2.0 2.2 2.0 2.4 2.5 2.2 2.2 2.3 2.3
Basketball courts 2.2 2.5 2.2 2.5 2.4 2.3 2.3 2.4 2.4
Off-leash dog areas 2.9 2.7 2.8 2.7 3.2 3.0 2.8 3.0 3.1
Designated paddling routes for canoes,
kayaks, rafts, driftboats 2.7 2.7 2.4 2.4 2.7 2.8 2.6 2.8 2.9
Public access sites to waterways 3.7 3.6 3.5 3.4 3.7 3.7 3.4 3.6 3.8
Off-highway vehicle trails / areas 3.1 3.2 3.4 3.1 2.4 2.6 2.7 2.7 3.0

100
Lake* Lane Lincoln Linn Malheur Marion Morrow* Multnomah Polk
Children’s playgrounds and play areas made
of natural materials (logs, water, sand,
boulders, hills, trees)
3.3 3.3 3.3 3.4 3.3 3.3 3.3 3.4 3.5
Children’s playgrounds and play areas built
with manufactured structures like swing sets,
slides, and climbing apparatuses
2.8 2.9 2.7 2.8 2.8 2.8 3.0 2.7 3.0
Picnic areas and shelters for small visitor
groups 3.2 3.2 3.3 3.4 3.3 3.2 3.5 3.3 3.3
Picnic areas and shelters for large visitor
groups 2.9 2.8 2.9 3.1 3.0 2.8 3.1 2.6 2.9
Paved / hard surface walking trails and paths 2.7 2.9 3.1 3.1 2.9 3.2 3.1 2.8 3.1
Dirt / other soft surface walking trails and
paths 3.6 3.7 3.8 3.8 3.6 3.7 3.7 3.7 3.9
Off-street bicycle trails and pathways 3.2 3.1 3.2 3.2 3.0 3.2 3.1 3.4 3.2
Community gardens 2.9 2.9 3.2 2.9 2.8 2.8 2.7 3.3 3.0
Nature and wildlife viewing areas 3.3 3.3 3.5 3.4 3.4 3.2 3.2 3.5 3.5
Multi-use fields for soccer, football, lacrosse,
etc. 2.6 2.5 2.8 2.7 2.9 2.6 2.7 2.8 2.6
Baseball / softball fields 2.5 2.4 2.6 2.5 2.7 2.4 2.5 2.4 2.5
Outdoor tennis courts 2.2 2.1 2.2 2.2 2.4 2.1 2.2 2.4 2.3
Basketball courts 2.4 2.3 2.4 2.6 2.6 2.3 2.5 2.5 2.4
Off-leash dog areas 3.0 2.9 3.0 3.0 2.8 3.1 2.7 3.1 3.0
Designated paddling routes for canoes,
kayaks, rafts, driftboats 2.8 2.8 3.0 2.8 2.5 2.6 2.7 3.0 2.9
Public access sites to waterways 3.7 3.6 3.6 3.7 3.6 3.4 3.6 3.5 3.6
Off-highway vehicle trails / areas 3.0 2.4 2.5 2.9 3.2 2.5 3.2 2.1 2.5

101
Sherman
* Tillamook Umatilla Union Wallowa* Wasco Washington Wheeler Yamhill
Children’s playgrounds and play areas made
of natural materials (logs, water, sand,
boulders, hills, trees)
3.3 3.3 3.3 3.2 3.1 3.4 3.4 3.1 3.7
Children’s playgrounds and play areas built
with manufactured structures like swing sets,
slides, and climbing apparatuses
3.0 2.7 3.0 2.7 2.6 3.0 2.9 2.8 3.1
Picnic areas and shelters for small visitor
groups 3.5 3.4 3.6 3.2 3.1 3.4 3.4 3.6 3.4
Picnic areas and shelters for large visitor
groups 3.1 2.9 3.1 2.8 2.7 3.0 3.0 3.2 3.0
Paved / hard surface walking trails and paths 3.1 3.0 3.1 2.7 2.7 3.0 3.3 2.8 3.2
Dirt / other soft surface walking trails and
paths 3.7 3.7 3.7 3.4 3.4 3.7 4.0 3.3 3.8
Off-street bicycle trails and pathways 3.1 3.3 3.2 2.9 3.0 3.0 3.5 2.5 3.2
Community gardens 2.7 3.0 2.7 2.5 2.6 2.8 3.1 3.1 3.0
Nature and wildlife viewing areas 3.2 3.5 3.1 3.1 3.0 3.3 3.6 3.4 3.4
Multi-use fields for soccer, football, lacrosse,
etc. 2.7 2.6 2.7 2.6 2.5 2.6 3.0 2.4 2.8
Baseball / softball fields 2.5 2.4 2.6 2.4 2.3 2.3 2.5 2.5 2.6
Outdoor tennis courts 2.2 2.1 2.2 2.0 2.0 2.0 2.2 2.1 2.2
Basketball courts 2.5 2.3 2.5 2.2 2.2 2.3 2.5 2.1 2.3
Off-leash dog areas 2.7 3.0 2.7 2.8 2.8 2.8 3.1 2.7 2.8
Designated paddling routes for canoes,
kayaks, rafts, driftboats 2.7 2.9 2.8 2.4 2.4 2.6 2.9 2.7 3.0
Public access sites to waterways 3.6 3.5 3.6 3.5 3.5 3.7 3.5 3.7 3.7
Off-highway vehicle trails / areas 3.2 2.4 3.2 3.3 3.4 3.0 2.4 2.8 2.6
*Values reported for Gilliam, Grant, Harney, Lake, Morrow, Sherman, Wallowa and Wheeler Counties are respective SCORP Regional values due to low samples sizes
for these counties.

102
Appendix K: Priorities For The Future By Oregon SCORP Region.
Priorities for the future, what park and forest agencies should invest in, Oregon SCORP Regions—mean for 5-point Likert (1 = “Lowest
priority need” to 5 = “Highest priority need”). Items with priority scores of 3.0 and higher are highlighted in grey.
Item SCORP Region
1 2 3 4 5 6 7 8 9* 10 11
Children’s playgrounds and play areas made of natural materials (logs,
water, sand, boulders, hills, trees) 3.3 3.4 3.3 3.3 3.4 3.3 3.1 3.4 3.3 3.1 3.2
Children’s playgrounds and play areas built with manufactured structures
like swing sets, slides, and climbing apparatuses 2.7 2.8 2.8 2.8 2.7 3.0 2.7 2.8 2.8 2.6 2.7
Picnic areas and shelters for small visitor groups 3.4 3.3 3.2 3.4 3.4 3.5 3.2 3.2 3.2 3.1 3.3
Picnic areas and shelters for large visitor groups 2.9 2.8 2.8 3.1 3.0 3.1 2.7 2.9 2.9 2.7 3.0
Paved / hard surface walking trails and paths 3.1 3.1 2.9 2.9 2.9 3.1 2.8 2.7 2.7 2.7 2.8
Dirt / other soft surface walking trails and paths 3.7 3.8 3.8 3.6 3.8 3.7 3.6 3.6 3.6 3.4 3.6
Off-street bicycle trails and pathways 3.3 3.4 3.2 3.2 3.3 3.1 3.2 3.2 3.2 3.0 2.9
Community gardens 3.0 3.1 2.9 2.9 3.2 2.7 2.9 3.0 2.9 2.6 2.8
Nature and wildlife viewing areas 3.5 3.4 3.4 3.3 3.5 3.2 3.1 3.4 3.3 3.0 3.3
Multi-use fields for soccer, football, lacrosse, etc. 2.6 2.8 2.6 2.6 2.7 2.7 2.6 2.7 2.6 2.5 2.8
Baseball / softball fields 2.5 2.5 2.4 2.4 2.4 2.5 2.4 2.5 2.5 2.3 2.7
Outdoor tennis courts 2.1 2.3 2.1 2.1 2.2 2.2 2.1 2.3 2.2 2.0 2.4
Basketball courts 2.3 2.4 2.4 2.3 2.3 2.5 2.3 2.4 2.4 2.2 2.5
Off-leash dog areas 3.0 3.1 2.9 3.1 3.0 2.7 3.0 3.1 3.0 2.8 2.7
Designated paddling routes for canoes, kayaks, rafts, driftboats 2.9 2.9 2.8 2.7 2.7 2.7 2.9 2.9 2.8 2.4 2.4
Public access sites to waterways 3.6 3.5 3.6 3.7 3.7 3.6 3.5 3.8 3.7 3.5 3.4
Off-highway vehicle trails / areas 2.5 2.3 2.5 3.1 2.7 3.2 2.5 3.0 3.0 3.4 3.1
*Region 9 values reported are combined with Region 8 values due to low sample size for Region 9.

103
Appendix L: SCORP Needs Assessment
During a period from February 1, 2011 to March 7, 2011, the Oregon Parks and Recreation
Department (OPRD) conducted a survey of Oregon public recreation providers to identify
recreational need as part of the Statewide Comprehensive Outdoor Recreation Planning (SCORP)
effort. Two separate survey instruments were used for the survey, one completed by recreation
providers with the majority of their managed parklands located within an Urban Growth
Boundary (UGB), unincorporated community boundary, or a tribal community; and the other by
recreation providers with the majority of parklands outside of such boundaries.
The sample included municipal, special park district, port district, county, state, federal, and
Tribal recreation providers. The survey was conducted online, on the Survey Monkey website. Of
the 432 providers contacted, 219 completed the survey for a 51% response rate. Survey
respondents included 152 providers with the majority of their managed parklands located within
an UGB and 67 respondents with the majority of parklands outside of an UGB. Respondents
were asked to rate the importance of county-level funding need for a variety of recreation
projects in their jurisdiction in the coming five years. County-level data was combined to identify
stateside need.
Statewide Need
CLOSE-TO-HOME PRIORITIES DISPERSED-AREA PRIORITIES
Community trail systems Group campgrounds & facilities
Children’s playgrounds RV / trailer campgrounds & facilities
Acquisition of trail corridors & ROWs Public restroom facilities
Trails connected to public lands Tent campgrounds & facilities
Public restroom facilities Group day-use & facilities
Picnicking / day-use facilities Acquisition of trail corridors & ROWs
County-level Need
BAKER COUNTY
CLOSE-TO-HOME PRIORITIES DISPERSED-AREA PRIORITIES
Children’s playgrounds RV / trailer campgrounds & facilities
Community trail systems Non-motorized boat launches
Sports and playfields Acquisition of trail corridors & ROWs
BENTON COUNTY
CLOSE-TO-HOME PRIORITIES DISPERSED-AREA PRIORITIES
Children’s playgrounds Acquisition of trail corridors & ROWs
Acquisition of trail corridors & ROWs Picnicking / day-use facilities
Trails connected to public lands Trails connected to public lands

104
CLACKAMAS COUNTY
CLOSE-TO-HOME PRIORITIES DISPERSED-AREA PRIORITIES
Trails connecting communities / parks RV / trailer campgrounds & facilities
Trails connected to public lands Group campgrounds & facilities
Urban bike routes Tent campgrounds & facilities
CLATSOP COUNTY
CLOSE-TO-HOME PRIORITIES DISPERSED-AREA PRIORITIES
Acquisition of trail corridors & ROWs Acquisition of trail corridors & ROWs
Community trail systems Trails connected to public lands
Visitor center & program facilities Nature study / wildlife watching sites
COLUMBIA COUNTY
CLOSE-TO-HOME PRIORITIES DISPERSED-AREA PRIORITIES
Nature study/ wildlife watching sites RV / trailer campgrounds & facilities
Picnicking/ day-use facilities Trails connecting communities / parks
Trails connecting communities / parks Mountain biking (single track) trails/areas
COOS COUNTY
CLOSE-TO-HOME PRIORITIES DISPERSED-AREA PRIORITIES
Picnicking/ day-use facilities Water trail routes
Group day use & facilities Public restroom facilities
Public restroom facilities Acquisition for access to public waterways
CROOK COUNTY
CLOSE-TO-HOME PRIORITIES DISPERSED-AREA PRIORITIES
Outdoor pool/ spray park Group campgrounds & facilities
Community trail systems Trails connecting communities / parks
Picnicking / day-use facilities Acquisition of trail corridors & ROWs
CURRY COUNTY
CLOSE-TO-HOME PRIORITIES DISPERSED-AREA PRIORITIES
Soccer fields Group campgrounds & facilities
Acquisition for access to public waterways Trails connecting communities / parks
Acquisition of parklands Public restroom facilities
DESCHUTES COUNTY
CLOSE-TO-HOME PRIORITIES DISPERSED-AREA PRIORITIES
Public restrooms Children’s playgrounds
Acquisition of trail corridors & ROWs Group campgrounds & facilities
Community trail systems Public restroom facilities

105
DOUGLAS COUNTY
CLOSE-TO-HOME PRIORITIES DISPERSED-AREA PRIORITIES
Public restrooms Water trail routes
Community trail systems Group campgrounds & facilities
Picnicking/ day-use facilities Acquisition of trail corridors & ROWs
GILLIAM COUNTY
CLOSE-TO-HOME PRIORITIES DISPERSED-AREA PRIORITIES
Sports and playfields RV trailer campsites & facilities
RV trailer campsites & facilities Acquisition of trail corridors & ROWs
Community trail systems Trails connecting communities / parks
GRANT COUNTY
CLOSE-TO-HOME PRIORITIES DISPERSED-AREA PRIORITIES
Community vegetable garden areas Group day use & facilities
RV dump stations Group campgrounds & facilities
Acquisition of trail corridors & ROWs RV trailer campsites & facilities
HARNEY COUNTY
CLOSE-TO-HOME PRIORITIES DISPERSED-AREA PRIORITIES
Community vegetable garden areas Equestrian trails / trailheads
Children’s playgrounds Long-distance hiking / backpacking trails
Skateboard parks RV trailer campsites & facilities
HOOD RIVER COUNTY
CLOSE-TO-HOME PRIORITIES DISPERSED-AREA PRIORITIES
Trails connected to public lands Acquisition of trail corridors & ROWs
RV trailer campsites & facilities RV trailer campsites & facilities
Community trail systems Trails connected to public lands
JACKSON COUNTY
CLOSE-TO-HOME PRIORITIES DISPERSED-AREA PRIORITIES
Urban bike routes RV trailer campsites & facilities
Acquisition of trail corridors & ROWs Acquisition of natural open space
Children’s playgrounds Picnicking / day-use facilities
JEFFERSON COUNTY
CLOSE-TO-HOME PRIORITIES DISPERSED-AREA PRIORITIES
Outdoor pool/ spray park Cabins & yurts for visitors
Community trail systems RV dump stations
Acquisition of parklands Mountain biking (single track) trails/areas

106
JOSEPHINE COUNTY
CLOSE-TO-HOME PRIORITIES DISPERSED-AREA PRIORITIES
Outdoor pool/ spray park Water trail routes
Children’s playgrounds Children’s playgrounds
Group day use Trails connecting communities / parks
KLAMATH COUNTY
CLOSE-TO-HOME PRIORITIES DISPERSED-AREA PRIORITIES
Outdoor pool/ spray park Public restrooms
Children’s playgrounds RV trailer campsites & facilities
Public restrooms Nature study / wildlife watching sites
LAKE COUNTY
CLOSE-TO-HOME PRIORITIES DISPERSED-AREA PRIORITIES
Acquisition of parklands Equestrian trails / trailheads
Group campgrounds & facilities Group day use & facilities
RV trailer campsites & facilities Mountain biking (single track) trails/areas
LANE COUNTY
CLOSE-TO-HOME PRIORITIES DISPERSED-AREA PRIORITIES
Exercise trails Historic sites
Trails connecting communities / parks Trails connecting communities / parks
Acquisition of parklands Group campgrounds & facilities
LINCOLN COUNTY
CLOSE-TO-HOME PRIORITIES DISPERSED-AREA PRIORITIES
Acquisition of parklands Group campgrounds & facilities
Acquisition of natural open space RV trailer campsites & facilities
Soccer fields Tent campgrounds & facilities
LINN COUNTY
CLOSE-TO-HOME PRIORITIES DISPERSED-AREA PRIORITIES
Children’s playgrounds Acquisition of natural open space
Children’s natural play areas Cabins & yurts for visitors
Group day use Trails connecting communities / parks
MALHEUR COUNTY
CLOSE-TO-HOME PRIORITIES DISPERSED-AREA PRIORITIES
Soccer fields Cabins & yurts for visitors
Baseball/ football fields Showers
Trails connected to public lands Public restrooms

107
MARION COUNTY
CLOSE-TO-HOME PRIORITIES DISPERSED-AREA PRIORITIES
Public restrooms RV trailer campsites & facilities
Children’s playgrounds Tent campgrounds & facilities
Trails connecting communities / parks Group campgrounds & facilities
MORROW COUNTY
CLOSE-TO-HOME PRIORITIES DISPERSED-AREA PRIORITIES
RV trailer campsites & facilities Tubing & sledding areas
River fishing from bank or pier Tent campgrounds & facilities
Children’s playgrounds Trails connecting communities / parks
MULTNOMAH COUNTY
CLOSE-TO-HOME PRIORITIES DISPERSED-AREA PRIORITIES
Off-leash dog areas Marinas
Acquisition of trail corridors & ROWs Non-motorized boat launches
Community trail systems Motorized boat launches & support
facilities
POLK COUNTY
CLOSE-TO-HOME PRIORITIES DISPERSED-AREA PRIORITIES
Acquisition of trail corridors & ROWs Public restrooms
Community trail systems Group day use & facilities
Trails connected to public lands Picnicking / day use & facilities
SHERMAN COUNTY
CLOSE-TO-HOME PRIORITIES DISPERSED-AREA PRIORITIES
RV trailer campsites & facilities Off-leash dog areas / dog parks
Picnicking/ day-use facilities Children’s playgrounds
Visitor center & program facilities Outdoor swimming pools / spray parks
TILLAMOOK COUNTY
CLOSE-TO-HOME PRIORITIES DISPERSED-AREA PRIORITIES
Public restrooms Acquisition of parklands
Urban bike routes Dispersed tent campsites (walk in)
Community trail systems Public restrooms
UMATILLA COUNTY
CLOSE-TO-HOME PRIORITIES DISPERSED-AREA PRIORITIES
Children’s playgrounds RV trailer campsites & facilities
Soccer fields Interpretive displays
Community trail systems Tent campgrounds & facilities

108
UNION COUNTY
CLOSE-TO-HOME PRIORITIES DISPERSED-AREA PRIORITIES
Community trail systems Group day use & facilities
Picnicking/ day-use facilities Trails connecting communities / parks
Children’s natural play areas Picnicking / day use & facilities
WALLOWA COUNTY
CLOSE-TO-HOME PRIORITIES DISPERSED-AREA PRIORITIES
Soccer fields Equestrian trails / trailheads
Children’s playgrounds Marinas
Group day use Visitor center & program facilities
WASCO COUNTY
CLOSE-TO-HOME PRIORITIES DISPERSED-AREA PRIORITIES
Outdoor pool/ spray park RV trailer campsites & facilities
Tent campgrounds Tent campgrounds & facilities
RV trailer campsites & facilities Group day use & facilities
WASHINGTON COUNTY
CLOSE-TO-HOME PRIORITIES DISPERSED-AREA PRIORITIES
Trails connecting communities / parks Nature study / wildlife watching sites
Community trail systems Trails connecting communities / parks
Acquisition of trail corridors & ROWs Mountain biking (single track) trails /
areas
WHEELER COUNTY
CLOSE-TO-HOME PRIORITIES DISPERSED-AREA PRIORITIES
Children’s playgrounds Nature study / wildlife watching sites
Picnicking/ day-use facilities RV trailer campsites & facilities
Public restrooms Tent campgrounds & facilities
YAMHILL COUNTY
CLOSE-TO-HOME PRIORITIES DISPERSED-AREA PRIORITIES
Acquisition of parklands RV trailer campsites & facilities
Public restrooms Acquisition of parklands
Acquisition of trail corridors & ROWs Water trail routes

109
Appendix M: Group Brainstorming Technique
This appendix describes a technique that enables a group to answer questions effectively and
efficiently. The technique is designed to encourage both individual and group creativity and result
in a group consensus. It limits and focuses interaction among team members in order to arrive at
the needed team result in an efficient manner. The method has been adapted from
"brainstorming" techniques originally developed to stimulate group creativity in developing
advertising campaigns and techniques developed in the field of group dynamics to study how
groups reach a consensus.
The technique is commonly used in a variety of related forms in situations where groups are
working together to generate ideas, build on each other's ideas, combine these individual ideas
and then decide as a group which ideas are the best. For example, in preparing a park and
recreation plan, the technique can be used for deciding what are the community's highest priority
needs and issues, formulating objectives for a goal and identifying strategies to meet an objective.
First, the chairperson or facilitator, working with a flip chart and marker, asks the team to suggest
answers to a question such as, " What are the most important park and recreation concerns in
Pleasant Town?" Each team member in turn suggests one answer, which the facilitator lists on the
chart. The team member is asked just to suggest one item, not to explain, justify or argue for it.
Similarly, team members are asked not to discuss at this point items suggested by other team
members.
The facilitator proceeds around the team listing items until the suggestions are exhausted. Team
members can skip a turn and suggest additional items in later rounds as they occur to them. The
facilitator encourages members to suggest items they are hesitant about. Often these turn out to
be the more unusual and creative ideas. Initial suggestions can be built on and improved by other
group members. Preventing comments on the suggestions during this phase encourages members
to offer ideas they might otherwise be reluctant to suggest.
The listed ideas should be displayed so members can examine the entire list. The facilitator now
asks if there are any suggestions the group does not understand. If so, the member who suggested
the idea explains it, with the facilitator adding material to the list to clarify the item's meaning.
The facilitator then asks if there are any items that could be combined. Then members are finally
asked whether there are any items that someone thinks should not be on the list. These questions
stimulate focused group discussion that results in a refined list of items understood by all
members.
The team next prioritizes the list. This can occur in a variety of ways, but often is accomplished
by giving each member a number of votes that they can use to select the items they believe are
the most important. For example, each member of the group might be asked individually to
choose the three items they believe are the highest priority or most important after being given a
few minutes to reflect on the list. These votes are then announced member by member, noted by
the facilitator on the list and then counted or combined to identify the team's priority order of
items.

110
There should be some convergence among the members in their votes. If there is not, that is, if
votes are evenly distributed among the items, further discuss the items and the disagreement
about their importance and then revote.
Some members may be disappointed with the results, especially if items they consider important
are not ranked highly by the group. It is useful to note that the results at this point are
provisional in the sense that this is just one of many stages in the planning process. As the team
proceeds through the process, there will be ample opportunity to revisit earlier decisions,
especially as the public reviews the team's work and public input is used to modify the plan's
components.
This technique can be even more productive and efficient if team members are provided with the
questions to be brainstormed prior to the meeting and are urged to come to the meeting ready
with ideas to share with the team.

111
Appendix N: Example of a Vision Statement
Over the next ten years, Pleasant Town is expected to grow and expand. With this expansion
comes the challenge of meeting the increasing recreation needs of Pleasant Town's present and
future residents. Pleasant Town is a community that understands that parks and recreation are a
critical element of a community's quality of life. Recreation brings together all segments of our
community and makes us more healthy and productive. The importance of recreation to Pleasant
Town's present and future economic viability is also understood.
Pleasant Town is a community determined to preserve those aspects of its heritage that are
unique and represent important moments in our community's cultural and natural history. This
heritage can provide settings for individual, family and group recreation activity, community
gatherings and remain an important part of what will continue to make Pleasant Town a special
place in which to live, work and play.
In 2012, Pleasant Town will be proud to be a community that works together to provide quality
parks and recreation services for its residents, including:
A refurbished historic park with grounds, vegetation and facilities that have been rehabilitated
and made accessible for the use of all Pleasant Town's residents including the disabled.
Increased open space including a new community park and new neighborhood natural play
areas readily accessible to all our community's children.
Increased and improved opportunities for popular recreation opportunities such as swimming
and softball, especially for an organized league.
New programs that better meet the recreation needs of all segments of our community.
The permanently protected East Side Prairie providing education and enjoyment for residents
and visitors.
The Rippling River Corridor restored through the business district with natural vegetation
providing beautification, passive recreation and a walking path.
The Historic Jones Farmstead protected and used for the town's park and recreation office
and a community heritage museum.
A trail on the abandoned railroad corridor connecting downtown with the Long Ridge State
Trail and its associated regional trail network.
Note: The Vision Statement is written with its specific elements identified in outline format. This
assists in translating the elements of the vision statement to goals.

112
Appendix O: Potential Funding Sources
OPRD Administered Funds:
Land and Water Conservation Fund (LWCF) assists city and county park and recreation
departments, park and recreation districts, METRO, port districts, Indian tribes, and
Oregon state agencies (OPRD, ODF&W, ODF, DSL) in acquisition of lands and waters or
for the development of public outdoor recreation facilities that are consistent with the
outdoor recreation goals and objectives contained in the SCORP. LWCF provides funding
assistance up to 50% of approved project costs.
Local Government Grant Program assists city and county park and recreation
departments, METRO, park and recreation districts and port districts with funding for the
acquisition, development major rehabilitation of, and planning for park and recreation
areas and facilities. Grants from cities and districts over 25,000 population and counties
over 50,000 population will require a 50% local match; cities and districts with a
population between 5,000 and 25,000, and counties with a population between 30,000
and 50,000 a 40% local match; and cities and districts under 5,000 population a 20%
local match.
County Opportunity Grants Program provides funding for the acquisition, development,
rehabilitation and planning for county park and recreation sites that provide, or will
provide, overnight camping facilities including new or additions to existing parks. Grants
from counties with a population of 30,000 and under will require a 25% local match and
counties over 30,000 a 50% match.
Recreational Trails Program (RTP) provides up to 80% federal funding assistance for land
acquisition, development, restoration and rehabilitation of both motorized and
non-motorized recreation trails(including water trails) to federal, state and local
government agencies and not-for-profit organizations.
All-Terrain Vehicle Grants Program provides up to 80% reimbursement to public agencies
(BLM, USFS, NPS OPRD, OSF, ODF) local government (cities, towns, counties), private
land managers who provide and maintain public OHV recreation, and registered non-
profit OHV clubs land acquisition, planning, development, emergency medical and law
enforcement, operation and maintenance, and safety education.
OPRD publishes manuals that explain how recreation providers may apply for grant
assistance from these programs. These manuals are also available on the OPRD website at:
http://cms.oregon.gov/OPRD/GRANTS/pages/index.aspx
For additional information about these grant programs please contact:
OPRD Administered Grant Program OPRD Contact
Land & Water Conservation Fund Program
Local Government Grant Program
Michele Scalise
Phone: 503-986-0708
Email: [email protected]
County Opportunity Grants Program
Recreational Trails Program
Mark Cowan
Phone: 503-986-0591
Email: [email protected]
All Terrain Vehicle Program Pamela Berger
Phone: 503-986-0785
Email: [email protected]

113
Marine Board Administered Funds:
The Marine Board does not receive any general fund tax dollars. Funds for the Marine Board
come from boat registration and titling fees, marine fuel tax, federal Clean Vessel Act and Boating
Infrastructure funds paid by boaters. Because the Marine Board is funded from fees and taxes
paid by owners of registered boats which include all motorized boats and sailboats twelve feet
long and longer, projects that meet the needs of those boats are a high priority.
Facility Grant Program provides competitive grants to public agencies (local, state and a pass-
through option to federal entities) for the acquisition, development, expansion, and
rehabilitation of public boating facilities located on all waters of the state. Projects may be
submitted by cities, counties, park and recreation districts, port districts and state agencies. In
addition, counties with consent of the County Commission may sponsor a Federal Agency
participant such as the U.S. Forest Service, Bureau of Land Management or Corps of Engineers.
Facility Grants are state funds requiring at least 25% applicant match, usually a combination of
hard (cash) and soft (in-kind) funds.
Small Grant Program is a non-competitive grant with the maximum project value not to exceed
$20,000 with the Marine Board’s contribution up to $10,000. The Program is for minor public
boating facility improvements. Projects cannot be fragmented or phased to fit within the
Program. A limited amount of funding is available each biennium for Small Grants.
Maintenance Assistance Program provides funding assistance to augment existing levels of routine
maintenance at improved marine facilities throughout the state provided by eligible participants.
Eligible participants are encouraged to use MAP funds to enhance their existing level of funding
and to improve the quality of maintenance provided. Eligible facilities include boat ramps,
boarding floats, restrooms, parking areas, access roads, transient tie-up floats, vessel waste
collection and related facilities.
Boating Infrastructure Grant Program provides funding for the development and rehabilitation of
transient tie-up facilities at public and private facilities used principally by non-trailered
recreational boats. Facilities must provide way-point linkage to other transient tie-up facilities.
Typically these facilities are located on major rivers and the coastline.
Clean Vessel Grant Program provides funding for new, replacement or upgrades to vessel waste
collection facilities to include: pumpouts, potty dump stations, floating restrooms and directly
related support structures, utilities or other improvements necessary for proper operation. Eligible
participants include local and state government and any privately owned marina/moorage
facility that have or will have the capability to provide an area available for a vessel waste
collection system open and available for general public use.
Let’s Go Boating Assistance Grant Program provides competitive grants to non-profit 501(c)(3).
The objective is to provide funds to local community organizations for creative and innovative
local projects that promote safe boating. The funds will allow groups to address safety concerns
on their local waterways. Past projects have included life jacket loaner kiosks, maps, and on-
water youth boating safety training.

114
The Oregon State Marine Board publishes procedure guides that explain how recreation
providers may apply for grant assistance from these programs. For copies of the grant procedure
guides or additional information about these grant programs please contact:
Janine Belleque, Grant and Contracts Coordinator
Oregon State Marine Board
435 Commercial St. NE
P.O. Box 14145
Salem, Oregon 97309-5065
Phone: 503.378.2628
Email: [email protected]
Website: www.boatoregon.com

115
Other Potential Funding Sources:
Funding Source Program Name Web Address Project Types
American Academy of Dermatology
Shade Structure Grant Program
http://www.aad.org/spot-skin-cancer/what-we-do/shade-structure-grant-program/shade-structure-
grant-program
Permanent shade structures for playgrounds, pools, or recreation
spaces
Americorps Various programs http://www.americorps.gov/for_organizations/funding/i
ndex.asp
Grantees use the funding to support AmeriCorps members for intensive
service in their community
Bikes Belong Coalition
Bikes Belong Grant Program
http://www.bikesbelong.org/grants/ Community bicycling projects
Bureau of Land Management
BLM Challenge Cost Share Program
http://www.grants.gov/search/search.do?mode=VIEW&oppId=102174
Habitat protection & restoration & natural resource management
Centers for Disease Control
Preventive Health & Health Services Block
Grant Program http://www.cdc.gov/phhsblockgrant/index.htm Address important health concerns
Charlotte Martin Foundation
Youth & Wildlife & Habitat Programs
http://www.charlottemartin.org/programs.htm Youth athletics programs & wildlife
& habitat protection
FishAmerica Foundation
Conservation Grants http://www.fishamerica.org/grants.html
Grants to local communities & government agencies to restore
habitat for marine & anadromous fish species
Gannett Foundation
Community Action Grant
http://www.gannettfoundation.org/ Skate parks in communities where Gannett has a local newspaper or
television station
Gray Family Fund Environmental
Education Program http://www.oregoncf.org/connect/educational-
opportunities/enviro-ed Supports youth environmental
education programs
Helen K. & Arthur E. Johnson Foundation
Foundation Grants http://www.johnsonfoundation.org/ General program support &
capital/special projects
Home Depot Youth Garden Grants http://grants.kidsgardening.org/2013-youth-garden-
grant-award Youth garden programs at
community centers

116
Funding Source Program Name Web Address Project Types
KaBoom! Let's Play Community Construction Grants
http://kaboom.org/about_kaboom/programs/grants?utm_source=direct&utm_medium=surl
Build or renovate playgrounds
Local Grant Program
Tillamook Estuaries Partnership
http://www.tbnep.org/programs/local-grant Supports environmental restoration
& enhancement projects in Tillamook County
Lowe’s The Lowe's Charitable
& Educational Foundation
http://www.lowes.com/cd_The+Lowes+Charitable+and+Educational+Foundation_474741445_?mastheadURL=TopCategoriesDisplayView&firstReferURL=http%3A%2F%2Fwww.lowes.com%2Fcd_The%2BLowes%2BCharitable%2Band%2BEducational%2BFoundation_474741445_&qvRe
direct=&langId=-
Support of public involvement projects
M.J. Murdock Charitable Trust
General Grants http://www.murdock-trust.org/grants/general-
grants.php Health & human services
Major League Baseball
Baseball Tomorrow Fund
http://mlb.mlb.com/mlb/official_info/community/btf.jsp Baseball/& or softball fields
Mantis Mantis Tiller Award http://grants.kidsgardening.org/2013-mantis-tiller-award Mantis tillers/cultivators for youth
gardening programs
METRO Regional Parks and Greenspaces
Metro Grant Opportunities
(Number of programs)
http://www.oregonmetro.gov/index.cfm/go/by.web/id=24924
Funds for local project in the Portland metro area that help create
livable communities
Meyer Memorial Trust
Responsive Grants http://www.mmt.org/program/responsive-grants
Wide array of funding in the area of human services, health, community
development, conservation & environment
Meyer Memorial Trust
Grassroots Grants http://www.mmt.org/program/grassroots-grants
Wide array of funding in the area of human services, health, community
development, conservation & environment
Miracle Recreation Equipment Company
Miracle Grants for America's Children
http://www.miracle-recreation.com/purchase-options/playground-grants.html
Purchase of commercial playground or recreation equipment

117
Funding Source Program Name Web Address Project Types
National Fish & Wildlife Foundation
Bring Back the Natives Program
http://www.nfwf.org/AM/Template.cfm?Section=Charter_Programs_List&CONTENTID=24293&TEMPLATE=/CM/C
ontentDisplay.cfm
Restore, protect, and enhance native populations of sensitive or listed
aquatic species, especially on lands on or adjacent to federal agency
lands
National Fish & Wildlife Foundation
Columbia River Estuarine Coastal
Fund
http://www.nfwf.org/AM/Template.cfm?Section=Home&TEMPLATE=/CM/HTMLDisplay.cfm&CONTENTID=14746
Habitat conservation, restoration and management; landowner
outreach & incentive programs; public use natural/cultural projects that benefit the National Wildlife
Refuge System below the Bonneville Dam & adjacent Coasts (Tillamook
Bay to Willapa Bay)
National Fish & Wildlife Foundation
Oregon Governor's Fund for the Environment
http://www.nfwf.org/AM/Template.cfm?Section=Charter_Programs_List&TEMPLATE=/CM/ContentDisplay.cfm&
CONTENTID=24884
Local environmental clean-up & restoration efforts focused on
preserving & protecting Oregon’s rivers, watersheds and fish & wildlife
National Gardening Association
Youth Garden Grants http://grants.kidsgardening.org/ Youth garden programs
National Oceanic & Atmospheric Administration
The Coastal & Estuarine Land
Conservation Program http://coastalmanagement.noaa.gov/land/welcome.html
Protect coastal & estuarine lands considered important for their
ecological, conservation, recreational, historical or aesthetic
values
National Oceanic & Atmospheric Administration
Community-based Restoration Program
http://www.habitat.noaa.gov/restoration/programs/crp.html
Funding and technical expertise in high-priority habitat restoration
projects that instill strong conservation values & engage citizens in hands-on activities
National Oceanic & Atmospheric Administration
Open Rivers Initiative http://www.habitat.noaa.gov/funding/ori.html Community-driven, small dam &
river barrier removals

118
Funding Source Program Name Web Address Project Types
National Park Service
Rivers, Trails & Conservation
Assistance Program
http://www.nps.gov/ncrc/programs/rtca/contactus/cu_apply.html
Technical assistance for community-led natural resource conservation &
outdoor recreation initiatives
National Park Service
Federal Lands to Parks http://www.nps.gov/ncrc/programs/flp/index.htm
Helps communities create new parks and recreation areas by transferring surplus Federal lands to state & local
governments
National Park Service
Preserve America Grant Program
http://www.nps.gov/hps/hpg/preserveamerica/index.htm
Planning funding to designated Preserve America Communities to
support preservation efforts through heritage tourism, education, & historic preservation planning
National Park Service
Disposal of Federal Surplus Real Property for Parks & Recreation & Historic Monuments
https://www.cfda.gov/?s=program&mode=form&tab=step1&id=561043b6e6540c9b467a04f8116031de
Transfers surplus Federal real property for state & local public park
& recreation use
Nike Reuse-a-shoe Program http://www.nikereuseashoe.com/the-impact/in-the-
community Recycled shoe materials for sport &
playground surfacing projects
Nutro Corporation Room to Run Dog
Appreciation Project https://www.easymatch.com/NutroRoomToRun/applicat
ions/Agency Dog parks
Oregon Community Foundation
Northwest Neighborhood Parks &
Recreation Fund
http://www.oregoncf.org/receive/grants/grant-opportunities/nw-neighborhood-parks-rec-fund
Capital development & renovation of park & recreation facilities in
Northwest Portland
Oregon Community Foundation
Gray Family Fund http://www.oregoncf.org/connect/educational-
opportunities/enviro-ed Environmental education programs
Oregon Department of Agriculture
Oregon State Weed Board Grant Program
http://www.oregon.gov/ODA/PLANT/WEEDS/pages/grantindex.aspx
Grant funding for noxious weed control projects related to the protection & enhancement of watersheds & fish and wildlife
Oregon Department of Fish & Wildlife
Restoration & Enhancement
Program http://www.dfw.state.or.us/fish/re/
Additional public access for fishing waters

119
Funding Source Program Name Web Address Project Types
Oregon Department of Fish & Wildlife
Access & Habitat Program
http://www.dfw.state.or.us/lands/AH/grants/index.asp Improve wildlife habitat, increase
public hunting access to private land or solve a wildlife damage issue
Oregon Department of Fish & Wildlife
Bird Stamp Grant Program
http://www.dfw.state.or.us/wildlife/grants/ Projects that benefit upland &
waterfowl game birds
Oregon Department of Fish & Wildlife
ODFW Willamette Wildlife Mitigation
Project
http://www.dfw.state.or.us/wildlife/willamette_wmp/index.asp
Wildlife habitat mitigation in the Willamette Valley
Oregon Department of Fish & Wildlife
Conservation Strategy Implementation
Grants
http://www.dfw.state.or.us/conservationstrategy/oregon_grants.asp
Wildlife & habitat restoration
Oregon Department of Transportation
Scenic Byways Program
http://www.oregon.gov/ODOT/HWY/SCENICBYWAYS/Pages/index.aspx
Establishes uniform criteria, consistent signage & statewide
promotion for scenic byways
Oregon Department of Transportation
National Scenic Byway Grants
http://www.oregon.gov/ODOT/HWY/SCENICBYWAYS/Pages/grants.aspx
Qualifying projects must be along an Oregon Scenic Byway or Tour Route
Oregon Department of Transportation
Bicycle & Pedestrian Program
http://www.oregon.gov/odot/hwy/lgs/Pages/funding.aspx#Bicycle_and_Pedestrian_Program
Bicycle & pedestrian facilities within public rights-of-way
Oregon Department of Transportation
Transportation Enhancement
Program
http://www.oregon.gov/ODOT/HWY/lgs/enhancement.shtml
Pedestrian & bicycle projects; landscaping & beautification; historic
preservation
Oregon Department of Transportation
Safe Routes to School Program
http://www.oregon.gov/ODOT/TS/pages/saferoutes.aspx Empowers communities to make
walking & bicycling to school a safe & routine activity
Oregon Department of Transportation
Transportation & Growth Management
Program http://www.oregon.gov/LCD/TGM/pages/grants.aspx Trails planning
Oregon Infrastructure Finance Authority
Oregon Community Development Block
Grants
http://www.orinfrastructure.org/Learn-About-Infrastructure-Programs/Interested-in-a-Community-
Development-Project/Community-Development-Block-Grant/
Grants to develop livable urban communities in non-metropolitan cities & counties in rural Oregon

120
Funding Source Program Name Web Address Project Types
Oregon Parks and Recreation Department
Oregon's Scenic Bikeways
http://www.oregon.gov/OPRD/PARKS/BIKE/Pages/index.aspx
Designated Bikeways are selected from locally proposed routes & carefully rated for scenic beauty
Oregon State Historic Preservation Office
Oregon Heritage Program Grants
http://www.oregon.gov/oprd/HCD/FINASST/pages/grants.aspx
A variety of state-administered preservation programs
Oregon State Parks Trust
Oregon Parks Foundation Fund
http://www.oregoncf.org/receive/grants/grant-opportunities#/!ts=1348008678410!
Community outdoor recreation enhancement
Oregon Watershed Enhancement Board
OWEB Restoration Grants
http://www.oregon.gov/OWEB/GRANTS/pages/restoration_apps.aspx
Watershed restoration
Oregon Watershed Enhancement Board
OWEB Acquisition Grants
http://www.oregon.gov/OWEB/GRANTS/pages/acquisition_grants.aspx
Land acquisition for watershed protection & restoration
Pacific Power Foundation
Civic & Community Grants
http://www.pacificpower.net/about/itc/foundation.html
Work in the categories of education; civic & community betterment;
culture & arts; & health, welfare & social services
Patagonia Environmental Grant
Program http://www.patagonia.com/us/patagonia.go?assetid=29
42 Local habitat protection efforts
Plum Creek Foundation
Foundation Grants http://www.plumcreek.com/CommunityInvolvement/Gr
antApplication/tabid/161/Default.aspx
Community, education, environment, arts funding for several
Oregon Counties including Benton, Coos, Curry, Douglas, Jackson,
Josephine, Lane, Lincoln, & Polk
Recreational Equipment, Inc.
REI Grants http://www.rei.com/about-rei/grants02.html
Supports and promotes participation in active volunteerism to care for
public lands, natural areas, trails & waterways

121
Funding Source Program Name Web Address Project Types
Rural Community Assistance Corporation
Community Facilities Loan Program
http://www.rcac.org/default.aspx Short-term loans to help create &
improve essential community facilities in the rural West
Siletz Tribe Siletz Tribal Charitable
Contribution Fund http://www.ctsi.nsn.us/charitable-contribution-fund
Environment & natural resource preservation in Lincoln, Tillamook, Linn, Lane, Benton, Pok, Yamhill,
Marion, Multnomah, Washington, & Clackamas Counties
SOLV Project Oregon http://www.solv.org/our-programs/project-oregon
Supports restoration & clean-up projects by providing planning
assistance, project materials & small grants
Subaru Partnership Grants http://www.subaru.com/company/soa-
foundation/partnership_grants.html Youth-based environmental
programs
The Confederated Tribes of the Grand Ronde
Spirit Mountain Community Fund
http://www.thecommunityfund.com/funding
Funds projects in the areas of Arts & Culture, Education, Health, Historic
Preservation, Public Safety, Environmental Preservation &
Problem Gaming in Benton, Clackamas, Lane, Lincoln, Linn,
Marion, Multnomah, Polk, Tillamook, Washington, & Yamhill Counties
The Ford Family Foundation
Public Convening Spaces
http://www.tfff.org/Grants/tabid/81/itemid/55/Default.aspx
Places that bring people together in small communities in rural Oregon
(<30,000 population)
The Ford Family Foundation
Positive Youth Development
http://www.tfff.org/Grants/tabid/81/itemid/55/Default.aspx
Programs and facilities that encourage development of skills,
instill values of a successful citizen & create structure for kids in free time in rural Oregon (<30,000 population)
The Jeld-Wen Foundation
Foundation Grants http://www.jeld-wenfoundation.org/ Supports worthy endeavours in communities where JELD-WEN
employees live & work

122
Funding Source Program Name Web Address Project Types
The Kinsman Foundation
Foundation Grants http://www.kinsmanfoundation.org/guidelines/apply.ht
m
Historic preservation; native wildlife rehabilitation; arts, culture &
humanities
The Kresge Foundation
Variety of Grant Programs
http://www.kresge.org/funding/apply-for-funding Projects that create access and
opportunity in under-served communities
The National Trust for Historic Preservation
National Trust Preservation Funds
http://www.preservationnation.org/resources/find-funding/documents/preservation-funds-guidelines-
eligibility.html#el app
Seed money for local preservation projects
The Oregon Community Foundation
The Oregon Historic Trails Fund
http://www.oregonhistorictrailsfund.org/trails/index.php Annual grants to develop, interpret & improve Oregon's historic trails
The Recreational Boating & Fishing Association & NRPA
Take Me Fishing http://www.nrpa.org/fishing/ Help engage youth & families in
fishing & boating activities
Tony Hawk Foundation
Skatepark Grants http://www.tonyhawkfoundation.org/ Public skateparks in low income
communities
Tread Lightly! Restoration For
Recreation http://www.treadlightly.org/page.php/programs-
r4r/programs-restorationforrecreation.html Restore recreational areas
Trust for Public Land
Park Design & Development
http://www.tpl.org/what-we-do/services/park-design--development/
Helps transform newly acquired or existing sites into parks,
playgrounds, or restored natural areas
Trust for Public Land
Conservation Transactions
http://www.tpl.org/what-we-do/services/conservation-transactions/
Helps structure, negotiate, & complete land transactions that
create parks, playgrounds, & protected natural areas
Trust for Public Land
Conservation Vision & GIS
http://www.tpl.org/what-we-do/services/conservation-vision/
Use innovative research, planning, & spatial analysis (GIS) to help create
parks & protect open space

123
Funding Source Program Name Web Address Project Types
U.S. Department of Agriculture
Community Facility Grants
http://www.rurdev.usda.gov/HAD-CF_Grants.html Helps develop essential community
facilities in rural areas & towns up to 20,000 population
U.S. Department of Agriculture
Child and Adult Care Food Program
http://www.fns.usda.gov/cnd/Care/CACFP/aboutcacfp.htm
Provides meals & snacks for after school & evening youth recreation
programs
U.S. Department of Agriculture
Summer Food Service Program
http://www.fns.usda.gov/cnd/Summer/ Provides meals & snacks for youth
summer playgrounds, camps, & other recreation programs
U.S. Department of Housing & Urban Development
Brownfields Economic Development
Initiative
http://portal.hud.gov/hudportal/HUD?src=/program_offices/comm_planning/BEDI
Assists local governments with redevelopment of brownfield sites
U.S. Department of Housing & Urban Development
Community Development Block Grant Entitlement
Communities Grant Program
http://portal.hud.gov/hudportal/HUD?src=/program_offices/comm_planning/communitydevelopment/programs/
entitlement#eligiblegrantees
Revitalizing neighborhoods, economic development, & providing
improved community facilities & services
U.S. Department of Housing & Urban Development
State-Administered Community
Development Block Grant Entitlement
Communities Grant Program
http://portal.hud.gov/hudportal/HUD?src=/states/oregon/community/cdbg
Grants & technical assistance to develop livable urban communities
for persons of low & moderate income
U.S. Department of Transportation
Transportation, Community & System Preservation Program
http://www.fhwa.dot.gov/tcsp/index.html
Planning, development, & implementation of strategies to
integrate transportation, community & system preservation plans &
practices
U.S. Environmental Protection Agency
Environmental Education Grants
http://www.epa.gov/education/grants/index.html Funds environmental education
projects

124
Funding Source Program Name Web Address Project Types
U.S. Fish & Wildlife Service
North American Wetlands
Conservation Act Grants
http://www.fws.gov/birdhabitat/Grants/NAWCA/index.shtm
Wetland conservation projects
U.S. Fish & Wildlife Service
National Coastal Wetlands
Conservation http://www.fws.gov/coastal/CoastalGrants/
Acquisition & coastal wetlands planning, protection, & restoration
U.S. Fish & Wildlife Service
Wildlife & Sport Fish Restoration Program
USFWS-WSFR Sport Fish Restoration Program Fishery projects, boating access &
aquatic education
U.S. Forest Service
Community & Economic
Development Programs
http://www.rurdev.usda.gov/CEDP-Home.html
Rural community & regional development programs through technical assistance within USDA
Rural Development
U.S. Forest Service Urban & Community
Forestry Program http://www.fs.usda.gov/detail/r6/communityforests/?ci
d=fsbdev2_026871
Technical & financial assistance for developing local urban & community
forestry programs
U.S. General Services Administration
Surplus Real Property Available For Public
Use http://www.gsa.gov/portal/content/102015
Surplus Federal real property for use by park & recreation providers
U.S. Soccer Foundation
Program, Field, Footprint Field & Planning Grant
Programs
http://www.ussoccerfoundation.org/site/c.ipIQKXOvFoG/b.5482645/k.C652/Grants.htm
Youth soccer
United Tennis Association
Facility Assistance Services & Grants
http://www.usta.com/Facilities/facility_services/ Build or renovate tennis facilities
Walmart Local Giving Program http://foundation.walmart.com/apply-for-grants/local-
giving Community projects within service
area of Walmart stores
Wells Fargo Corporate Giving https://www.wellsfargo.com/about/charitable/or_guidel
ines Improvement of low-income or moderate-income communities

125
Appendix P: Oregon Census Data
Oregon Population Data
Oregon Population Data
1970 1980 1990 2000 2010 % Change
(2000 to 2010)
State 2,091,385 2,633,105 2,842,321 3,421,399 3,831,074 +12.0
County
Baker 14,919 16,134 15,317 16,741 16,134 -3.6
Benton 53,776 68,211 70,811 78,153 85,579 +9.5
Clackamas 166,088 241,919 278,850 338,391 375,992 +11.1
Clatsop 28,473 32,489 33,301 35,630 37,039 +4.0
Columbia 28,790 35,646 37,557 43,560 49,351 +13.3
Coos 56,515 64,047 60,273 62,779 63,043 +0.4
Crook 9,985 13,091 14,111 19,182 20,978 +9.4
Curry 13,006 16,992 19,327 21.137 22,364 +5.8
Deschutes 30,442 62,142 74,958 115,367 157,733 +36.7
Douglas 71,743 93,748 94,649 100,399 107,667 +7.2
Gilliam 2,342 2,057 1,717 1,915 1,871 -2.3
Grant 6,996 8,210 7,853 7,935 7,445 -6.2
Harney 7,215 8,314 7,060 7,609 7,422 -2.5
Hood River 13,187 15,835 16,903 20,411 22,346 +9.5
Jackson 94,533 132,456 146,389 181,269 203,206 +12.1
Jefferson 8,548 11,599 13,676 19,009 21,720 +14.3
Josephine 35,746 58,855 62,649 75,726 82,713 +9.2
Klamath 50,021 59,117 57,702 63,775 66,380 +4.1
Lake 6,343 7,532 7,186 7,422 7,895 +6.4
Lane 213,358 275,226 282,912 322,959 351,715 +8.9
Lincoln 25,755 35,264 38,889 44,479 46,034 +3.5
Linn 71,914 89,495 91,227 103,069 116,672 +13.2
Malheur 23,169 26,896 26,038 31,615 31,313 -1.0
Marion 151,309 204,692 228,483 284,834 315,335 +10.7
Morrow 4,465 7,519 7,625 10,995 11,173 +1.6
Multnomah 556,667 562,640 583,887 660,486 735,334 +11.3
Polk 35,349 45,203 49,541 62,380 75,403 +20.9
Sherman 2,139 2,172 1,918 1,934 1,765 -8.7
Tillamook 17,930 21,164 21,570 24,262 25,250 +4.1
Umatilla 44,923 58,861 59,249 70,548 75,889 +7.6
Union 19,377 23,921 23,598 24,530 25,748 +5.0
Wallowa 6,247 7,273 6,911 7,226 7,008 -3.0
Wasco 20,133 21,732 21,683 23,791 25,213 +6.0
Washington 157,920 245,808 311,554 445,342 529,710 +18.9
Wheeler 1,849 1,513 1,396 1,547 1,441 -6.9
Yamhill 40,213 55,332 65,551 84,992 99,193 +16.7
Source: U.S. Census Bureau, Census 2010

126
Community 1970 1980 1990 2000 2010
% Growth
2000-2010
Adair Village N/A 589 554 536 840 56.7%
Adams 219 240 223 297 350 17.8%
Adrian N/A 162 131 147 177 20.4%
Albany 18,181 26,511 29,540 40,852 50,158 22.8%
Amity 708 1,092 1,175 1,478 1,614 9.2%
Antelope 51 39 34 59 46 -22.0%
Arlington 375 521 425 524 586 11.8%
Ashland 12,342 14,943 16,252 19,522 20,078 2.8%
Astoria 10,244 9,996 10,069 9,813 9,477 -3.4%
Athena 872 965 997 1,221 1,126 -7.8%
Aumsville 590 1,432 1,650 3,003 3,584 19.3%
Aurora 306 523 567 655 918 40.2%
Baker City 9,354 9,471 9,140 9,860 9,828 -0.3%
Bandon 1,832 2,311 2,215 2,833 3,066 8.2%
Banks 430 489 563 1,286 491 38.2%
Barlow 105 105 118 140 135 -3.6%
Bay City 898 986 1,027 1,149 1,286 11.9%
Beaverton 18,577 5,937 53,310 76,129 89,803 18.0%
Bend 13,710 17,260 20,469 52,029 76,639 47.3%
Boardman 192 1,261 1,387 2,855 3,320 12.8%
Bonanza 230 270 323 415 415 0%
Brookings 2,720 2,637 4,400 5,447 6,336 16.3%
Brownsville 1,034 1,261 1,281 1,449 1,668 15.1%
Burns 3,293 3,579 2,913 3,064 2,806 -8.4%
Butte Falls 358 428 252 439 423 -3.6%
Canby 3,813 7,659 8,983 12,790 15,829 23.8%
Cannon Beach 779 1,187 1,221 1,588 1,690 6.4%
Canyon City 600 639 648 669 703 5.1%
Canyonville 940 1,288 1,219 1,293 1,884 45.7%
Carlton 1,126 1,302 1,289 1,514 2,007 32.6%
Cascade Locks 574 838 930 1,115 1,144 2.6%
Cave Junction 415 1,023 1,126 1,363 1,883 38.2%
Central Point 4,004 6,357 7,509 12,493 17,169 37.4%
Chiloquin 826 778 673 716 734 2.5%
Clatskanie 1,286 1,648 1,629 1,528 1,737 13.7%
Coberg 665 699 763 969 1,035 6.8%
Columbia City 537 678 1,003 1,571 1,946 23.9%
Condon 973 783 635 759 682 -10.1%
Coos Bay 13,466 14,424 15,076 15,374 15,967 3.9%
Coquille 4,437 4,481 4,121 4,184 3,866 -7.6%
Cornelius 1,903 4,402 6,148 9,652 11,869 23.0%
Corvallis 35,056 40,960 44,757 49,322 54,462 10.4%
Cottage Grove 6,004 7,148 7,402 8,445 9,686 14.7%

127
Community 1970 1980 1990 2000 2010
% Growth
2000-2010
Cove 363 451 507 594 552 -7.1%
Creswell 1,199 1,770 2,431 3,579 5,031 40.6%
Culver 407 514 570 802 1,357 69.2%
Dallas 6,361 8,530 9,422 12,459 14,583 17.0%
Damascus NA NA NA NA 10,539 NA
Dayton 949 1,409 1,526 2,119 2,534 19.6%
Dayville 197 199 144 138 149 8.0%
Depot Bay N/A 723 870 1,174 1,398 19.1%
Detroit 328 367 331 262 202 -22.9%
Donald 231 267 316 608 979 61.0%
Drain 1,204 1,148 1,011 1,021 1,151 12.7%
Dufur 493 560 527 588 604 2.7%
Dundee 588 1,223 1,663 2,598 3,162 21.7%
Dunes City 976 1,124 1,081 1,241 1,303 5.0%
Durham 410 707 748 1,382 1,351 -2.2%
Eagle Point 1,241 2,764 3,008 4,797 8,469 76.5%
Echo 479 624 499 650 699 7.5%
Elgin 1,375 1,701 1,586 1,654 1,711 3.4%
Elkton 176 155 172 147 195 32.7%
Enterprise 1,680 2,003 1,905 1,895 1,940 2.4%
Estacada 1.164 1,419 2,016 2,371 2,695 13.7%
Eugene 79,028 105,664 112,669 137,893 156,185 13.3%
Fairview 1,045 1,749 2,391 7,561 8,920 18.0%
Falls City 745 804 818 966 947 -2.0%
Florence 2,246 4,411 5,162 7,263 8,466 16.6%
Forest Grove 8,275 11,499 13,559 17,708 21,083 19.1%
Fossil 511 535 399 469 473 0.9%
Garibaldi 1,083 999 887 877 779 -13.3%
Gaston 429 471 563 563 673 6.2%
Gates 250 455 499 471 471 0%
Gearhart 829 967 1,027 995 1,462 46.9%
Gervais 746 799 992 2,009 2,464 22.6%
Gladstone 6,254 9,500 10,152 11,438 11,497 0.5%
Glendale 709 712 707 855 874 2.2%
Gold Beach 1,554 1,515 1,546 1,897 2,253 18.8%
Gold Hill 603 904 964 1,073 1,220 58.3%
Granite 4 17 8 24 38 200.0%
Grants Pass 12,455 15,032 17,488 23,003 34,533 50.1%
Grass Valley 153 164 160 171 164 -4.1%
Greenhorn N/A N/A 0 0 0 0%
Gresham 10,030 33,005 68,235 90,205 105,594 17.1%
Haines 212 341 405 426 416 -2.3%
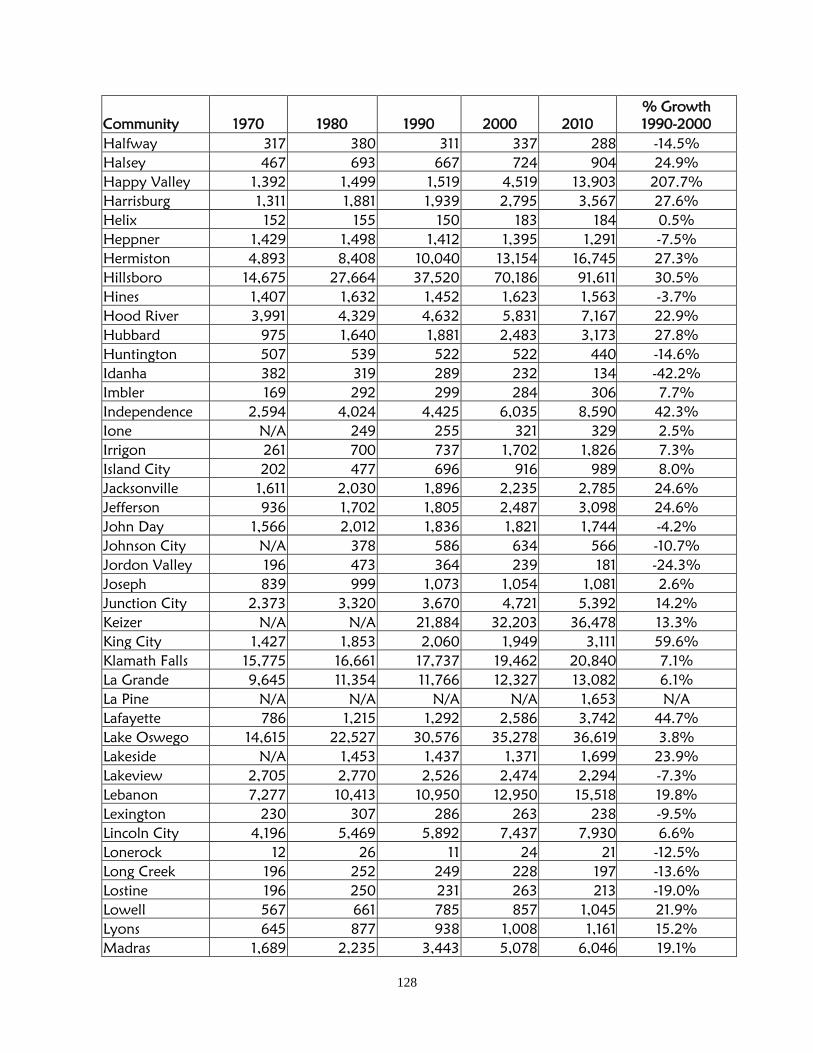
128
Community 1970 1980 1990 2000 2010
% Growth
1990-2000
Halfway 317 380 311 337 288 -14.5%
Halsey 467 693 667 724 904 24.9%
Happy Valley 1,392 1,499 1,519 4,519 13,903 207.7%
Harrisburg 1,311 1,881 1,939 2,795 3,567 27.6%
Helix 152 155 150 183 184 0.5%
Heppner 1,429 1,498 1,412 1,395 1,291 -7.5%
Hermiston 4,893 8,408 10,040 13,154 16,745 27.3%
Hillsboro 14,675 27,664 37,520 70,186 91,611 30.5%
Hines 1,407 1,632 1,452 1,623 1,563 -3.7%
Hood River 3,991 4,329 4,632 5,831 7,167 22.9%
Hubbard 975 1,640 1,881 2,483 3,173 27.8%
Huntington 507 539 522 522 440 -14.6%
Idanha 382 319 289 232 134 -42.2%
Imbler 169 292 299 284 306 7.7%
Independence 2,594 4,024 4,425 6,035 8,590 42.3%
Ione N/A 249 255 321 329 2.5%
Irrigon 261 700 737 1,702 1,826 7.3%
Island City 202 477 696 916 989 8.0%
Jacksonville 1,611 2,030 1,896 2,235 2,785 24.6%
Jefferson 936 1,702 1,805 2,487 3,098 24.6%
John Day 1,566 2,012 1,836 1,821 1,744 -4.2%
Johnson City N/A 378 586 634 566 -10.7%
Jordon Valley 196 473 364 239 181 -24.3%
Joseph 839 999 1,073 1,054 1,081 2.6%
Junction City 2,373 3,320 3,670 4,721 5,392 14.2%
Keizer N/A N/A 21,884 32,203 36,478 13.3%
King City 1,427 1,853 2,060 1,949 3,111 59.6%
Klamath Falls 15,775 16,661 17,737 19,462 20,840 7.1%
La Grande 9,645 11,354 11,766 12,327 13,082 6.1%
La Pine N/A N/A N/A N/A 1,653 N/A
Lafayette 786 1,215 1,292 2,586 3,742 44.7%
Lake Oswego 14,615 22,527 30,576 35,278 36,619 3.8%
Lakeside N/A 1,453 1,437 1,371 1,699 23.9%
Lakeview 2,705 2,770 2,526 2,474 2,294 -7.3%
Lebanon 7,277 10,413 10,950 12,950 15,518 19.8%
Lexington 230 307 286 263 238 -9.5%
Lincoln City 4,196 5,469 5,892 7,437 7,930 6.6%
Lonerock 12 26 11 24 21 -12.5%
Long Creek 196 252 249 228 197 -13.6%
Lostine 196 250 231 263 213 -19.0%
Lowell 567 661 785 857 1,045 21.9%
Lyons 645 877 938 1,008 1,161 15.2%
Madras 1,689 2,235 3,443 5,078 6,046 19.1%

129
Community 1970 1980 1990 2000 2010
% Growth
1990-2000
Malin 486 539 725 638 805 26.2%
Manzanita 261 443 513 564 598 6.0%
Maupin 428 495 456 411 418 1.7%
Maywood Park 1,230 845 781 777 752 -3.2%
McMinnville 10,125 14,080 17,894 26,499 32,187 21.5%
Medford 28,454 39,746 46,951 63,154 74,907 18.6%
Merrill 722 822 837 897 844 -5.9%
Metolius 270 451 450 635 710 11.8%
Mill City 1,451 1,565 1,555 1,537 1,855 20.7%
Millersburg N/A 562 715 651 1,329 104.1%
Milton-
Freewater
4,105 5,086 5,533 5,533 7,050 9.0%
Milwaukie 16,444 17,931 18,692 20,490 20,291 -1.0%
Mitchell 196 183 163 170 130 -23.5%
Molalla 2,005 2,992 3,651 5,647 8,108 43.6%
Monmouth 5,237 5,594 6,288 7,741 9,534 23.2%
Monroe 443 412 448 607 617 1.6%
Monument 161 192 162 151 128 -15.2%
Moro 290 336 292 337 324 -3.9%
Mosier 217 340 244 410 433 5.6%
Mt. Angel 1,973 2,876 2,778 3,121 3,286 5.3%
Mt. Vernon 423 569 538 595 527 -11.4%
Myrtle Creek 2,733 3,365 3,063 3,419 3,439 0.6%
Myrtle Point 2,511 2,859 2,712 2,451 2,514 2.6%
Nehalem 241 258 232 203 271 33.5%
Newberg 6,507 10,394 13,086 18,064 22,068 22.2%
Newport 5,188 7,519 8,437 9,532 9,989 4.8%
North Bend 8,553 9,779 9,614 9,544 9,695 1.6%
North Plains 690 715 972 1,605 1,947 21.3%
North Powder 304 430 448 489 439 -10.2%
Nyssa 2,620 2,862 2,629 3,163 3,267 3.3%
Oakland 1,010 886 844 954 927 -2.8%
Oakridge 3,422 3,680 3,063 3,148 3,205 1.8%
Ontario 6,523 8,814 9,392 10,985 11,366 3.5%
Oregon City 9,176 14,673 14,698 25,754 31,859 23.7%
Paisley 260 343 350 247 243 -1.6%
Pendleton 13,197 14,521 15,126 16,354 16,612 1.6%
Philomath 1,688 2,673 2,983 3,838 4,584 19.4%
Phoenix 1,287 2,309 3,239 4,060 4,538 11.8%
Pilot Rock 1,612 1,630 1,478 1,532 1,502 -2.0%
Port Orford 1,037 1,061 1,025 1,153 1,133 -1.7%
Portland 379,967 366,383 438,802 529,121 583,776 10.3%
Powers 842 819 682 734 689 -6.1%

130
Community 1970 1980 1990 2000 2010
% Growth
1990-2000
Prairie City 867 1,106 1,117 1,080 909 -15.8%
Prescott 105 73 63 72 55 -23.6%
Prineville 4,101 5,276 5,355 7,356 9,253 25.8%
Rainier 1,731 1,655 1,674 1,687 1,895 12.3%
Redmond 3,721 6,452 7,165 13,481 26,215 94.5%
Reedsport 4,039 4,984 4,796 4,378 4,154 -5.1%
Richland 133 181 161 147 156 6.1%
Riddle 1,042 1,265 1,143 1,014 1,185 16.9%
Rivergrove N/A 314 294 324 289 -10.8%
Rockaway
Beach
665 906 970 1,267 1,312 3.6%
Rogue River 841 1,308 1,759 1,847 2,131 15.4%
Roseburg 14,461 16,644 17,032 20,017 21,181 5.8%
Rufus 317 352 295 268 249 -7.1%
Salem 68,725 89,091 107,793 136,924 154,637 12.9%
Sandy 1,544 2,905 4,152 5,385 9,570 77.7%
Scappoose 1,859 3,213 3,529 4,976 6,592 32.5%
Scio 447 579 623 695 838 20.6%
Scotts Mills 208 249 283 312 357 14.4%
Seaside 4,402 5,193 5,359 5,900 6,457 9.4%
Seneca N/A 285 191 223 199 -10.8%
Shady Cove N/A 1,097 1,351 2,307 2,904 25.9%
Shaniko 58 30 26 26 36 38.5%
Sheridan 1,881 2,249 3,979 3,570 6,127 71.6%
Sherwood 1,396 2,386 3,093 11,791 18,194 54.3%
Siletz 596 1,001 992 1,133 1,212 7.0%
Silverton 4,301 5,168 5,635 7,414 9,222 24.4%
Sisters 516 696 679 959 2,038 112.5%
Sodaville 125 171 192 290 308 6.2%
Spray 161 155 149 140 160 14.3%
Springfield 26,874 41,621 44,683 52,864 59,403 12.4%
St. Helens 6,212 7,064 7,535 10,019 12,883 28.6%
St. Paul 346 312 322 354 421 18.9%
Stanfield 891 1,568 1,568 1,979 2,043 3.2%
Stayton 3,170 4,396 5,011 6,816 7,644 12.1%
Sublimity 634 1,077 1,491 2,148 2,681 24.8%
Summerville 76 143 111 117 135 15.4%
Sumpter 120 133 119 171 204 19.3%
Sutherlin 3,070 4,560 5,020 6,669 7,810 17.1%
Sweet Home 3,799 6,921 6,850 8,016 8,925 11.3%
Talent 1,389 2,577 3,274 5,589 6,066 8.5%
Tangent N/A 478 556 933 1,164 24.8%
The Dalles 10,423 10,820 11,060 12,156 13,620 12.0%

131
Community 1970 1980 1990 2000 2010
% Growth
1990-2000
Tigard 6,499 22,527 29,344 41,223 48,035 16.5%
Tillamook 3,968 3,991 4,001 4,352 4,935 13.4%
Toledo 2,818 3,151 3,174 3,472 3,465 -0.2%
Troutdale 1,661 5,908 7,852 13,777 15,962 15.9%
Tualatin 750 7,483 14,664 22,791 26,054 14.3%
Turner 846 1,116 1,281 1,199 1,854 54.6%
Ukiah N/A 249 250 255 186 -27.1%
Umatilla 679 3,199 3,046 4,978 6,906 38.7%
Union 1,531 2,062 1,847 1,926 2,121 10.1%
Unity N/A 115 87 131 71 -45.8%
Vale 1,448 1,558 1,491 1,976 1,874 -5.2%
Veneta 1,377 2,449 2,519 2,755 4,567 65.6%
Vernonia 1,643 1,785 1,808 2,228 2,151 -3.5%
Waldport 700 1,274 1,595 2,050 2,033 -0.8%
Wallowa 811 847 748 869 808 -7.0%
Warrenton 1,825 2,493 3,270 4,096 4,989 21.8%
Wasco 412 415 374 381 410 7.6%
Waterloo 186 211 191 239 229 -4.2%
West Linn 7,091 11,358 16,367 22,261 25,109 12.8%
Westfir N/A 312 278 276 253 -8.3%
Weston 660 719 606 717 667 -7.0%
Wheeler 262 319 335 391 414 5.9%
Willamina 1,193 1,749 1,748 1,844 2,025 9.8%
Wilsonville 1,001 2,920 7,106 13,991 19,509 39.4%
Winston 2,468 3,359 3,773 4,613 5,379 16.6%
Wood Village 1,533 2,253 2,814 2,860 3,878 35.6%
Woodburn 7,495 11,196 13,404 20,100 24,080 19.8%
Yachats 411 482 533 617 690 11.8%
Yamhill 516 690 867 794 1,024 29.0%
Yoncalla 675 805 919 1,052 1,047 -0.5%
Sources: U.S. Census Bureau, Census 2010

132
Oregon Population by Age Group Category
Oregon Population by Age Group Category
Under 5
years (%)
5-19
years (%)
20-24
years (%)
25-44
years (%)
45-64
years
(%)
65-84
years
(%)
85 years
or more
(%)
State 6.2 19.2 6.6 26.8 27.4 11.8 2.0
County
Baker 5.3 21.2 3.6 23.7 27.3 16.4 2.6
Benton 4.4 20.3 16.1 22.1 25.0 10.1 1.9
Clackamas 5.7 20.4 5.3 24.5 30.3 11.6 2.1
Clatsop 5.6 21.3 5.6 25.2 26.6 13.6 2.0
Columbia 5.7 20.3 4.8 24.2 31.0 12.3 1.7
Coos 4.9 19.7 4.5 24.0 27.9 16.8 2.4
Crook 5.4 18.6 4.2 21.2 30.7 17.9 2.2
Curry 3.8 13.7 3.7 16.5 34.4 24.5 3.5
Deschutes 6.1 19.1 5.3 26.2 28.5 13.1 1.8
Douglas 5.2 17.6 5.2 20.6 30.6 18.2 2.8
Gilliam 5.0 15.2 3.4 27.1 27.3 18.2 3.9
Grant 4.5 16.6 3.6 18.5 33.1 20.3 3.2
Harney 5.4 19.4 4.3 20.7 31.4 16.6 2.3
Hood River 6.7 21.9 5.2 26.3 31.1 6.8 2.2
Jackson 5.9 24.5 5.9 17.0 29.0 15.0 2.7
Jefferson 7.1 20.8 5.6 23.4 27.6 14.0 1.3
Josephine 5.1 17.6 4.7 19.8 30.7 19.1 3.2
Klamath 6.0 19.2 6.4 22.1 29.2 15.2 2.0
Lake 4.6 16.3 4.2 21.6 32.9 18.2 2.1
Lane 5.2 18.3 8.8 24.6 27.9 12.8 2.3
Lincoln 4.9 14.5 4.6 20.0 34.4 19.2 2.4
Linn 6.6 20.2 5.8 24.4 27.5 13.3 2.1
Malheur 7.4 21.3 6.7 25.4 24.3 12.6 2.3
Marion 7.5 22.0 6.8 26.1 24.7 10.9 2.0
Morrow 7.1 24.3 5.1 24.0 26.8 11.5 1.2
Multnomah 6.3 16.6 7.3 33.8 25.4 8.8 1.7
Polk 6.5 21.7 7.9 23.1 26.0 12.6 2.2
Sherman 5.3 16.3 4.5 19.2 32.8 19.2 2.5
Tillamook 5.4 16.7 4.4 20.6 32.2 18.7 2.1
Umatilla 7.4 22.1 6.4 25.9 25.4 11.1 1.7
Union 6.3 19.8 7.5 21.6 28.2 14.1 2.6
Wallowa 5.3 19.0 4.4 13.6 34.6 19.9 3.3
Wasco 6.5 18.9 5.5 22.5 28.7 14.5 3.1
Washington 7.2 20.7 6.0 30.9 25.1 8.5 1.6
Wheeler 4.8 15.1 2.8 16.6 31.6 26.1 3.1
Yamhill 6.5 22.0 6.9 25.1 25.9 11.2 2.1
Source: U.S. Census Bureau, Census 2010

133
Oregon Population by Age Group Category
Community
Under 5
years
(%)
5-19
years
(%)
20-24
years
(%)
25-44
years
(%)
45-64
years (%)
65-84
years
(%)
85 years or
more (%)
Adair Village 8.9 29.9 3.7 34.0 20.0 3.3 0.2
Adams 4.9 22.8 2.9 25.5 27.7 14.7 1.7
Adrian 6.2 16.9 5.1 24.2 24.8 21.4 1.1
Albany 7.1 20.7 6.8 27.4 24.7 11.1 2.1
Amity 7.4 26.6 5.6 29.4 23.0 7.4 0.7
Antelope - - - - - - -
Arlington 6.0 17.0 3.6 24.9 32.9 4.5 1.0
Ashland 3.5 17.2 10.7 20.5 30.4 14.6 3.0
Astoria 5.8 16.8 6.3 24.3 29.9 14.3 2.8
Athena 5.3 22.4 4.6 22.2 29.2 13.8 2.5
Aumsville 9.0 28.0 5.3 28.2 21.1 7.6 0.8
Aurora 8.0 21.5 3.5 24.5 31.8 9.9 0.9
Baker City 5.8 17.9 5.0 23.0 27.8 17.2 3.3
Bandon 3.6 13.7 4.3 17.3 31.2 25.0 5.0
Banks 8.5 32.4 4.3 31.7 19.2 3.4 0.6
Barlow 6.7 27.3 3.7 23.0 26.7 11.1 1.5
Bay City 6.5 14.9 5.1 22.4 30.3 19.6 1.6
Beaverton 6.8 18.3 7.0 33.0 24.5 8.3 2.1
Bend 6.9 19.1 6.4 30.0 25.1 10.3 2.1
Boardman 10.0 28.7 7.8 28.9 18.8 5.5 0.5
Bonanza 9.2 22.9 5.5 26.3 21.9 11.8 2.4
Brookings 5.6 17.7 4.8 19.8 28.0 19.8 4.4
Brownsville 6.6 20.8 5.1 24.8 29.3 12.1 1.3
Burns 5.8 18.3 6.1 20.3 30.7 16.5 2.4
Butte Falls 5.0 22.4 6.4 19.1 33.6 12.8 0.7
Canby 7.7 23.5 5.0 25.5 24.0 11.8 2.4
Cannon Beach 5.2 16.3 7.2 20.0 31.6 18.5 1.3
Canyon City 4.8 15.8 4.1 22.2 31.8 18.2 3.1
Canyonville 5.6 21.2 4.3 17.4 25.2 21.6 4.8
Carlton 6.8 25.8 5.5 28.0 24.6 8.3 0.8
Cascade Locks 7.0 16.2 7.9 24.4 32.9 10.4 1.2
Cave Junction 7.1 18.7 6.7 19.1 27.4 18.2 2.9
Central Point 7.5 21.6 5.5 26.8 23.7 13.0 1.9
Chiloquin 7.1 22.3 4.1 20.6 30.9 14.4 0.7
Clatskanie 6.8 21.0 5.6 22.6 27.8 13.7 2.4
Coberg 5.2 20.8 5.1 24.0 34.7 8.6 1.5
Columbia City 4.5 16.0 4.8 20.4 36.0 17.1 1.3
Condon 3.7 12.1 2.6 15.4 34.7 23.2 8.4
Coos Bay 6.3 17.6 7.0 22.7 27.3 16.4 2.7
Coquille 6.0 17.0 5.3 21.2 29.9 18.3 2.3
Cornelius 8.9 27.2 6.6 30.6 20.5 5.7 0.6
Corvallis 4.3 20.1 22.9 22.9 19.3 8.4 2.1
Oregon Population by Age Group Category

134
Community
Under 5
years %
5-19 years
(%)
20-24
years
(%)
25-44 years
(%)
45-64
years (%)
65-84
years
(%)
85 years or
more (%)
Cottage Grove 7.2 19.7 6.0 25.1 25.3 13.1 3.4
Cove 3.8 20.3 1.4 17.6 33.7 20.0 3.3
Creswell 8.1 20.8 4.8 28.9 25.7 10.2 1.7
Culver 9.6 29.0 4.5 27.1 21.3 7.5 0.9
Dallas 6.6 20.8 5.5 23.3 24.8 15.4 3.4
Dayton 8.5 26.7 5.2 26.6 22.9 9.0 1.1
Dayville 2.7 17.5 2.7 16.1 38.3 20.2 2.7
Depot Bay 3.7 7.1 3.9 16.5 38.9 27.1 2.9
Detroit 3.5 16.8 2.0 13.8 48.1 15.4 0.5
Donald 7.6 18.6 5.4 26.7 31.9 8.9 0.7
Drain 7.0 20.8 7.1 22.1 26.6 14.9 1.5
Dufur 5.1 23.4 3.6 20.2 27.1 18.4 2.2
Dundee 6.5 23.9 4.1 29.3 26.0 9.3 0.9
Dunes City 2.8 11.9 1.9 10.9 37.0 32.5 3.0
Durham 7.3 19.0 7.5 23.8 32.0 9.5 0.7
Eagle Point 7.1 22.3 4.6 26.2 25.4 12.3 1.9
Echo 6.7 26.6 3.1 24.1 26.2 9.9 3.4
Elgin 5.8 20.6 3.3 21.9 30.4 16.5 1.2
Elkton 5.1 17.4 1.0 19.0 30.2 22.6 4.6
Enterprise 6.4 16.6 4.1 21.8 29.5 17.4 4.2
Estacada 6.2 22.8 6.1 27.2 24.6 10.7 2.3
Eugene 4.9 18.9 13.2 25.9 24.4 10.2 2.4
Fairview 6.7 19.7 7.6 29.6 26.2 9.3 0.7
Falls City 5.9 19.4 5.6 21.0 31.9 14.6 1.7
Florence 3.8 11.9 4.1 15.5 28.4 30.6 5.7
Forest Grove 7.0 24.0 8.9 25.6 22.2 9.3 3.0
Fossil 4.0 17.0 2.3 14.2 30.5 27.9 4.2
Garibaldi 2.8 11.2 3.6 13.0 41.4 24.9 3.2
Gaston 7.4 22.5 6.3 26.7 31.2 5.2 0.8
Gates 4.0 16.3 4.0 21.2 32.4 19.4 2.5
Gearhart 3.7 15.5 4.4 20.3 37.8 15.6 2.8
Gervais 10.1 30.4 7.4 30.6 17.8 3.1 0.5
Gladstone 5.7 20.3 5.8 26.1 28.3 11.1 2.6
Glendale 8.4 23.5 5.5 24.5 23.9 13.5 0.8
Gold Beach 3.8 14.3 4.2 18.4 36.5 21.0 1.7
Gold Hill 5.7 16.5 6.1 23.1 34.2 13.1 1.3
Granite 0 2.6 0 2.6 50.1 44.7 0
Grants Pass 6.8 20.0 5.9 23.6 25.0 14.4 4.2
Grass Valley 6.1 15.2 2.4 18.2 29.3 24.3 4.3
Greenhorn - - - - - - -
Gresham 7.8 21.4 7.4 28.1 24.5 9.0 1.7

135
Oregon Population by Age Group Category
Community
Under 5
years (%)
5-19 years
(%)
20-24
years
(%)
25-44
years (%)
45-64
years
(%)
65-84
years
(%)
85 years
or more
(%)
Haines 7.2 18.1 5.3 21.9 32.1 14.9 0.5
Halfway 3.8 14.9 5.2 11.7 41.0 20.2 3.1
Halsey 8.0 23.2 7.1 29.8 23.6 8.0 0.4
Happy Valley 7.1 25.4 4.5 27.0 27.9 7.4 0.8
Harrisburg 7.8 25.4 4.5 29.5 24.2 7.9 0.7
Helix 3.8 33.7 3.8 26.1 21.3 9.7 1.6
Heppner 4.3 20.8 3.9 19.6 29.8 19.2 2.3
Hermiston 10.3 24.0 606 27.3 20.8 9.1 1.8
Hillsboro 8.4 20.8 6.9 35.2 20.8 6.7 1.2
Hines 5.8 20.7 3.6 21.8 28.2 16.7 3.1
Hood River 7.9 28.1 5.1 30.6 23.5 9.5 3.1
Hubbard 9.4 27.5 5.8 30.6 20.1 6.3 0.3
Huntington 5.5 13.0 4.3 16.0 30.7 29.1 1.6
Idanha 5.2 6.6 5.2 12.6 52.2 17.1 0.7
Imbler 5.2 22.2 3.9 24.2 34.3 8.9 1.3
Independence 9.1 24.6 10.7 27.3 19.5 7.9 0.8
Ione 5.2 22.2 6.1 19.4 32.5 13.3 1.2
Irrigon 9.3 25.2 5.0 26.3 23.2 10.0 1.3
Island City 7.4 17.5 5.1 22.4 27.3 17.9 2.7
Jacksonville 3.1 14.3 2.8 14.8 35.1 24.8 5.3
Jefferson 9.5 24.2 4.9 29.3 22.8 8.4 1.0
John Day 5.7 18.6 5.6 22.6 25.5 15.9 6.1
Johnson City 3.9 21.7 3.2 22.8 33.8 16.4 2.1
Jordon Valley 1.1 14.3 1.7 12.7 38.1 28.1 3.9
Joseph 6.0 12.2 5.4 18.2 36.1 18.2 4.0
Junction City 7.1 20.3 6.7 26.4 24.4 12.2 2.9
Keizer 7.1 22.7 5.6 26.6 24.7 11.2 2.2
King City 4.7 9.0 1.6 15.4 21.4 35.3 12.7
Klamath Falls 7.2 20.5 10.5 25.2 24.1 10.0 2.2
La Grande 7.2 20.1 11.1 23.6 23.3 11.3 3.4
Lafayette 8.3 26.1 3.9 30.9 22.6 7.5 0.5
Lake Oswego 4.1 19.9 3.8 21.0 35.1 13.2 2.9
Lakeside 2.9 10.1 2.4 14.3 35.5 31.5 3.1
Lakeview 6.2 17.4 4.8 23.0 28.3 17.1 3.1
Lebanon 8.0 20.4 6.7 24.9 23.6 13.1 3.1
Lexington 3.4 24.8 2.9 19.4 31.9 17.2 0.4
Lincoln City 6.1 14.3 5.6 22.8 30.9 17.4 2.9
Lonerock 0 4.8 0 19.1 28.5 42.9 4.8
Long Creek 5.6 18.9 6.6 16.8 34.0 16.2 2.0
Lostine 6.6 16.9 4.2 21.2 33.4 15.0 2.8

136
Oregon Population by Age Group Category
Community
Under 5
years
(%)
15-19
years
(%)
20-24
years
(%)
25-44
years
(%)
45-64
years
(%)
65-84
years
(%)
85 years
or more
(%)
Lowell 8.4 20.6 2.5 26.8 32.7 8.4 0.7
Lyons 6.3 17.5 4.5 21.9 34.0 14.6 1.0
Madras 10.0 23.9 7.3 27.1 21.6 8.2 2.0
Malin 9.8 27.8 8.0 24.6 19.1 9.3 1.4
Manzanita 2.0 8.4 1.8 14.4 36.5 33.3 3.7
Maupin 2.9 14.2 2.9 15.5 32.8 26.9 5.0
Maywood Park 5.3 16.9 3.5 28.9 29.9 13.9 1.9
McMinnville 7.4 22.6 8.5 24.7 22.2 11.8 2.8
Medford 7.2 19.3 6.6 25.4 25.3 12.8 3.3
Merrill 8.9 24.1 6.0 21.8 26.6 11.5 1.1
Metolius 6.3 22.6 4.6 25.7 31.0 9.5 0.3
Mill City 6.9 23.6 5.6 24.2 26.3 12.4 1.1
Millersburg 5.9 20.1 2.8 27.2 30.0 13.5 0.6
Milton-Freewater 9.2 24.9 7.3 24.4 21.2 10.8 2.3
Milwaukie 5.5 17.4 5.5 28.8 29.2 11.6 2.0
Mitchell 3.8 13.1 3.1 16.1 33.1 27.0 3.8
Molalla 9.6 23.7 5.7 31.4 19.6 8.1 1.7
Monmouth 5.8 24.6 22.7 20.8 16.8 7.6 1.8
Monroe 7.1 17.5 4.7 23.7 33.7 12.2 1.0
Monument 3.9 21.2 4.7 26.6 27.4 14.9 1.6
Moro 8.0 13.6 4.9 17.7 30.3 21.9 3.7
Mosier 7.9 15.1 4.2 26.8 30.1 14.0 2.1
Mt. Angel 8.3 21.3 5.7 23.7 20.0 14.0 6.9
Mt. Vernon 4.6 16.0 3.2 20.1 33.9 19.9 2.3
Myrtle Creek 6.4 19.5 5.8 24.2 26.6 15.6 2.0
Myrtle Point 6.2 18.8 4.6 20.3 28.2 19.5 2.3
Nehalem 3.7 15.1 7.7 24.3 27.6 20.3 1.1
Newberg 7.0 22.7 9.3 27.1 21.9 9.3 2.7
Newport 6.3 16.0 5.6 24.0 29.1 16.3 2.7
North Bend 6.3 18.1 6.3 23.3 28.2 14.3 3.4
North Plains 7.3 22.5 4.9 28.6 27.3 8.0 1.3
North Powder 5.5 22.1 2.5 21.2 31.4 15.5 1.8
Nyssa 8.8 28.7 6.3 23.7 19.3 10.2 2.9
Oakland 4.9 21.6 6.1 21.9 31.2 12.5 1.6
Oakridge 5.3 17.3 4.0 18.8 32.0 20.2 2.4
Ontario 9.4 24.1 7.7 23.0 21.0 12.0 2.9
Oregon City 6.7 21.5 6.1 28.8 25.7 9.2 1.9
Paisley 4.5 15.2 2.1 18.1 33.8 24.4 2.1
Pendleton 6.2 19.1 7.7 28.0 26.3 10.7 2.1
Philomath 7.1 24.1 5.9 27.2 26.3 8.2 1.1

137
Oregon Population by Age Group Category
Community
Under 5
years
(%)
15-19
years
(%)
20-24
years
(%)
25-44
years
(%)
45-64
years
(%)
65-84
years
(%)
85 years
or more
(%)
Phoenix 5.3 17.6 5.3 22.8 26.9 19.2 2.8
Pilot Rock 7.3 22.6 5.9 21.9 25.6 14.7 2.2
Port Orford 3.9 9.6 4.9 16.3 36.7 26.0 2.8
Portland 6.0 15.5 7.4 35.5 25.3 8.7 1.8
Powers 5.2 16.0 3.9 15.8 34.9 22.2 2.0
Prairie City 4.4 17.8 3.2 18.9 30.2 21.9 3.7
Prescott 1.8 7.3 1.8 25.4 43.6 18.1 1.8
Prineville 7.3 20.5 5.2 24.9 24.6 14.6 2.9
Rainier 5.4 18.5 4.9 22.8 30.4 15.8 2.2
Redmond 8.1 22.2 6.4 28.8 21.9 10.5 2.1
Reedsport 5.0 15.1 5.0 17.8 29.9 23.3 3.9
Richland 0.6 1.8 1.9 7.0 40.4 43.6 4.5
Riddle 7.4 20.4 7.3 25.3 28.2 10.0 1.4
Rivergrove 5.2 17.4 2.1 17.3 39.9 17.6 0.7
Rockaway Beach 2.7 15.1 5.2 20.2 24.2 24.4 5.3
Rogue River 5.7 15.1 5.2 20.2 24.2 24.4 5.3
Roseburg 6.2 18.0 606 23.8 26.2 14.5 4.6
Rufus 5.2 13.6 4.4 16.8 34.8 23.2 1.6
Salem 7.4 21.0 7.6 27.6 24.5 10.0 2.0
Sandy 8.6 23.3 5.9 29.5 22.6 8.6 1.6
Scappoose 6.7 21.4 4.8 27.7 26.2 10.9 2.4
Scio 7.9 22.0 4.9 26.5 24.8 13.4 0.6
Scotts Mills 6.4 21.0 6.4 21.9 32.5 10.6 1.1
Seaside 6.7 15.7 6.9 24.7 28.6 13.8 3.6
Seneca 6.0 12.5 5.5 15.0 35.6 23.5 1.5
Shady Cove 4.3 14.6 4.2 17.2 33.1 24.1 2.5
Shaniko 2.8 16.7 0 19.5 27.8 33.3 0
Sheridan 8.3 27.0 3.3 32.9 21.6 5.8 1.0
Sherwood 8.3 19.5 4.8 21.4 32.9 12.8 1.6
Siletz 7.3 19.5 4.8 21.4 32.9 12.8 1.6
Silverton 7.8 23.0 5.0 24.7 26.0 11.8 1.8
Sisters 6.1 22.9 3.8 21.9 30.4 12.6 2.2
Sodaville 4.2 22.4 4.9 20.1 35.4 12.0 1.0
Spray 9.4 13.2 3.1 18.8 28.2 24.5 3.1
Springfield 7.3 19.7 7.4 29.0 25.0 9.6 1.9
St. Helens 7.6 22.7 6.3 29.9 23.3 8.5 1.7
St. Paul 6.2 26.7 2.9 26.5 25.7 10.5 1.9
Stanfield 8.7 25.8 5.9 26.6 24.8 7.6 0.7
Stayton 8.0 22.4 6.4 25.3 24.9 10.9 2.0
Sublimity 4.7 18.4 4.1 18.8 24.9 19.7 9.4

138
Oregon Population by Age Group Category
Community
Under 5
years
(%)
15-19
years
(%)
20-24
years
(%)
25-44
years
(%)
45-64
years
(%)
65-84
years
(%)
85 years
or more
(%)
Summerville 9.6 29.6 1.5 27.3 18.5 13.3 0
Sumpter 1.5 6.3 1.5 7.9 48.6 22.4 1.0
Sutherlin 6.2 18.5 4.3 21.2 25.7 20.8 3.3
Sweet Home 7.1 21.1 5.1 22.3 27.5 14.2 2.5
Talent 6.5 19.7 6.2 26.4 24.9 13.5 2.7
Tangent 6.5 26.1 4.0 24.5 26.0 11.8 1.0
The Dalles 7.0 19.3 5.8 24.1 25.8 13.7 4.1
Tigard 6.8 19.6 5.8 29.2 27.4 9.5 1.9
Tillamook 8.9 20.8 7.1 26.2 23.0 11.6 2.4
Toledo 6.6 21.2 5.8 26.2 28.5 10.4 1.4
Troutdale 7.5 23.1 6.7 27.9 27.1 6.7 0.9
Tualatin 7.3 22.0 6.1 31.0 26.8 6.0 1.0
Turner 6.9 21.4 4.3 24.8 24.4 14.0 4.3
Ukiah 7.0 23.6 5.4 14.0 29.0 20.5 0.5
Umatilla 7.5 21.5 8.8 35.6 20.2 5.9 0.4
Union 5.8 21.0 3.8 20.6 30.8 15.9 1.9
Unity 7.0 11.2 0 25.2 32.4 22.5 1.4
Vale 8.9 23.0 7.4 24.8 19.7 12.4 4.0
Veneta 8.1 19.2 5.6 30.4 26.0 9.6 1.2
Vernonia 6.7 23.2 4.8 25.3 29.2 9.8 1.0
Waldport 4.1 13.2 3.5 16.1 36.9 23.9 2.4
Wallowa 5.6 17.7 3.2 18.4 34.2 18.4 2.6
Warrenton 6.7 20.1 6.8 25.2 27.4 12.6 1.4
Wasco 4.9 14.7 6.3 18.3 31.9 21.4 2.4
Waterloo 3.9 21.0 4.8 25.3 31.5 12.3 1.3
West Linn 5.7 22.7 3.8 23.3 33.4 9.8 1.3
Westfir 3.6 17.3 0.8 20.5 39.2 15.8 2.8
Weston 7.8 19.0 5.4 25.3 26.8 13.9 1.6
Wheeler 2.9 10.1 2.7 18.6 34.3 27.8 3.6
Willamina 7.5 24.6 6.1 25.4 26.6 9.0 0.8
Wilsonville 6.2 17.8 6.8 32.2 23.8 10.3 2.9
Winston 7.1 19.3 6.2 24.0 26.2 15.0 1.9
Wood Village 10.2 24.8 5.9 29.8 21.6 7.0 0.5
Woodburn 9.7 24.1 6.7 26.2 17.9 12.4 2.9
Yachats 1.0 5.0 2.3 10.8 39.5 34.5 6.8
Yamhill 7.2 22.8 4.5 25.6 31.0 8.1 0.9
Yoncalla 4.2 19.4 3.4 20.8 32.2 18.3 1.8
Source: U.S. Census Bureau, Census 2010

139
Oregon Race Data
Geographic
Area
Total
Population White
Black or
African/
American
American
Indian and
Alaska Native Asian
Native Hawaiian
& Other Pacific
Islander
Some
Other
Race
Two or
More Races
Hispanic
or Latino
(of any race)
State 3,831,074 3,204,614 69,206 53,203 141,263 13,404 204,625 144,759 450,062
County
Baker County 16,134 15,264 57 181 78 9 164 381 528
Benton County 85,579 74,506 759 627 4,429 213 1,985 3,060 5,467
Clackamas County 375,992 331,571 3,082 3,122 13,729 867 11,756 11,865 29,138
Clatsop County 37,039 33,680 195 362 457 86 1,208 1,051 2,838
Columbia County 49,351 45,651 207 656 457 95 590 1,695 1,987
Coos County 63,043 56,618 258 1,589 660 117 1,072 2,729 3,391
Crook County 20,978 19,441 35 302 97 11 670 422 1,463
Curry County 22,364 20,574 67 426 160 21 294 822 1,201
Deschutes County 157,733 145,374 568 1,449 1,476 210 4,663 3,993 11,718
Douglas County 107,667 99,471 317 1,953 1,040 122 1,279 3,485 5,055
Gilliam County 1,871 1,781 3 19 3 13 26 261 88
Grant County 7,445 7,070 14 91 24 8 67 171 207
Harney County 7,422 6,819 19 232 35 1 95 221 294
Hood River County 22,346 18,568 101 181 314 37 2,439 706 6,589
Jackson County 203,206 180,172 1,372 2,386 2,364 595 9,200 7,117 21,745
Jefferson County 21,720 14,996 138 3,667 93 25 1,977 824 4,195
Josephine County 82,713 76,449 347 1,133 681 145 1,282 2,676 5,251
Klamath County 66,380 57,019 432 2,734 621 75 2,751 2,748 6,915
Lake County 7,895 7,130 39 165 53 5 241 262 545
Lane County 351,715 310,685 3,369 4,070 8,322 769 9,837 14,663 26,167
Lincoln County 46,034 40.393 193 1,590 492 59 1,586 1,721 3,655
Linn County 116,672 105,669 534 1,488 1,111 162 3,888 3,820 9,127
Malheur County 31,313 24,272 370 364 527 30 4,849 901 9,867
Marion County 315,335 246,656 3,371 4,959 5,995 2,329 39,819 12,206 27,880
Morrow County 11,173 8,680 55 139 104 14 1,892 289 3,497
Multnomah County 735,334 562,421 41,401 7,825 47,950 4,029 37,865 33,843 80,138

140
Oregon Race Data
County
Total
Population White
Black or
African/
American
American
Indian
And
Alaska
Native Asian
Native
Hawaiian
& Other
Pacific
Islander
Some
Other
Race
Two or
More
Races
Hispanic
Or
Latino
(of any
race)
Polk County 75,403 64,808 424 1,616 1,435 210 4,041 2,869 3,608
Sherman County 1,765 1,648 4 29 3 1 48 32 98
Tillamook County 25,250 23,102 85 260 227 59 904 613 2,284
Umatilla County 75,889 59,995 638 2,662 664 101 9,485 2,344 18,107
Union County 25,748 23,968 132 289 209 227 333 590 1,002
Wallowa County 7,008 6,731 26 45 24 7 37 138 156
Wasco County 25,213 21,700 106 1,117 192 145 1,311 642 3,743
Washington County 529,710 405,642 9,616 3,937 45,755 2,433 39,797 22,530 83,270
Wheeler County 1,441 1,332 0 18 8 2 37 44 62
Yamhill County 99,193 84,758 872 1,520 1,474 172 7,137 3,260 14,592
Source: U.S. Census Bureau, Census 2010

141
Community
Total
Population White
Black or
African/
American
American
Indian And
Alaska Native Asian
Native
Hawaiian
& Other
Pacific Islander
Some
Other
Race
Two or
More
Races
Hispanic
Or Latino
(of any race)
Adair Village 840 743 10 12 16 2 7 50 56
Adams 350 320 1 7 0 0 8 14 24
Adrian 177 167 0 1 2 0 5 10 48
Albany 50,158 44,057 333 592 682 93 2,602 1,799 5.700
Amity 1,614 1,354 12 41 6 4 138 59 250
Antelope 46 42 0 1 1 0 0 2 0
Arlington 586 546 1 6 1 13 15 4 39
Ashland 20,078 18,126 225 174 423 55 278 797 1,028
Astoria 9,477 8,458 57 104 166 10 368 314 932
Athena 1,126 1,029 5 34 5 0 31 22 51
Aumsville 3,584 3,023 17 80 20 10 241 193 517
Aurora 918 823 5 8 3 0 58 21 100
Baker City 9,828 9,294 45 110 52 1 95 231 346
Bandon 3,066 2,838 11 42 23 4 43 105 168
Banks 1,777 1,643 5 10 22 5 25 67 124
Barlow 135 109 1 1 0 0 19 5 20
Bay City 1,286 1,192 0 10 11 1 42 30 86
Beaverton 89,803 65,566 2,370 576 9,438 415 7,394 4,044 14,628
Bend 76,639 69,977 357 642 956 108 2,590 2,009 6,256
Boardman 3,220 1,935 23 28 77 11 1,061 85 1,986
Bonanza 415 358 1 2 0 0 40 14 115
Brookings 6,336 5,843 22 115 60 7 60 229 419
Brownsville 1,668 1,565 5 20 9 0 14 55 68
Burns 2,806 2,588 9 73 21 1 20 94 131
Butte Falls 423 405 0 3 2 1 0 12 10
Canby 15,829 12,816 93 192 169 29 2,072 458 3,368
Cannon Beach 1,690 1,494 2 6 7 3 153 25 215
Canyon City 703 669 0 19 2 0 2 11 18
Canyonville 1,884 1,625 7 50 87 0 30 85 103
Carlton 2,007 1,818 4 19 16 8 51 91 117

142
Community
Total
Population White
Black or
African/
American
American
Indian And
Alaska Native Asian
Native
Hawaiian
& Other
Pacific Islander
Some
Other
Race
Two or
More
Races
Hispanic
Or Latino
(of any race)
Cascade Locks 1,144 1,003 6 21 10 7 31 66 104
Cave Junction 1,883 1,701 8 38 24 2 36 74 157
Central Point 17,169 15,598 64 180 180 67 530 550 1,553
Chiloquin 734 299 1 361 3 0 4 66 48
City of The Dalles 13,620 11,960 64 205 132 103 777 373 2,318
Clatskanie 1,737 1,613 7 34 8 2 169 57 65
Coburg 1,035 936 4 8 15 6 28 38 77
Columbia City 1,946 1,840 2 20 30 1 19 34 59
Condon 628 663 1 6 1 0 6 5 14
Coos Bay 15,967 13,908 91 415 217 54 454 828 1,220
Coquille 3,866 3,576 16 73 21 4 64 112 206
Cornelius 11,869 7,600 145 155 263 11 3,223 472 5,948
Corvallis 54,462 45,613 615 376 3,977 182 1,520 2,179 4,049
Cottage Grove 9,686 8,758 27 125 107 7 297 365 774
Cove 552 503 0 4 9 1 9 26 20
Creswell 5,031 4,510 20 51 50 6 207 187 434
Culver 1,357 1,079 5 45 5 1 176 46 412
Dallas 14,583 13,497 33 297 111 19 235 391 867
Dayton 2,534 2,006 13 26 24 0 372 93 758
Dayville 149 143 0 5 0 0 0 1 1
Depoe Bay 1,398 1,299 0 21 17 3 21 37 67
Detroit 202 193 0 3 0 0 0 6 6
Donald 979 864 6 3 5 3 60 38 143
Drain 1,151 1,069 2 31 3 0 12 34 51
Dufur 604 571 0 10 1 1 8 13 9
Dundee 3,162 2,885 12 38 43 5 97 82 329
Dunes City 1,303 1,243 3 9 9 1 5 33 22
Durham 1,351 1,132 23 5 18 19 111 43 186
Eagle Point 8,469 7,800 19 109 83 9 145 304 579

143
Community
Total
Population White
Black or
African/
American
American
Indian And
Alaska Native Asian
Native
Hawaiian
& Other
Pacific Islander
Some
Other
Race
Two or
More
Races
Hispanic
Or Latino
(of any race)
Echo 699 602 0 7 0 5 67 18 87
Elgin 1,711 1,630 3 22 3 10 21 22 56
Elkton 195 180 0 2 0 0 4 9 17
Enterprise 1,940 1,861 5 11 9 1 10 43 60
Estacada 2,695 2,479 21 20 31 6 74 64 203
Eugene 156,185 134,018 2,126 1,606 6,283 364 4,497 7,291 12,200
Fairview 8,920 6,521 408 101 491 88 868 443 1,463
Falls City 947 867 1 22 4 1 17 35 49
Florence 8,466 7,835 25 111 83 28 117 267 454
Forest Grove 21,083 16,615 164 231 556 62 2,643 812 4,873
Fossil 473 437 0 13 4 0 4 15 473
Garibaldi 779 738 1 6 7 0 1 26 27
Gaston 637 581 2 9 4 1 21 19 70
Gates 471 435 1 8 4 0 2 21 21
Gearhart 1,462 1,383 5 6 11 3 25 29 59
Gervais 2,464 1,290 14 90 22 1 937 110 1,653
Gladstone 11,497 10,260 99 111 180 44 390 413 1,001
Glendale 874 785 3 12 1 0 33 40 82
Gold Beach 2,253 2,062 6 45 19 1 13 107 111
Gold Hill 1,220 1,141 2 19 6 0 8 44 33
Granite 38 36 0 2 0 0 0 0 2
Grants Pass 34,533 31,388 187 427 368 89 781 1,293 2,940
Grass Valley 164 159 0 1 0 0 1 3 5
Greenhorn - - - - - - - - -
Gresham 105,594 80,260 3,732 1,343 4,507 717 10,306 4,729 19,984
Haines 416 393 0 5 0 0 3 15 6
Halfway 288 271 0 5 2 1 4 5 10
Halsey 904 853 3 5 5 1 4 33 44
Happy Valley 13,903 10,590 150 68 2,417 21 132 525 563

144
Community
Total
Population White
Black or
African/
American
American
Indian And
Alaska Native Asian
Native
Hawaiian
& Other
Pacific Islander
Some
Other
Race
Two or
More
Races
Hispanic
Or Latino
(of any race)
Harbeck-Fruitdale 1,177 1,088 1 26 4 1 12 45 84
Harrisburg 3,567 3,258 19 36 12 5 114 123 284
Helix 184 149 0 16 0 0 7 12 11
Heppner 1,291 1,194 2 15 4 0 33 43 48
Hermiston 16,745 12,420 136 221 252 39 3,174 503 5,852
Hillsboro 91,611 67,145 1,812 943 7,872 412 9,166 4,261 20,726
Hines 1,563 1,483 4 15 6 0 18 37 49
Hood River 7,167 6,229 39 40 109 6 531 213 1,748
Hubbard 3,173 2,327 16 74 29 4 614 109 1,153
Huntington 440 406 1 17 3 0 2 11 8
Idanha 134 129 0 0 0 0 0 5 7
Imbler 306 287 0 3 0 4 8 4 8
Independence 8,590 6,296 33 157 102 14 1,638 350 3,031
Ione 329 285 0 3 2 0 27 12 39
Irrigon 1,826 1,392 8 26 11 1 338 50 584
Island City 989 937 1 6 5 8 9 23 34
Jacksonville 2,785 2,663 10 16 24 3 16 53 82
Jefferson 3,098 2,596 5 52 16 9 298 122 596
John Day 1,744 1,647 8 26 12 1 18 32 47
Johnson City 566 477 2 8 11 0 42 26 87
Jordan Valley 181 172 0 6 0 0 0 3 12
Joseph 1,081 1,024 8 10 4 5 8 22 22
Junction City 5,392 4,876 37 69 34 7 198 171 483
Keizer 36,478 30,110 289 480 599 230 3,291 1,479 6,693
King City 3,111 2,770 55 11 162 9 40 64 140
Klamath Falls 20,840 17,380 215 897 340 24 934 1,050 2,468
Lafayette 3,742 3,166 13 35 26 1 368 133 824

145
Geographic
Area
Total
Population White
Black or
African/
American
American Indian
And Alaska
Native Asian
Native Hawaiian
& Other
Pacific Islander
Some
Other
Race
Two or
More
Races
Hispanic
Or Latino
(of any race)
La Grande 13,082 11,944 111 178 149 193 183 324 601
Lake Oswego 36,619 32,694 264 149 2,056 66 303 1,087 1,356
Lakeside 1,699 1,604 5 26 4 0 15 45 55
Lakeview 2,294 2,095 0 36 18 2 66 77 179
Lebanon 15,518 14,150 71 223 170 16 320 568 901
Lexington 238 220 0 0 1 0 4 13 3
Lincoln City 7,930 6,635 32 279 122 11 563 288 1,048
Lonerock 21 21 0 0 0 0 0 0 0
Long Creek 197 186 0 3 0 0 1 7 11
Lostine 213 198 0 5 7 0 0 3 4
Lowell 1,045 950 0 18 7 0 7 63 37
Lyons 1,161 1,061 5 17 13 5 23 37 52
McMinnville 32,187 26,455 233 402 494 61 3,429 1,113 6,630
Madras 6,046 4,012 40 417 47 15 1,191 324 2,330
Malin 805 568 0 9 0 0 207 21 465
Manzanita 598 548 7 1 11 0 7 24 37
Maupin 418 400 0 3 1 1 1 12 5
Maywood Park 752 643 26 3 44 1 5 30 30
Medford 74,907 64,452 666 935 1,113 345 4,483 2,913 10,319
Merrill 844 598 1 13 0 0 201 31 364
Metolius 710 537 7 27 4 1 105 29 168
Mill City 1,855 1,682 8 36 8 11 37 73 171
Millersburg 1,329 1,221 1 14 18 0 40 35 88
Milton-Freewater 7,050 4,997 39 56 41 1 1,743 173 3,036
Milwaukie 20,291 17,960 271 273 503 60 502 722 1,426
Mitchell 130 120 0 1 0 0 0 9 2
Molalla 8,108 7,045 49 85 66 21 605 237 1,173
Monmouth 9,534 7,890 109 141 313 55 631 395 1,280
Monroe 617 549 1 8 1 0 41 17 100
Monument 128 121 0 1 0 0 5 1 5

146
Geographic
Area
Total
Population White
Black or
African/
American
American Indian
And Alaska
Native Asian
Native Hawaiian
& Other
Pacific Islander
Some
Other
Race
Two or
More
Races
Hispanic
Or Latino
(of any race)
Moro 324 300 0 10 0 0 9 5 13
Mosier 433 390 1 10 5 3 18 6 97
Mount Angel 3,286 2,713 16 33 17 1 399 107 859
Mount Hood
Village 4,864 4,823 5 64 34 4 99 135 270
Mount Vernon 527 503 0 1 1 0 9 13 16
Myrtle Creek 3,439 3,118 9 71 27 3 41 170 149
Myrtle Point 2,514 2,259 11 88 4 2 28 122 116
Nehalem 271 252 0 1 3 0 8 7 16
Newberg 22,068 18,966 168 172 486 38 1,553 685 2,985
Newport 9,989 8,398 63 205 164 15 751 393 1,525
North Bend 9,695 8,658 31 223 162 22 123 476 564
North Plains 1,947 1,733 8 24 36 12 61 73 214
North Powder 439 406 2 7 2 0 10 12 39
Nyssa 3,267 2,060 10 22 42 0 1,009 124 1,976
Oakland 927 873 1 13 3 0 11 26 28
Oakridge 3,205 2,907 31 57 18 1 48 143 172
Ontario 11,366 7,902 74 153 251 14 2,570 402 4,691
Oregon City 31,859 29,033 191 271 548 71 747 998 2,339
Paisley 243 228 5 3 2 0 0 5 4
Pendleton 16,612 14,507 231 528 187 26 590 543 1,605
Philomath 4,584 4,174 31 56 45 1 108 169 307
Phoenix 4,538 3,810 39 68 58 9 359 195 715
Pilot Rock 1,502 1,405 0 26 0 0 15 56 48
Portland 583,776 444,216 36,695 5,991 41,692 3,109 27,280 5,360 54,840
Port Orford 1,133 1,057 7 16 6 0 10 37 49
Powers 689 586 0 28 2 0 4 69 30
Prairie City 909 860 1 12 1 2 3 30 28
Prescott 55 47 1 2 0 0 0 5 0
Prineville 9,253 8,366 15 137 62 9 458 206 934

147
Geographic
Area
Total
Population White
Black or
African/
American
American Indian
And Alaska
Native Asian
Native Hawaiian
& Other
Pacific Islander
Some
Other
Race
Two or
More
Races
Hispanic
Or Latino
(of any race)
Rainier city 1,895 1,764 3 25 4 2 29 68 75
Redmond 26,215 23,341 104 333 203 53 1,412 769 3,275
Reedsport 4,154 3,863 13 46 45 4 55 128 205
Richland 156 148 2 2 0 0 0 4 0
Riddle 1,185 1,063 4 35 6 1 14 62 60
Rivergrove 289 272 0 0 9 0 1 7 7
Rockaway Beach 1,312 1,239 5 9 9 0 14 36 38
Rogue River 2,131 1,989 16 25 9 0 45 47 112
Roseburg 21,181 19,279 97 370 341 53 303 738 1,155
Rufus 249 222 0 13 0 0 13 1 33
St. Helens 12,883 11,636 79 208 168 42 168 582 785
St. Paul 421 396 0 2 0 0 20 3 62
Salem 154,637 122,213 2,283 2,284 4,215 1,460 15,545 6,637 31,359
Sandy 9,570 8,616 40 124 118 19 327 326 884
Scappoose 6,592 6,009 28 78 86 15 142 234 334
Scio 838 766 3 15 5 1 17 31 26
Scotts Mills 357 348 0 1 5 0 0 3 8
Seaside 6,457 5,690 39 54 89 8 377 200 800
Seneca 199 197 1 0 0 0 0 1 2
Shady Cove 2,904 2,772 8 19 10 1 16 78 137
Shaniko 36 27 0 0 3 0 0 6 3
Sheridan 6,127 4,589 338 294 127 42 468 269 1,020
Sherwood 18,194 16,097 144 87 630 61 498 677 1,279
Siletz 1,212 845 5 223 5 2 18 114 60
Silverton 9,222 8,211 32 74 95 7 547 256 1,131
Sisters 2,038 1,913 0 23 14 0 46 42 145
Sodaville 308 275 2 5 3 0 1 22 6
Spray 160 152 0 1 4 0 0 3 1
Springfield 59,403 51,005 649 851 758 189 3,112 2,839 7,194
Stanfield 2,043 1,367 2 32 2 0 556 84 734

148
Geographic
Area
Total
Population White
Black or
African/
American
American Indian
And Alaska
Native Asian
Native Hawaiian
& Other
Pacific Islander
Some
Other
Race
Two or
More
Races
Hispanic
Or Latino
(of any race)
Stayton 7,644 6,707 36 105 57 13 453 273 1,096
Sublimity 2,681 2,568 5 13 12 1 28 54 83
Summerville 135 131 0 0 0 0 1 3 3
Sumpter 204 188 0 5 1 0 0 10 2
Sutherlin 7,810 7,219 19 150 44 7 143 228 476
Sweet Home 8,925 8,330 23 120 72 12 101 267 418
Talent 6,066 5,278 49 78 57 12 358 234 948
Tangent 1,164 1,041 2 9 4 2 54 52 98
Tigard 48,035 38,253 845 327 3,456 414 2,835 1,905 6,106
Tillamook 4,935 4,271 10 73 52 41 341 147 847
Toledo 3,465 3,116 22 133 17 3 40 134 163
Troutdale 15,962 13,345 335 165 729 69 677 642 1,692
Tualatin 26,054 20,950 325 188 915 249 2,329 1,098 4,498
Turner 1,854 1,728 12 31 9 0 37 37 136
Ukiah 186 168 0 4 6 0 5 3 8
Umatilla 6,906 4,843 162 102 40 2 1,593 164 2,976
Union 2,121 2,028 2 23 3 3 13 49 49
Unity 71 59 0 3 9 0 0 0 6
Vale 1,874 1,624 5 25 8 6 153 53 439
Veneta 4,561 4,187 17 62 37 8 86 164 250
Vernonia 2,151 2,024 7 27 11 4 17 61 91
Waldport 2,033 1,855 16 22 20 6 11 103 68
Wallowa 808 775 4 3 0 0 3 23 16
Warrenton 4,989 4,566 29 67 54 33 92 148 286
Wasco 410 392 2 3 1 1 6 5 8
Waterloo 229 221 0 3 0 0 1 4 13
Westfir 253 233 1 4 1 0 2 12 253
West Linn 25,109 22,778 168 87 1,012 37 250 777 998
Weston 667 557 2 23 21 0 39 25 57
Wheeler city 414 400 0 1 2 1 5 5 14

149
Geographic
Area
Total
Population White
Black or
African/
American
American Indian
And Alaska
Native Asian
Native Hawaiian
& Other
Pacific Islander
Some
Other
Race
Two or
More
Races
Hispanic
Or Latino
(of any race)
Willamina 2,025 1,663 7 178 3 8 46 120 121
Wilsonville 19,509 16,644 296 190 746 85 928 620 2,360
Winston 5,379 4,974 14 87 51 5 61 187 242
Woodburn 24,080 14,551 129 675 191 26 7,597 911 14,183
Wood Village 3,878 2,427 79 89 147 7 971 158 1,433
Yachats 690 657 1 12 4 0 5 11 33
Yamhill 1,024 934 1 13 11 0 27 38 56
Yoncalla 1,047 966 0 18 5 2 18 38 48
Source: U.S. Census Bureau, Census 2010

150
Percentage Below Poverty Level in 2009
Families
Families
with
children
under 18
Families
with
children
under 5
Families with
female
householder,
no husband
present
Families with
female
householder,
no husband
present
with children
under 18
Families with
female
householder,
no husband
present
with children
under 5
State 11.0 18.2 21.0 31.7 42.0 55.4
County
Baker 12.7 14.8 37.3 43.6 54.7 100.0
Benton 9.4 12.9 13.7 34.0 39.8 100.0
Clackamas 6.7 11.6 11.3 18.6 24.8 42.3
Clatsop 9.2 16.5 10.4 25.8 35.1 -
Columbia 9.2 16.4 22.2 34.0 42.1 89.7
Coos 12.7 23.7 30.1 40.4 56.9 75.7
Crook 11.0 21.7 16.6 37.3 52.0 66.7
Curry 5.3 10.9 11.1 23.2 32.0 100.0
Deschutes 11.4 19.5 14.3 45.6 51.4 34.8
Douglas 14.3 23.1 36.4 31.9 43.1 62.4
Gilliam 9.8 18.3 - 29.2 46.7 -
Grant 11.4 16.2 17.9 28.1 31.9 83.3
Harney 14.1 26.2 27.0 34.4 35.6 70.0
Hood River 5.5 3.5 4.9 20.3 10.0 27.9
Jackson 12.3 18.0 21.6 29.1 44.0 69.3
Jefferson 13.2 23.4 49.7 45.1 56.6 100.0
Josephine 10.9 22.4 38.9 24.9 38.8 66.9
Klamath 12.7 21.1 23.9 32.3 38.7 44.3
Lake 13.1 24.3 46.8 53.1 58.7 69.3
Lane 10.6 16.6 19.8 27.5 35.1 37.2
Lincoln 11.6 21.2 16.6 39.3 49.1 55.2
Linn 11.3 19.1 34.3 35.4 38.4 63.7
Malheur 17.7 27.0 25.5 40.0 45.8 15.2
Marion 11.7 19.7 21.7 34.2 43.6 61.9
Morrow 12.4 19.0 31.7 30.2 36.4 73.8
Multnomah 13.6 21.8 19.1 38.3 50.1 51.9
Polk 13.3 21.6 26.5 31.2 42.0 45.7
Sherman 13.9 28.4 85.2 50.0 70.5 100.0
Tillamook 12.8 22.7 13.2 50.2 63.3 92.5
Umatilla 10.9 18.3 26.8 32.0 43.3 63.4
Union 9.9 18.8 45.3 33.4 38.2 61.5
Wallowa 9.6 15.4 33.0 23.3 31.0 100.0
Wasco 11.1 19.6 26.9 36.9 49.4 83.6
Washington 6.7 10.2 13.0 24.0 30.9 39.3
Wheeler 9.1 18.5 - 45.2 61.3 -
Yamhill 9.0 14.5 26.2 32.7 42.0 75.6
Source: U.S. Census Bureau, Census 2010

151
Percentage Below Poverty Level in 2009
Municipality Families
Families
with
children
under 18
Families
with
children
under 5
Families with
female
householder,
no husband
present
Families with
female
householder, no
husband present
with children
under 18
Families with
female
householder, no
husband present
with children
under 5
Adair Village 7.8 10.6 - 18.8 42.9 -
Adams 2.5 6.1 - 16.7 25.0 -
Adrian 6.3 - - - - -
Albany 12.2 18.3 31.9 34.9 36.3 49.0
Amity 20.7 30.7 31.6 58.5 84.2 100.0
Antelope 66.7 100.0 - 100.0 100.0 -
Arlington 15.5 30.4 - 33.3 50.0 -
Ashland 11.5 20.9 13.4 34.7 39.3 39.2
Astoria 11.5 19.7 - 34.8 42.1 -
Athena 3.7 8.4 - 26.1 35.3 -
Aumsville 11.1 13.1 - 12.9 10.7 -
Aurora 4.9 12.0 14.3 33.3 60.0 -
Baker City 14.2 24.2 45.7 43.8 58.4 100.0
Bandon 13.0 - - - - -
Banks 4.7 6.5 8.6 24.4 33.9 -
Barlow - - - - - -
Bay City 9.3 11.4 7.6 25.9 50.0 50.0
Beaverton 7.2 11.3 19.0 22.2 28.6 46.4
Bend 10.7 18.7 15.2 43.2 50.2 42.5
Boardman 14.4 17.7 36.0 23.3 26.5 38.5
Bonanza 12.7 18.5 71.4 22.7 38.5 -
Brookings 10.8 24.9 33.6 68.3 77.5 100.0
Brownsville 13.1 25.3 6.7 24.1 43.2 40.0
Burns 8.1 16.0 - 20.5 20.5 -
Butte Falls 7.5 15.3 - - - -
Canby 6.4 9.6 5.7 9.2 13.2 -
Cannon Beach 16.5 35.8 - 48.8 59.1 -
Canyon City 11.4 18.4 - 61.3 57.1 -
Canyonville 16.8 22.3 - 33.3 50.0 -
Carlton 6.4 9.1 25.0 14.9 21.7 -
Cascade Locks 9.4 16.4 25.6 36.4 50.0 50.0
Cave Junction 31.5 46.2 72.2 56.4 70.0 100.0
Central Point 8.1 12.4 - 28.0 33.7 -
Chiloquin 40.9 57.3 - 30.3 - -
Clatskanie 7.8 17.3 72.4 37.5 59.0 84.0
Coberg 4.3 8.7 - 12.0 50.0 -
Columbia City 5.5 6.7 6.1 33.3 11.8 100.0
Condon 5.9 19.5 - 28.6 44.4 -
Coos Bay 11.6 19.0 6.3 32.0 49.6 17.3

152
Percentage Below Poverty Level in 2009
Municipality Families
Families
with
children
under 18
Families
with
children
under 5
Families with
female
householder,
no husband
present
Families with
female
householder, no
husband present
with children
under 18
Families with
female
householder, no
husband present
with children
under 5
Coquille 5.4 12.2 41.8 26.4 44.2 100.0
Cornelius 13.3 15.5 10.4 44.9 47.9 27.3
Corvallis 10.9 16.6 14.7 31.1 37.9 46.8
Cottage Grove 12.6 20.5 37.0 42.5 53.5 67.9
Cove 3.9 9.4 100.0 - - -
Creswell 13.5 22.1 11.5 42.4 43.0 -
Culver 33.9 42.1 62.5 69.7 84.7 100.0
Dallas 9.5 15.4 18.3 27.2 34.9 40.2
Dayton 6.3 8.8 - 16.2 19.7 -
Dayville - - - - - -
Depot Bay 8.8 15.2 - 25.6 - -
Detroit 2.3 7.7 - 100.0 100.0 -
Donald 1.2 2.4 - 50.0 50.0 -
Drain 11.3 25.3 - 29.7 51.7 -
Dufur 6.2 10.5 - 21.4 100.0 -
Dundee 1.0 2.0 - 2.9 4.7 -
Dunes City 10.5 19.5 - 54.8 65.4 -
Durham 6.9 12.1 - 41.7 48.8 -
Eagle Point 10.1 15.2 - 15.5 22.4 -
Echo 13.0 19.2 - 25.9 37.8 -
Elgin 11.0 32.5 95.5 36.9 43.6 100.0
Elkton - - - - - -
Enterprise 4.4 4.8 21.3 11.8 19.2 100.0
Estacada 12.3 21.3 9.3 56.7 70.4 -
Eugene 10.1 15.5 18.7 27.3 34.4 36.8
Fairview 13.9 20.6 21.9 29.3 41.6 -
Falls City 17.4 26.3 - 34.0 66.7 -
Florence 5.4 6.6 - 5.3 11.3 -
Forest Grove 14.4 25.2 28.0 43.2 54.5 59.1
Fossil 15.6 46.5 - 68.0 73.9 -
Garabaldi 22.8 40.0 100.0 72.7 100.0 100.0
Gaston 11.6 16.8 - - - -
Gates 16.8 34.1 28.6 87.0 87.0 100.0
Gearhart - - - - - -
Gervais 13.0 16.9 36.4 17.9 28.3 100.0
Gladstone 14.0 27.4 36.3 38.8 55.2 84.8
Glendale 19.4 23.9 - 34.9 78.6 -
Gold Beach 12.7 27.1 42.9 56.3 62.0 100.0
Gold Hill 11.6 20.4 22.5 46.5 56.6 100.0

153
Percentage Below Poverty Level in 2009
Families with female
householder, no
husband present
with children
under 18 Families
Families
with
children
under 18
Families
with
children
under 5
Families with
female
householder,
no husband
present
Families with
female
householder, no
husband present
with children
under 18
Families with
female
householder, no
husband present
with children
under 5
Granite - - - - - -
Grants Pass 16.4 29.0 49.5 44.1 59.0 81.9
Grass Valley - - - - - -
Greenhorn - - - - - -
Gresham 12.9 20.6 23.6 38.7 49.2 65.6
Haines 6.6 17.5 45.5 100.0 100.0 100.0
Halfway 27.2 48.0 66.7 55.6 50.0 100.0
Halsey 12.9 24.8 80.0 30.0 35.3 100.0
Happy Valley 3.2 2.2 - 28.4 29.7 -
Harrisburg 11.7 19.8 - 37.0 54.6 -
Helix - - - - - -
Heppner 21.1 37.4 60.0 82.5 82.5 100.0
Hermiston 15.0 22.9 18.4 47.3 58.4 86.3
Hillsboro 7.2 11.1 11.6 23.7 28.7 31.0
Hines 23.1 40.1 66.1 58.0 77.8 100.0
Hood River 8.5 6.0 9.2 20.1 19.0 66.7
Hubbard 6.3 7.7 - 8.6 13.8 -
Huntington 26.1 57.1 - 40.5 - -
Idanha - - - - - -
Imbler 12.9 25.8 - 89.9 89.9 -
Independence 16.0 24.7 31.7 57.3 67.1 100.0
Ione - - - - - -
Irrigon 23.0 28.9 44.1 43.0 47.1 100.0
Island City 10.5 33.0 - 66.7 79.1 -
Jacksonville - - - - - -
Jefferson 8.0 12.8 - 28.2 44.9 -
John Day 12.7 16.7 12.9 29.8 26.7 57.1
Johnson City 24.6 66.1 - - - -
Jordon Valley 4.2 18.2 - 50.0 100.0 -
Joseph 10.3 27.5 5.0 37.8 41.5 100.0
Junction City 7.8 15.2 42.1 14.7 25.2 -
Keizer 10.8 18.1 9.9 34.2 41.0 56.3
King Valley - - - - - -
Klamath Falls 16.8 25.5 31.3 34.8 44.9 58.4
La Grande 14.9 25.7 36.5 42.2 49.9 67.0
Layfayette 14.9 18.9 - 51.2 55.9 -
Lake Oswego 4.2 5.6 6.4 17.6 20.4 21.1
Lakeside 11.8 25.2 84.2 38.6 60.0 100.0
Lakeview 8.0 16.5 43.4 27.5 31.8 53.4

154
Percentage Below Poverty Level in 2009
Municipality Families
Families
with
children
under 18
Families
with
children
under 5
Families with
female
householder,
no husband
present
Families with
female
householder, no
husband present
with children
under 18
Families with
female
householder, no
husband present
with children
under 5
Lebanon 15.3 24.6 33.6 45.3 53.1 83.3
Lexington - - - - - -
Lincoln City 14.8 33.8 46.2 45.9 59.7 55.0
Lonerock - - - - - -
Long Creek 17.7 8.7 - 66.7 - -
Lostine 11.6 40.0 - 83.3 100.0 -
Lowell 12.1 15.6 - 12.5 - -
Lyons 0.9 2.6 - - - -
Madras 13.7 20.0 22.5 35.4 41.0 55.6
Malin 11.8 17.3 - - - -
Manzanita - - - - - -
Maupin 13.7 36.7 40.0 100.0 100.0 100.0
Maywood Park 12.4 19.2 30.8 36.3 40.1 82.4
McMinnville 5.9 7.4 - 19.5 13.0 -
Medford 12.1 19.4 24.5 31.3 40.1 48.8
Merrill 3.1 2.0 - 3.8 4.5 -
Metolius 8.1 9.0 25.9 45.5 52.6 100.0
Mill City 9.7 14.6 - 20.9 32.1 -
Millersburg 3.1 6.8 - 25.7 32.1 -
Milton-Freewater 20.4 27.6 26.1 46.2 48.7 53.8
Milwaukie 8.4 13.2 4.5 26.6 30.1 10.5
Mitchell - - - - - -
Molalla 9.3 14.4 33.5 27.9 38.1 100.0
Monmouth 10.3 16.1 14.4 25.3 22.1 18.2
Monroe 4.5 6.3 - 12.1 14.3 -
Monument - - - - - -
Moro 34.9 74.3 100.0 84.4 88.9 100.0
Mosier 5.8 10.6 - 28.0 36.8 -
Mt. Angel 11.0 14.3 - 33.7 48.4 -
Mt. Vernon 10.6 32.7 39.3 73.3 100.0 100.0
Myrtle Creek 1.2 3.8 - - - -
Myrtle Point 16.0 38.2 100.0 41.4 70.1 100.0
Nehalem 11.3 - - 42.9 - -
Newberg 7.8 13.2 30.4 32.2 42.0 83.6
Newport 13.2 24.7 27.6 43.3 42.8 71.6
North Bend 13.2 25.1 65.2 55.8 71.9 100.0
North Plains 6.2 11.9 - 33.8 43.6 -
North Powder 11.4 15.1 - - - -
Nyssa 13.9 15.4 10.6 18.2 34.8 -

155
Percentage Below Poverty Level in 2009
Municipality Families
Families
with
children
under 18
Families
with
children
under 5
Families with
female
householder,
no husband
present
Families with
female
householder, no
husband present
with children
under 18
Families with
female
householder, no
husband present
with children
under 5
Oakland 13.0 30.2 48.1 55.8 55.8 100.0
Oakridge 21.7 39.4 33.3 51.5 59.8 100.0
Ontario 17.5 27.2 34.4 34.7 41.8 6.5
Oregon City 10.0 17.5 10.1 36.8 47.1 40.9
Paisley 10.7 47.8 33.3 100.0 100.0 100.0
Pendleton 7.9 14.5 23.9 24.8 40.4 50.6
Pilomath 7.0 11.7 8.8 15.9 18.8 -
Phoenix 7.4 14.7 - 24.6 60.0 -
Pilot Rock 9.1 17.8 - 38.6 50.7 -
Port Orford 10.4 20.5 80.0 30.2 84.2 -
Portland 11.3 17.3 15.7 30.6 40.7 48.6
Powers 8.2 5.6 - 23.5 30.8 -
Prairie City 14.3 33.6 - 15.4 20.7 -
Prescott - - - - - -
Prineville 13.5 25.9 13.2 36.7 51.9 60.0
Rainier 5.7 8.1 - 2.8 - -
Redmond 9.7 14.9 3.1 34.7 42.3 22.8
Reedsport 13.8 28.4 38.6 59.8 87.0 -
Richland - - - - - -
Riddle 8.7 18.6 42.9 47.4 66.7 -
Rivergrove 3.0 7.4 40.0 25.0 28.6 100.0
Rockaway Beach 9.8 43.8 - 24.4 100.0 -
Rogue River 12.2 21.1 8.9 34.3 55.4 -
Roseburg 12.6 25.6 45.0 52.1 58.2 74.9
Rufus 40.0 100.0 - 71.4 100.0 -
Salem 12.4 19.2 25.7 33.4 42.7 66.2
Sandy 2.7 2.6 5.9 10.1 13.7 100.0
Scappoose 6.6 9.2 27.5 13.2 10.9 52.4
Scio 10.6 22.6 - 37.5 50.0 -
Scotts Mills 7.4 16.1 - 38.5 100.0 -
Seaside 15.2 26.0 49.5 31.7 43.1 61.5
Seneca 10.1 - - - - -
Shady Cove 8.5 20.6 41.1 25.7 34.2 100.0
Shaniko 8.3 - - 100.0 - -
Sheridan 12.4 17.4 34.0 30.7 43.1 72.7
Sherwood 2.2 2.7 1.3 8.0 3.8 -
Siletz 25.8 17.2 6.3 41.0 38.6 -
Silverton 11.2 19.1 20.6 21.2 21.9 10.9
Sisters 3.8 7.6 - 8.6 14.3 -

156
Percentage Below Poverty Level in 2009
Municipality Families
Families
with
children
under 18
Families
with
children
under 5
Families with
female
householder,
no husband
present
Families with
female
householder, no
husband present
with children
under 18
Families with
female
householder, no
husband present
with children
under 5
Sodaville 9.7 12.7 - 22.2 28.6 -
Spray 7.1 21.4 - 28.6 100.0 -
Springfield 14.7 20.7 30.0 30.9 37.3 54.1
St. Helens 9.1 15.5 20.2 32.1 44.9 77.0
St. Paul - - - - - -
Stanfield 12.5 21.2 - 25.7 27.3 -
Stayton 7.2 13.4 14.3 26.6 30.7 -
Sublimity 1.5 1.4 - - - -
Summerville 4.2 7.1 - 33.3 33.3 -
Sumpter - - - - - -
Sutherlin 11.0 16.8 16.4 44.6 54.4 100.0
Sweet Home 13.3 26.2 43.5 44.4 57.0 100.0
Talent 13.3 24.3 31.4 30.0 47.0 100.0
Tangent 1.8 3.4 - - - -
The Dalles 10.4 17.9 33.3 32.0 40.6 74.5
Tigard 5.2 8.5 10.6 27.5 35.9 45.6
Tillamook 33.9 47.0 15.1 77.7 79.1 100.0
Toledo 17.0 30.6 10.4 47.0 54.9 54.2
Troutdale 7.7 11.2 5.5 34.1 41.8 -
Tualatin 8.2 11.4 10.7 19.6 22.6 11.6
Turner 17.0 27.0 15.1 51.6 73.8 100.0
Ukiah - - - - - -
Umatilla 16.4 22.7 16.6 48.1 66.7 100.0
Union 10.0 20.1 36.2 36.8 44.7 75.0
Unity 28.6 100.0 - 100.0 100.0 -
Vale 18.2 24.8 17.4 39.7 52.1 45.5
Veneta 5.5 10.0 18.7 23.3 42.0 63.6
Vernonia 3.8 6.7 9.4 21.8 35.4 -
Waldport 24.5 7.2 - - - -
Wallowa 8.9 16.8 100.0 22.2 24.4 100.0
Warrenton 8.8 12.7 24.5 23.7 28.2 53.1
Wasco 13.2 27.0 - 22.7 33.3 -
Waterloo 18.5 30.8 60.0 81.8 100.0 100.0
West Linn 2.7 4.0 4.5 6.8 11.1 -
Westfir 4.4 - - 21.4 - -
Weston 7.6 12.4 - 17.3 18.2 -
Wheeler - - - - - -
Willamina 15.1 20.3 31.9 32.7 41.7 84.2
Wilsonville 7.8 14.2 23.2 26.3 33.9 56.6

157
Percentage Below Poverty Level in 2009
Municipality Families
Families
with
children
under 18
Families
with
children
under 5
Families with
female
householder,
no husband
present
Families with
female
householder, no
husband present
with children
under 18
Families with
female
householder, no
husband present
with children
under 5
Winston 17.9 31.2 100.0 53.5 67.2 100.0
Wood Village 20.9 29.2 25.0 52.8 59.6 50.0
Woodburn 13.7 21.2 22.0 47.1 57.1 91.8
Yachats 3.9 - - - - -
Yamhill 2.6 - - - - -
Yoncalla 19.7 46.2 100.0 24.7 33.9 100.0
Source: U.S. Census Bureau, Census 2010


