RE-Powering America’s Land Initiative Community Solar An Opportunity to Enhance Sustainable Development on Landfills and Other Contaminated Sites December 2016 Prepared under contract to EPA by: ICF Incorporated, LLC
Transcript
RE-Powering America’s Land Initiative
Community Solar
An Opportunity to Enhance Sustainable Development on Landfills and Other Contaminated Sites
December 2016
Prepared under contract to EPA by: ICF Incorporated, LLC
Community Solar: An Opportunity to Enhance Sustainable Development on Landfills and Other Contaminated Sites
2.1 Overview of Community Solar and Its Growing Importanc ... 3
2.2 Confluence of Community Solar, RE-Powering Sites, and Low- and Moderate-Income
Communitie 6
3. Business Case for Community Solar on RE-Powering Sites . 7
3.1 Overall Business Case 7
3.2 Characteristics of the Most Promising RE-Powering Sites . . 9
3.3 Technical Potential of RE-Powering Sites for Community Solar 10
3.4 Opportunities to Increase Deployment of RE-Powering Sites for Community Solar . 12
4. Challenges to Developing RE-Powering Sites for Community Sola 14
5. Discussion Questions .17
6. Appendices 18
Appendix A: Bibliography ....18
Appendix B: Glossary 19
Appendix C: Community Solar Project Data at the State Leve ...21
Appendix D: Technical Potential of RE-Powering Sites near Urban Areas in the 26 States
with Community Solar Projects .....22
Appendix E: Technical Potential of RE-Powering Sites near Urban Areas in Southern
California Edison Territory 23
Appendix F: Technical Potential of RE-Powering Sites in Massachusetts 25
1
1. Introduction
Community solar programs (also called “shared solar”) offer the economic and environmental
benefits of solar to the 49% of Americans without traditional solar access.1 Such programs are
experiencing rapid growth, with active projects across 26 states, up from 6 states in 2010.2 This
market has the potential to grow more than 50-fold from the 110 megawatt (MW) capacity in early
2016 to between 5,500 MW and 11,000 MW by 2020.3 Previously, it was often uneconomic to
develop individual solar projects of less than 2 MW in capacity (2,000 kilowatts [kW])4 if they were
not tied directly to or net metered with a customer site. With community solar, projects between 50
kW and 2,000 kW are often viable because numerous off-site subscribers can purchase shares of a
solar installation rather than hosting the installation themselves. By bringing an enormous source of
new demand into the market and offering new contracting arrangements to the 51% of Americans
who already have potential solar access, community solar is expected to greatly expand the market
for mid-sized solar projects.
One strong but sometimes overlooked source of suitable sites for community solar are those
covered by the U.S. Environmental Protection Agency (EPA) RE-Powering America’s Land
Initiative. The RE-Powering Initiative provides data, tools, analysis, case studies, issue briefings,
and outreach resources to encourage renewable energy development on contaminated lands,
landfills, and mining sites (collectively “RE-Powering sites”). RE-Powering sites represent a large
and varied collection of sites that include former Superfund sites, brownfields, landfills, and mine
sites, as well as other formerly contaminated sites under various federal and state cleanup
programs. Such sites occupy millions of acres across the country and are often found in and among
communities. In addition, the percent of households with income below the poverty line and living in
close proximity to RE-Powering sites is generally higher than the overall U.S. population; that is,
surrounding populations tend to be poorer than average.
RE-Powering sites can therefore potentially provide a higher number of sites for community solar
projects and thereby deflect development pressures away from open space and lands with other
environmental or economic re-use options. As described later in this paper, nearly 9,500 pre-
1 The White House, Fact Sheet: Administration Announces New Initiative to Increase Solar Access for All Americans, July 7, 2015, https://www.whitehouse.gov/the-press-office/2015/07/07/fact-sheet-administration-announces-new-initiative-increase-solar-access [accessed July 2016]. 2 National Renewable Energy Laboratory (NREL), Community Solar: Status, Trends, Legal, and Financial Issues, March 9, 2016, page 3, https://www.epa.gov/sites/production/files/2016-03/documents/webinar_20160309_oshaughnessy.pdf [accessed July 2016]. NREL’s full list of the 26 states and the number of projects completed by state is provided as Figure 8 in Appendix C of this paper. In total, 108 projects are in the NREL document. Community Solar Hub’s website lists similar data on 98 shared solar projects in 25 states with a combined capacity of 100 MW, https://www.communitysolarhub.com/ [accessed November 2016]. 3 NREL, Shared Solar: Current Landscape, Market Potential, and the Impact of Federal Securities Regulation, April 2015, page v, http://www.nrel.gov/docs/fy15osti/63892.pdf [accessed July 2016]. 4 1,000 kilowatts (kW) = 1 megawatt (MW). While 2 MW has been a common historical limit to individual community solar projects, larger examples are likely in the future. Xcel Energy’s Minnesota Solar*Rewards Community® program has several hundred MWs of applications from the time when “co-location” of five adjacent projects of 1 MWAC was allowed, which effectively makes a 5 MWAC project. Another example is the utility Southern California Edison, which will allow community solar projects up to 3 MWDC in capacity, as highlighted in Section 3.3 of this paper.
screened RE-Powering sites, representing 8,800 MW to 15,200 MW of technical solar photovoltaic
(PV) potential, are available for development in the 26 states that currently have community solar
projects.5 This means that RE-Powering sites could, in concept, meet the entire community solar
market forecast previously described. Beyond the raw numbers, RE-Powering sites offer valuable
added benefits. They enable a unique opportunity to re-purpose sites that may have no other
immediate development potential and have historically created environmental concerns for the
community. RE-Powering sites also can add sustainable re-use to the winning combination of
subscriber access and economies of scale that has fueled community solar growth.
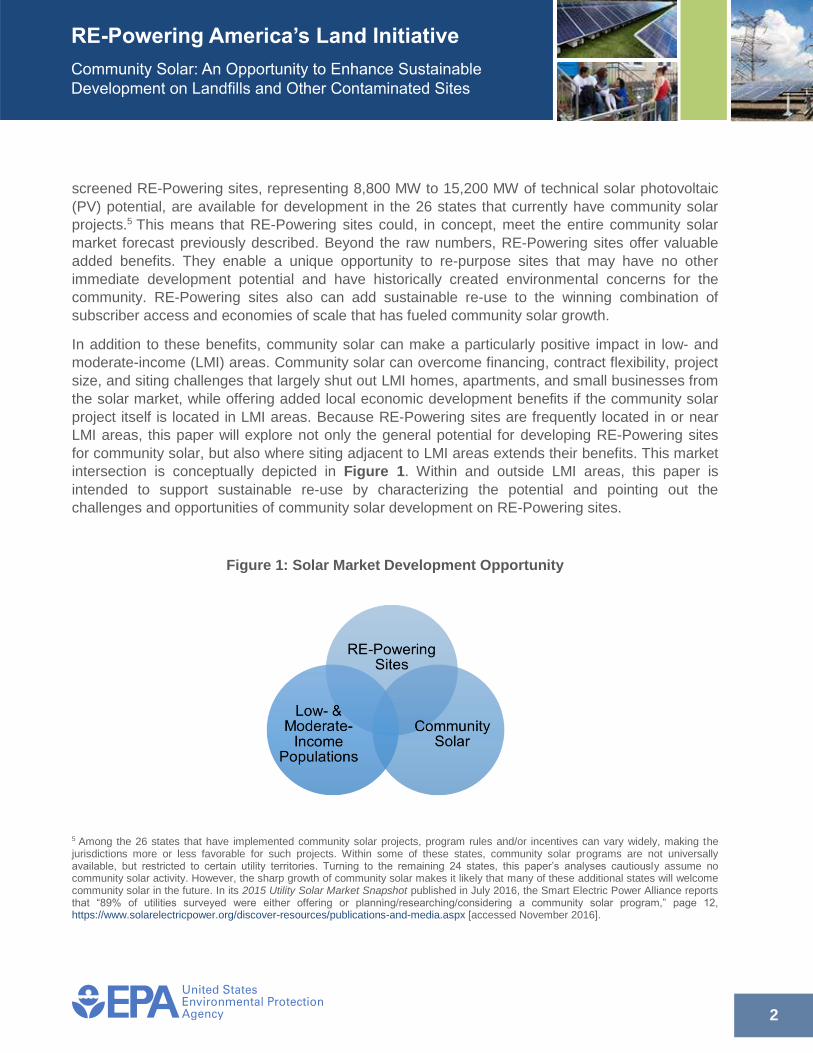
In addition to these benefits, community solar can make a particularly positive impact in low- and
moderate-income (LMI) areas. Community solar can overcome financing, contract flexibility, project
size, and siting challenges that largely shut out LMI homes, apartments, and small businesses from
the solar market, while offering added local economic development benefits if the community solar
project itself is located in LMI areas. Because RE-Powering sites are frequently located in or near
LMI areas, this paper will explore not only the general potential for developing RE-Powering sites
for community solar, but also where siting adjacent to LMI areas extends their benefits. This market
intersection is conceptually depicted in Figure 1. Within and outside LMI areas, this paper is
intended to support sustainable re-use by characterizing the potential and pointing out the
challenges and opportunities of community solar development on RE-Powering sites.
Figure 1: Solar Market Development Opportunity
5 Among the 26 states that have implemented community solar projects, program rules and/or incentives can vary widely, making the jurisdictions more or less favorable for such projects. Within some of these states, community solar programs are not universally available, but restricted to certain utility territories. Turning to the remaining 24 states, this paper’s analyses cautiously assume no community solar activity. However, the sharp growth of community solar makes it likely that many of these additional states will welcome community solar in the future. In its 2015 Utility Solar Market Snapshot published in July 2016, the Smart Electric Power Alliance reports that “89% of utilities surveyed were either offering or planning/researching/considering a community solar program,” page 12, https://www.solarelectricpower.org/discover-resources/publications-and-media.aspx [accessed November 2016].
Green Power Claims & Renewable Energy Certificates
While community solar offers new options for sustainable land re-
use and buying energy, it is important to understand how green
power claims are treated in different community solar programs and
the implications of those treatments. The accounting mechanism for
green power claims is typically renewable energy certificates
(RECs). Broadly, RECs from a community solar project can be:
Retained by the solar project owner, utility, or other community
solar administrator to use for its own claims;
Retired on behalf of the subscriber (person or business buying
from/participating in the community solar program); or
Provided to the subscriber.
Only the party that owns the RECs can claim the green power
benefits from the solar project. For example, if a business
participates in a community solar program following the first option
above, then the business cannot under Federal Trade Commission
guidelines say that it is buying green power. Likewise, no valid
green power purchase claim can be made if the business receives
the RECs (third option above), but later sells them for financial gain.
The disposition of RECs will also affect how community solar is
accounted for in greenhouse gas inventories.
Community solar participants should be informed about how RECs
are handled in their programs and make claims consistent with
standard environmental practice. The message is not, however, that
community solar development on RE-Powering sites is better or
worse depending on who owns the RECs. There are many economic,
environmental, and social benefits that can result from renewable
energy development, irrespective of REC ownership.
2. Market Context
2.1 Overview of Community Solar and Its Growing Importance
In this discussion, community solar programs include a shared solar array that is subscribed to by
multiple utility end-use customers, with credits for energy production applied to customers’ existing
accounts (see Figures 2 and 3). The customers are within the same utility territory as the solar
project, but the project is usually off-site (not connected to residential or commercial subscribers’
buildings). These projects are often called “solar gardens” because they are similar in concept to
community gardens, in which participants get a small plot of land within a larger garden to grow
4
food. In a solar garden, an individual or business buys or subscribes to a number of solar panels
(that is, a share of the solar project’s total capacity) and is credited with the electricity produced by
those panels as if the panels were on the participant’s residence or business.
Community solar project sizes can vary from very small (20 kW in capacity6) up to 2,000 kW in
capacity or more. In almost all cases, though, they tend to enjoy economies of scale compared to
residential and small commercial solar projects. Community solar projects are often more than 100
times larger than residential systems (community solar projects average 1,000 kW, versus
residential systems, which average 6.1 kW).7 This translates into power costs that are lower for
subscribers than on-site PV systems, even after paying the administrative costs of community solar
programs.
Figure 2: Community Solar Program Schematic at the Power System Level8
6 In this paper, capacity is expressed in direct current (DC) units unless otherwise noted, per typical practice in the PV industry. Corresponding alternating current (AC) capacity data will be lower due to electricity losses in the process of converting the DC power received at the PV panels into the AC power provided to the utility. While the extent of total losses can vary widely from approximately 10% to 25% depending on system design and engineering, an approximate midpoint loss rate (or “derate”) in the PV industry is 17%. 7 This is the median residential PV system size in the United States as defined in Lawrence Berkeley National Laboratory, Tracking the Sun IX: The Installed Price of Residential and Non-Residential Photovoltaic Systems in the United States, August 2016, page 10, https://emp.lbl.gov/publications/tracking-sun-ix-installed-price [accessed November 2016]. 8 Solar Electric Power Association (now Smart Energy Power Alliance), in conjunction with Solar Market Pathways, Community Solar: Program Design Models, page 3, http://www.solarelectricpower.org/media/422095/community-solar-design-plan_web.pdf [accessed July 2016].
Figure 3: Community Solar Program Schematic at the Individual Project Level9
The fundamental economic advantage of the community solar program structures depicted in
Figure 2 and Figure 3 is only one reason for its growth. Other key reasons include improved
access to solar and greater flexibility. As mentioned at the outset of this paper, 49% of Americans
lack the ability to host on-site solar because (i) their properties are not technically suitable for solar
(e.g., due to shading or roof age, condition, or orientation); (ii) they rent their apartment or lease
their business properties; or (iii) they lack access to capital for upfront solar investment costs or the
credit standing to have a third-party owner install solar on their building. Flexibility is another
advantage of many community solar programs.10 Subscriptions can be sold in increments as small
as 1 kW, compared to typical on-site residential system sizes of 5 kW to 9 kW and even larger
commercial systems. Smaller subscriptions enable participation by individuals with smaller
electricity loads or without the financial wherewithal or interest to participate in larger solar
9 Clean Energy Collective, http://www.morecleanenergy.com/graphics/csu/community.solar.csu.800.jpg [accessed November 2016]. The Clean Energy Collective is a large developer of community solar projects that also operates community solar programs. No endorsement is implied by the use of this graphic. See also www.cleanenergycollective.com [accessed July 2016]. 10 For a review of the variety of pricing, financing, billing, REC treatment, program length, portability, and other options that have been employed in community solar programs, see Solar Electric Power Association (now Smart Energy Power Alliance), in conjunction with Solar Market Pathways, Community Solar: Program Design Models, page 11, http://www.solarelectricpower.org/media/422095/community-solar-design-plan_web.pdf [accessed July 2016].
transactions. Subscriptions, unlike physical solar projects, also can be portable if the participant
moves within the same utility territory.11
For all of these reasons, community solar programs tend to be very popular and are often rapidly
subscribed to during initial rollout periods. However, the combined capacity to-date in community
solar programs of 110 MW is less than 1% of the total U.S. solar market of 25,600 MW.12 This small
volume is partly because community solar is a new product that often requires state legislation to be
allowed in investor-owned utility (IOU) markets, but also points to the complexity of designing and
launching multi-subscriber programs for solar developers, utilities, and subscribers compared to
traditional solar projects. The passage of community solar laws and expansive community
renewables deployment goals (e.g., 600 MW in California)13 has set the stage for rapid market
growth, and there is now an opportunity to simultaneously realize such growth and address other
environmental and land-use considerations.
2.2 Confluence of Community Solar, RE-Powering Sites, and Low-
and Moderate-Income Communities
Among the innovations necessary to achieve community solar’s potential is finding creative ways to
engage households in LMI areas in the solar market.14 LMI areas include categories of energy
consumers who are less likely to install on-site solar due to challenges such as a lack of solar-ready
sites, availability of financing, property ownership structure (e.g., apartment renters), and budget
pressures. While there are programs offered by the federal government, states, and electric utilities
to help reduce LMI electricity costs, these customers often are excluded from many of the benefits
of clean energy. That is why there are special provisions in some programs directed at LMI areas,
such as California’s dedication of 100 MW within its community renewables statute for projects of 1
MW or less in “impacted and disadvantaged communities.”15 When reviewing community solar for
LMI areas, it is critical to distinguish if and how electricity bill savings are flowing to LMI subscribers
(i.e., whether they, too, can achieve direct financial benefits from the program instead of just the
property owners or housing subsidy providers benefiting).
11 For an example of subscription portability, see Solar Electric Power Association (now Smart Energy Power Alliance), Solar Success for Nonprofit Utilities: Grand Valley Power’s Low-Income Community Solar Program Version 2, page 4, https://www.solarelectricpower.org/media/387496/sepa-grand-valley-power-case-study.pdf [accessed July 2016]. 12 Total national PV capacity from GTM Research and Solar Energy Industries Association (SEIA), U.S. Solar Market Insight Executive Summary: 2015 Year in Review, page 5, http://www.seia.org/research-resources/solar-market-insight-2015-q4 [accessed July 2016]. The 110 MW community solar capacity data point is from NREL, Community Solar: Status, Trends, Legal, and Financial Issues, March 2016, page 3, https://www.epa.gov/sites/production/files/2016-03/documents/webinar_20160309_oshaughnessy.pdf [accessed July 2016]. 13 See Green Tariff Shared Renewables Marketing Implementation Advice Letter from California IOU Pacific Gas & Electric (PG&E) describing the California law as implemented by the California Public Utilities Commission with a program cap of 600 MW of shared renewables projects allocated across the three IOUs in California, page 2, http://www.pge.com/nots/rates/tariffs/tm2/pdf/ELEC_4638-E.pdf [accessed July 2016]. While this law applies to renewable energy technologies other than PV, and RE-Powering sites have the potential to support other technologies on a community renewable program scale, the great majority of community renewables projects in the United States have relied on PV technologies, and PV is the exclusive focus of this paper. 14 Low-Income Solar Policy Guide, page 7, http://www.lowincomesolar.org/why-act/ [accessed July 2016]. For example, that report notes that there are more than 6 million U.S. affordable housing units and many more households below 80% of local area median income. 15 See Green Tariff Shared Renewables Marketing Implementation Advice Letter from PG&E, page 2, http://www.pge.com/nots/rates/tariffs/tm2/pdf/ELEC_4638-E.pdf [accessed July 2016].
RE-Powering sites may be an excellent way to engage LMI communities. RE-Powering sites are
often located in or near economically disadvantaged communities and in areas where there may be
a scarcity of other sufficiently large sites for community solar. Solar development may also turn
sites inappropriate for other uses into opportunities to lower power costs, provide a cleaner electric
grid, and create local jobs.16
3. Business Case for Community Solar on RE-Powering
Sites
3.1 Overall Business
Case
The case for RE-Powering sites as
attractive options for community
solar development, especially in
connection with LMI areas, rests on
three pillars. The three pillars
reflect inherent advantages in that
RE-Powering sites can deliver:
Ample, low-cost land (without
competing uses);
Special benefits of sustainable
re-use; and
Proximity to LMI communities.
Land availability: Land acquisition
costs can be a major factor in solar
development in some markets
because solar projects cover a
considerable amount of ground.
For a typical 500 kW to 2,000 kW community solar project, approximately 3 to 12 contiguous acres
are needed, depending upon solar equipment selections and designs.17 Among RE-Powering sites,
a closed and capped municipal solid waste landfill often offers an ideal location for a solar
installation due to the large unobstructed area of the cap and a lack of competing uses.
Contaminated lands and mining sites may have different, unique attributes to lower solar
16 For more information on strategies for LMI engagement in solar development, including community solar, see Low-Income Solar Policy Guide, http://www.lowincomesolar.org/why-act/ [accessed July 2016]. 17 NREL data show that the average size of fixed-axis, ground-mounted PV projects is 5.5 acres of direct land area or 7.6 acres of total land area per MWAC of generating capacity. See NREL, Land-Use Requirements for Solar Power Plants in the United States, June 2013, page v, http://www.nrel.gov/docs/fy13osti/56290.pdf [accessed July 2016]. At an industry midpoint DC to AC derate factor of 17% that translates into 4.6 acres of direct land area or 6.3 acres of total land area per MWDC. Footnote 6 describes derate factors in more detail.
Affordable Housing Benefits from Solar
Development on a RE-Powering Site
In Massachusetts, a 4-acre remediated brownfield
on the former urban site of a furniture
manufacturer was used for an aggregated solar
purchase (though not within a utility-administered
community solar program itself) by an affordable
housing development as well as by service
providers for disabled adults and other local
organizations. This is an example of a project, at
the average community solar size of 1 MW, for
which a RE-Powering site was chosen as the best
place for development.
Source: MassSolar is Working, Inc., Shared Solar: Helping local
nonprofit focus funds on mission in Gardner, MA, December 20, 2015,
development costs and shorten development timeframes. These include the ability to leverage
existing electrical infrastructure and improve project economics with reduced land costs and tax
incentives.
Sustainable re-use: By revitalizing unused, potentially contaminated sites, renewable energy can
improve surrounding property values, divert development pressures from open space, improve air
quality, increase local economic activity, and address contamination, if present, during the project
development process.18 Solar projects also can enhance the protectiveness of a remedy on RE-
Powering sites. 19 The societal benefits of re-use, along with a desire to avoid unnecessarily
dedicating greenspace to solar development, are among the reasons that some jurisdictions
implement specific solar incentives and streamlined processes to accelerate development of RE-
Powering sites. One prominent example is the Solar 4 All® program that has led to 42 MW of new
solar projects on landfills in the territory of New Jersey’s largest utility.20 Other jurisdictions like
Massachusetts have a more general preference for siting solar where there are no alternative uses
(e.g., on roofs or parking lot canopies) to preserve green space for other purposes.21
Proximity: Proximity between a community solar project and LMI communities can lead to the
creation of local jobs and land improvements in these disadvantaged areas. Proximity also can
bring added efficiency to the electric grid: shorter distances between generators and users results in
less “line loss” of electricity output. The site screening results presented in this paper (see Section
3.3) indicate that RE-Powering sites technically suitable for community solar are widespread and
near a high number of urban and rural LMI areas. As shown in Appendices D through F, in excess
of 8,700 RE-Powering sites with community solar potential are within 3 miles of urban areas and
may offer LMI opportunities due to the clustering of residents and businesses. It is important to
note, however, that placement of a solar installation within an LMI community may not
unambiguously benefit the ratepayers within that community; the benefits depend on whether
community residents are subscribers to the community solar project.
Taken together, these three pillars (land availability, sustainable re-use, and proximity) provide the
rationale for seriously exploring RE-Powering sites as an underdeveloped part of the community
solar market.
18 More information on this topic can be found in EPA, Potential Advantages of Reusing Potentially Contaminated Land for Renewable Energy, https://www.epa.gov/sites/production/files/2015-04/documents/contaminated_land_resuse_factsheet.pdf [accessed July 2016], and EPA, Energy Efficiency and Renewable Energy in Low-Income Communities: A Guide to EPA Programs, January 2016, page 28, https://www.epa.gov/sites/production/files/2016-03/documents/epa_low_income_program_guide_508_2-29-16.pdf [accessed July 2016]. 19 Examples of this extra benefit include the physical deterrent effect that solar panels offer on landfills against off-road vehicles, dirt bikes, or others who would otherwise ignore institutional controls and cross a landfill to the detriment of the site. Ground-mounted solar panels also reduce the amount of area exposed to degrading elements. 20 See Public Service Electric & Gas (PSEG), https://pseg.com/family/pseandg/solar4all/extension/landfills.jsp [accessed July 2016]. 21 See Massachusetts Department of Energy Resources, Solar Canopies at State and Municipal Facilities in MA, April 15, 2015, page 10, http://www.mass.gov/eea/docs/doer/green-communities/pubs-reports/solar-canopy-webinar-4-15-15-slides.pdf [accessed July 2016].
3.2 Characteristics of the Most Promising RE-Powering Sites
Promising RE-Powering sites can be identified, as a first cut, by applying the following four filters.
This type of analysis can be done through EPA’s RE-Powering Screening Dataset, which is a public
database that estimates the potential for various renewable energy technologies, including PV, and
includes over 80,000 landfills, contaminated lands, and mining sites.22
Filter #1: All sites with PV capacity above 500 kW. This minimum (which is larger than some
community solar projects) reflects the benefits of economies of scale,23 which are especially
important in light of the development complexities of some RE-Powering sites. The filter uses an
assumed acreage per MW to identify candidate sites.24
Filter #2: Maximum per site PV capacity of 2,000 kW. Most existing community solar programs
are capped at a maximum individual project size of 2,000 kW. For RE-Powering sites with more
than 2,000 kW of technical potential, the limit of 2,000 kW was applied (i.e., it was assumed that
the sites would be developed up to 2,000 kW, but if they had additional suitable land, that would
not be dedicated to community solar due to project caps).
Filter #3: Distance to the nearest electrical substation less than or equal to 3 miles. There is
typically a preference for community solar systems to be connected at the distribution level
(rather than at the transmission level) of the electricity grid. Distances or interconnections that
are longer or more complex could incur prohibitive costs.
Filter #4: Location in a state with existing community solar projects. While community solar is
not universally available within each of the 26 states that currently has these projects (e.g., it
may be occurring only in a selected electric co-op or municipal utility market) and other states
are expected to deploy community solar in the future, the list of current states provides a
baseline that is consistent with metrics used elsewhere in this paper.
Because there may be additional economic development benefits from having a solar project in
close physical proximity to cities or towns, an additional “urban area” filter also was applied.25 The
results from applying that extra filter are provided in Appendices D through F.
22 Information on the RE-Powering data sources, screening, and analysis can be found at: https://www.epa.gov/sites/production/files/2015-04/documents/repowering_mapper_datadocumentation.pdf [accessed July 2016]. 23 For examples of the relationship between declining capital costs and rising solar project scale, see GTM Research and SEIA, U.S. Solar Market Insight Executive Summary: 2015 Year in Review, http://www.seia.org/research-resources/solar-market-insight-2015-q4 [accessed July 2016]. 24 The ratio applied in the RE-Powering Screening Dataset is 6 acres per MW of PV capacity. This value is within the range discussed in footnote 17. See RE-Powering Screening Dataset at: https://www.epa.gov/re-powering/re-powering-mapping-and-screening-tools [accessed November 2016]. For more background, see RE-Powering America’s Land Initiative, Data Documentation for Mapping and Screening Criteria for Renewable Energy Generation Potential on EPA and State Tracked Sites, updated August 2015, https://www.epa.gov/sites/production/files/2015-04/documents/repowering_mapper_datadocumentation.pdf [accessed November 2016]. 25 The definition of “urban area” applied is from EPA’s RE-Powering Screening Dataset: “The closest ‘urban area’ as defined by the U.S.
Census Bureau. In general, this territory consists of areas of high population density and urban land use resulting in a representation of
the ‘urban footprint.’ There are two types of urban areas: urbanized areas (UAs) that contain 50,000 or more people and urban clusters
3.3 Technical Potential of RE-Powering Sites for Community Solar
The dataset resulting from the four filters was summed for the total number of sites and PV
capacity. Landfills were separated from other RE-Powering sites (i.e., contaminated lands and
mining sites) due to differences in solar development techniques. Results of this initial screening
are shown in Figure 4. Because the average community solar project is approximately 1 MW in
capacity, an alternative set of results was created with a 1 MW cap on individual projects and is
displayed in the right column of Figure 4. The number of sites does not change if a 1 MW cap is
used (because all 2 MW sites have 1 MW sites within them), but the cumulative capacity declines.
Figure 4: Technical Potential of RE-Powering Sites for Community Solar Development
across the 26 States with Existing Community Solar Projects
Type of Site Number of
Sites
Cumulative PV Capacity (MWDC) of Sites
2 MWDC Maximum Individual Project Size
1 MWDC Maximum Individual Project Size
Landfills Only 787 1,492 776
All Other RE-Powering
Sites 8,698 13,790 8,078
Total 9,485 15,282 8,854
It is critical to note that these results reflect only technical potential. They portray sites that are
technically appropriate to generate solar power given their physical characteristics (e.g., land use).
They do not distinguish differences in solar resource (irradiance) between sites, which affects PV
system performance (e.g., annual electricity output).26 And, other than the filter for distance to the
nearest substation, they do not have economic variables. Solar potential studies often begin with
technical potential metrics, and then filter results further for economic potential (e.g., with power
prices and utility rate structures, solar cost and performance, incentives, and other variables), and,
finally, market potential or likely level of actual solar deployment given that many economically
attractive sites do not get developed in practice.27 Though assessing technical potential is only an
(UCs) that contain at least 2,500 people, but fewer than 50,000 people (except in the U.S. Virgin Islands and Guam which each contain
urban clusters with populations greater than 50,000).” 26 The RE-Powering Screening Dataset contains a solar resource metric (maximum direct normal irradiance) that can assist in estimating PV performance at individual sites. 27 For a thorough discussion of renewable energy screening and potential, see NREL, Estimating Renewable Energy Economic Potential in the United States: Methodology and Initial Results, July 2015, http://www.nrel.gov/docs/fy15osti/64503.pdf [accessed July 2016].
initial, necessary step in describing solar market potential, conducting economic potential or market
potential analyses is beyond the scope of this paper.
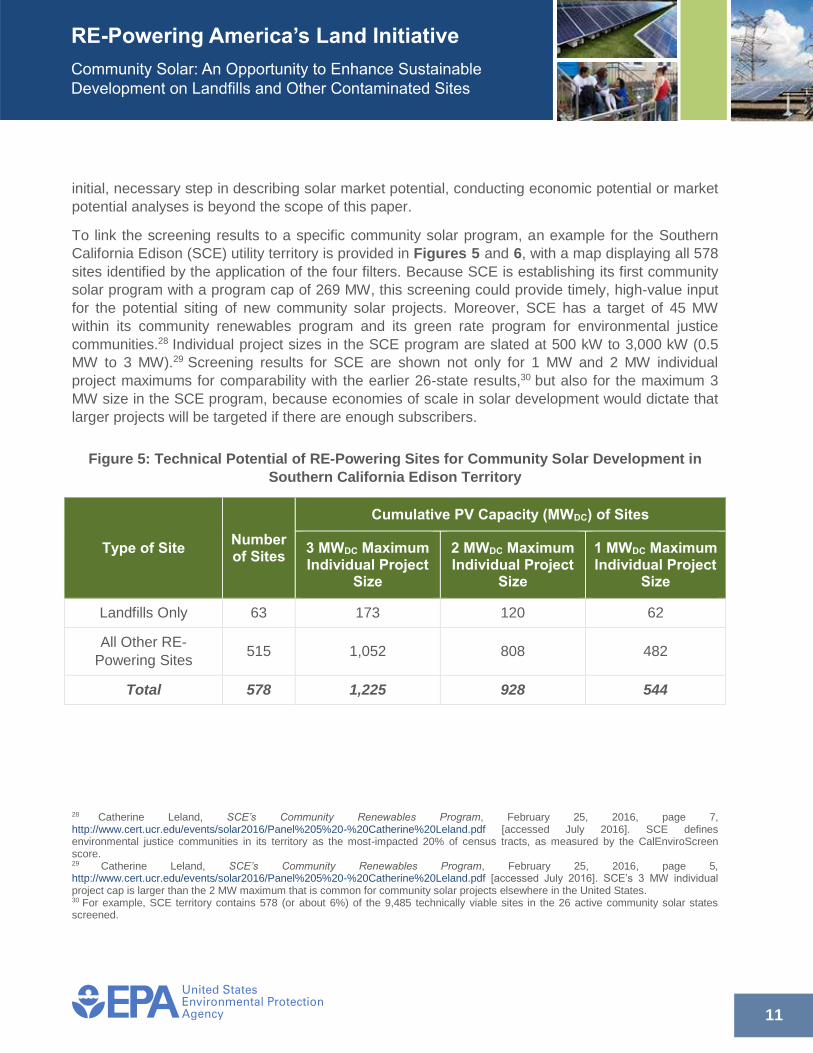
To link the screening results to a specific community solar program, an example for the Southern
California Edison (SCE) utility territory is provided in Figures 5 and 6, with a map displaying all 578
sites identified by the application of the four filters. Because SCE is establishing its first community
solar program with a program cap of 269 MW, this screening could provide timely, high-value input
for the potential siting of new community solar projects. Moreover, SCE has a target of 45 MW
within its community renewables program and its green rate program for environmental justice
communities.28 Individual project sizes in the SCE program are slated at 500 kW to 3,000 kW (0.5
MW to 3 MW).29 Screening results for SCE are shown not only for 1 MW and 2 MW individual
project maximums for comparability with the earlier 26-state results,30 but also for the maximum 3
MW size in the SCE program, because economies of scale in solar development would dictate that
larger projects will be targeted if there are enough subscribers.
Figure 5: Technical Potential of RE-Powering Sites for Community Solar Development in
Southern California Edison Territory
Type of Site Number of Sites
Cumulative PV Capacity (MWDC) of Sites
3 MWDC Maximum Individual Project
Size
2 MWDC Maximum Individual Project
Size
1 MWDC Maximum Individual Project
Size
Landfills Only 63 173 120 62
All Other RE-
Powering Sites 515 1,052 808 482
Total 578 1,225 928 544
28 Catherine Leland, SCE’s Community Renewables Program, February 25, 2016, page 7, http://www.cert.ucr.edu/events/solar2016/Panel%205%20-%20Catherine%20Leland.pdf [accessed July 2016]. SCE defines environmental justice communities in its territory as the most-impacted 20% of census tracts, as measured by the CalEnviroScreen score. 29 Catherine Leland, SCE’s Community Renewables Program, February 25, 2016, page 5, http://www.cert.ucr.edu/events/solar2016/Panel%205%20-%20Catherine%20Leland.pdf [accessed July 2016]. SCE’s 3 MW individual project cap is larger than the 2 MW maximum that is common for community solar projects elsewhere in the United States. 30 For example, SCE territory contains 578 (or about 6%) of the 9,485 technically viable sites in the 26 active community solar states screened.
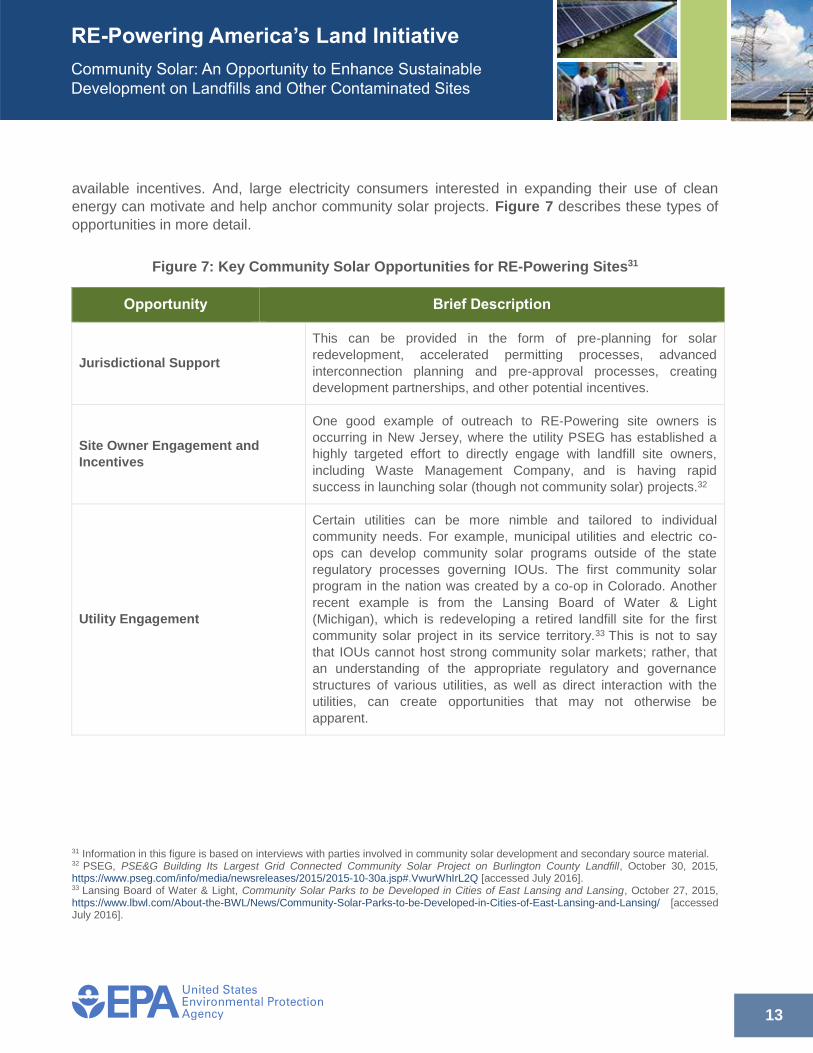
interconnection planning and pre-approval processes, creating
development partnerships, and other potential incentives.
Site Owner Engagement and
Incentives
One good example of outreach to RE-Powering site owners is
occurring in New Jersey, where the utility PSEG has established a
highly targeted effort to directly engage with landfill site owners,
including Waste Management Company, and is having rapid
success in launching solar (though not community solar) projects.32
Utility Engagement
Certain utilities can be more nimble and tailored to individual
community needs. For example, municipal utilities and electric co-
ops can develop community solar programs outside of the state
regulatory processes governing IOUs. The first community solar
program in the nation was created by a co-op in Colorado. Another
recent example is from the Lansing Board of Water & Light
(Michigan), which is redeveloping a retired landfill site for the first
community solar project in its service territory.33 This is not to say
that IOUs cannot host strong community solar markets; rather, that
an understanding of the appropriate regulatory and governance
structures of various utilities, as well as direct interaction with the
utilities, can create opportunities that may not otherwise be
apparent.
31 Information in this figure is based on interviews with parties involved in community solar development and secondary source material. 32 PSEG, PSE&G Building Its Largest Grid Connected Community Solar Project on Burlington County Landfill, October 30, 2015, https://www.pseg.com/info/media/newsreleases/2015/2015-10-30a.jsp#.VwurWhIrL2Q [accessed July 2016]. 33 Lansing Board of Water & Light, Community Solar Parks to be Developed in Cities of East Lansing and Lansing, October 27, 2015, https://www.lbwl.com/About-the-BWL/News/Community-Solar-Parks-to-be-Developed-in-Cities-of-East-Lansing-and-Lansing/ [accessed July 2016].
Another largely untapped market for solar energy consumption is the
commercial sector, which frequently encounters property ownership
and management structures impairing traditional on-site solar.
Commercial organizations can serve in multiple roles: as subscribers
to community solar capacity, project sponsors, and providers of
information, recognition, or incentives to employees. In relative
impact, a mid-sized commercial enterprise that consumes 600
megawatt-hours (MWh) per year in electricity may have the ability to
purchase as much solar power as 50 individual residential
subscribers. 34 Although community solar projects frequently
emphasize residential offerings, the potential for commercial
involvement is significant. For example, a business may act as an
“anchor subscriber” to a large-scale community system that can then
be offered to residents and perhaps even discounted to employees
as a benefit.
4. Challenges to Developing RE-Powering Sites for
Community Solar
The boom in community solar growth has occurred largely outside of RE-Powering sites. This is
perhaps due to a lack of awareness of the number of, variety, and special advantages offered by
RE-Powering sites. However, it is also likely due to concerns about site preparation complexities,
potential liability, and costs associated with landfills, contaminated lands, and mining sites. While
the availability of financial incentives and supportive regulatory rules for RE-Powering sites can
mitigate these concerns and costs, other re-use options for contaminated properties may remain
more attractive to communities. This section provides a brief discussion of challenges internal to
RE-Powering sites, as well as external factors that may affect community solar development.
Site preparation challenges and costs: Site-specific barriers can include experience with or
perceptions of the risk of owning and operating assets on RE-Powering lands, as well as costs for
remediation, site preparation, and construction to ensure safe operation of solar power systems.
Compared to development on property where no remediation is required and where environmental
review can be expedited in certain states,35 RE-Powering sites may be considered less desirable
from the developer’s perspective. Also, local permitting and land-use requirements may not be
34 According to the U.S. Energy Information Administration, the average U.S. home uses about 11 MWh of electricity annually. See http://www.eia.gov/tools/faqs/faq.cfm?id=97&t=3 [accessed July 2016]. 35 For example, in California, solar projects on rooftops and on previously developed land can be deemed either statutorily exempt from restrictions under the California Environmental Quality Act or expedited. See http://resources.ca.gov/ceqa/guidelines-sb226/ and the process flowchart at http://resources.ca.gov/ceqa/flowchart/ [accessed July 2016].
“solar ready,” requiring additional review processes, lengthening approval timelines, and further
increasing project costs. As described by both developers and utilities in interviews, without
concerted efforts by local jurisdictions, RE-Powering sites can present significant development
challenges.
In addition to complying with any required engineering or institutional controls, solar development
on contaminated or cleaned-up sites may have other technical requirements, including minimal site
disturbance, avoidance of remediation/testing equipment, and requirements for ground stability,
ground leveling, and site orientation and slope. Community solar systems may need to be designed
and constructed to avoid interfering with existing and potential new groundwater extraction and
monitoring wells, as well as to avoid the piping and other utilities associated with operating
treatment systems.
Beyond emphasizing the inherent advantages that RE-Powering sites can bring to community solar
development to help overcome these barriers (see Section 3), developers can bundle sites for
participation in community solar procurements to improve the chances that impediments at one site
will not eliminate their potential for eventual success. There also are categories of RE-Powering
sites that may receive a more streamlined development process than those subject to ongoing
remediation. These sites include:
No cleanup necessary: “Initially, the site may have been considered contaminated.
However, after assessing the site, it is determined that levels of contamination do not pose
unacceptable risk to human health and the environment.”36
Post-cleanup: After cleaning up contaminated areas of a site, renewable energy may be
installed if the site remains protective of human health and the environment over the long
term.
Beyond site-specific challenges, there are four external factors that affect whether RE-Powering
sites will have the ability to capture their full potential for community solar. Each of the four factors is
discussed in turn below, accompanied by suggestions in italics on how to manage that factor.
Community solar program scale: The costs that can accompany building, owning, and operating a
solar facility on a RE-Powering site can be mitigated by economies of scale with larger solar
projects. That is, the costs can be amortized over a larger revenue stream with lower per-unit costs.
However, most community solar projects have not been developed large-scale, primarily due to
community solar program design and procedural hurdles.
36 Excerpt from EPA, Opportunities for Siting Renewable Energy Production While Addressing Environmental Site Issues, https://www.epa.gov/re-powering/siting-re-powering-projects-while-addressing-environmental-issues#renewable_energy_project_development_process [accessed July 2016].
RE-Powering site – Landfill, contaminated land, or mining sites in the United States that are
appropriate for some form of renewable energy development. A screening database of such sites is
maintained by the EPA RE-Powering America’s Land Initiative, which supports sustainable re-use
of the sites. This paper further specifies that a RE-Powering site must have the technical potential
for a solar project of at least 500 kW in capacity to be included in the example screening analysis in
Section 3.3 and that one solar project of no more than 2 MW of capacity (or 3 MW in Southern
California Edison territory) could be developed per RE-Powering site.
Renewable energy certificate (REC) – An accounting mechanism for characterizing the
environmental attributes of electricity generated from a renewable source. One REC = 1 megawatt-
hour (MWh) of renewable power generation. RECs are often the mechanism used to track
adherence to renewable portfolio standards or similar compliance requirements in states where
tracking is mandatory. RECs can also be purchased in voluntary markets without association to
state requirements. RECs and other types of environmental attributes are distinguished from the
physical electricity generated from renewable energy generation facilities, which can be thought of
as equivalent to the physical power from traditional (fossil fuel and nuclear) generation facilities.
Shared solar – Another name for community solar. Such solar projects are often called “solar
gardens.”
Solar developer – A firm that is responsible for coordinating the overall creation of a solar project.
Solar developers provide or coordinate some or all of the following activities: site technical,
environmental, and financial assessment; engineering, procurement, and construction, including
any additional remediation or protective measures required; financing; contract negotiations with the
land owner/responsible party, utility, local jurisdictions, and off-taker (buyer) of the project’s physical
power and RECs; final testing and commissioning; community solar program administrative duties;
ongoing operations and maintenance; and system decommissioning at contract conclusion.
Community solar program rules and developer preferences will determine which of these duties the
firm performs itself, coordinates through other organizations, or does not formally address.
Subscription – The mechanism for an electricity end-user to participate (buy or invest) in a
community solar program. Participants are often called “subscribers.”
21
Appendix C: Community Solar Project Data at the State Level
Figure 8 shows the deployment of community solar projects by state as of March 2016. As
explained earlier in this paper, the number of community solar projects and their penetration across
states is expected to grow significantly between 2016 and 2020.
Figure 8: Community Solar Projects by State38
38 NREL, Community Solar: Status, Trends, Legal, and Financial Issues, March 2016, page 7, https://www.epa.gov/sites/production/files/2016-03/documents/webinar_20160309_oshaughnessy.pdf [accessed July 2016].
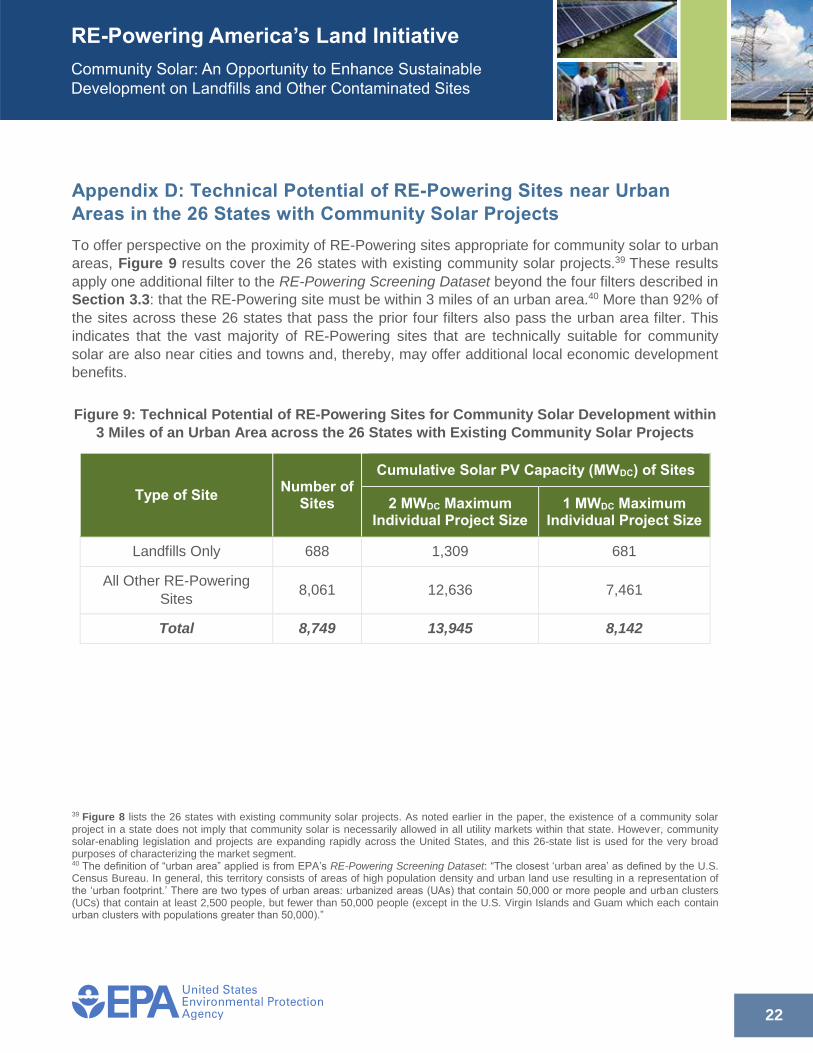
Appendix D: Technical Potential of RE-Powering Sites near Urban
Areas in the 26 States with Community Solar Projects
To offer perspective on the proximity of RE-Powering sites appropriate for community solar to urban
areas, Figure 9 results cover the 26 states with existing community solar projects.39 These results
apply one additional filter to the RE-Powering Screening Dataset beyond the four filters described in
Section 3.3: that the RE-Powering site must be within 3 miles of an urban area.40 More than 92% of
the sites across these 26 states that pass the prior four filters also pass the urban area filter. This
indicates that the vast majority of RE-Powering sites that are technically suitable for community
solar are also near cities and towns and, thereby, may offer additional local economic development
benefits.
Figure 9: Technical Potential of RE-Powering Sites for Community Solar Development within
3 Miles of an Urban Area across the 26 States with Existing Community Solar Projects
Type of Site Number of
Sites
Cumulative Solar PV Capacity (MWDC) of Sites
2 MWDC Maximum Individual Project Size
1 MWDC Maximum Individual Project Size
Landfills Only 688 1,309 681
All Other RE-Powering
Sites 8,061 12,636 7,461
Total 8,749 13,945 8,142
39 Figure 8 lists the 26 states with existing community solar projects. As noted earlier in the paper, the existence of a community solar project in a state does not imply that community solar is necessarily allowed in all utility markets within that state. However, community solar-enabling legislation and projects are expanding rapidly across the United States, and this 26-state list is used for the very broad purposes of characterizing the market segment. 40 The definition of “urban area” applied is from EPA’s RE-Powering Screening Dataset: “The closest ‘urban area’ as defined by the U.S. Census Bureau. In general, this territory consists of areas of high population density and urban land use resulting in a representation of the ‘urban footprint.’ There are two types of urban areas: urbanized areas (UAs) that contain 50,000 or more people and urban clusters (UCs) that contain at least 2,500 people, but fewer than 50,000 people (except in the U.S. Virgin Islands and Guam which each contain urban clusters with populations greater than 50,000).”
23
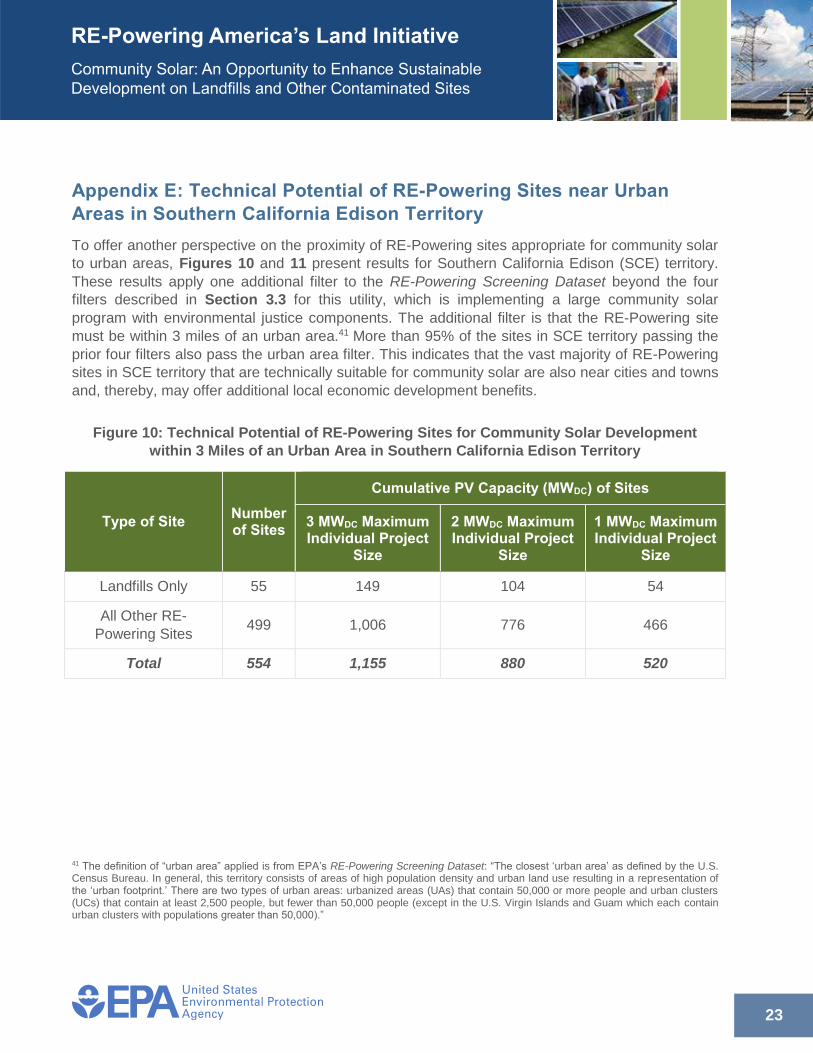
Appendix E: Technical Potential of RE-Powering Sites near Urban
Areas in Southern California Edison Territory
To offer another perspective on the proximity of RE-Powering sites appropriate for community solar
to urban areas, Figures 10 and 11 present results for Southern California Edison (SCE) territory.
These results apply one additional filter to the RE-Powering Screening Dataset beyond the four
filters described in Section 3.3 for this utility, which is implementing a large community solar
program with environmental justice components. The additional filter is that the RE-Powering site
must be within 3 miles of an urban area.41 More than 95% of the sites in SCE territory passing the
prior four filters also pass the urban area filter. This indicates that the vast majority of RE-Powering
sites in SCE territory that are technically suitable for community solar are also near cities and towns
and, thereby, may offer additional local economic development benefits.
Figure 10: Technical Potential of RE-Powering Sites for Community Solar Development
within 3 Miles of an Urban Area in Southern California Edison Territory
Type of Site Number of Sites
Cumulative PV Capacity (MWDC) of Sites
3 MWDC Maximum Individual Project
Size
2 MWDC Maximum Individual Project
Size
1 MWDC Maximum Individual Project
Size
Landfills Only 55 149 104 54
All Other RE-
Powering Sites 499 1,006 776 466
Total 554 1,155 880 520
41 The definition of “urban area” applied is from EPA’s RE-Powering Screening Dataset: “The closest ‘urban area’ as defined by the U.S. Census Bureau. In general, this territory consists of areas of high population density and urban land use resulting in a representation of the ‘urban footprint.’ There are two types of urban areas: urbanized areas (UAs) that contain 50,000 or more people and urban clusters (UCs) that contain at least 2,500 people, but fewer than 50,000 people (except in the U.S. Virgin Islands and Guam which each contain urban clusters with populations greater than 50,000).”
24
Figure 11: Map of RE-Powering Sites with Technical Potential
for Community Solar Development within 3 Miles of an Urban Area
in Southern California Edison Territory
25
Appendix F: Technical Potential of RE-Powering Sites in
Massachusetts
To supplement the earlier screening of RE-Powering sites that was aggregated across all 26 states
with community solar projects, Figures 12 and 13 present results for Massachusetts. This state is
profiled because it is a national leader in community solar, has a history of connecting RE-Powering
sites with LMI solar purchasers, and has an active program for the sustainable re-use of
contaminated sites.42
Figure 12 shows results using the same four filters presented in Section 3.3, and Figure 13 is a
map of the 711 sites passing those filters in Massachusetts.
Figure 12: Technical Potential of RE-Powering Sites for Community Solar Development in
Massachusetts (without Urban Area Filter)
Type of Site Number of
Sites
Cumulative PV Capacity (MWDC) of Sites
2 MWDC Maximum Individual Project Size
1 MWDC Maximum Individual Project Size
Landfills Only 235 414 228
All Other RE-Powering
Sites 476 693 429
Total 711 1,107 657
42 See Massachusetts Department of Environmental Protection, Clean Energy Results Program, http://www.mass.gov/eea/agencies/massdep/climate-energy/energy/ [accessed July 2016].
Figure 13: Map of RE-Powering Sites with Technical Potential
for Community Solar Development in Massachusetts (without Urban Area Filter)
Results in Figures 14 and 15 include the application of one additional filter: that the RE-Powering
site must be within 3 miles of an urban area.43 More than 98% of the sites passing the prior four
filters also pass the urban area filter. This indicates that the vast majority of RE-Powering sites that
are technically suitable for community solar in Massachusetts are also near cities and towns and,
thereby, may offer additional local economic development benefits.
43 The definition of “urban area” applied is from EPA’s RE-Powering Screening Dataset: “The closest ‘urban area’ as defined by the U.S. Census Bureau. In general, this territory consists of areas of high population density and urban land use resulting in a representation of the ‘urban footprint.’ There are two types of urban areas: urbanized areas (UAs) that contain 50,000 or more people and urban clusters (UCs) that contain at least 2,500 people, but fewer than 50,000 people (except in the U.S. Virgin Islands and Guam which each contain urban clusters with populations greater than 50,000).”
27
Figure 14: Technical Potential of RE-Powering Sites for Community Solar Development
within 3 Miles of an Urban Area in Massachusetts
Type of Site Number of
Sites
Cumulative PV Capacity (MWDC) of Sites
2 MWDC Maximum Individual Project Size
1 MWDC Maximum Individual Project Size
Landfills Only 228 408 223
All Other RE-Powering
Sites 471 687 425
Total 699 1,095 648
Figure 15: Map of RE-Powering Sites with Technical Potential
for Community Solar Development within 3 Miles of an Urban Area in Massachusetts