COMMUTING AND GALWAY CITY FROM AN URBAN/SUBURBAN, COUNTY AND REGIONAL PERSPECTIVE 2015 Figures Based on CSO;SAPS Statistics(2011), Popular Studies and Media Excerpts
Commuting and Galway City from a Suburban,County and Regional Perspective 2015 COMMUTING AND GALWAY CITY FROM AN URBAN/SUBURBAN, COUNTY AND REGIONAL PERSPECTIVE 2015 Figures Based on CSO;SAPS Statistics(2011), Popular Studies and Media Excerpts By Joseph Francis Kelly, Project Director, AGP Ireland(SUIG,SUIL,Nasc Iarnrod,CIC) Overview
Transcript
Commuting and Galway City from a Suburban,County and Regional Perspective 2015
COMMUTING AND GALWAY CITY FROM
AN URBAN/SUBURBAN, COUNTY AND REGIONAL
PERSPECTIVE 2015
Figures Based on CSO;SAPS Statistics(2011),
Popular Studies and Media Excerpts
By Joseph Francis Kelly,
Project Director,
AGP Ireland(SUIG,SUIL,Nasc Iarnrod,CIC)
Overview
Commuting and Galway City from a Suburban,County and Regional Perspective 2015
As there are Four Main Commuter Nodes of
Galway City these are adequate points of
reference as the four main entry points of
inward commuting traffic into Galway City on a
daily basis. The four main nodes are based on the fringes of the City- Oran Mor, Baile Chlair, Maigh Cuilinn, Bearna and the surrounding District Electoral Divisions outward have been counted via the Small Area Population Statistics C.S.O. , these entry points validate the commuting numbers which have been under examination by many stakeholders and institutions over the past few decades. To validate the introduction of a socially comprehensive, economically fair and environmentally friendly transport proposal . The public transport option which the AGP Ireland will promote and devote to applying a lifesaving catalyst for the People of Galway County and City is the Solas Uirbeach Iarnrod na Gailliimhe Light Rail System. To highlight the four entry points of congestion from inward traffic will be represented individually to present an ingestible understanding for the reader in addition there will be Media Reports which validate the numbers. All number are calculated and contrived from CSO Census 2011 Small Area Population Maps with the Layer District Electoral Division and Commuting Statistics, I have chosen the options of Four Wheeled , Fossil Fuel running vehicle ranging from Bus,Car,Car Passenger,Van,Lorry/Other all figure are available at this link; http://census.cso.ie/sapmap2011/Results.aspx?Geog_Type=ED&Geog_Code=27060&CTY=27#T11_1101 The browser will have navigate the SAPS Map on their personal knowledge to upload each District Electoral Division individually.
Commuting and Galway City from a Suburban,County and Regional Perspective 2015
Daytime Working Population of Galway = 41,492 Public Transport Solution ;
Commuting and Galway City from a Suburban,County and Regional Perspective 2015
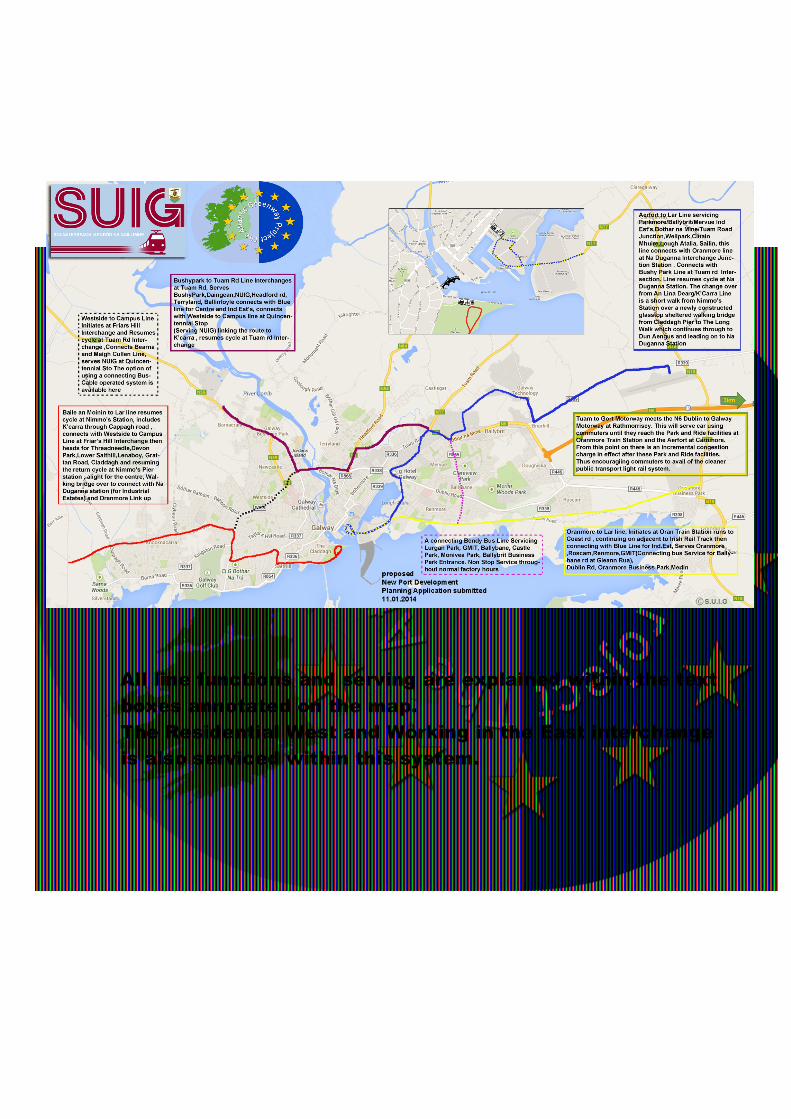
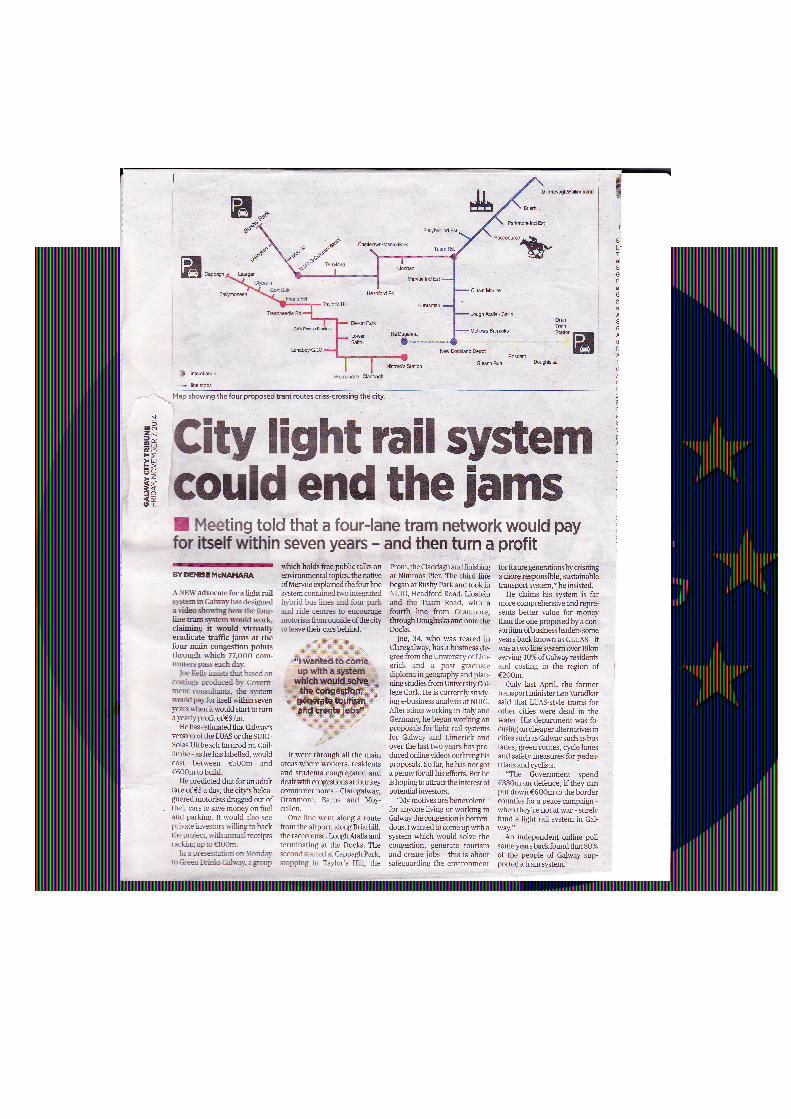
Light Rail ; Solas Uirbeach Iarnrod na Gaillimhe(SUIG)
This is a Line/Stop representation of the SUIG system which
aims to serve all spatial urban uses from Industrial,
Commercial, Residential, Educational, Recreational and
more..
Commuting and Galway City from a Suburban,County and Regional Perspective 2015
Topographic Version- SUIG System
All line functions and serving are explained within the text
boxes annotated on the map.
The Residential West and Working in the East interchange
is also serviced within this system.
Commuting and Galway City from a Suburban,County and Regional Perspective 2015
Preliminary Benefits of The SUIG System The initial macro design maps, out the linking of the tram lines initiated from all the main four commuter nodes in the hinterland of Galway City, with a view to :
• Eradicating Traffic Volumes • Providing Sufficient Infrastructure prior to Population Growth • Providing a Cheaper, Greener, Leaner Public Transport Solution • A system which will reap huge profits for the city when it has paid for
itself in 6-7 years(77,048 daily commuters+Adult Day Return@€5=100million per annum)
• Reducing the Carbon Footprint • Lowering and Stabilizing people's relative daily expenditure i.e. instead
of fossil fuel purchase , frequent ticket purchase would be more economical
• Enhancing the likelihood of Galway becoming a Major example of a "Green City"
• Attracting future investment of Foreign Direct Investment by providing less stressful infrastructure for the Labour force
• Increasing the the annual Tourist Numbers and further boosting the Local Economy
• Encouraging Social Cohesion • Encouraging assimilation of Non-Nationals to Irish Culture • Service and Hospitality Sector Job Creation by the domino effect of
this being built
All the while bringing the network to centre without compromising the Architectural Heritage of Galway City, due to these traits holding long term reciprocal factors that aid maintenance of the concept.
Commuting and Galway City from a Suburban,County and Regional Perspective 2015
Commuter Node/Entry Point No.1 - Oran Mor and Surrounding District Electoral Divisions(DED) DED Persons who commute via Bus,Car,Car
Passengers,Van,Lorry Oran Mor 2,509 Stradbally 838 GreetHill 557 Aughrim 775 Clarinbridge 2,065 Ballinacourty 762 Killeely 1,087 Drumacoo 703 Rahasane 215 Total : 10,256
Commuting and Galway City from a Suburban,County and Regional Perspective 2015
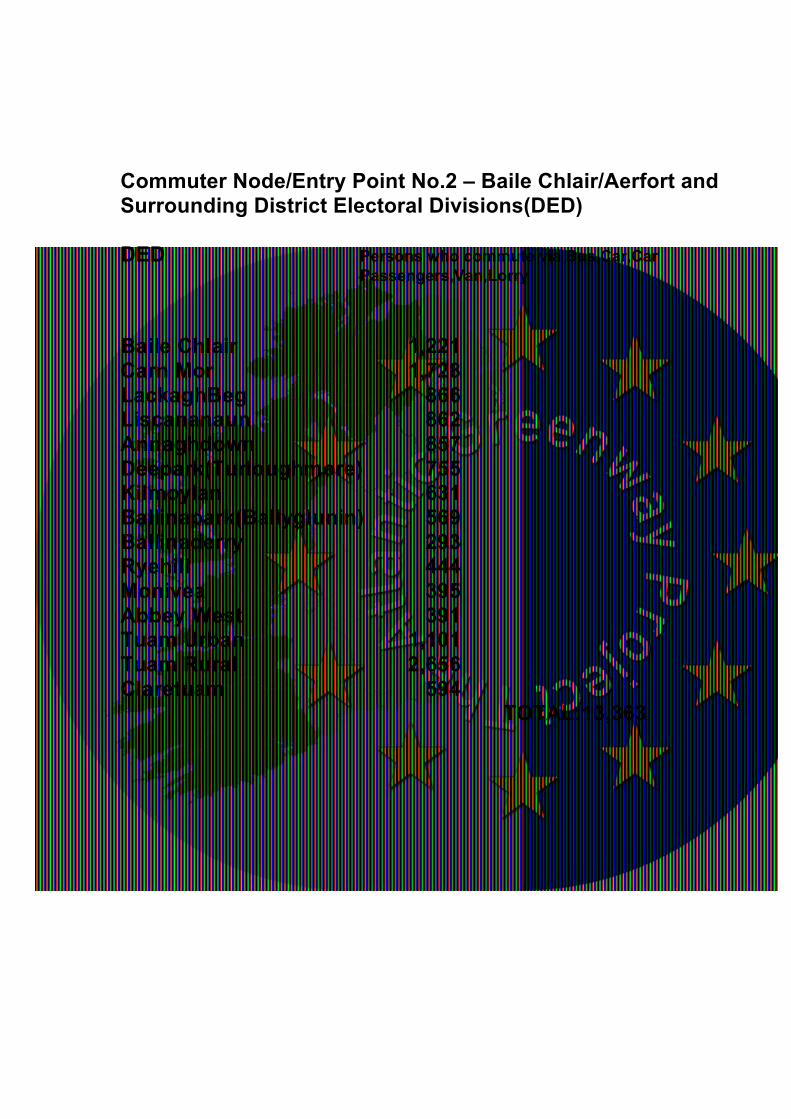
Commuter Node/Entry Point No.2 – Baile Chlair/Aerfort and Surrounding District Electoral Divisions(DED) DED Persons who commute via Bus,Car,Car
Commuting and Galway City from a Suburban,County and Regional Perspective 2015
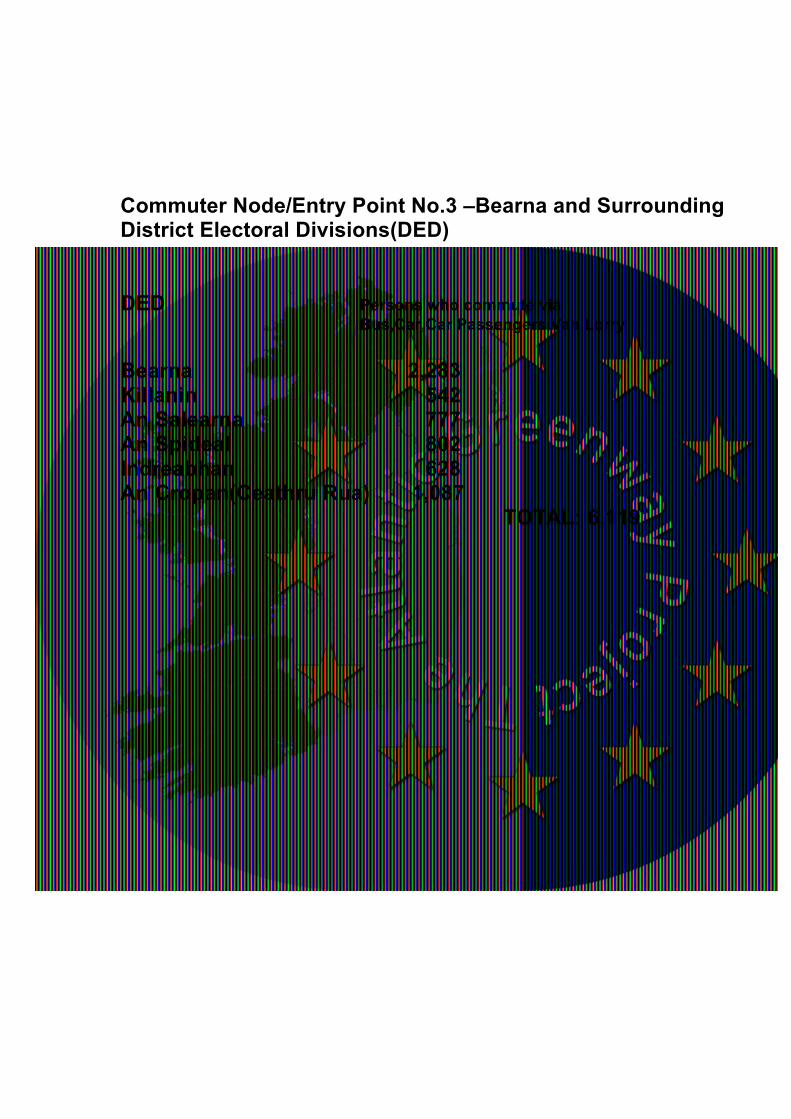
Commuter Node/Entry Point No.3 –Bearna and Surrounding District Electoral Divisions(DED) DED Persons who commute via
Bus,Car,Car Passengers,Van,Lorry Bearna 2,283 Killanin 542 An Salearna 777 An Spideal 802 Indreabhan 628 An Cropan(Ceathru Rua) 1,087 TOTAL: 6,119
Commuting and Galway City from a Suburban,County and Regional Perspective 2015
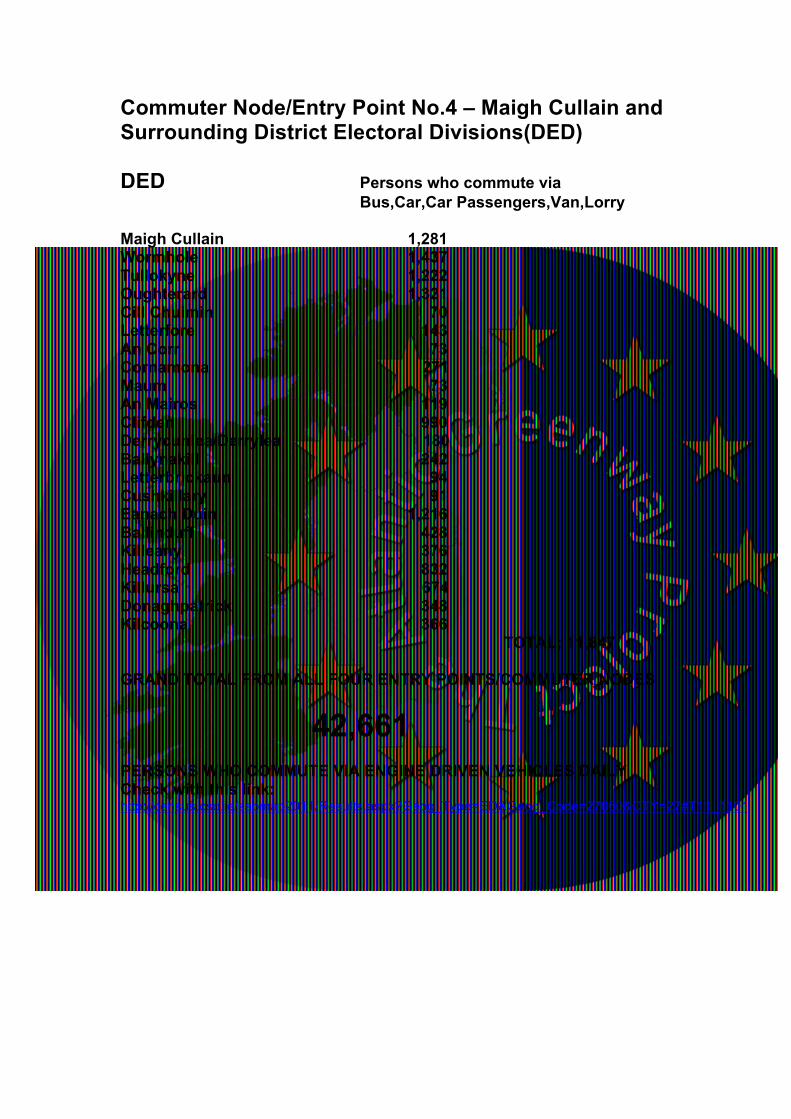
Commuter Node/Entry Point No.4 – Maigh Cullain and Surrounding District Electoral Divisions(DED) DED Persons who commute via
Bus,Car,Car Passengers,Van,Lorry Maigh Cullain 1,281 Wormhole 1,437 Tullokyne 1,222 Oughterard 1,321 Cill Chuimin 70 Letterfore 143 An Corr 73 Cornamona 271 Maum 73 An Mairos 119 Clifden 990 Derrycunlea/Derrylea 180 Ballynakill 242 Letterbrickaun 94 Cushkillary 91 Eanach Duin 1,216 Ballinduff 428 Killeany 376 Headford 832 Killursa 674 Donaghpatrick 348 Kilcoona 366 TOTAL; 11,847 GRAND TOTAL FROM ALL FOUR ENTRY POINTS/COMMUTER NODES
42,661 PERSONS WHO COMMUTE VIA ENGINE DRIVEN VEHICLES DAILY Check with this link: http://census.cso.ie/sapmap2011/Results.aspx?Geog_Type=ED&Geog_Code=27060&CTY=27#T11_1101
Commuting and Galway City from a Suburban,County and Regional Perspective 2015
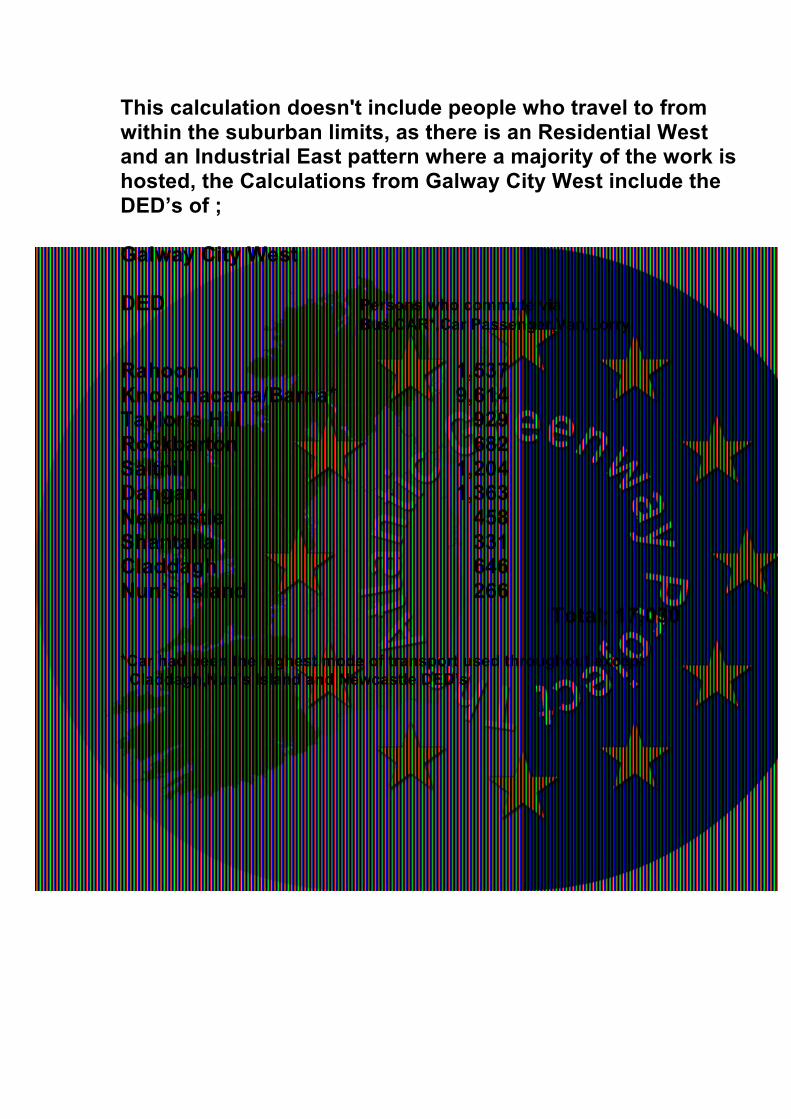
This calculation doesn't include people who travel to from within the suburban limits, as there is an Residential West and an Industrial East pattern where a majority of the work is hosted, the Calculations from Galway City West include the DED’s of ; Galway City West DED Persons who commute via
Bus,CAR*,Car Passenger,Van,Lorry Rahoon 1,537 Knocknacarra/Barna* 9,614 Taylor’s Hill 929 Rockbarton 682 Salthill 1,204 Dangan 1,363 Newcastle 458 Shantalla 331 Claddagh 646 Nun’s Island 266 Total; 17,030 *Car had been the highest mode of transport used throughout except Claddagh,Nun’s Island and Newcastle DED’s
Commuting and Galway City from a Suburban,County and Regional Perspective 2015
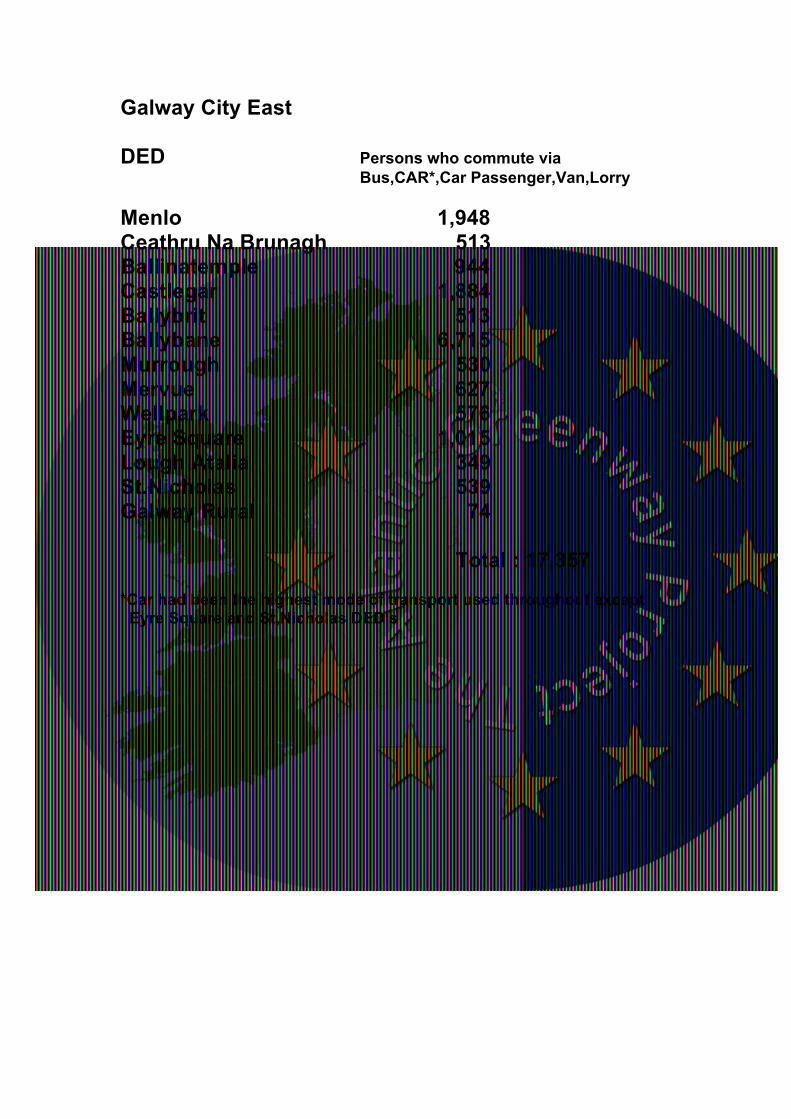
Galway City East DED Persons who commute via
Bus,CAR*,Car Passenger,Van,Lorry Menlo 1,948 Ceathru Na Brunagh 513 Ballinatemple 944 Castlegar 1,884 Ballybrit 513 Ballybane 6,715 Murrough 530 Mervue 627 Wellpark 576 Eyre Square 1,015 Lough Atalia 349 St.Nicholas 539 Galway Rural 74 Total : 17,357 *Car had been the highest mode of transport used throughout except Eyre Square and St,Nicholas DED’s
Commuting and Galway City from a Suburban,County and Regional Perspective 2015
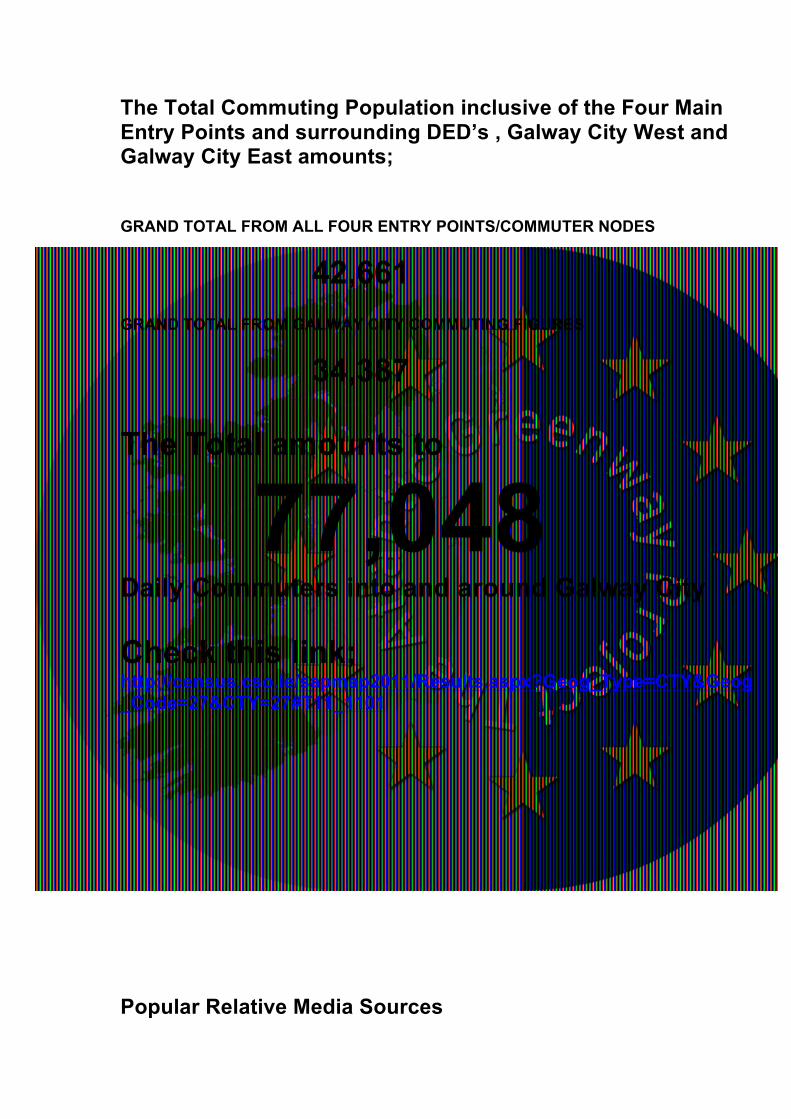
The Total Commuting Population inclusive of the Four Main Entry Points and surrounding DED’s , Galway City West and Galway City East amounts; GRAND TOTAL FROM ALL FOUR ENTRY POINTS/COMMUTER NODES
42,661 GRAND TOTAL FROM GALWAY CITY COMMUTING FIGURES
34,387 The Total amounts to
77,048 Daily Commuters into and around Galway City Check this link; http://census.cso.ie/sapmap2011/Results.aspx?Geog_Type=CTY&Geog_Code=27&CTY=27#T11_1101
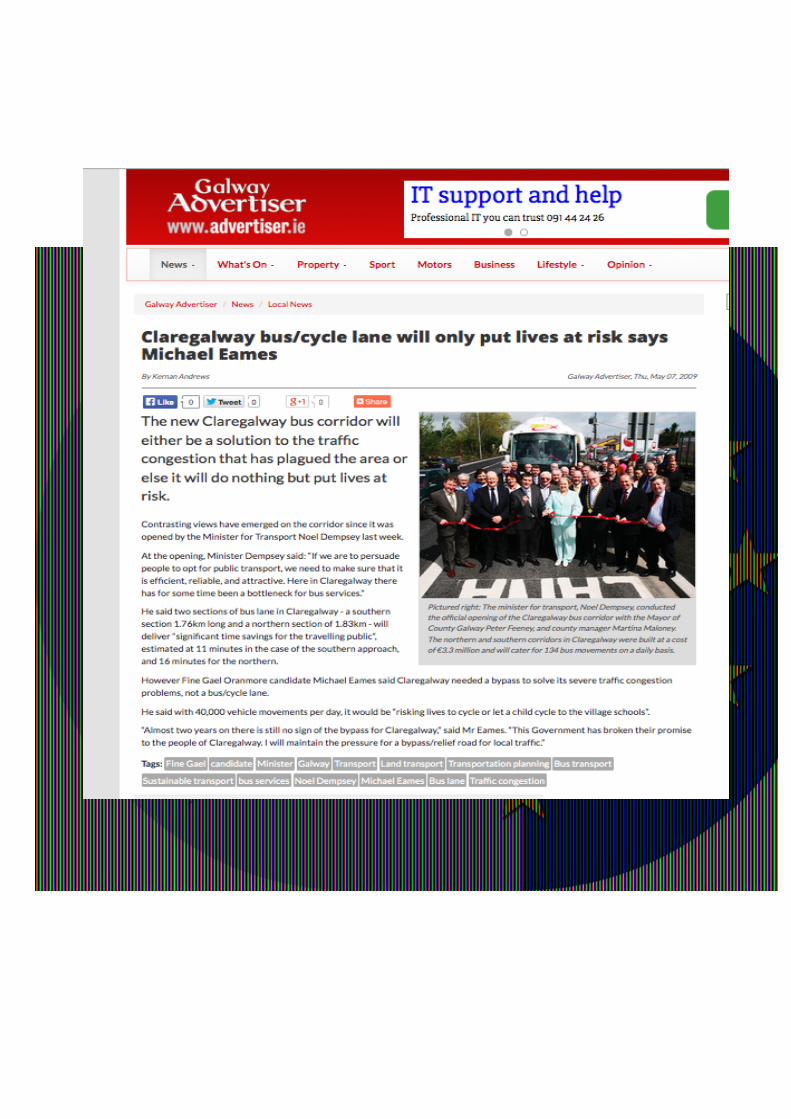
Popular Relative Media Sources
Commuting and Galway City from a Suburban,County and Regional Perspective 2015
Commuting and Galway City from a Suburban,County and Regional Perspective 2015
Commuting and Galway City from a Suburban,County and Regional Perspective 2015
Commuting and Galway City from a Suburban,County and Regional Perspective 2015
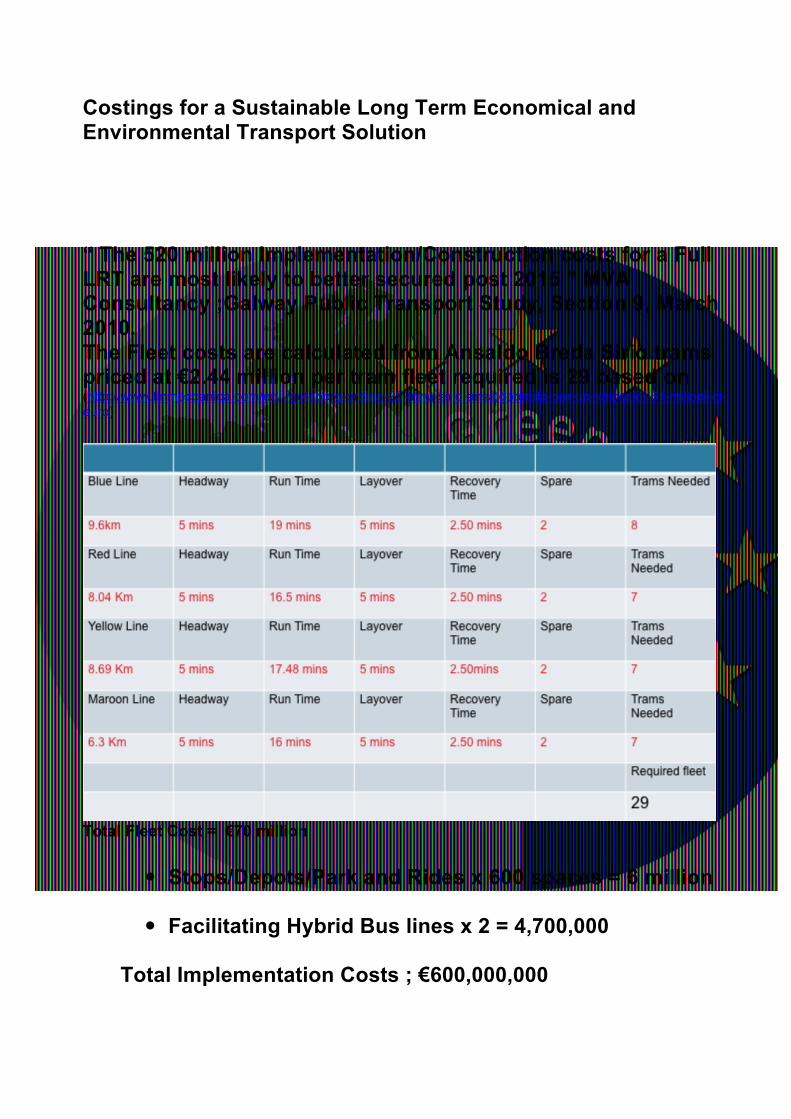
Costings for a Sustainable Long Term Economical and Environmental Transport Solution
“ The 520 million Implementation/Construction costs for a Full LRT are most likely to better secured post 2015 ” MVA Consultancy ;Galway Public Transport Study, Section 9, March 2010. The Fleet costs are calculated from Ansaldo Breda Sirio trams priced at €2.44 million per tram fleet required is 29 based on (http://www.finmeccanica.com/en/-/goteborg-ordina-25-tram-sirio-ansaldobreda-per-un-valore-di-61-milioni-di-euro)
Total Fleet Cost = €70 million
� Stops/Depots/Park and Rides x 600 spaces = 6 million
� Facilitating Hybrid Bus lines x 2 = 4,700,000
Total Implementation Costs ; €600,000,000
Commuting and Galway City from a Suburban,County and Regional Perspective 2015
Remuneration of Costs and Large Long Term Profit Return
Using the TUBA transport Calculation Matrix (http://tuba.software.informer.com/), The annualisation of Profits is worked from the precedent of a €5 Daily Adult Return Full Access ticket The Total Commuting Numbers have already been counted at 77,048 via the SAPS;CSO(2011) DED Commuting Figures. Working off this basis we annualize the ticket spend on the Adult Daily Return Ticket @ €5 (77,048) x 5 (Mon-Fri) x 52 weeks = €100,162,400 This is the Annual Gross Profit estimate per annum for this system, this price precedent has n’t included Peak Tourist Season, Weekends and School Tickets The Renumeration has also not included In Carriage Advertising revenue. Preliminary Overhead Costs would amount to: Wages = €3,657,500 29 Drivers @ €30,000 per annum = €870,000 per annum Management x 3 @ €60,000 per annum = €180,000 Administration x 50 @ €23,000 per annum = €1,150,000 Security x 15 @ €21,500 per annum = €322,500 Tram Maintenance Staff x 29 @ €35,000 =€1,015,000 Accountant x 2 @ €60,000 = €120,000 Preliminary Net Profits = € 96,400,000 Incentivized Travel for OAP’S, Disabled and First Level Students has n’t been included.
Commuting and Galway City from a Suburban,County and Regional Perspective 2015