Technology Section Comp Act ISSUE 31 | APRIL 2009 The Winchester House By Carl Desrochers and Kevin Pledge 1 The Winchester House Carl Desrochers and Kevin Pledge 2 Editor’s Notes Howard Callif 4 Letter from the Chair Tim Pauza 7 The More Things Change, The More They Stay The Same Carol Marler 9 R Corner i Steve Craighead 13 The End Users Justify the Means III: The Search for Problems: Mary Pat Campbell 16 Cool Tech Matthew Wilson 20 WANTED: Reviews and Articles on Life Insurance and Annuity Illustration, Needs Analysis, and Advanced Marketing Systems 22 Cyber-Ballistic Podiatry: A Beginner’s Guide CONTINUED ON PAGE 5 A t 525 South Winchester Blvd. in San Jose, Calif. lies an enormous man- sion, known as the Winchester House. It was built by Sarah Winchester, around the turn of the century, after she inherited a large sum of money from her husband’s rifle company. Following the death of her hus- band in 1881, and believing that her family was cursed by the spirits of all the people who had been killed by the Winchester rifle, Sarah Winchester sought out spiritualists to determine what she should do. According to popular belief, a medium advised Sarah Winchester that she had to leave her home in New Haven and travel west, and “build a home for yourself and for the spirits who have fallen from this terrible weapon, too. You can never stop building the house. If you continue building, you will live. Stop and you will die.” Following the advice of this medium, work began on the Winchester House in 1884 and it continued, 24 hours a day, seven days a week, 365 days a year. A new wing here, an additional tower there, some rooms remod- eled several times. Virtually everything needed was onsite, and with an inheritance worth approximately $21,000 per day in today’s terms, Sarah Winchester had vast sums of money available to fund construction. The
Transcript
Technology Section
CompActISSUE 31 | APRIL 2009
The Winchester House By Carl Desrochers and Kevin Pledge
1 The Winchester House Carl Desrochers and
Kevin Pledge
2 Editor’s Notes Howard Callif
4 Letter from the Chair Tim Pauza
7 The More Things Change, The More They Stay The Same Carol Marler
9 R Corneri
Steve Craighead
13 The End Users Justify the Means III: The Search for Problems:
Mary Pat Campbell
16 Cool Tech Matthew Wilson
20 WANTED: Reviews and Articles
on Life Insurance and Annuity Illustration, Needs Analysis, and Advanced Marketing Systems
22 Cyber-Ballistic Podiatry: A Beginner’s Guide
CONTINUED ON PAGE 5
A t 525 South Winchester Blvd. in San Jose, Calif. lies an enormous man-
sion, known as the Winchester House. It was built by Sarah Winchester, around the turn of the century, after she inherited a large sum of money from her husband’s rifle company.
Following the death of her hus-band in 1881, and believing that her family was cursed by the spirits of all the people who had been killed by the Winchester rifle, Sarah Winchester sought out spiritualists to determine what she should do.
According to popular belief, a medium advised Sarah Winchester that she had to leave her home in New Haven and travel west, and “build a home for yourself and for the spirits who have fallen from this terrible weapon, too. You can never stop building the house. If you continue building, you will live. Stop and you will die.”
Following the advice of this medium, work began on the Winchester House in 1884 and it continued, 24 hours a day, seven days a week, 365 days a year. A new wing here, an additional tower there, some rooms remod-eled several times. Virtually everything needed was onsite, and with an inheritance worth approximately $21,000 per day in today’s terms, Sarah Winchester had vast sums of money available to fund construction. The
Published quarterly by the Technology Section of the Society of Actuaries
Facts and opinions contained herein are the sole responsibility of the persons expressing them and shall not be attributed to the Society of Actuaries, its committees, the Technology Section or the employers of the authors. We will promptly correct errors brought to our atten-tion.
This edition has articles that cover a wide variety of topics. I think our cover story on the Winchester House raises an issue that many of our readers encoun-ter in everyday life, and will hopefully result in some “soul searching.” Thanks
to all of the authors for their hard work! I’d also like to call special attention to the call for illustration system articles—we are hoping to begin a series of articles on software used to sell and market insurance products.
There have been several comments and questions I’ve received, which I’d like to share (edited for space/clarity):
From: Richard A. Becker Subject: CompAct
I’ve just skimmed (and enjoyed) the January issue of CompAct. In your Editor’s Notes you asked about topics that may be of interest to readers. VB Macros and Converting from Visual Basic 6.0 to VB .NET are of interest to me. We have a large codebase of VB 6.0 code and I’d like to get an idea of the effort required to convert this code to VB .NET (and, possibly, C#).Thanks in advance (and keep up the good work).
EDITOR’S REPLY: Thanks to Richard Becker for feedback on what articles would be useful on VB6 and VBNet! We will try to get information on VB Macros, or at least some book reviews. I will write an article on converting systems from VB6 to VBNET (or C#), but this will take a while. In the meantime, the books Moving to VB.NET: Strategies, Concepts, and Code by Dan Appleman, and Upgrading Microsoft Visual Basic 6.0 to Microsoft Visual Basic .NET by Robinson/Bond/Oliver are both excellent resources on the topic, as is a reference of VB6 functions in NET: http://en.wikibooks.org/wiki/Visual_Basic_6_to_.NET_Function_Equivalents. The following reference will explain the foolishness of the effort: http://visualbasic.about.com/od/imhoinmyhumbleopinion/l/aa120102a.htm. There is also commercial software available (Francis Balena has written excellent books on VB, and has a product called VB Migration Partner available, although I have not used it). There is an open source editor called SharpDevelop that I am told will convert VBNET to C# (and back), although I have not used that either (see http://sourceforge.net/projects/sharpdevelop/). Thanks again for your feedback.
From: Will Slade Subject: CompAct Topics
In the last issue, you ran a request for a list of topics that would be useful for CompAct. At least in my company, many actuaries that write code are unaware of version control, and the problems that it solves.
ISSUE 31 APRIL 2009
CompAct Editor’s NotesBy Howard Callif
I also think that there is a great article yet to be written that would highlight the strengths of databases over the weaknesses of spreadsheets. In my experience, I’ve seen a lot of things that should be handled by databases, but are instead being passed around in spreadsheets that have a very large probability of error. Actually, now that I think of it, I’d be willing to write an article on spreadsheet validation.
Thanks!
EDITOR’S REPLY: Thanks to Will Slade for the suggestion to write about version control systems, databases vs. spreadsheets, and for offering to write an article on spreadsheet validation. Version control systems are a topic I would not have thought of, and I will do some research. If someone has expertise or experience on the topic of databases vs. excel spreadsheets, please consider volunteering to do an article. We rely on our membership to source and write articles, so we thank you for your offer, and hope we can find someone who is willing to return the favor!!
From: Lance Cary Subject: Calculation of Generalized IRR in Excel
Howard,
The reason for my e-mail is that we are working on incorporating Becker’s Generalized IRR method into one of our spreadsheets. In doing a search for relevant information I came across Tim Rozar’s article in the April 2008 issue of CompAct. In the article it says to contact you to get a sample workbook with the function and the examples e-mailed to you. If you could e-mail this to me I’d really appreciate it.
Thanks for your help.
EDITOR’S REPLY: Tim Rozar’s spreadsheet on a Generalized IRR method (in the April 2008 issue) was sent to Lance upon his request, along with a “hello,” since we worked together years ago when I was an intern at Republic National Life. We are thrilled to be able to help out, since our vision is for CompAct to be a resource exactly like this! Thanks again to Tim for writing the article!
Please contact me if you have any ideas, suggestions or comments (even if it is to just point out a typo).
Howard Callif, ASA, MAAA, is a product champion at Milliman IntelliScript.
CompAct | APRIL 2009 | 3
4 | APRIL 2009 | CompAct
Letter from the ChairBy Tim Pauza
G reetings, and pardon our mess while we remodel! Unfortunately, the previous edition of this newsletter was not up to our usual high standards. You may have noted, for example, that the listing of our council members published in January was incorrect.
Along with several other SOA Section newsletters, the Technology Section is participating in a newsletter update to improve the style, uniformity and the form of delivery. In the transition, some old material inadvertently slipped in and got published. Apologies to everyone, but this is actually a sign of progress as we adopt the new format! We are especially excited about plans to provide a searchable listing of newsletter articles which will make it easier to locate the quality articles we publish. While these revisions are being made, we plan to send out printed editions each quarter to make sure that nobody gets lost in the shuffle. Please let us know what you think of the changes. We are especially interested in knowing your preference as to how the newsletter is delivered. Please provide your thoughts to myself or our editor Howard Callif for consideration as we go through this transition.The section council continues to make progress on various initiatives. We are developing materials for upcoming meetings, soliciting software reviews for actuarial systems, research-ing webcast offerings in technologies of interest to our membership, supporting the SOA in an exploration of social networking, and publishing this quarterly newsletter. The list goes on, and we are always ready to add to it, especially when we discover ways to serve you better. Got an idea for us? Let us know. Want to get involved? We can accommodate that too. Please reach out to any of the council members listed inside the front cover of this newsletter with your ideas or to volunteer (I promise the names are right this time!).
work continued until the death of Sarah Winchester, poisoned by one of her servants, some 38 years later when building immediately stopped.
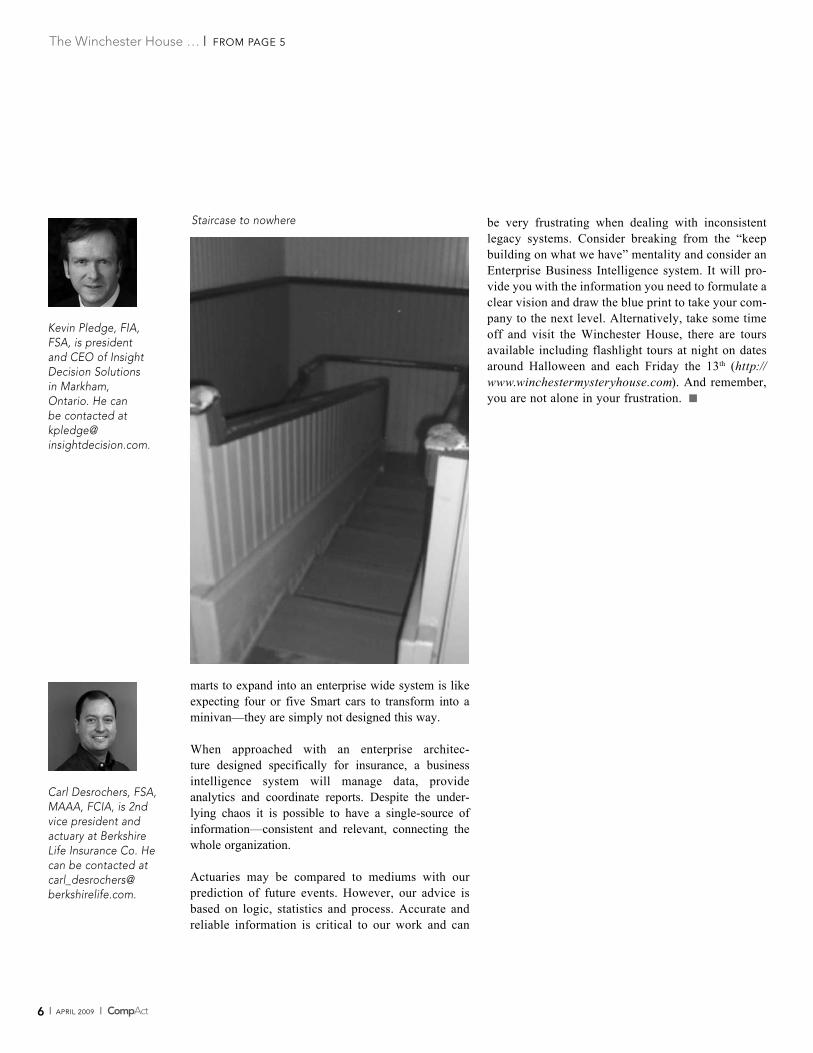
Due to the constant construction, the house became very large and quite complex; about 160 rooms, includ-ing 40 bedrooms and two ballrooms. The house also has 47 fireplaces, 10,000 window panes, 17 chimneys (with evidence of two others), two basements and three elevators. The house also features a number of oddities such as: doors that open into walls or a 10-foot drop; staircases that rise into ceilings; windows that look into walls; more passageways and halls than rooms; a three-story chimney that falls short of the roof; and many rooms that serve the same purpose.
There is no overall set of blueprints for the house, no master plan and no strategy in the design.
You are probably asking yourself “what does all this have to do with systems?” and, at the same time, it sounds strangely familiar.
In every organization, construction of systems goes on continuously. A new report here, an input screen there, a modification to an existing function combined with a new routine layered on top of an existing one; some systems enhanced several times. Virtually everything needed to build systems is onsite and vast budgets are allocated to IT departments.
As a result of this continuous building most companies have large complex systems. These systems typically feature a number of oddities such as: reports that go nowhere; more interfaces than applications; multiple standards that conflict, have redundant data, are incon-sistent and/or inaccessible, and are in incompatible formats; and many systems serve the same purpose.
Most organizations have no overall architecture for the data, systems and technology, no master plan and no strategy in design.
An Enterprise Business Intelligence (EBI) system, or enterprise data warehouse, provides a solution to the chaos brought on by the continuous building and cus-
tomization of systems. The EBI system will provide a single source of data and analytics; providing analysts with consistency and allowing the administration and other systems to continue to serve the function they were intended for instead of being bastardized for ana-lytical or other purposes.
It is also true that there are plenty of stories of data warehouses simply adding to the confusion. One must be careful as without clear vision, strategy and objec-tives, a data warehouse may end up being just another system layered on top of the existing ones contributing to the existing chaos instead of solving it. The reasons for these “failed” data warehouses can usually be attributed to one of two myths: A) data warehouses are basically the same; and B) small data mart projects will in one day grow into something bigger.
Despite what the name may suggest, a data warehouse is more than just a collection of data. The data must be structured for the intended use and many applications will be embedded in the system. After all, applications such as experience studies are relatively simple—the hard part is structuring the data to align claims and exposures, allowing flexibility in the study period and slicing by any attribute. A business intelligence system designed for retail or telecom will not be suitable for actuarial experience studies, reserve analysis and earn-ings analysis, even if the data can be added.
The second popular myth is the one concerning data marts. At the end of the day, these are quick win proj-ects, designed for a specific purpose. There is noth-ing wrong with this unless you expect it to grow and expand to other areas. Each area has its own needs, definitions and perspective on the business, consoli-dating this is not a trivial exercise or an afterthought and clearly won’t happen overnight. Expecting data
Due to the constant construction, the house became very large and quite com-plex; about 160 rooms, including 40 bed-rooms and two ballrooms.
The Wincheter House | fRom PAge 1
6 | APRIL 2009 | CompAct
Staircase to nowhere
The Winchester House … | fRom PAge 5
be very frustrating when dealing with inconsistent legacy systems. Consider breaking from the “keep building on what we have” mentality and consider an Enterprise Business Intelligence system. It will pro-vide you with the information you need to formulate a clear vision and draw the blue print to take your com-pany to the next level. Alternatively, take some time off and visit the Winchester House, there are tours available including flashlight tours at night on dates around Halloween and each Friday the 13th (http://www.winchestermysteryhouse.com). And remember, you are not alone in your frustration.
marts to expand into an enterprise wide system is like expecting four or five Smart cars to transform into a minivan—they are simply not designed this way.
When approached with an enterprise architec-ture designed specifically for insurance, a business intelligence system will manage data, provide analytics and coordinate reports. Despite the under-lying chaos it is possible to have a single-source of information—consistent and relevant, connecting the whole organization.
Actuaries may be compared to mediums with our prediction of future events. However, our advice is based on logic, statistics and process. Accurate and reliable information is critical to our work and can
Carl Desrochers, FSA, MAAA, FCIA, is 2nd vice president and actuary at Berkshire Life Insurance Co. He can be contacted at carl_desrochers@ berkshirelife.com.
Kevin Pledge, FIA,FSA, is presidentand CEO of InsightDecision Solutionsin Markham,Ontario. He canbe contacted [email protected].
CompAct | APRIL 2009 | 7
CONTINUED ON PAGE 8
The More Things Change, The More They Stay The SameBy Carol Marler
In 1994, when I was a member of the Computer Science Section Council, I wrote a column for the section newsletter titled What’s the Good Word? My
column was published for just one year, and the sec-tion later changed its name to Technology. However, the editor of this newsletter recently came across one of these old columns and asked me to update it. The original can be found on page 10 of the September 1994 issue [http://www.soa.org/library/newsletters/compact/1994/september/csn9409.pdf ].
The first paragraph of that article set the scene:The word “emergent” means, among other things, something that arises unexpectedly. A classic example is the mixture of nitric and hydrochloric acid, known as aqua regia (royal water), which dissolves gold or platinum. Neither acid alone has any effect on these metals. More generally, an “emergent” result, in this sense, is something that could not have been predicted from any of the individual items that brought it about.
Another example of an emergent property is fire. The ancients actually considered that fire was one of the four elements of which everything is made. When something burned, they interpreted this as the fire ele-ment being released from the thing that burned. Today we understand that the process of combustion releases heat when oxygen combines with fuel. The hot gases rise, giving off not only infrared radiation, but also radiation in the form of visible light. As the gases rise and expand, they cool and the visible radiation is no longer produced. Neither the fuel nor the oxygen gives off visible light before combustion begins. It is the process that produces the emergent effect, which we call flames.
I have sometimes thought that consciousness is analo-gous to this. There is a process that produces an unex-pected effect that could not be predicted from any of the physical and chemical elements that make a human being. Can this same emergent property be generated by a computer program? This is one of the challenges for the science of artificial intelligence (AI). Does your computer have a mind of its own? There are days when I am sure mine does, particularly when it becomes nec-essary to restart my machine yet again.
But actually, research in AI seems to be progressing very slowly. Several exciting developments in the 1970s suggested that we were near a break-through in
natural language communication with our machines. It doesn’t seem to have happened yet. The aim of the AI developers is to produce software that could pass the Turing Test which basically asks whether a computer could interact with us in a way that makes it impossible to tell whether it is actually a person. To keep us from being distracted by appearances, the test is supposed to be carried out using some electronic device. So far, though, silicon-based sentient beings are only found in science fiction.
Another search for sentience targets outer space. The Search for Extra-Terrestrial Intelligence (SETI) is mak-ing use of idle computers connected to the Internet. I know that some actuaries have made their computers available for this project, in which data from radio tele-scopes is downloaded and analyzed for the presence of signals. The analytical software runs when nobody is using the machine, searching for anomalies in all the data collected by radio telescopes all over the world. If there is intelligence out there, perhaps computers will help us find it.
Meanwhile, the need to protect Web sites against com-puter attacks has generated a test called CAPTCHA. This is a program that displays a series of letters and/or numbers in various fonts and positions. So far, computers have proved to be very bad at character recognition, while humans can easily interpret the series and type in what they have read. The acronym, in case you were wondering, stands for Completely Automated Public Turing Test To Tell Computers and Humans Apart.
Going in a different direction, one of the variations on Moore’s law indicates that on average, computing power per unit cost doubles approximately every two years. (The original version of the law referred to the number of transistors per integrated circuit.) This is seen as each year, more powerful computers become available for lower prices than the previous year. The trend in hardware is mirrored by the software side, where more elaborate operating systems and applica-tion programs make use of those more powerful com-puters. This sometimes leaves users annoyed at having to learn new alternatives to the old shortcuts that made them more productive.
Also, these bigger, faster, more powerful tools enable actuaries to build more complex models. Over the
Carol A. Marler, FSA, MAAA, is an associate actuary with Employers Reassurance Corporation in Indianapolis. She can be reached at [email protected].
8 | APRIL 2009 | CompAct
… there are some who suspect we may be getting to the theoretical limits of squeezing more and more logic units into a given space.
past few decades, there has also been a trend toward more and more use of stochastic models. This began with variable annuities, particularly those with embedded guarantees. This was merely hinted at in my prior article.
The recently adopted VA CARVM rules for U.S. statutory reserves, as well as those for associated Risk Based Capital (RBC), use stochastic models to estab-lish the amounts required to handle worst case scenar-ios using a metric called Conditional Tail Expectation (CTE). Explaining CTE is beyond the scope of this article, however.
For some applications, such as Economic Capital, blocks of business are projected using stochastic models. For each cell of the stochastic projection, it becomes necessary to calculate the statutory reserves and RBC. This results in what might be called S2, or stochastic on stochastic. This stresses existing computer power. Solutions include the use of simplified models for either the product or the economic scenarios; or the use of multiple computers in a configuration sometimes referred to as grid computing.
Next in line for applying stochastic tools: Life insur-ance and non-variable annuities, then health products, including long term care. Our lives as actuaries con-tinue to become more interesting all the time. In an article that gave a new tool for analysis of problems in the field of demographics, the author commented something like, “As we give sharper knives to students, the exam committees serve up tougher steaks.” I think this kind of thing still happens to us, even after we get through the exams.
In the previous essay, I talked about the idea of a per-sonal computer on each employee’s desk, and linking them together in a local area network (LAN). I didn’t mention the Internet, but in many ways, it just seems like a super-LAN. Actually, the first contact I had with the World Wide Web surprised me by how text-oriented it all was. Even now, although You-Tube is ubiquitous, and you can get maps and satellite photos
of almost anywhere in the world, most of the material on the Internet is still text-based. It’s also still rather linear, although it is possible to follow hypertext links until you come full circle back to where you began.
It’s not all text-based, though. One of the newer trends is actually running your application software on the Internet. It’s called Software as a Service and has also been referred to as cloud computing. As InfoWorld puts it, “The next big trend sounds nebulous, but it’s not so fuzzy when you view the value proposition from the perspective of IT professionals.” More generally, software to develop new applications comes under the cloud heading, as well as various computer-based busi-ness services, like payroll processing.
Going back to Moore’s law, there are some who suspect we may be getting to the theoretical limits of squeezing more and more logic units into a given space. Perhaps it is time for a paradigm shift, this time from a computer hardware perspective. One possibility being seriously explored is the use of quantum mechanics in building our computers. In traditional computers, the binary digit, or bit, has only two possible values—1 or 0. These can be mapped into true or false or they can be combined to make numbers as large as we might care to work with.
Quantum computers, however, have q-bits. Their value is, in true quantum fashion, indeterminate. The user can impose a probability function on each bit. Thus, one can think of each bit as having a value somewhere on the interval (0,1). Properly programmed, such a computer—if one existed—could solve problems that are currently beyond the abilities of traditional computers, because testing all the possibilities would take too long.
An example, mentioned in my previous article, is the factorization of a very large number into two primes, each of which is quite large as well. The difficulty of doing this factorization is the basis of many encryp-tion systems, and having an easy way to break the code could be a huge problem—except that a new encryption system could be implemented, using other features of quantum mechanics. That may not be an example of an emergent property, but it certainly is a pleasant surprise.
I close this essay, dear reader, with a wish that all of your surprises will be pleasant ones.
The More Things Change … | fRom PAge 7
CompAct | APRIL 2009 | 9CompAct | APRIL 2009 | 9
Steve Craighead, ASA, MAAA, is an actuarial consultant at TowersPerrin in Atlanta, Ga.He can be reached [email protected].
R Corneri
By Steve Craighead
In the last article, I discussed how to get data into and out of the R platform, by either using comma delimited formatted files or using ODBC techniques
to query data from Microsoft Access. In this article I will discuss how to use data once it is within R.
There are many different ways that one can store and access data within R. The primary ones that I want to discuss will be scalars, vectors, matrices and data-frames. More advanced structures are lists and objects that can be specifically designed for your applications, which I will not be able to address in this article.
Effectively one can assign a value to a variable by the use of the “<-“ assignment symbol within R. For instance the command (following the “>” symbol)
a<-1
assigns the value of 1 to the variable “a”. In this case the variable “a” is a scalar. To display the content of “a”, all one needs to do is type the command
a
and R returns
[1] 1
Note how the [1] indicates the number of the element starting in the row displayed by “a”. If you want to assign a series of values to a vector, you can do this several ways.
The most primitive is to assign a list by
a<- c(1,2,4,10,25,67,4)
Notice how the data is encapsulated within a “c( …)” structure. If you display “a”, you get:
[1] 1 2 4 10 25 67 4
Warning: Don’t use “c” as a variable, since the “c(…)” structure may produce very odd results, if used as a variable name.
Another way to get data within a variable uses the “:” symbol. Type
a <- 1:20
This stores the values 1 through 20 within “a”. If you would like to count down instead of up, you would use
Editor’s note: R Corneri is a series by Steve Craighead introducing readers to the “R” language used for statistics and modeling of data. The first column was published in the October 2008 issue, and explains how to download and install the package, as well as providing a basic introduction to the language. Refer to each CompAct issue since then for addi-tional articles in the series. The introductory article can be found on p. 24 of the October 2008 issue on the SOA Web site: http://soa.org/library/newsletters/compact/2008/october/com-2008-iss29.pdf
10 | APRIL 2009 | CompAct
To access a specific element within the matrix “d”, again you use the “[]” structure, but you need to insert a comma to distinguish the dimensions. For instance
d[1:2,3]
[1] 3 6
extracts the values from column 3 of rows 1 and 2 of the matrix “d”.
Just like “length()” specifies the length of a vector “dim()” specifies the dimensions of a matrix.
dim(d)
[1] 3 3.
If you want to extract the second dimension of the results of “dim()”, do this
dim(d)[2]
[1] 3.
To insert a new value within either a vector or a matrix, use the “[]” structure on the left-hand-side of an assign-ment statement. For instance, if you want to insert the value “200” into the middle of “d”, you would do the following:
d[2,2]<-200
> d
[,1] [,2] [,3]
[1,] 1 2 3
[2,] 4 200 6
[3,] 7 8 9.
If you would like to add a row (or column) to a matrix you can use rbind() (cbind()). For instance,e<-rbind(d,c(3,4,5))
produces
[,1] [,2] [,3]
[1,] 1 2 3
[2,] 4 200 6
[3,] 7 8 9
[4,] 3 4 5.
combines the 1:5 vector with the “a” vector immediate-ly above. Notice how the two types (1:5 vs. the vector “a”) can be easily mixed.
To access various elements of a vector, you will use the “[]” structure. For instance
b[3:8]
[1] 3.0 4.0 5.0 10.0 10.5 11.0
displays the third through the eighth value in “b”.To drop a value, append a negative sign “-” to the numeric reference with the “[]” structure. For instance:
removed the last value “20.0” from “b”. To determine the length of a vector use the “length()” function. So,
length(b)
[1] 26
Next let’s look at some of the basic commands when using matrices.
MATRICESTo work with matrices you will use the matrix() com-mand. For instance
d<-matrix(1:9,nrow=3,byrow=T)
> d
[,1] [,2] [,3]
[1,] 1 2 3
[2,] 4 5 6
[3,] 7 8 9
Notice, how we used the vector “1:9” to load the matrix, we specified the number of rows with the “nrow” component and we had to use the “byrow=T” component to make sure that we loaded the matrix row by row. If this component is left out, the default is to load the matrix by columns. Examine further use of the matrix() function, by using the ?matrix command.
There are several means to access these fields. One way is to reference the data by name. So, to display all of the data associated with drivers killed, you would use either the command “Seatbelts$DriversKilled” or “Seatbelts[,1]”. Notice how the second command displays all of the data in the first column, which cor-responds to the “DriversKilled” field.
To obtain specific values within a dataframe you can use the same “[]” structure that was discussed regarding matrices earlier. However, you can also use conditional statements as well. For instance, if you wanted to know how many months the number of drivers killed exceeds 100, you could use the following command
sum(Seatbelts$DriversKilled > 100)
[1] 157
or you could use
sum(Seatbelts[,1]>100)
[1] 157
If you wanted to know the total number of deaths to rear seat passengers (the field “rear”) in the months where the number of Drivers killed exceeds 100, you would use a conditional command like this
sum(Seatbelts[Seatbelts$DriversKilled>100,]$rear)
[1] 64586
or
sum(Seatbelts[Seatbelts[,1]>100,4])
[1] 64586
If you wanted the average you could replace the “sum()” function with the “mean()” function, or if you wanted the variance you would use the “var()” function.
If you wanted to replicate compound conditionals you can use the “|” construct for the “OR” logic operator or the “&” construct for “AND”. For instance, the command
Other useful matrix functions and operators are “t()” for transpose, “%*%” for matrix products, and “diag()” to manipulate the matrix diagonals.
Next, let us look at dataframes.
DATAFRAMESIn the prior article we examined how to get data into and out of R and our emphasis was on storing the results in a dataframe. A dataframe has the basic attributes of a matrix except the dataframe columns don’t have to be just numeric. The basic field types of dataframe can be numeric, alphanumeric or categorical. We will take as our example of a dataframe one of the existing datasets that is installed in the base R application. If you enter the “data()” command R will display a window of the various data sets in the package “datasets”. If you would like to see all of the data sets available from all packages that you have installed in R, execute the fol-lowing command:
data(package = .packages(all.available = TRUE))
To store a dataset in your current R application from the stored datasets just use the “data()” command as follows (we will use the “Seatbelts” dataset, which is the Road Casualties in Great Britain from 1969 through 1984)
data(Seatbelts)
If you type the “objects()” command, you should see the dataframe “Seatbelts” displayed as an object in your application.
If you want information on the contents of the data-frame, type the command “help(Seatbealts)” and R will display a help screen giving an extensive description of the data. Actually, Seatbelts is a much more complex object called a multivariate time series, but we will recast it to the simpler dataframe object by the follow-ing command:
Seatbelts<-data.frame(Seatbelts)
One basic command that is very useful when using datasets is the “names()” command. For instance, to display the names within the dataset do the following
names(Seatbelts)
CONTINUED ON PAGE 12
12 | APRIL 2009 | CompAct
next article, we will discuss how R uses the Model Formulae framework to allow you to create multiple statistical models.
If you have found these articles to be beneficial, you might consider obtaining the “The R Book” by Michael J. Crawley, published by Wiley and Sons. This is an excellent book on R which can benefit both the amateur and professional in the pursuit of using the R language.
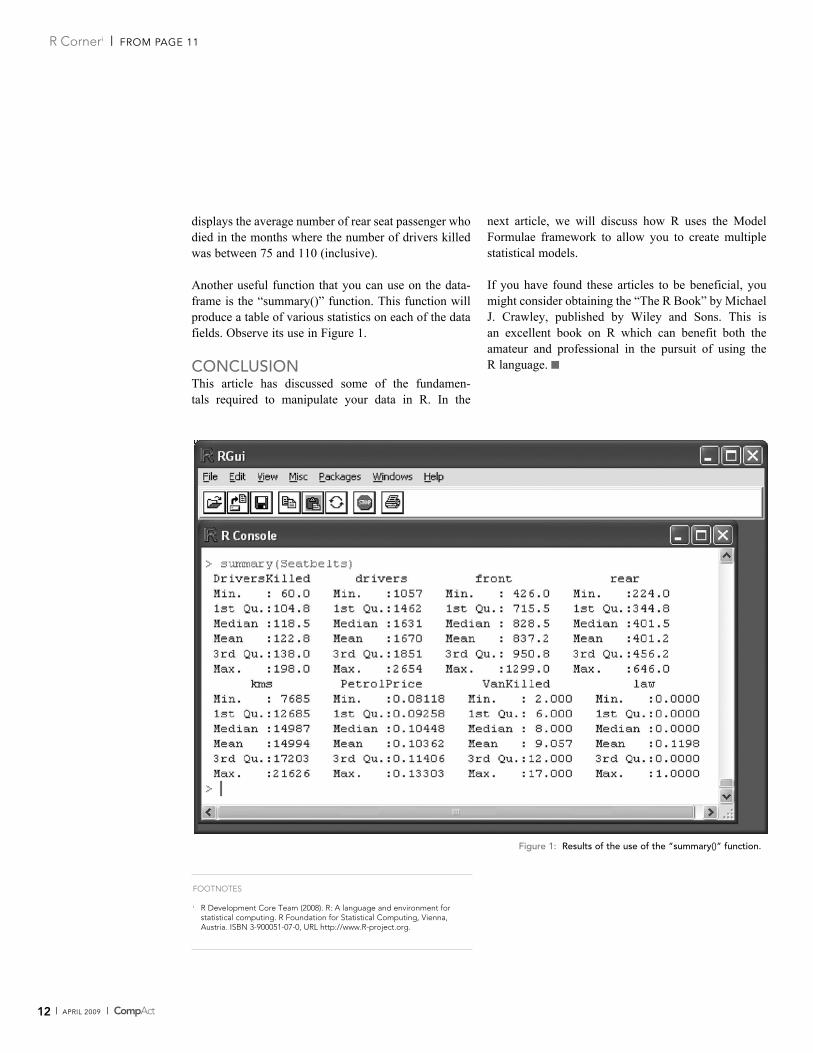
displays the average number of rear seat passenger who died in the months where the number of drivers killed was between 75 and 110 (inclusive).
Another useful function that you can use on the data-frame is the “summary()” function. This function will produce a table of various statistics on each of the data fields. Observe its use in Figure 1.
CONCLUSIONThis article has discussed some of the fundamen-tals required to manipulate your data in R. In the
Figure 1: Results of the use of the “summary()” function.
FOOTNOTES
i R Development Core Team (2008). R: A language and environment for statistical computing. R Foundation for Statistical Computing, Vienna, Austria. ISBN 3-900051-07-0, URL http://www.R-project.org.
R Corneri | fRom PAge 11
CompAct | APRIL 2009 | 13
A h yes, our friends the auditors and testers, look-ing for where we screwed up in our work. Our favorite end users of our spreadsheets, huh?
Fittingly, this installment in my series of articles on spreadsheet structuring and design will be the shortest, as the goal in dealing with this particular set of end users is this: To spend as little time as possible with them.
Time spent with an auditor is definitely not productive, as necessary as it may be, and the time spent with a tester is mainly a function of how much one has messed up one’s spreadsheets. Productive time can be spent with testers, but ideally you want to hear little more than, “Yeah, looks good to me.”
Keep in mind that the goals of auditors and testers are different. In general, auditors are looking at static spreadsheets, making sure the inputs are appropriate, spot-checking some of the interim calculations, and making sure the outputs are reasonable and end up in their proper places either in the next spreadsheet or software package in the line, or in financial reports.
Testers, on the other hand, generally are looking at the dynamic possibilities of a spreadsheet, having several different possible input sets. In addition, some testers are not just checking that the calculations look right, but also actively try to break the spreadsheet. At least, that’s how I test spreadsheets.
So let’s look at some general principles in satisfying these end users, and keeping them from bugging you:
1. Clear documentation for the spreadsheet, ideally within the spreadsheet itself.
The following comes from the article “Is This Spreadsheet a Tax Evader?” as a checklist for spread-sheet auditors in desirable documentation for a spread-sheet (or general calculation package):
• the application’s purpose, what it does and how it does it.
• any assumptions made in its design.
• what standing data constants (e.g., tax, duty and exchange rates) are used and where they are held.
• who developed it and when.• when and how it has been changed since being
brought into use.
The author of the aforementioned article, Raymond Butler, goes on to say that “Clear instructions for use should also be present.”
I have found it useful to have a single sheet within an Excel Workbook to serve as my overall documentation and version control page. There is an implementation example on page 48 of “Spreadsheet Modelling Best Practice” (see the Sources at the end of the article.) I think the example given is a bit verbose and should have each version information be a single row, with the information of version number, changes made, date of change, by whom, etc. each be in separate columns. To be sure, it is not as pretty as the IBM format in the paper, but it makes it easier in terms of organization, and one is unlikely to miss a field of information.
Part of the reason others and I advocate having the doc-umentation within the spreadsheet itself, as opposed to a separate document, is that one knows the documenta-tion is synchronized with the spreadsheet itself. It is too easy to be working on a spreadsheet and totally forget about a separate document until well after the fact, so that separate documentation is rarely up-to-date. There is little excuse when the documentation is within the spreadsheet itself.
As well, if the documentation is within the spread-sheet, you should have less e-mail from the auditor or tester asking you to resend applicable documentation. Remember: the goal is to spend as little time as possible with these people.
2. Inputs should be clearly defined, all constants explicitly declared, and all input visible.
For both testers and auditors, the inputs need to be even more clearly defined than with general public users or even numerate decision-makers. There may be many
The End Users Justify the Means III: The Search for ProblemsBy Mary Pat Campbell
Mary Pat Campbell, FSA, MAAA, is avice president at
The Infinite Actuary. She can be
contacted at marypat.campbell@
gmail.com.
CONTINUED ON PAGE 14
14 | APRIL 2009 | CompAct
3. Outputs should be clearly defined, well-organized, and all visible … as well as reproducible.
Not much different from the inputs section, of course. However, where one may have concentrated more on graphical outputs, and a clean interface with regard to users that would use this information to make decisions or to learn about various issues, the point here is that the actual numbers need to be visible.
Testers and auditors both often have separate spread-sheets or software that independently calculates results for specific input sets. They are generally going to want to see the actual numbers to compare against their own calculations, as opposed to a graph. And when you are giving a wall of numbers to a person to interpret some-how, if you don’t want to spend your time explaining and re-explaining which outputs are where, you should have them organized in a logical, clearly labeled way.
Another note here: you should not have function calls that are irreproducible. You may think this an odd exhortation, but in this age of stochastic modeling (yes, some people use Excel for this purpose) one may program in a pseudorandom number generator that one does not seed. Such as, oh, Excel’s RAND func-tion. This is bad practice from many points of view, but one of the worst is that this cannot be audited. I can-not think of another type of function call that may be variable other than something related to current time, but the point is that testers, auditors and you should be
“inputs” those users never change, that are effectively constants. However, both auditors and testers need to know about these numbers; auditors to check accuracy or reasonability, testers perhaps to change these items to test robustness of the spreadsheet.
Sometimes one may have constants defined with-in VBA macros for the spreadsheet. I recommend having an initialization macro automatically writing out the constants found within the VBA code onto a specific sheet within the workbook, making the implicit explicit.
All inputs and assumptions should be visible. It is diffi-cult to check what one can’t see. Of course, any auditor or tester worth his salt should be able to unhide every-thing (and yes, Excel password protection is a joke and easily crackable … but still, it doesn’t look good to be trying to hide something from a tester or auditor. If you’re worried they’ll mess up your work, that’s what backups are for. I highly recommend using those.)
As well, it would be nice from a tester’s point of view if all input fields were labeled, in terms of Cell or Range Names. You can paste all named cells and ranges onto your documentation page. The benefit to the tester is that this helps automate the testing process; the tester can write their own macros to fill in these ranges with appropriate test sets of inputs. It can also make one’s life easier if one has to maintain the spreadsheet, but more on that in part four of this series.
The End Users … | fRom PAge 13
CompAct | APRIL 2009 | 15
person, and if at all possible, two other people, to test your spreadsheets before the fateful day arrives. Because, of course, the best way to reduce time with auditors is to not have any mistakes in one’s spread-sheets. Alas, to reduce time with the auditors, you may have to increase your time with the testers … ah, the spreadsheet author’s lot is not an easy one.
SOURCESButler, Raymond J, CISA. “Is This Spreadsheet a Tax Evader?” Proceedings of the 33rd Hawaii International Conference on System Sciences - 2000http://www.eusprig.org/hicss33-butler-evader.pdf
Read, Nick and Batson, Jonathan. “Spreadsheet Modelling Best Practice.” April 1999. Institute of Chartered Accountants for England and Wales. http://eusprig.org/smbp.pdf
European Spreadsheet Risks Interest Group: page of news stories of spreadsheets with costly mistakes. http://eusprig.org/stories.htm
Campbell, Mary Pat. “Spreadsheet Check and Control: A Review” CompAct, July 2008, pages 13-14. http://soa.org/library/newsletters/compact/2008/july/com-2008-iss28.pdf
able to get the exact same results from the spreadsheet using the same inputs. If this does not occur, redesign your spreadsheet.
There’s really not much more to it than that. The main point is for one’s processes to be transparent and orga-nized. The point here is not to make the inputs and out-puts easily interpretable so much as easy to find so as to make it easy to compare to what should have resulted. Nothing should be hidden, as a matter of course, though much of your work will likely go unexamined.
I did not go over how one should do a thorough audit or test of spreadsheets here. I will point to the book Spreadsheet Check and Control, which I reviewed in July 2008 in CompAct. I may revisit the concepts found in that book, as well as my own testing experience, at another time. As a spreadsheet tester, I found access to the actual VBA code, and a good programming style on the part of the creator, the most helpful in my testing endeavors … mainly because by looking at the code itself, I could see what would break it. Much more effi-cient than trying a whole bunch of input sets willy-nilly (though I did that for checking out calculation behavior in normal ranges.)
A final thought—if you know your spreadsheets are going to be audited, I recommend having a separate
16 | APRIL 2009 | CompAct
PDFCreator intercepts your printer data and redirects it to a PDF file instead. [Editor’s Note: There are quite a few other free utilities available, and many more available for a fee].
MINDTOUCH, SUGARCRM AND HyPERICMindTouch Deki is a collaboration, wiki and mashup platform.
MindTouch Wiki Standard: http://www.mindtouch.com/Download
MindTouch Wiki Enterprise: http://www.mindtouch.com/Old_Site_Archive/Download
More Information: http://www.mindtouch.comProd-ucts/How_to_Buy
Click on “Learn More” links at the “How to Buy” page if you want more information.
SugarCRM is a customer relationship management (CRM) program. It tracks and organizes contacts with customers. It’s customizable, and scales well for both small and large businesses. There are also plug-ins available to add even more features. Also, some people are even integrating SugarCRM with Asterisk (the open source PBX system).
For this edition of Cool Tech we’ll take a look at three interesting open source programs covering a collaboration platform, a customer relationship
management (CRM) package and an infrastructure-monitoring program. Next we’ll move on to our first hardware project—how to create your own PBX phone system for home or office using Asterisk. Also, I also show you how to:
• Integrate SugarCRM with Asterisk in order to make automated client calls.
• Create PDF files using the free PDFCreator program.
• Convert your PowerPoint presentations to video for uploading to YouTube.
• Raise money through your Web site with this cool widget I found called ChipIn.
• Use GIMP in place of PhotoShop to enhance your snap shots, and how to make some money in the process.
• Introduce you to the world of sundials.
My VIEWSeveral years ago I stumbled onto Asterisk, which is a free Private Branch Exchange (PBX) phone system for office or home. I installed Asterisk on a cheapie bare-bones computer using the Asterisk@Home installation disk. It’s quick to install, but you’ll need to spend some time figuring out how everything works.
A couple of years ago I got sucked into the world of sundials after reading an article by the Smithsonian magazine. I did some research over several months and tracked down several programs that will allow you to design your own sundial. You can use this information to design a sundial that accurately shows the time and date for your specific location. A sundial must be loca-tion specific to work properly. That’s why store bought sundials never work correctly.
As a hobby I’ve been playing around with photogra-phy. So I’m introducing you to GIMP, which you can use in place of PhotoShop.
I’m in the process of creating an eBook on a wonky topic that you wouldn’t be interested in, but I stumbled onto a great program called PDFCreator in the process.
CompAct | APRIL 2009 | 17
CONTINUED ON PAGE 20
CREATE yOUR OWN PBX SySTEM WITH ASTERISK IN ONE HOURThis is a seriously cool project that will give you the ability to create a Private Branch Exchange (PBX) system for your house or business. Here are some of the features of this system: voice mail, conference calling, interactive voice response (phone menus), and automatic call distribution. And there is a lot more you can do by programming the system yourself.
While Asterisk itself is not easy to set up, other people have already done the legwork for you. Check out these three (free) systems: PBX in a Flash, AsteriskNow and TrixBox. PBX in a Flash seems to be the favorite from what I can tell. It took the developers of PBX in a Flash about 500 hours to get its configuration working just right.
Web sites:http://pbxinaflash.net/http://www.pbxinaflash.com/forum/index.phphttp://www.asterisknow.org/http://www.trixbox.org/
The best part about this project is that you can get it up and running in an hour. You download an ISO image and burn a bootable CD. Next, take an old computer or buy a barebones system. Put the CD in the drive and boot the computer. The CD will install a Linux operating system and the already configured Asterisk system.
You can read up on Asterisk here: http://en.wikipedia.org/wiki/Asterisk_PBX
Here’s how you can create a very inexpensive PBX system using an old computer and Asterisk software.
1. Go to Walmart.Com and order a cheapie Linux com-puter with no monitor. Your favorite local computer store might work as well.
2. Buy a cheapie used monitor for about $10 from your local computer store.
3. Download PBX in a Flash4. Do the installation. See a tutorial on the PBX in a
Flash Web site.
What about hardware? You will need two pieces of hardware. One card to accept POTS calls (Plain Old Telephone System). And you may need an adapter for VOIP calls (voice over Internet protocol) depending on the phones you have. This adapter allows you to plug a regular phone into an Internet connection.
I bought this POTS card on eBay for $16, including shipping, a few years ago: Digium Wildcard X100P OEM FXO PCI Card Asterisk PBX
CONTINUED ON PAGE 18
18 | APRIL 2009 | CompAct
Cool Tech | fRom PAge 17
You may also need an Analog Telephone Adapter for VOIP depending on the phone used. Here is what I bought a few years ago:
Sipura SPA-1001 Analog VOIP Adapter ATA SIP FXS
I’ve given you just enough information to be dangerous. Hopefully, you can take it from here.
HOOKING UP SUGARCRM TO ASTERISKSome people are integrating SugarCRM with Asterisk in order to make automated phone calls to clients. You could use this to make sales calls or as an appointment reminder.
This might take a little bit of work to get going.
Install SugarCRM on a “PBX in a Flash” Machineh t t p:/ / p bx i n a f l a s h . c o m / fo r u m /s h o w t h r e a d .php?t=131&highlight=SugarCRM
HOW TO CREATE A PDF FILEPDFCreator is a free open source program that will convert any printable document into a PDF file. PDFCreator is one of the leading open source PDF creation applications.
Warning! Watch out for PDF Creator and PDF-Creator. These are NOT the free PDFCreator. These are com-mercial programs with names that look PDFCreator, but they charge you a fee. Make sure to get your free
version of PDFCreator from here:
http://www.pdfforge.org/products/pdfcreator
PDFCreator converts documents into the Portable Document Format (PDF) format on Microsoft Windows operating systems. You select the PDFCreator as a printer destination then print it out. Instead of going to a printer, it heads to a PDF file.
You can also create PDF documents with Word 2007. It requires Service Pack 1. You must manually install the Microsoft Save as PDF Add-in.
CONVERTING POWERPOINT TO VIDEOGetting back to my Web site about international con-flict. I’ve been toying with the idea of creating some presentations and putting them on YouTube. The idea is to attract visitors to my Web site. I need a way to convert my PowerPoint presentation to a video format acceptable to YouTube. The links below handle this quite nicely:
PPT to Videohttp://www.authorstream.com/http://blog.authorstream.com/2008/03/powerpoint-presentations-as-video.html
FUNDRAISINGDo you have the need to do fund-raising for your Web site. The ChipIn widget below handles this very nicely. You should expect to get contributions from about 1 percent of your regular readers.
On my Web site I get about 1,500 visitors a day. Half of those are regular readers and the other half come in from search engines. The vast majority of search engine traffic is from Google. Anyway, 1 percent of 750 people is seven to eight people. That’s about how many donated when I tried a fund-raiser.
From ChipIn.ComChipIn is a Web-based service that simplifies the process of collecting money from groups of people. We make this process quick, easy and secure, and we provide organizers with numerous ways to get the word
CompAct | APRIL 2009 | 19
out about their ChipIn event. http://www.chipin.com/
MAKING MONEy FROM yOUR SNAP SHOTSDid you know that you could make $2,000 a week taking pictures in your own backyard, on vacation or anywhere?
OK, $2,000 a week is probably a bit much, but how about earning a couple of hundred bucks a month from your snap shots?
So how are you going to make the big bucks? By selling your snap shots to stock photo agencies on the Web like iStockPhoto.Com, BigStockPhoto.Com, ShutterStock.Com, and DreamsTime.Com.
In order to end up with fantastic pictures, often one needs to manipulate or combine multiple pictures in something like Photoshop. But Photoshop is a little pricey so we’re going to use an open source replace-ment called GIMP.
GIMP stands for GNU Image Manipulation Program. It is a graphics editor used to process digital graphics and photographs. Some typical uses include creating graphics and logos, resizing and cropping photos, altering colors, combining multiple images, removing unwanted image features, and converting between dif-ferent image formats.
GIMP is often used as a replacement for Adobe Photoshop.
You can find tutorial information here:http://gimp.org/tutorials/http://gimp.org/downloads/
SUNDIALSAbout two years ago I got sucked into the world of sun-dials after reading a very interesting article about a guy that creates very unique sundials that actually work.
A leading expert on the history of timekeeping has set out to create a sundial unlike anything the world has ever seen ...
SAMPLE EXCEL PROGRAMS FOR DOWNLOADSort_Routines.xls is an Excel spreadsheet that I created a few years ago to show five different methods of sort-ing data in a macro.http://www.1913intel.com/demo/Sort_Routines.zip
cSpot_Forward_Rates.xls is an Excel spreadsheet that calculates spot and forward rates. There is also a macro that calculates cubic splines if you’re interested.http://www.1913intel.com/demo/cSpot_ Forward_Rates.zip
Matthew Wilson, ASA, MAAA,
can be reached at matt_wilson@
farmersinsurance.com
20 | APRIL 2009 | CompAct
One of our goals is to have our readers or others sub-mit articles on commercial software that is used to sell and market life insurance or annuities. Please consider submitting your own experiences and information, or contacting anyone you may know that would have potential input and useful information.
• If your company has recently evaluated vendors and technologies, please share your knowledge! We would love to know the process you followed, how you evaluated vendors, what you evaluated, and the results. Send any contact information you have to the editor of CompAct.
• If your company uses commercial software to sell and market your products, we would love to have an article submitted on the process you follow to maintain and update it, or on your satisfaction with the solutions provided.
• If you use illustrations as part of your pricing process, those systems would be included in this call for reviews. Most actuarial modeling systems are capable of producing illustrations, so we would love to hear your thoughts on the system you use. We are especially interested in how you selected the system, how easy it is to use and maintain, and the support that is offered.
• If you use commercial software and have time to evaluate, or know of someone who can write an article on the features and functionality, please forward your name to the editor of CompAct.
• If you are a software vendor: CompAct will be con-tacting vendors to provide general articles and infor-mation. If you are interested in submitting articles on the industry or the software process in general, please send a note to the editor of CompAct.
PROCESSIdeally, we would love to do a roundup of the software available, including end-user evaluations and sup-port ratings, much like you would see in a computer magazine or consumer report. Unfortunately, we do not have the resources for this, and are hoping to produce less complete, but more timely information. There will not be numerical or quantitative values assigned, because these will not be independent or complete reviews. Therefore, no editor’s choice awards or rankings will be provided. The goal is to provide a resource for software available, how it is selected, and user experiences.
We intend to cover software areas of interest to actu-aries (pricing, valuation, etc.), and will use this as a template for future software coverage. Although actu-aries are not end users of illustration software, there is a large amount of interaction with these types of systems, and it is typically part of the pricing process. If you are interested in writing articles for a different software category, please feel free to submit those ideas or articles as well.
WANTED: Reviews and Articles on Life Insurance and Annuity Illustration, Needs Analysis, and Advanced Marketing Systems
CompAct | APRIL 2009 | 21CompAct | APRIL 2009 | 21
Software vendors may find champions to write articles, since there is little incentive for individuals to volun-teer. Although this certainly results in bias, there is a lot of information to be gained from these articles. To ensure technical accuracy, vendors will be given the chance to respond and comment on articles submitted that pertain to their software.
We will not require a complete evaluation of all aspects of software packages. Sample topics are list-ed below, and we will be developing a way to index the articles based on what aspect is being reviewed. Articles can cover one topic, to encourage as many submitters as possible. Although this makes it difficult to compare vendors, and does not give us the ability to do a full assessment, we hope to be able to pull the information into one edition eventually. If time permits, we will include an overall features chart for system functionality.
SAMPLE TOPICS• Reasons for change.• Build vs. Buy.• Process for selecting a system (RFI/RFP, etc.).• Process for implementing a system.• System functionality/features (Usability, Straight
through processing, etc).• Overall satisfaction, User Interface “Friendliness,”
Ease of Customizing, Integration.• Vendor attributes (Responsiveness/Support, Cost,
Delivery, Knowledge base, Process).
DISCLAIMERSThe editor of CompAct has extensive experience with this topic, so the decision to start with illustration soft-ware is a pragmatic one. Being previously employed by iPipeline, a large illustration software company, means potential conflicts of interest issues must be addressed. The articles will be written independently. Articles will be forwarded to the vendor for comment on content and accuracy. Any issues or concerns will be submitted to the section chair for resolution.
The articles will represent the opinions and experiences of the authors, and will not be substantiated or endorsed by the Technology Section, or the SOA. It needs to be clear that individual experiences may not be represen-tative of a vendor’s current practices or software. Our hope is that articles will focus on the software function-ality, features and vendor currently used, and that the submitters will be fair and honest in their assessments.
Although we hope to produce a features chart to help distinguish software features and functionality, numer-ic grades or evaluations will not be assigned, nor will editor’s choice or any other rankings be provided.
22 | APRIL 2009 | CompAct
Editor’s Note: This originally appeared in the September, 1994 issue of CompAct, and was originally downloaded from the Internet. If anyone can update this for some of the more recent languages, submit your thoughts to the editor. Notably missing are SAS, EZtrieve, PLI, Lisp/Small Talk, Python, OCaml, ML, and R
T he proliferation of modem programming lan-guages (all of which seem to have stolen count-less features from one another) sometimes makes
it difficult to remember what language you’re currently using. This guide is offered as a service to help pro-grammers who find themselves in such dilemmas.
c: You shoot yourself in the foot.
c++: You accidentally create a dozen instances of your-self and shoot them all in the foot. Providing emergen-cy medical assistance is impossible since you can’t tell which are bitwise copies and which are just pointing at others and saying, “That’s me, over there.”
FORTRAN: You shoot yourself in each toe, itera-tively, until you run out of toes; then you read in the next foot and repeat. If you run out of bullets, you continue anyway because you have no exception han-dling ability.
Modula-2: After realizing that you can’t actually accomplish anything in this language, you shoot your-self in the head.
COBOL: USEing a COLT 45 HANDGUN, AIM gun at LEG.FOOT, THEN place ARM.HAND.FINGER on HANDGUN.TRIGGER and SQUEEZE. THEN return HANDGUN to HOLSTER. CHECK whether shoelace needs to be retied.
BASIC: Shoot yourself in foot with water pistol. On big systems, continue until entire lower body is waterlogged.
FOURTH: Foot in yourself shoot.
APL: You shoot yourself in the foot; then spend all day figuring out how to do it with fewer characters.
Pascal: The compiler won’t let you shoot yourself in the foot.
Concurrent Euclid: You shoot yourself in somebody else’s foot.
Motif: You spend days writing a UlL description of your foot, the trajectory, the bullet, and the intricate scrollwork on the ivory handle of the gun. When you finally get around to pulling the trigger, the gun jams.
Unix: %:s foot.c foot.h foot.o toe.c toe.o % rm *.0 rm: .0: No such file or directory % is %.
XBase: Shooting yourself is no problem. If you want to shoot yourself in the foot, you’ll have to use Clipper.
Paradox: Not only can you shoot yourself in the foot, your users can too.
Revelation: You’ll be able to shoot yourself in the foot just as soon as you figure out what all these bul-lets are for.
Visual Basic: You’ll shoot yourself in the foot, but you’ll have so much fun doing it that you won’t care.
Prolog: You tell your program you want to be shot in the foot. The program figures out how to do it, but the syntax doesn’t allow it to compile.
370 JCL: You send your foot down to MIS with a 4,OOO-page document explaining how you want it to be shot. Three years later, your foot comes back deep-fried.
F#: You can concurrently shoot all toes on both feet. Note that this language is summarized by Microsoft as a fantastic scripted/functional/imperative/object-oriented programming language. Since it is “a .NET variant of ML with a core language similar to that of the OCaml programming language, with interactive scripting like Python,” see each of those individual sublanguages for ways to concurrently shoot your foot.
Perl: There are so many ways to shoot yourself in the foot.
Cyber-Ballistic Podiatry: A Beginner’s Guide
CompAct | APRIL 2009 | 23
475 N. Martingale Road, Suite 600Schaumburg, Illinois 60173


![THE NEGOTIABLE INSTRUMENTS ACT, 1881 NEGOTIABLE INSTRUMENTS ACT... · 2019-12-10 · THE NEGOTIABLE INSTRUMENTS ACT, 1881 (ACT NO. XXVI OF 1881). [9th December, 1881] Exchange and](https://static.documents.pub/doc/80x56/5f22e610cd225029067a775f/the-negotiable-instruments-act-negotiable-instruments-act-2019-12-10-the.jpg)


