Compact phase-stable design for single- anddouble-quantum two-dimensional
electronic spectroscopy
Alexandra Nemeth,1 Jaroslaw Sperling,1,3 Jürgen Hauer,1 Harald F. Kauffmann,1,2 and Franz Milota1,4,*1Department of Physical Chemistry, University of Vienna, Währingerstrasse 42, 1090 Vienna, Austria
2Ultrafast Dynamics Group, Faculty of Physics, Vienna University of Technology, Wiedner Hauptstrasse 8-10,1040 Vienna, Austria
In recent years two-dimensional electronic spectros-copy (2D-ES) has emerged as a powerful method forprobing electronic couplings [1–3] and line-shape dy-namics [4–6]. The two frequency axes of a two-dimensional (2D) spectrum are related via Fouriertransform to the time delay between a particular ex-citation pulse pair and the signal emission time. Therequired phase stability has been achieved in severalexperimental approaches, ranging from active [2]over passive [7,8] phase stabilization to the use of apulse shaper [9,10]. In the first realizations of the2D-ES only pairs of pulses have been phase stable,imposing limitations to the time delays that could beFourier transformed without loss of phase informa-tion. With the use of a pulse shaper [11], by imple-menting active phase stabilization [12], and uncou-pling of time delays [13], this limitation has beenovercome resulting in greater freedom in the designof experiments. In this Letter we report a universalsetup that is easy to implement and align yet pro-vides passive phase stability between all four pulsesinvolved in the experiment. With this what we be-lieve to be a new design single-quantum (1Q) anddouble-quantum (2Q) 2D spectra can be measured asdemonstrated for an electronic multilevel system.
A noncollinear optical parametric amplifier(NOPA), pumped by a regeneratively amplifiedTi:sapphire laser system at a repetition rate of 200kHz, delivers sub-20 fs pulses tunable across the vis-ible region. A pair of fused-silica prisms andBrewster-angled chirped mirrors [14] ensure nearlyFourier limited pulses, which are characterized inamplitude and phase by spectral interferometry [15].
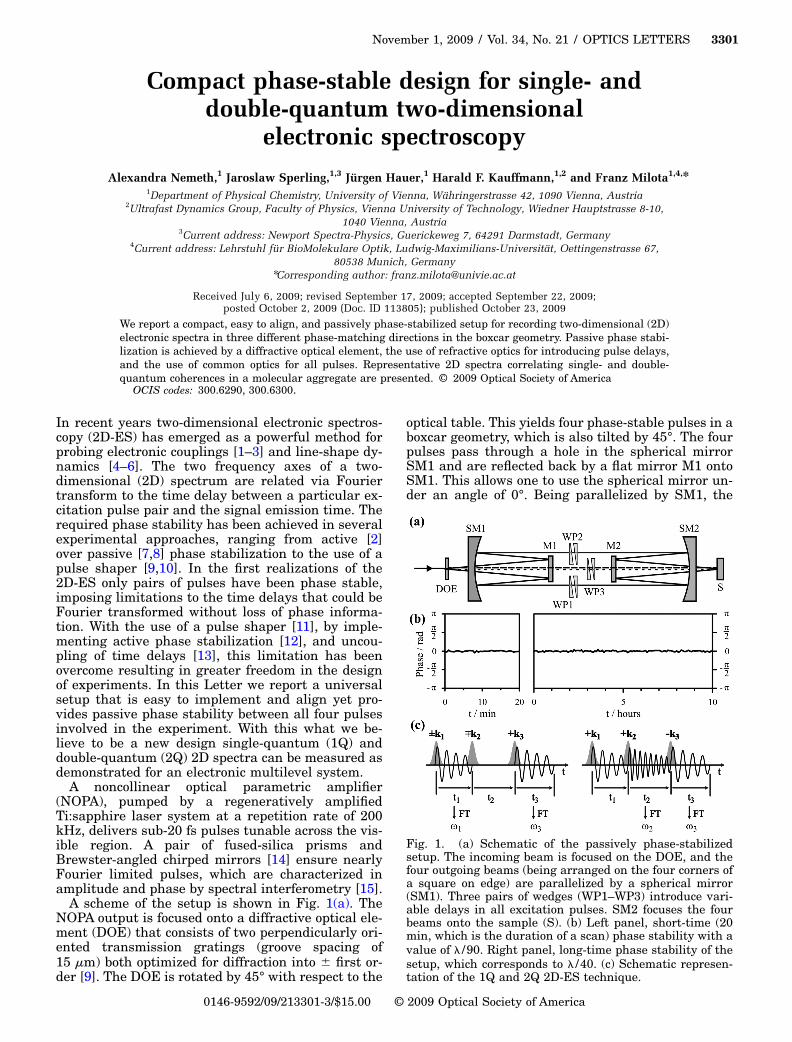
A scheme of the setup is shown in Fig. 1(a). TheNOPA output is focused onto a diffractive optical ele-ment (DOE) that consists of two perpendicularly ori-ented transmission gratings (groove spacing of15 �m) both optimized for diffraction into � first or-
der [9]. The DOE is rotated by 45° with respect to the
optical table. This yields four phase-stable pulses in aboxcar geometry, which is also tilted by 45°. The fourpulses pass through a hole in the spherical mirrorSM1 and are reflected back by a flat mirror M1 ontoSM1. This allows one to use the spherical mirror un-der an angle of 0°. Being parallelized by SM1, the
Fig. 1. (a) Schematic of the passively phase-stabilizedsetup. The incoming beam is focused on the DOE, and thefour outgoing beams (being arranged on the four corners ofa square on edge) are parallelized by a spherical mirror(SM1). Three pairs of wedges (WP1–WP3) introduce vari-able delays in all excitation pulses. SM2 focuses the fourbeams onto the sample (S). (b) Left panel, short-time (20min, which is the duration of a scan) phase stability with avalue of � /90. Right panel, long-time phase stability of thesetup, which corresponds to � /40. (c) Schematic represen-
four pulses pass by M1 on the top, bottom, right, andleft sides. The beams propagating on the left, bottom,and right sides can be individually delayed by pairsof glass wedges (WP1–WP3, angle of 2°) mounted oncomputer-controlled delay stages. WP1 and WP2 aremounted perpendicular to the table on 90° anglebrackets. The local oscillator (LO) (propagating ontop) is attenuated by a neutral density filter by ap-proximately 4 orders of magnitude. All four beamsare focused through a hole in the center of the spheri-cal mirror SM2 onto the sample (S) to a common spotsize of �200 �m. The sample is circulated in a wire-guided drop jet [16]. After the sample, the signalpropagates collinearly with the LO, and the spectralinterference pattern of these two is recorded by a1024 pixel photodiode array.
The phase stability of our setup, which amounts to� /90 in short-term and � /40 in long-term measure-ments, is demonstrated in Fig. 1(b). The measure-ment of the phase stability was performed as out-lined in [13]. To obtain the phase-stability values, theinterference fringes—recorded in the frequencydomain—are analyzed via a complex Fourier trans-formation. The components around zero are filteredout and the phase value � of the remaining fast com-ponent and its behavior in time are plotted in Fig.1(b). Our excitation pulses, for the present study cen-tered at 17 100 cm−1 with a bandwidth of 1600 cm−1,feature a temporal FWHM of 14 fs and a correspond-ing flat temporal phase [black curves in Fig. 2(a)].Moving the wedges to a delay of �500 fs introducesonly negligible changes to the temporal phase [graycurves in Fig. 2(a)]. With the current alignment de-lays of �800 fs can be realized with negligible phasedistortions and a resolution of 5.3 as.
The versatile design of the setup allows one to per-form pump probe, homodyne and heterodyne tran-sient gratings, two- and three-pulse photon echoes,and 1Q and 2Q 2D-ES, all in a spectrally resolvedfashion. A schematic of the principle underlying 1Qand 2Q 2D-ES is presented in Fig. 1(c). 1Q coher-ences are usually probed as the sum of signals emerg-ing in the directions −k1+k2+k3 (rephasing) and+k1−k2+k3 (nonrephasing), as this combination
Fig. 2. (a) Amplitude and temporal phase (black curve) ofan excitation pulse. The black, dark gray, and light graycurves show the temporal phase at optical path delays of 0,+500, and �500 fs, respectively. (b) Linear absorption andpump-probe spectrum �t=0 fs� of BIC. A level scheme indi-
cating the electronic structure is shown in the inset.
yields purely absorptive line shapes in the real partof the complex signal [17]. Interaction with the firstpulse �±k1� induces a 1Q coherence that is convertedinto a population in the ground or excited state bythe second pulse ��k2� after a certain time t1. After atime t2 the third pulse again induces a 1Q coherencethat radiates the signal in t3. For the current mea-surements t1 has been scanned over �100 fs in stepsof 0.66 fs by first scanning pulse 1 from �100 to 0 fs,and subsequently scanning pulse 2 from 0 to �100 fs.Fourier transforming with respect to t1 yields the de-sired frequency axis �1. Spectrally resolving the in-terferogram between the LO and the third-order non-linear signal makes up for the second Fouriertransform �t3→�3�. These two Fourier transforms re-quire phase stability between pulse pairs k1 /k2 andk3 /kLO to retrieve the amplitude and the phase ofthe signal field.
2Q coherences and their spectral and temporal evo-lutions are probed in the +k1+k2−k3 direction [18].Since the first two pulses interact with a positivesign, the system is in a 2Q coherence, oscillating atapproximately twice the frequency of 1Q coherencesduring the time t2. Upon Fourier transforming alongt2 and t3 the two frequency axes �2 and �3 are ob-tained. For an accurate Fourier transform the phasebetween pulse pairs k2 /k3 and k3 /kLO has to be keptconstant. In our measurements t2 was scanned from0 to +100 fs in steps of 0.25 fs by simultaneously de-laying pulses 1 and 2 from 0 to �100 fs, therebykeeping the delay between pulse 3 and the LO con-stant.
All measurements have been performed on thedye 1,1� -diethyl- 3,3� -bis(sulfopropyl)-5,5�6,6�-tetrachlorobenzimidacarbocyanine (BIC) that formslinear J aggregates in aqueous solution. The linearabsorption spectrum (c=5�10−5 mol/ l in aqueousNaOH, with a pH of 11) features a single peak cen-tered at 16 790 cm−1 [Fig. 2(b)]. Excitonic intermo-lecular couplings reshape the electronic structure toa manifold of single- and double-excited states, re-ferred to as bands e and f, respectively [cf. inset inFig. 2(b)]. The transition to the two-exciton manifoldis blueshifted as a consequence of the fermionic na-ture of molecular excitons [18]. The pump–probespectrum [Fig. 2(b)] reveals the existence of a double-excited state by featuring a negative contributionfrom excited-state absorption (ESA), blueshifted tothe positive contribution arising from ground-statebleaching (GSB) and stimulated emission (SE). Toavoid annihilation effects, the excitation intensitywas limited to 2 nJ/pulse �8.65�1013 photons/cm2�corresponding to �0.3% of all molecules being ex-cited.
The 1Q 2D electronic spectra of the BIC in ampli-tude and real part representation for t2=0 are dis-played in Fig. 3(a). In the amplitude part a single fea-ture centered on the diagonal ���1�=�3� can beobserved [19]. The real part reveals the two contribu-tions forming this peak: a positive feature (red) in-dicative of the GSB and SE and a negative feature
(blue) stemming from the ESA. The projection of the
real part onto the �3 axis equals the spectrally re-solved pump–probe spectrum displayed in Fig. 2(b).This fact is utilized for determining the absolutephase of the 2D spectrum [20].
The 2Q 2D electronic spectra of BIC recorded att1=0 are displayed in the top (amplitude) and bottom(real part) panels of Fig. 3(b). The single peak in theamplitude spectrum now appears at �2�2�3. In con-trast to the elliptical contour observed in the 1Q 2Dspectrum, the 2Q 2D peak displays a starlike shape,which is pronouncedly stretched horizontally. Thebroad range of frequencies covered in �2 reflects asubstantially increased energetic width of the two-exciton manifold (as compared with the one-excitonband). Two contributions adding up to form the am-plitude spectrum can be distinguished in the realpart spectrum. The positive feature stems from aLiouville space pathway in which the 2Q coherence isconverted into an eg 1Q coherence by interactionwith −k3, whereas the system evolves in a fe coher-ence during t3 in the negative contribution. Since�fe�eg the negative feature appears at higher fre-quency than the positive feature. As expected fromthe nonrephasing character of the 2Q 2D-ES, thenodal line separating the positive and the negativecontributions is oriented along the antidiagonal. Theabsolute phase of the 2Q 2D spectra can no longer bedetermined by comparison to a pump–probe spec-trum as described above. Instead, we take the abso-lute phase determined from a 1Q 2D spectrum re-corded before or after performing a 2Q 2D-ES scan.This procedure is justified by the high phase stability
Fig. 3. (a) 1Q and (b) 2Q 2D electronic spectra in ampli-tude (top) and real part (bottom) representation. Red andblue colors in the real part spectra indicate positive andnegative features, respectively. Contour lines are drawn ona linear scale, starting at 10% signal intensity.
of our experimental design.
In summary, we demonstrate a setup that allowsone to perform a variety of third-order techniques inheterodyne detection mode, by passive stabilizationof the entire pulse sequence. The full potential ofprobing two-exciton resonances directly will be dem-onstrated on molecular aggregates whose energeticlandscapes of one- and two-exciton states are consid-erably more complex [3].
This work was supported by the Austrian ScienceFoundation (FWF) within projects P18233 and F016/18. A. Nemeth and J. Sperling acknowledge the Aus-trian Academy of Sciences for financial support bythe doctoral scholarship program (DOCfFORTE andDOC). J. Hauer acknowledges the FWF for financialsupport by a Lise–Meitner scholarship.
References
1. T. Brixner, J. Stenger, H. M. Vaswani, M. Cho, R. E.Blankenship, and G. R. Fleming, Nature 434, 625(2005).
2. T. Zhang, C. N. Borca, X. Li, and S. T. Cundiff, Opt.Express 13, 7432 (2005).
3. A. Nemeth, F. Milota, J. Sperling, D. Abramavicius, S.Mukamel, and H. F. Kauffmann, Chem. Phys. Lett.469, 130 (2009).
4. K. Lazonder, M. S. Pshenichnikov, and D. A. Wiersma,Opt. Lett. 31, 3354 (2006).
5. A. Nemeth, F. Milota, T. Mančal, V. Lukeš, H. F.Kauffmann, and J. Sperling, Chem. Phys. Lett. 459, 49(2008).
6. A. Nemeth, V. Lukeš, J. Sperling, F. Milota, H. F.Kauffmann, and T. Mančal, Phys. Chem. Chem. Phys.11, 5986 (2009).
7. M. L. Cowan, J. P. Ogilvie, and R. J. D. Miller, Chem.Phys. Lett. 386, 184 (2004).
8. T. Brixner, I. V. Stiopkin, and G. R. Fleming, Opt. Lett.29, 884 (2004).
9. K. Gundogdu, K. W. Stone, D. B. Turner, and K. A.Nelson, Chem. Phys. 341, 89 (2007).
10. E. M. Grumstrup, S.-H. Shim, M. A. Montgomery, N.H. Damrauer, and M. T. Zanni, Opt. Express 15, 16681(2007).
11. K. Stone, K. Gundogdu, D. B. Turner, X. Li, S. T.Cundiff, and K. A. Nelson, Science 324, 1169 (2009).
12. A. D. Bristow, D. Karaiskaj, X. Dai, T. Zhang, C.Carlsson, K. R. Hagen, R. Jimenez, and S. T. Cundiff,arXiv:0905.0947.
13. V. I. Prokhorenko, A. Halpin, and R. J. D. Miller, Opt.Express 17, 9764 (2009).
14. P. Baum, M. Breuer, E. Riedle, and G. Steinmeyer,Opt. Lett. 31, 2220 (2006).
15. P. Baum and E. Riedle, J. Opt. Soc. Am B 22, 1875(2005).
16. M. J. Tauber, R. A. Mathies, X. Chen, and S. E.Bradforth, Rev. Sci. Instrum. 74, 4958 (2003).
17. M. Khalil, N. Demirdöven, and A. Tokmakoff, Phys.Rev. Lett. 90, 047401 (2003).
18. D. Abramavicius, D. V. Voronine, and S. Mukamel,Proc. Natl. Acad. Sci. USA 105, 8525 (2008).
19. I. Stiopkin, T. Brixner, M. Yang, and G. R. Fleming, J.Phys. Chem. B 110, 20032 (2006).
20. D. M. Jonas, Annu. Rev. Phys. Chem. 54, 425 (2003).