Page 1
Company LOGO
www.company.com
System Requirements ReviewAkshay Ashok, Nithin Kolencherry, Steve Skare,
Michael McPeake, Muhammad Azmi, Richard Wang, Mintae Kim, Dodiet Wiraatmaja, Nixon Lange
Page 2
Company LOGO
www.company.com
Outline
• Opportunity Description and Mission • Market Forecast• Market Analysis• Concept of Operations• Quality Functional Deployment• Initial Sizing
Page 3
Company LOGO
www.company.com
Opportunity Description
Create a supersonic transport aircraft that meets the following characteristics:
• Mach 1.6-1.8 Cruise Speed • 4000 nm Design range• 35-70 Passengers (Mixed Class)• 3 Pax-mi/lb Fuel Efficiency• Takeoff Field Length < 10000 ft
SizingMission Markets Con Ops QFD
Page 4
Company LOGO
www.company.com
Mission
A cost-effective, advanced, high-speed commercial air transport that connects major worldwide hubs
Key assumptions:• Supersonic flights over land will be allowed
(Overpressure < 0.3psf)• There will be a market for Supersonic Business Jets
and Transports in general• IOC in 2020• Manufacturing capabilities exist
SizingMission Markets Con Ops QFD
Page 5
Company LOGO
www.company.com
Customer Priorities
• Customer needs and System Benefits– Speed
• Supersonic travel
– Safety• Compliance with FAA/ICAO regulations• Acceptable boom signature
– Global Connectivity• Connect major worldwide hubs
– Affordability• Competitive Pricing
SizingMission Markets Con Ops QFD
Page 6
Company LOGO
www.company.com
Customers
• Primary Customer: Airlines– Singapore Airlines
• Ranked No. 1 in the world, Significant presence in Asia.
– United Arab Emirates• Strategically located in one of our hubs. A well known luxury airlines.
– Delta Airlines• Top US Airline, the only one that covers all 50 states. Strong presence in Asia
and Europe.
• Private Customers– A variant of our aircraft will be designed to suit specific customer
needs.
http://airtravel.about.com/od/basedinnorthamerica/tp/top10na.htmhttp://travel.msn.co.nz/article.aspx?id=378404
SizingMission Markets Con Ops QFD
Page 7
Company LOGO
www.company.com
Competition
• Small business Jets– Capable of achieving supersonic speed
• TU-444, Aerion SBJ, QSST, Sukhoi-Gulfstream S-21
• Boeing 737’s and Airbus 318’s Successor• In the future, supersonic aircraft will become
common• Big manufacturers might buy the technology from
elsewhere• May develop their own supersonic technologies
SizingMission Markets Con Ops QFD
Page 8
Company LOGO
www.company.com
• Examined forecast by Airbus and Boeing
• Predict traffic flow and regional flow
Market Forecast
http://www.airbus.com/en/corporate/gmf/http://www.boeing.com/commercial/cmo/index.html
SizingMission Markets Con Ops QFD
Page 9
Company LOGO
www.company.com
• Asia-Pacific dominates aircraft market followed by North America
• Low Cost Carrier growth in Asia and Europe
• Target potential aircraft customers
Market Forecast
http://www.airbus.com/en/corporate/gmf/http://www.boeing.com/commercial/cmo/index.html
SizingMission Markets Con Ops QFD
Page 10
Company LOGO
www.company.com
Market Forecast
http://www.airbus.com/en/corporate/gmf/http://www.boeing.com/commercial/cmo/index.html
SizingMission Markets Con Ops QFD
Page 11
Company LOGO
www.company.com
Markets of Interest
• Three regions of focus– Trans-Atlantic– Trans-continental– Inter-Asia
SizingMission Markets Con Ops QFD
Page 12
Company LOGO
www.company.com
Trans-Atlantic : Market
• US D.o.C. Data on overseas travel
• Focus on Trans-Atlantic Market– Europe is most popular
destination– 10.5% of business travel
to Europe
• Economic MissionEu
rope
Caribbea
n
South Ameri
ca
Centra
l Ameri
caAfri
ca
Middle Ea
stAsia
Oceania
0.00%
5.00%
10.00%
15.00%
20.00%
25.00%
30.00%
35.00%
40.00%
45.00%Travelers Outbound from USA
BusinessLeisure
*Data from US Department of Commerce : Office of Travel and Tourism Industries
SizingMission Markets Con Ops QFD
Page 13
Company LOGO
www.company.com
Trans-Atlantic : Destination
• Hub-Spoke structure• Select London Heathrow
(U.K.) as gateway city• LCC’s network rest of
Europe
0.00%
10.00%
20.00%
30.00%
40.00%
50.00%
60.00%
70.00%
Travelers to Europe
BusinessLeisure
*Data from US Department of Commerce : Office of Travel and Tourism Industries
SizingMission Markets Con Ops QFD
Page 14
Company LOGO
www.company.com
Trans-Atlantic : Market Penetration
Business Travelers
8% of Business Travelers Captured
1.75% of Leuisure Travelers Captured
Leuisure Travelers
Trans-Atlantic Market Capture
SST Market Penetration Model– Based on 2007 Household income– Market share vs. value of time saved– Value of Time Multiple (VTM)
measures value of each hour saved
0 50 100 150 200 250 3000
10
20
30
40
50
60
70
80
90
100Market Share vs Cost per hour
Cost per hour saved ($/hr)
Mar
ket S
hare
Per
cent
age
(%)
Model presented in: Dubin, AP; AIAA-1978-1557
Business Travelers(VTM=1.74)
Leisure Travelers(VTM=1.1)
SizingMission Markets Con Ops QFD
Page 15
Company LOGO
www.company.com
Trans-Atlantic : Route details
• JFK - LHR– Flight time of 3.5 hrs, 2.5 Hours Saved– Maximum of 5 legs daily (1 hr turnaround)– JFK limits design runway length (8400 ft)
• Market capture– Airbus predicts 4% annual passenger growth
worldwide• ¾ % growth in high-speed market
– 60 passengers per leg– 15 first class seats, 45 coach class seats
http://www.airbus.com/en/corporate/gmf/http://www.boeing.com/commercial/cmo/index.html
SizingMission Markets Con Ops QFD
Page 16
Company LOGO
www.company.com
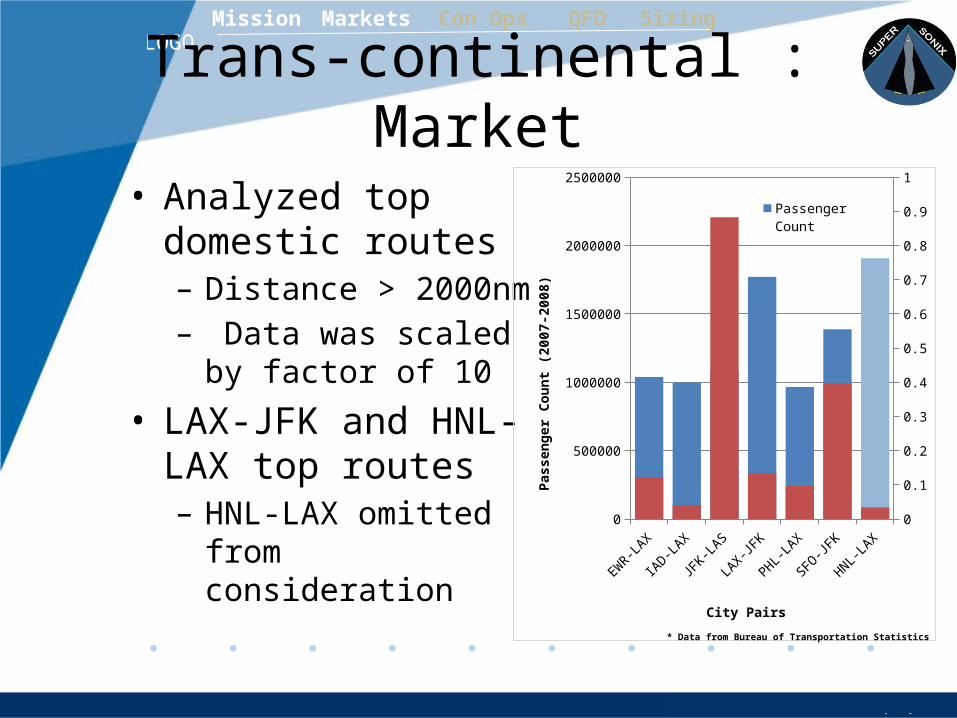
Trans-continental : Market
• Analyzed top domestic routes– Distance > 2000nm– Data was scaled by
factor of 10
• LAX-JFK and HNL-LAX top routes– HNL-LAX omitted from
considerationEW
R-LAX
IAD-LAX
JFK-LA
S
LAX-JF
K
PHL-LAX
SFO-JF
K
HNL-LAX
0
500000
1000000
1500000
2000000
2500000
0
0.1
0.2
0.3
0.4
0.5
0.6
0.7
0.8
0.9
1
Passenger Count
F/Y Ratio
City Pairs
Pass
enge
r Cou
nt (2
007-
2008
)
* Data from Bureau of Transportation Statistics
SizingMission Markets Con Ops QFD
Page 17
Company LOGO
www.company.com
Trans-continental : City Pairs
• Hub-Spoke Structure– LAX and JFK as hubs– LCC’s provide
connections
SizingMission Markets Con Ops QFD
Page 18
Company LOGO
www.company.com
Trans-continental : Route details• LAX - JFK
– Flight time of 3 hrs (average); – 1 hr turnaround time– Maximum of 6 legs daily– JFK limits design runway length (8400 ft)
• Market capture– Similar annual growth of 4% with 0.75% in
supersonic market.– 1.70% of total trans-continental traffic
• Aggregate VTM of 1.1
– 60 passengers per leg– 15 first class seats, 45 coach class seats
SizingMission Markets Con Ops QFD
Page 19
Company LOGO
www.company.com
Inter-Asia : Market
Region RPK 2007 (billions)
RPK 2027 (billions)
RPK increase
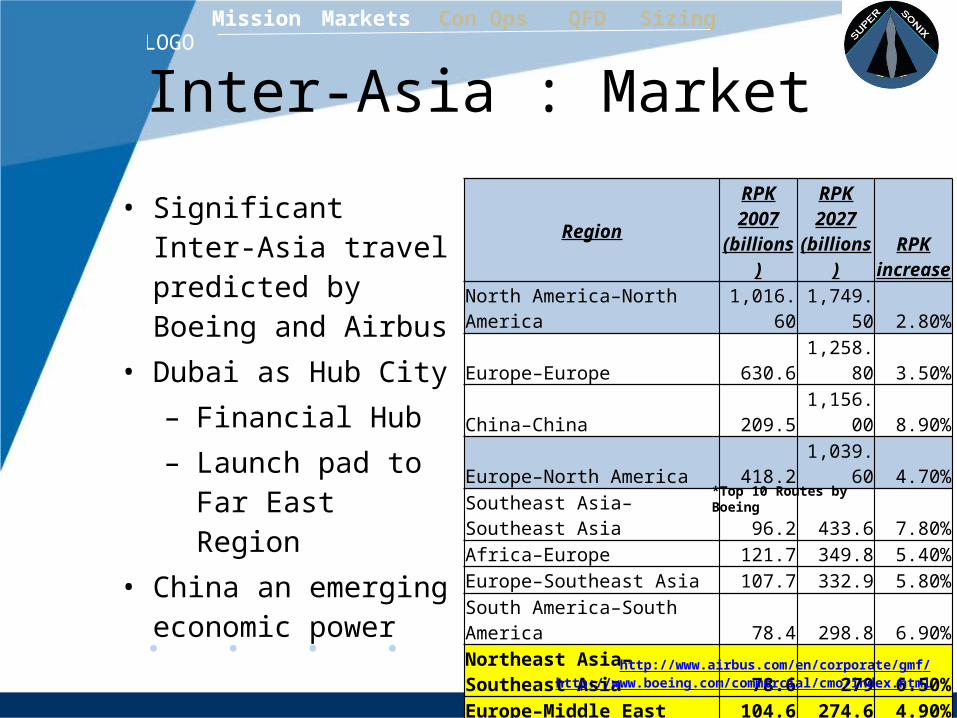
North America–North America 1,016.60 1,749.50 2.80%Europe–Europe 630.6 1,258.80 3.50%China–China 209.5 1,156.00 8.90%Europe–North America 418.2 1,039.60 4.70%Southeast Asia–Southeast Asia 96.2 433.6 7.80%Africa–Europe 121.7 349.8 5.40%Europe–Southeast Asia 107.7 332.9 5.80%South America–South America 78.4 298.8 6.90%Northeast Asia–Southeast Asia 78.6 279 6.50%Europe–Middle East 104.6 274.6 4.90%
• Significant Inter-Asia travel predicted by Boeing and Airbus
• Dubai as Hub City– Financial Hub– Launch pad to Far
East Region• China an emerging
economic power *Top 10 Routes by Boeing
http://www.airbus.com/en/corporate/gmf/http://www.boeing.com/commercial/cmo/index.html
SizingMission Markets Con Ops QFD
Page 20
Company LOGO
www.company.com
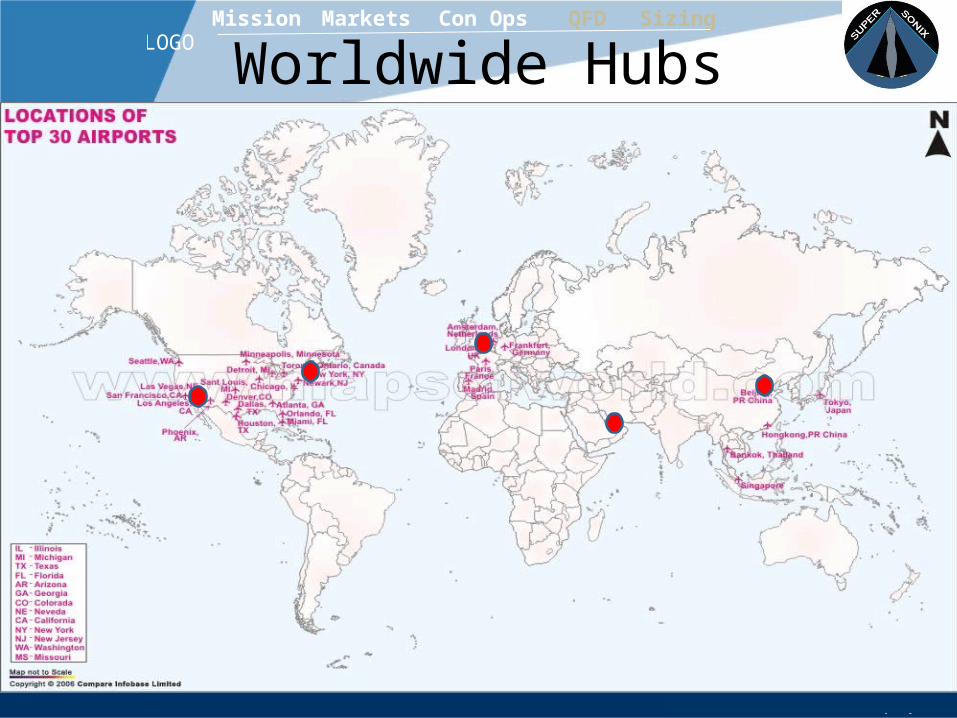
Worldwide HubsDistances by Region
(nm) ASIA AMERICA EUROPEMIDDLE
EASTSOUTH AFRICA
NRT PEK SVO BOM SHA JFK LAX ORD SFO ANC HNL SEA LHR FRA DXB JNB
ASIA
Tokyo NRT 0 1155 4064 3670 993 5861 4737 5452 4453 2984 3318 4144 5191 5071 4316 7332Beijing PEK 0 3137 2574 580 5942 5432 5717 5138 3442 4398 4699 4414 4217 3161 6316
Moscow SVO 0 3138 3689 4051 5281 4318 5107 3778 6112 4528 1359 1096 2003 4935Bombay BOM 0 2714 6777 7568 6999 7305 5575 6971 6739 3899 3551 1041 3753Shanghai SHA 0 6426 5650 6138 5359 3754 4303 4984 4985 4777 3464 6340
AMERICA
New York JFK 0 2151 643 2247 2942 4330 2104 2999 3350 5951 6925L.A LAX 0 1516 293 2038 2221 829 4741 5045 7246 9024
Chicago ORD 0 1604 2473 3687 1495 3435 3774 6297 7568San Fran. SFO 0 1754 2084 590 4664 4952 7041 9170
Anchorage ANC 0 2413 1259 3901 4064 5484 8698Hawaii HNL 0 2326 6289 6474 7413 10365Seattle SEA 0 4171 4439 6452 8919
EUROPE London LHR 0 354 2972 4884Germany FRA 0 2619 4675
MIDDLE EAST Dubai DXB 0 2450
AFRICA South Africa JNB 0
AVERAGE Distance NRT PEK SVO BOM SHA JFK LAX ORD SFO ANC HNL SEA LHR FRA DXB JNB
3921 3770 3537 4517 4010 3919 3986 3820 3860 3410 4544 3605 3641 36544244.37
5 6335
SizingMission Markets Con Ops QFD
Page 21
Company LOGO
www.company.com
Worldwide HubsSizingMission Markets Con Ops QFD
Page 22
Company LOGO
www.company.com
Range Diagram
Los Angeles (LAX)
Copyright © 1996-2009, Karl L. Swartz. All rights reserved. All trademarks mentioned herein belong to their respective owners.
SizingMission Markets Con Ops QFD
Page 23
Company LOGO
www.company.com
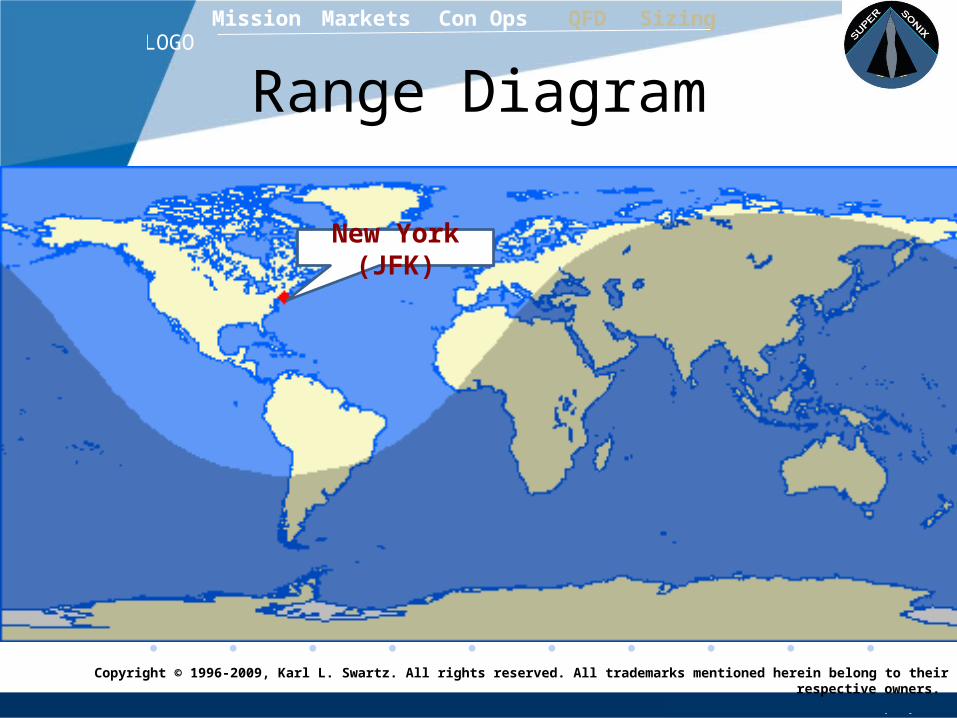
Range Diagram
New York (JFK)
Copyright © 1996-2009, Karl L. Swartz. All rights reserved. All trademarks mentioned herein belong to their respective owners.
SizingMission Markets Con Ops QFD
Page 24
Company LOGO
www.company.com
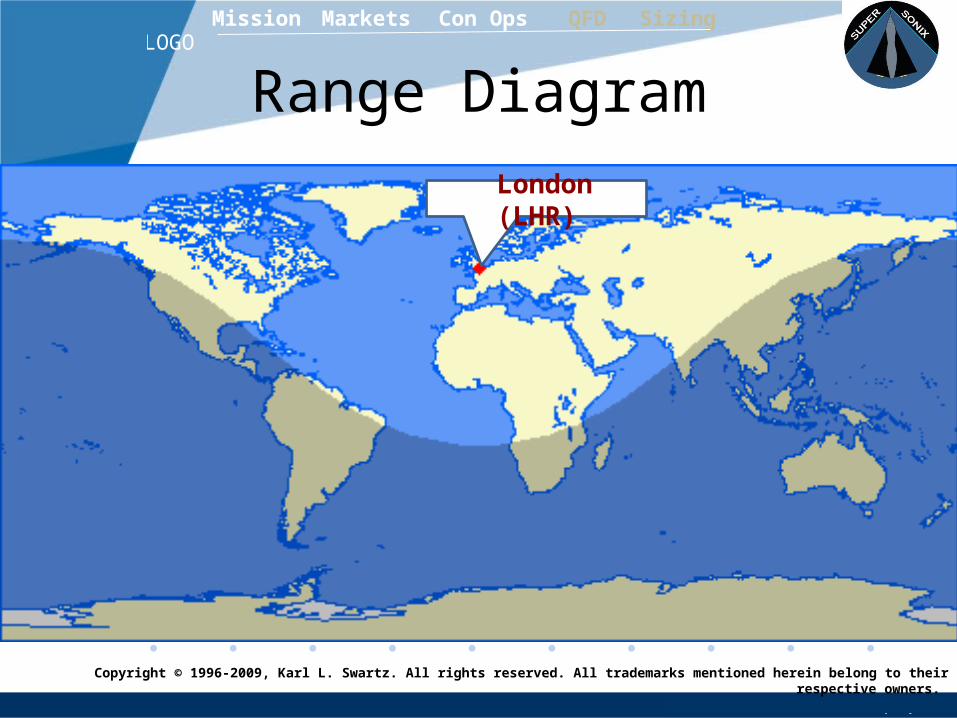
Range Diagram
London (LHR)
Copyright © 1996-2009, Karl L. Swartz. All rights reserved. All trademarks mentioned herein belong to their respective owners.
SizingMission Markets Con Ops QFD
Page 25
Company LOGO
www.company.com
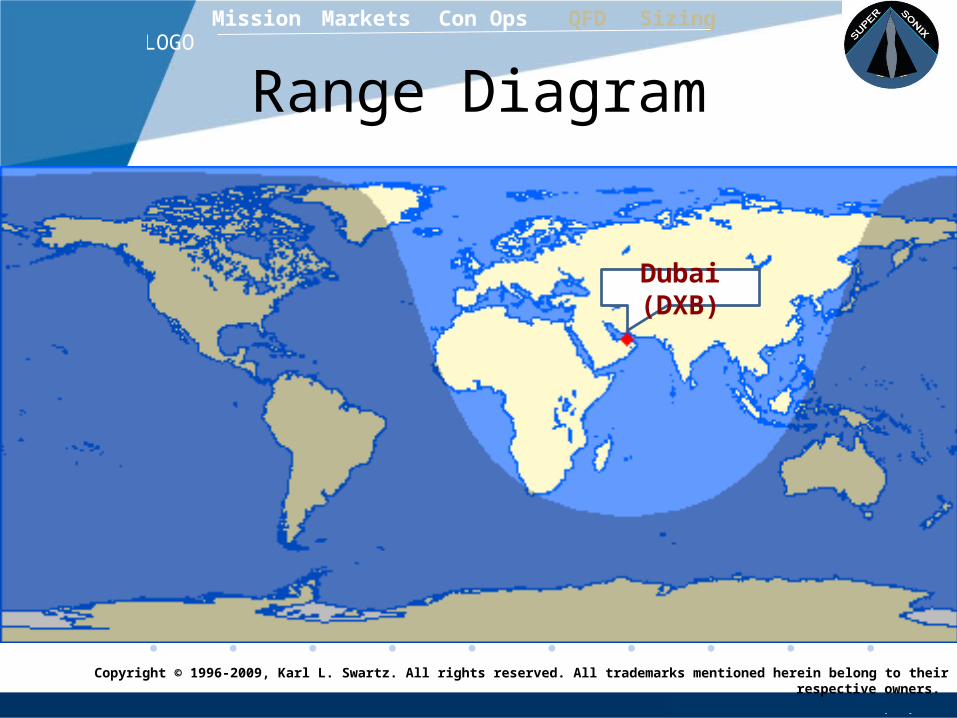
Range Diagram
Dubai (DXB)
Copyright © 1996-2009, Karl L. Swartz. All rights reserved. All trademarks mentioned herein belong to their respective owners.
SizingMission Markets Con Ops QFD
Page 26
Company LOGO
www.company.com
Range Diagram
Beijing (PEK)
Copyright © 1996-2009, Karl L. Swartz. All rights reserved. All trademarks mentioned herein belong to their respective owners.
SizingMission Markets Con Ops QFD
Page 27
Company LOGO
www.company.com
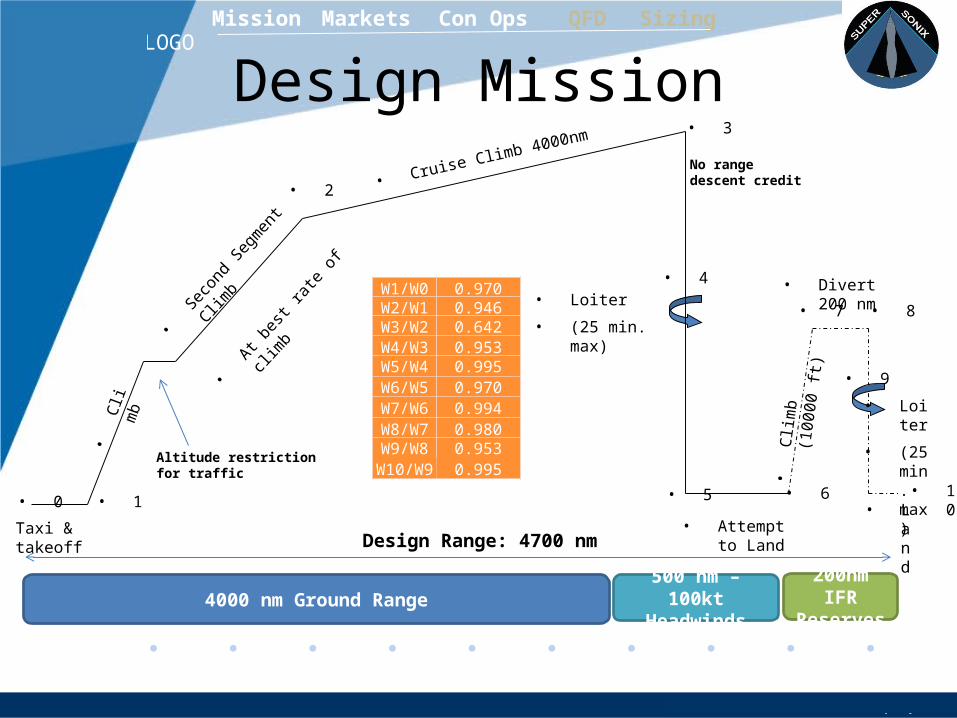
Design Mission
• 1• 0
• 3
• 2
• 4
• 6 • 10
• 7
• 9
• 8
• Taxi & takeoff
• 5
•Cl
imb
(100
00 ft
)
•
Seco
nd Segm
ent Clim
b
•
At best
rate of c
limb
• Cruise Climb 4000nm
• Loiter
• (25 min. max)
• Attempt to Land
• Divert 200 nm
• Loiter
• (25 min. max)
• Land
•Cl
imb
No range descent credit
Altitude restrictionfor traffic
4000 nm Ground Range500 nm – 100kt
Headwinds200nm IFR Reserves
Design Range: 4700 nm
W1/W0 0.970W2/W1 0.946W3/W2 0.642W4/W3 0.953W5/W4 0.995W6/W5 0.970W7/W6 0.994W8/W7 0.980W9/W8 0.953
W10/W9 0.995
SizingMission Markets Con Ops QFD
Page 28
Company LOGO
www.company.com
Viability• Development and Manufacturing costs
estimated from NASA Aircraft Airframe and Turbine Engine Cost Models
• $35 Billion for 200 aircraft (in 2020 $)– Cost per aircraft is $175 million– Selling price is projected to be $192.5 million (10% mark up)
http://cost.jsc.nasa.gov/airframe.html, http://cost.jsc.nasa.gov/ATECM.htmlLiebeck, R. Andrastek, Donald A. Chau, Johnny, Girvin, Raquel. Lyon, Roger. Advanced Subsonic Airplane Design & Economic Studies.
McDonald Douglas Aerospace Long Beach California. April 1995
SizingMission Markets Con Ops QFD
Page 29
Company LOGO
www.company.com
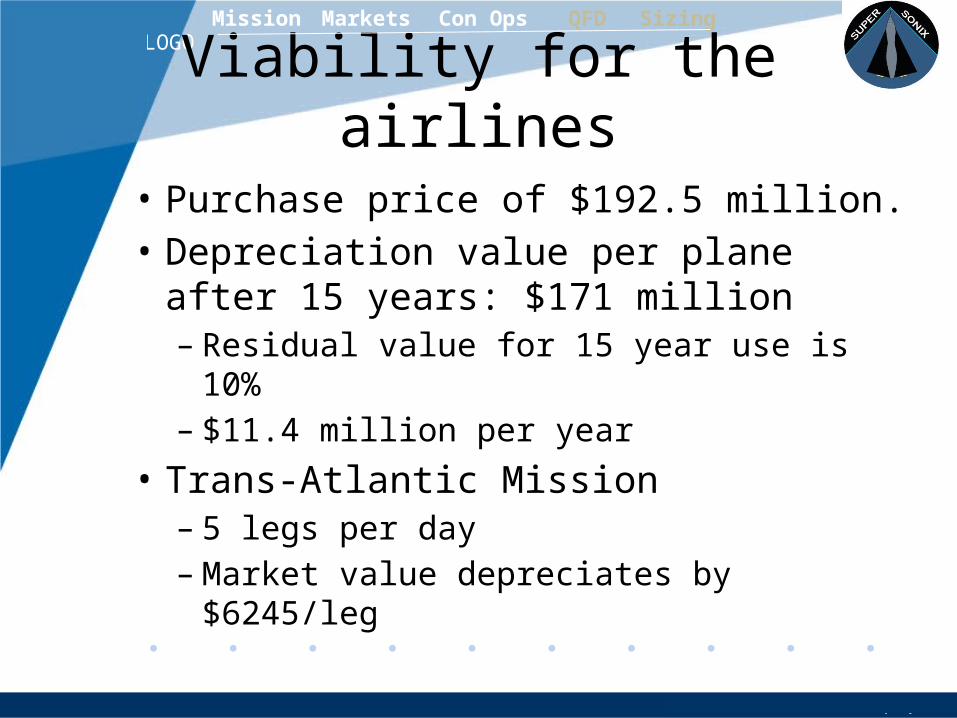
Viability for the airlines
• Purchase price of $192.5 million.• Depreciation value per plane after 15
years: $171 million– Residual value for 15 year use is 10%– $11.4 million per year
• Trans-Atlantic Mission– 5 legs per day– Market value depreciates by $6245/leg
SizingMission Markets Con Ops QFD
Page 30
Company LOGO
www.company.com
Typical aircraft economic missionFlight Cost JFK-LHRCockpit Crew 961.9 $4809.5Cabin Crew 239.55$/block hr $1197.75Landing Fee 1597.29$/block hr $7986.45Navigation Fee* 51.65$/block hr $258.25Fuel $144040.61 full 96027.07 Total $110,279 Maintenance JFK-LHR Labor MMH/FH 3.323462679 MMH/FC 2.686034416 AFLAB 15.14901946MMH/Trip Direct Labor Cost $378.7254866 Material MAT/FH 50.1896158 MAT/FC 133.1875213 AAMB $757.4509732 Total Airframe Cost $2238.25 Engine MMH/Trip $7.784589754 Material $/Trip $477.8349997 EAMB Total Engine Cost $1630.32 Overall Cost JFK-LHR $114,147.5933
• Direct Operating Costs (projected)
• DOC in 2020– $145,855.
http://cost.jsc.nasa.gov/airframe.html, http://cost.jsc.nasa.gov/ATECM.htmlLiebeck, R. Andrastek, Donald A. Chau, Johnny, Girvin, Raquel. Lyon, Roger. Advanced Subsonic Airplane Design & Economic Studies.
McDonald Douglas Aerospace Long Beach California. April 1995
SizingMission Markets Con Ops QFD
Page 31
Company LOGO
www.company.com
Aircraft Economic Mission
• As shown above, DOC is $145,855• Depreciation per flight is $6245• Total cost is $152,101 • Per passenger cost is $2535.92• To achieve a 5% profit, $2661 in 2020
($2161 in today’s dollar)
SizingMission Markets Con Ops QFD
Page 32
Company LOGO
www.company.com
System Design RequirementsSizingMission Markets Con Ops QFD
Page 33
Company LOGO
www.company.com
System Design RequirementsSizingMission Markets Con Ops QFD
Page 34
Company LOGO
www.company.com
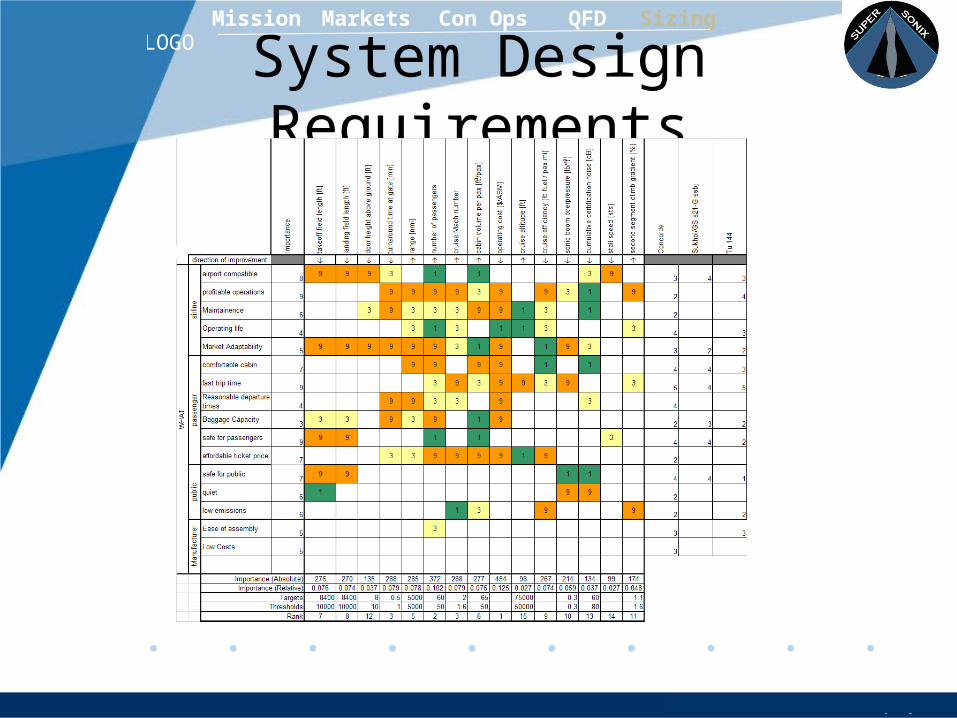
System Design Requirements
takeoff field length [ft]
landing field length [ft]
door height above ground [ft]
turnaround time at gate [min]
range [nmi]
number of passengers
cruise Mach number
cabin volume per pax [ft3/pax]
operating cost [$/ASM]
cruise altitude [ft]
cruise efficiency [lb fuel / pax mi]
sonic boom overpressure [lb/ft2]
cumulative certification noise [dB]
stall speed [kts]
second segment climb gradient [%]
0.000 0.020 0.040 0.060 0.080 0.100 0.120 0.140
Engineering characteristics (relative importance)
SizingMission Markets Con Ops QFD
Page 35
Company LOGO
www.company.com
System Design RequirementsSizingMission Markets Con Ops QFD
Page 36
Company LOGO
www.company.com
Technologies for Consideration
• Modified aerodynamics to reduce sonic boom overpressure- Quiet Spike™
• Engine Technologies- Variable Cycle Turbofans- Modified Engine Geometry- Environmentally Friendly (Sound and Fuel Emissions)
• Materials- Composites- Adaptability (Climate)
http://www.nasa.gov/vision/earth/improvingflight/supersonic_jousting.html
SizingMission Markets Con Ops QFD
Page 37
Company LOGO
www.company.com
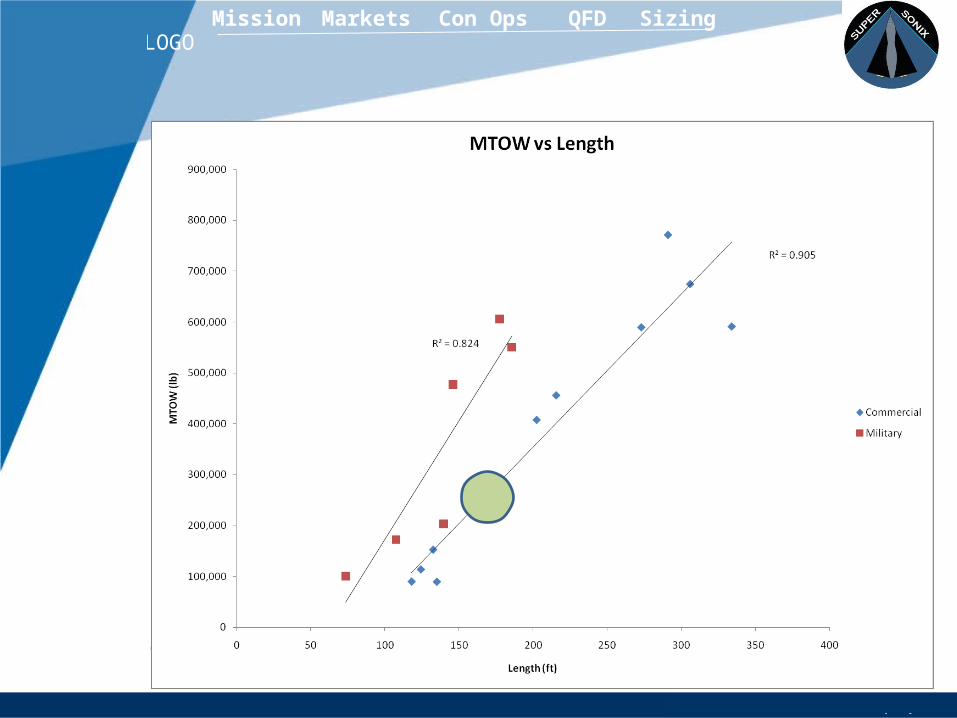
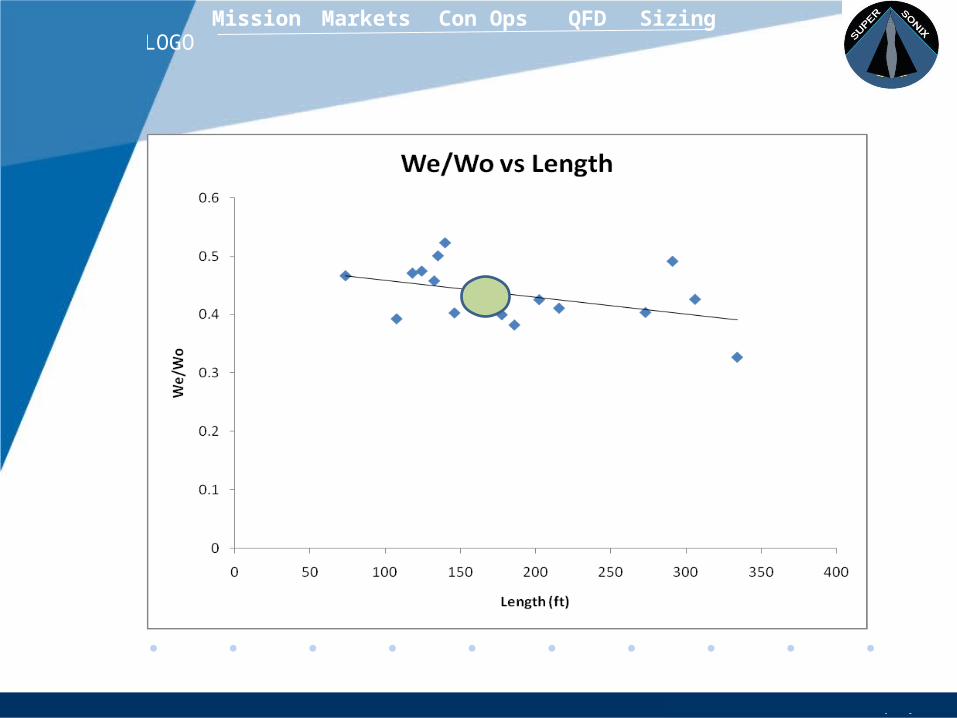
Initial Sizing Process
• Created Database of Commercial and Military Aircraft
• Used Least – squares regression on database– Empty Weight Fraction– MTOW– AR– Wing Loading– Max mach number
• Iterated the sizing equation to find MTOW
SizingMission Markets Con Ops QFD
Page 38
Company LOGO
www.company.com
Aircraft Used
Commercial– Tu 144, 244, 444– Concorde– Boeing 2707-200sst– Lockheed L-2000– Sukoi/ GS s21-G– SAI – QSST– HSCT– Aerion
Military– Boeing B-1B– XB-70 Valkyrie– Tu 160, 22– F – 111D– SR -71
SizingMission Markets Con Ops QFD
Page 39
Company LOGO
www.company.com
Attributes ValuesW0 Design 244746.6 lb
We Design 107283.2 lb
Wf Design 123463.3 lb
Tsl Required 93003.7 lbf
Wing Area 2879.4 ft2 Design Range 4700 nmAR 2.1W0/S 85 lbf/ft2
Tsl/W0 0.38
Cruise Mach # 1.8Maximum Mach # 2.0SFC cruise 0.936 1/hrSupersonic (L/D)max 9.2
Supersonic (L/D)cruise 7.912
Subsonic (L/D)max 10.04
Subsonic (L/D)loiter 10.04
SizingMission Markets Con Ops QFD
Page 40
Company LOGO
www.company.com
SizingMission Markets Con Ops QFD
Page 41
Company LOGO
www.company.com
SizingMission Markets Con Ops QFD
Page 42
Company LOGO
www.company.com
SizingMission Markets Con Ops QFD
Page 43
Company LOGO
www.company.com
SizingMission Markets Con Ops QFD
Page 44
Company LOGO
www.company.com
SizingMission Markets Con Ops QFD
Page 45
Company LOGO
www.company.com
SizingMission Markets Con Ops QFD
Page 46
Company LOGO
www.company.com
Next Steps
• Detailed Sizing• Engine Selection• Fuselage and Cabin Layout• Supersonic Aerodynamic Analysis• Structures and Materials Selection• Aircraft Dynamics and Stability
Page 47
Company LOGO
www.company.com
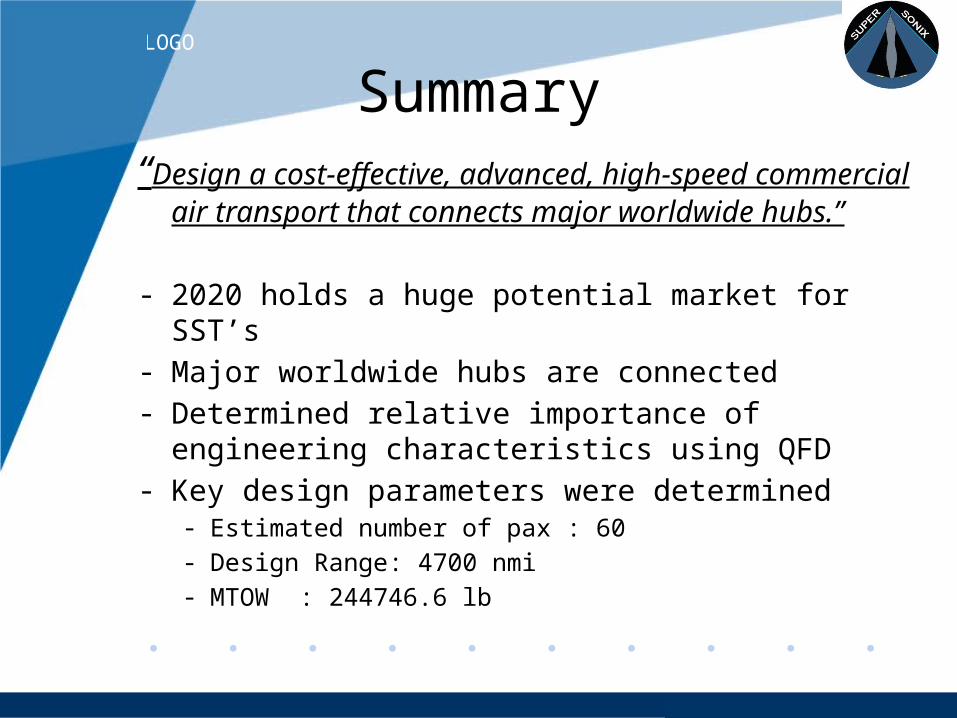
Summary“Design a cost-effective, advanced, high-speed commercial
air transport that connects major worldwide hubs.”
- 2020 holds a huge potential market for SST’s- Major worldwide hubs are connected- Determined relative importance of engineering
characteristics using QFD- Key design parameters were determined
- Estimated number of pax : 60- Design Range : 4700 nmi- MTOW : 244746.6 lb
Page 48
Company LOGO
www.company.com
Questions
Page 49
Company LOGO
www.company.com
References• http://airtravel.about.com/od/basedinnorthamerica/tp/top10na.htm • http://travel.msn.co.nz/article.aspx?id=378404 • http://www.airbus.com/en/corporate/gmf/ • http://www.boeing.com/commercial/cmo/index.html • Model presented in: Dubin, AP; AIAA-1978-1557 • http://www.airbus.com/en/corporate/gmf/ • Copyright © 1996-2009, Karl L. Swartz. All rights reserved. All trademarks
mentioned herein belong to their respective owners. • http://cost.jsc.nasa.gov/airframe.html, http://cost.jsc.nasa.gov/ATECM.html • Liebeck, R. Andrastek, Donald A. Chau, Johnny, Girvin, Raquel. Lyon, Roger.
Advanced Subsonic Airplane Design & Economic Studies. McDonald Douglas Aerospace Long Beach California. April 1995
• http://www.nasa.gov/vision/earth/improvingflight/supersonic_jousting.html