53
Company Overview April 2020

Company Overview
April 2020

This presentation and the presentation materials distributed herewith
include forward-looking statements. All statements, other than
statements of historical facts, that address activities, events or
developments that Shin Kong Financial Holding Company (“Shin Kong
FHC”) expect or anticipate will or may occur in the future (including but
not limited to projections, targets, estimates and business plans) are
forward-looking statements. Shin Kong FHC’s actual results or
developments may differ materially from those indicated by these
forward-looking statements as a result of various factors and
uncertainties, including but not limited to price fluctuations, actual
demand, exchange rate fluctuations, market shares, competition,
changes in legal, financial and regulatory frameworks, international
economic and financial market conditions, political risks, cost estimates
and other risks and factors beyond our control. In addition, Shin Kong
FHC makes the forward-looking statements referred to herein as of today
and undertakes no obligation to update these statements.
Figures of 2018 and 2019 in this presentation and the presentation
materials distributed herewith are audited numbers.
Disclaimer
2

I. SKFH
II. Life Insurance Business
III. Banking Business IV. Securities Business
V. Appendix
• Market opportunities
• SKL Premium
• EV & AV Result
• Capital Adequacy
Agenda
4
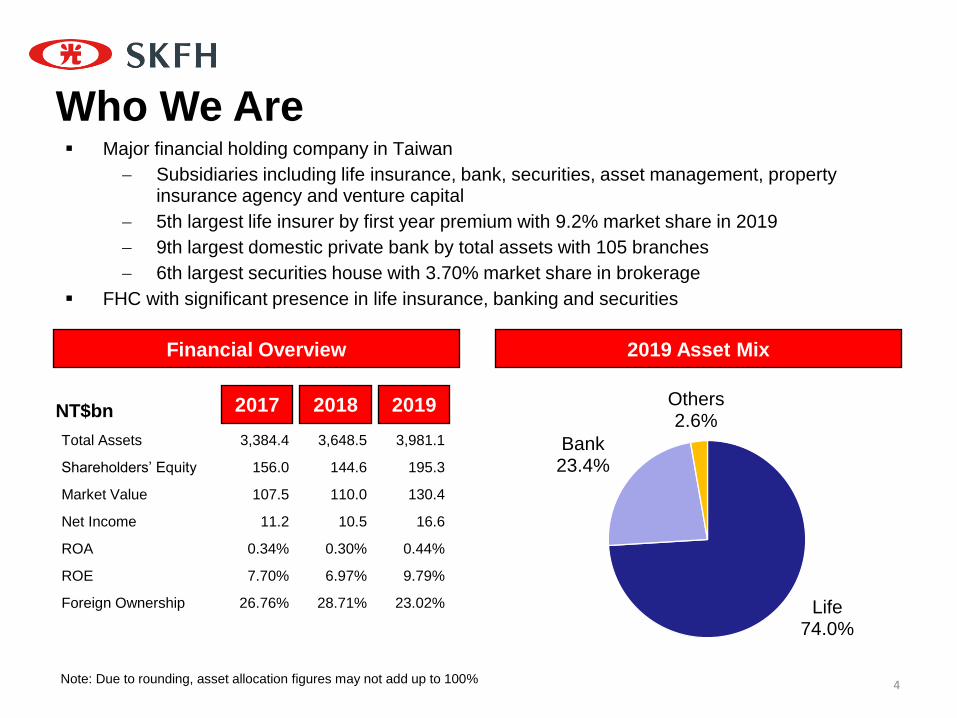
Who We Are
2019 Asset Mix
Life 74.0%
Bank 23.4%
Others 2.6%
Financial Overview
NT$bn 2019 2018 2017
Note: Due to rounding, asset allocation figures may not add up to 100%
Major financial holding company in Taiwan
Subsidiaries including life insurance, bank, securities, asset management, property insurance agency and venture capital
5th largest life insurer by first year premium with 9.2% market share in 2019
9th largest domestic private bank by total assets with 105 branches
6th largest securities house with 3.70% market share in brokerage
FHC with significant presence in life insurance, banking and securities
Total Assets 3,384.4 3,648.5 3,981.1
Shareholders’ Equity 156.0 144.6 195.3
Market Value 107.5 110.0 130.4
Net Income 11.2 10.5 16.6
ROA 0.34% 0.30% 0.44%
ROE 7.70% 6.97% 9.79%
Foreign Ownership 26.76% 28.71% 23.02%

5
Corporate Structure
Integrated Financial Services Platform
Date of Incorporation 7/1963 1/1997 3/1989 9/1992 1/2003 4/2011
Assets (NT$bn) 2,978.3 939.8 104.4 0.8 0.2 1.5
% of Group Assets 74.0% 23.4% 2.6% <0.1% <0.1% <0.1%
Earnings (NT$mn) 9,247 5,523 1,542 44 59 14
Branches/Offices 322 105 47 3 1 1
Market Share 9.2% 2.0% 3.7% 1.9% - -
Shin Kong Venture Capital
Shin Kong Property
Insurance Agency
Shin Kong Investment
Trust
MasterLink Securities
Shin Kong Bank
Shin Kong Life
Shin Kong Financial Holding

6
Seasoned Management Team Acting President, Shin Kong Financial Holding Experiences: Chief Auditor, Shin Kong Financial Holding EVP, Shin Kong Life SVP, Shin Kong Bank
Huang,
Min-Yi
President, Shin Kong Property Insurance Agency
Experiences:
SVP, Shin Kong Life
VP of Multi Channel Dept., Shin Kong Life
President, Shin Kong Bank
Experiences:
SEVP, Ta Chong Bank
SVP, Taishin International Bank
VP, JP Morgan Chase Bank, Taipei Branch
Hsieh,
Charles
Chung,
Chun-Hao
President, Shin Kong Life Experiences: EVP, Shin Kong Life SVP, Shin Kong Life
Tsai,
Jason
Cheng,
Shih-Yi
Chairman & President, Shin Kong Venture Capital Experiences: SVP, Shin Kong Financial Holding Vice CIO, Shin Kong Life Director, MasterLink Securities
President, MasterLink Securities
Experiences:
President, Taiwan International Securities Company
President, Hua Nan Securities
Vice President, MasterLink Securities Lee,
Johnny
President, Shin Kong Investment Trust
Experiences:
President, First Capital Management
Vice President, J.P. Morgan Asset Management
Chen,
Kenny
Vice Chairperson, Shin Kong Financial Holding Vice Chairperson, Shin Kong Life Vice Chairperson, MasterLink Securities Experiences: Chairperson, Taiwan Financial Holdings &
Bank of Taiwan Chairperson, Bankers Association of the
Republic of China Vice Chairperson, Financial Supervisory
Commission R.O.C. (Taiwan)
Lee,
Jih-Chu

7
Strong Track Record of Attracting and Integrating Outside Talent
Chief Information Officer, Shin Kong Financial Holding
Chief Information Officer, Shin Kong Bank
Experiences:
Chief Operation Officer, Cathay United Bank
Chief Information Officer, Cathay United Bank
Chang,
K.T.
Yuan,
James
CIO, Shin Kong Life Experiences: CIO, Everbright Pramerica Fund
Management CIO, ABN AMRO Securities Investment
Trust SVP, Equities, London Life CFA Lin,
Han Wei
Chief Actuary, Shin Kong Life SVP, Actuarial Valuation & Reporting, Actuarial & Planning, and Product Development Department, Shin Kong Life Experiences: Assistant Actuary, New York Life (USA) Director and Actuary, Lincoln Financial
Group (USA) FSA MAAA CFA
Chief Compliance Officer, Shin Kong Financial Holding
Chief Compliance Officer, Shin Kong Life
Experiences:
Attorney at Law
Chief Compliance Officer, Jih Sun Financial Holding & Jih Sun Bank
Chief Legal Officer, TransGlobe Life Insurance Kao,
Joseph
Lin,
Thomas
Chief Risk Officer, Shin Kong Financial Holding
Chief Risk Officer, Shin Kong Life
Experiences:
Vice Chief Risk Officer, Shin Kong Financial Holding
Vice Chief Risk Officer, Shin Kong Life

8
SKFH: Committed to Corporate Sustainability
Environmental
Social
Governance
SKFH has joined the Task Force on Climate Climate-related Financial
Disclosures and closely watches the risks and opportunities related to climate
change
SKFH won the "Energy Saving Elite, Excellence in Innovation" award from the
Bureau of Energy, MOEA, for its 12-year policy of encouraging employees to
dress lightly in summer and set the air conditioning 1° C higher
SKL and SKB completed ISO14064-1 company-wide greenhouse gas
inventories and promoted energy conservation and carbon reduction
measures
SKFH won the CommonWealth Magazine Corporate Citizenship Awards for 6
consecutive years
All new supplier partners of SKFH and its subsidiaries have signed a Supplier
CSR Commitment
SKFH and its subsidiaries took concrete actions to fulfill CSR: In 2018,
NT$104mn was in charitable activities that helped more than 1.7 million people
SKFH ranked in the top 20% of the 5th Corporate Governance Evaluation
SKFH became a constituent stock of the TWSE Corporate Governance 100
SKL, SKB, MasterLink Securities, and SKIT signed a Code of Due Diligence for
Institutional Investors to strengthen the spirit of responsible finance
SKL continued to promote individual and group microinsurance in response to
the Principles for Sustainable Insurance. Such policies have benefited more
than 50,000 people over the years

SKFH – 2019 Overview
9
SKFH recorded consolidated after-tax profit of NT$16.63bn for 2019, up 58.7% YoY;
consolidated comprehensive income reached NT$46.88bn. EPS was NT$1.34. Consolidated
shareholders’ equity increased 35.0% YoY to NT$195.30bn, and book value per share was
NT$15.42.
Subsidiaries’ core business remained robust.
– Shin Kong Life:
Consolidated after-tax profit for 2019 was NT$9.25bn, 75.7% higher YoY.
Consolidated shareholders’ equity increased 63.6% YoY to NT$114.82bn.
FX policies remained strategic focus with sales growing 12.6% YoY to NT$80.53bn,
accounting for 68.9% of total FYP. Cost of liabilities declined 11 bps YoY to 3.97%.
– Shin Kong Bank:
With net fee income and investment income increasing 10.3% and 22.1% YoY,
respectively, consolidated after-tax profit amounted to NT$5.52bn, 5.9% higher YoY.
Asset quality remained solid with NPL ratio at 0.20% and coverage ratio at 636.00%.
– MasterLink Securities:
Consolidated after-tax profit rose 85.7% YoY to NT$1.54bn, driven by strong growth
in proprietary trading.
Brokerage market share was 3.70%, ranked 6th place in industry.

Net income contribution
NT$bn
Note:
(1) SKFH acquired MasterLink Securities as a wholly-owned subsidiary on October 1, 2018. Prior to Q4 2018, profit of MasterLink Securities was not fully recognized
(2) Includes other income of SKFH and income taxes
(3) Net income attributable to SKFH
(4) Audited numbers
Subsidiaries 2018 2019 YoY Growth
Shin Kong Life 5.21 9.19 76.4%
Shin Kong Bank 5.22 5.52 5.9%
MasterLink Securities (1) 0.17 1.54 814.3%
Shin Kong Investment Trust 0.02 0.04 133.4%
Shin Kong Venture Capital International 0.06 0.01 -77.7%
Shin Kong Property Insurance Agency 0.06 0.06 3.7%
Others (2) -0.99 0.20 -
Net income (3) 9.75 16.56 69.8%
Net Income – 2019
10

I. SKFH
II. Life Insurance Business
III. Banking Business IV. Securities Business
V. Appendix
• Market opportunities
• SKL Premium
• EV & AV Result
• Capital Adequacy
Agenda

12
Traditional 83.0%
Investment-linked 1.9%
PA, Health &
Group 14.8%
Interest-sensitive 0.3%
Shin Kong Life
2019
2019 Total Premium Written Financial Overview
NT$bn 2018 2017
Total Premium Written: NT$318.2bn
5th largest life insurer by first year premium in Taiwan with 9.2% market share and
more than 3 million customers in 2019
Strong distribution network through around 8,400 agents, 322 sales offices and
bancassurance relationships with 58 financial institutions
Offers a wide range of life insurance products, including traditional life, accident
and health, interest-sensitive and investment-linked products
Total Premium 281.0 307.1 318.2
Net Income 6.97 5.26 9.25
Total Assets 2,496.7 2,707.4 2,978.3
Shareholders’ Equity 90.8 70.2 114.8
ROE 8.49% 6.54% 10.00%
ROA 0.29% 0.20% 0.33%

13
Shin Kong Life Market Share
206.3
201.1
164.6
124.1
116.9
83.0
79.2
52.7
33.9
32.0
Fubon Life
Cathay Life
Nan Shan Life
China Life
Shin Kong Life
Taiwan Life
BNP Paribas Life
Allianz Life
Mercuries Life
Farglory Life
FYP of Top 10 Players – 2019 Shin Kong FYP Market Share Over Time
Source: Life Insurance Association of R.O.C.
NT$bn %
6.6%
9.0% 8.8% 9.2% 9.2%
2015 2016 2017 2018 2019

Boosted by higher recurring income and lower cost of liabilities, SKL posted
consolidated after-tax profit of NT$9.25bn for 2019, 75.7% higher YoY;
consolidated total comprehensive income reached NT$38.36bn. Consolidated
shareholders’ equity increased 63.6% YoY to NT$114.82bn.
FYP for 2019 was NT$116.86bn, representing market share of 9.2%. Driven
by strong growth in FX policies, VNB increased 2.0% YoY.
FYP of FX polices for 2019 grew 12.6% YoY to NT$80.53bn, accounting for
68.9% of total FYP.
Cost of liabilities decreased 11 bps YoY from 4.08% to 3.97%, better than
expectation.
With growing portfolio of low-beta, high-dividend yield stocks, etc., full-year
domestic and foreign cash dividend income amounted to NT$16.34bn, up by
NT$2.36bn from previous year.
Investment return for 2019 was 4.20%, 21 bps higher YoY; recurring yield
before hedging rose 6 bps YoY to 4.17%.
Shin Kong Life – 2019 Overview
14

5.8 5.9
2018 2019
NT$bn
Comments
FYP for 2019 decreased 7.7% YoY to NT$116.86bn. Driven by strong growth in FX policies, VNB grew 2.0% YoY (based on actuarial assumptions for 2018 EV)
FX policies remained strategic focus in 2019. Sales rose 12.6% YoY to NT$80.53bn, accounting for 68.9% of total FYP
Traditional products accounted for largest share of total FYP at 91.1%, driving down cost of liabilities to 3.97% for 2019, 11 bps lower YoY
FX policies and protection products to be actively promoted in 2020 to control hedging cost and stabilize VNB
PA, Health and Group (2)
Investment-linked Interest-sensitive
Traditional (1)
First Year Premium – 2019
15
2% -9%
Note: (1) Includes interest-sensitive life insurance (2) Long-term disability policies are classified as health insurance
7% 114%
2018 2019
126.7 116.9
-8%
2018 2019
117.1 106.5
3.3 3.5
2018 2019
0.5
1.0
2018 2019

Cost of Liabilities (annual) Cost of Liabilities (quarterly)
Cost of Liabilities
16
4.51%
4.37%
4.23%
4.08%
3.97%
2015 2016 2017 2018 2019
4.08% 4.06%
4.04%
4.00% 3.97%
2018 Q1 19 1H 19 9M 19 2019

Persistency Ratio
17
25 Month Persistency 13 Month Persistency
97.7% 97.8% 97.9%
Q2 19 Q3 19 Q4 19
97.0% 96.5% 96.3%
Q2 19 Q3 19 Q4 19

2.3% 7.8%
10.7%
9.4% 5.3%
8.2%
66.1% 61.7%
3.7% 1.9%
4.3% 4.0% 2.1% 1.5% 5.6% 5.4%
2018 2019
NT$bn
Total Investment
Foreign Fixed Income
Real Estate
Domestic Equities
Foreign Equities
Domestic Fixed Income
Policy Loans
Mortgage & Corp. Loans
Cash
Note:
(1) Includes capital gains and FX hedging cost
(2) Includes international bonds listed in domestic OTC
(3) Due to rounding, asset allocation figures may not add up to 100%
Investment
return 3.7% 3.8% 3.9% 4.0% 4.2%
Total Assets
(1)
(3) (3)
CAGR
9.0%
2,608.5 2,873.4
Investment Portfolio
18
2,113 2,320
2,497 2,707
2,978
2015 2016 2017 2018 2019
(2)

1.3% 0.8%
21.5% 22.9%
31.7% 28.9%
45.5% 47.3%
2018 2019
Overseas Fixed Income Portfolio
Corporate Bonds
Government Bonds
Others
NT$bn
Note: Due to rounding, asset allocation figures may not add up to 100%
International Bonds
Listed in Domestic
OTC
Overseas Fixed Income
19
1,723.4 1,773.4
Overseas Fixed Income by Region
Asia & Others
Europe
North America
Overseas fixed income position mainly deployed in
USD-denominated bonds
Overseas fixed incomes mainly deployed in North
America and Europe, accounting for 59.3%
SKL holds corporate bonds with stable credit quality
across sectors, including communication, consumer,
utilities and financials
Comments
32.9% 32.9%
27.7% 26.4%
39.4% 40.7%
2018 2019

3.90% 3.98%
4.11% 4.17%
2016 2017 2018 2019
Recurring Yield Before Hedging NT$bn
Real Estate Rental Income
Domestic and Foreign Cash Dividend
NT$bn
Recurring Income
20
7.8 10.5
14.0 16.3
2016 2017 2018 2019
3.8 3.8 3.9 4.2
2016 2017 2018 2019

49.0%
25.4%
2.7%
22.9% Equity & fund
Mix of Hedging Strategies Used
Total=NT$1,952.8bn
CS and
NDF (1)
Note:
(1) Currency swaps and non-delivery forwards accounted for
69% and 31%, respectively
(2) Due to rounding, figures may not add up to 100%
FX policy position
USD & other
currencies
Hedging Strategy
21
Hedging Cost
FX Volatility Reserve
3.1 2.6
4.7
2.1
2016 2017 2018 2019
0.87%
1.55% 1.72% 1.73%
2016 2017 2018 2019
NT$bn

Strong ALM Discipline
Well-diversified Portfolio
Cost-effective Currency Hedging
Enhance Investment Risk Management
Sell policies with positive CSM to prepare for IFRS 17 adoption
Develop Strategic Asset Allocation based on liability profile and capital
budget
Diversification by asset class (equity, credit, currency, commodity, real
estate)
Achieve diversification and yield pick-up through overseas investments.
Continue to deploy in investment grade bonds to grow interest income
Invest in low beta, high-dividend yield stocks classified as FVOCI, etc. for
cash dividend income
Consider current situations and characteristics of asset and liability to
effectively manage overall investment risks through stringent SAA and
TAA plans
Monitor market activities on a daily basis as well as strictly manage
market, credit and business risks to cope rapidly with changes in financial
markets
Promote FX policies to control hedging cost and maintain recurring
income
Dynamically adjust FX hedging ratio
Investment Strategy
22

Shin Kong Life – 2020 Outlook
23
Focus on protection and regular-paid products to accumulate fundamental
incomes and create contractual service margin (CSM). Target cost of liabilities
5~10 bps lower than 2019.
Promote sales of FX policies to gain stable interest spread; share of FX policies
over total reserve targeted to reach 20% in 2020.
Enhance mobile apps to elevate overall productivity. Utilize data analysis models
and precise marketing to secure target clients and drive up repurchase rate of
quality customers.
Continue to invest in fixed incomes, high-dividend yield stocks, and prime real
estate to stabilize recurring income.
Promote digital self-service and e-policies to achieve double-digit growth in online
membership. Continue to upgrade AI customer support chatbot to improve service
efficiency and customer satisfaction.
Reduce hedging cost by allocating funds acquired from FX policies in assets
denominated in original foreign currencies and flexibly adjusting hedging ratio
through proxy baskets. Medium/long-term target of traditional hedges ranges
between 70%~85%.

I. SKFH
II. Life Insurance Business
III. Banking Business IV. Securities Business
V. Appendix
• Market opportunities
• SKL Premium
• EV & AV Result
• Capital Adequacy
Agenda

25
Shin Kong Bank
2019 Loan Breakdown Financial Overview
NT$bn 2019 2018 2017 Credit Cards 0.3%
Corporate
40.3% Mortgage
44.4%
Car Loans 0.9%
Other Consumer Loans 5.5%
Unsecured Loans 8.6%
Total Loan: NT$605.9bn (1)
9th largest domestic private bank by total assets in Taiwan
Over 3 million customers and 105 branches with 51 located in the Greater Taipei area and 1 in Hong Kong
Offers a wide range of banking products including credit cards, mortgages, car loans, deposits, other consumer finance and corporate products
Established a representative office in Ho Chi Minh City, Vietnam in 2007
Hong Kong branch was officially opened for operations in May, 2011
Set up a representative office in Yangon, Myanmar in September, 2015
Total Loans (1) 534.8 567.1 605.9
Total Deposits 712.3 741.7 815.0
Net Income 4.06 5.22 5.52
Total Assets 812.5 871.1 939.8
Shareholders’ Equity 52.5 59.5 65.1
Note:
(1) lnclude credit cards revolving balance but excludes overdue receivables

Driven by net fee income and investment income growing 10.3% and
22.1% YoY, respectively, consolidated net income for 2019 was
NT$5.52bn, up 5.9% YoY.
Wealth management income for 2019 was NT$2.54bn, up 17.7% YoY.
Momentum contributed by mutual funds and overseas securities, with
fee income up 35.4% and 38.0% YoY, respectively.
Contributed by strong domestic corporate loan growth, loan balance
grew 3.4% QoQ to NT$605.85bn. Total loan growth for 2019 was
6.8%, surpassing expectations.
Due to market competition and US Fed’s rate cut, NIS and NIM for Q4
2019 lowered 3 bps and 4 bps QoQ, respectively, to 1.77% and
1.39%.
Asset quality remained solid. NPL and coverage ratios were 0.20%
and 636.00%, respectively, better than 2018.
Shin Kong Bank – 2019 Overview
26

Comments
YTD Growth NT$bn
Note: Due to rounding, loan mix may not add up to 100%
Loan balance as of Q4 2019 was
NT$605.85bn, up 6.8% YoY
Corporate loan growth was
mainly driven by domestic large
corporate and overseas
syndicated loans, up 21.4% and
13.6% YoY, respectively
Mortgage and unsecured loans
grew 6.4% and 5.7% YoY,
respectively, driving consumer
loans up 6.0% YoY
Total -Unsecured
-Car Loans
-Credit Cards
-Other
Consumer
Loans
-Mortgages
-Corporate
Loan Mix
27
40.3% 40.1% 40.8%
44.4% 44.6% 44.2%
5.5% 5.4% 5.3% 0.3% 0.3% 0.3% 0.9% 0.9% 0.9%
8.6% 8.7% 8.5%
2018 9M 2019 2019
567 586 606 6.8%
5.7%
9.0%
-3.8%
3.0%
6.4%
8.1%

Net Interest Spread
Net Interest Margin
Comments
NIM and NIS for 2019 were
1.44% and 1.82%, respectively
Due to market competition and
rate cuts, NIM and NIS
expected to be lower than level
of 2019
SKB will continue to:
– Increase demand deposits
to lower cost of funds
– Enhance fund utilization to
stabilize interest spread
– Continuously build up
foreign currency deposits to
expand wealth management
and overseas business
Interest Income
28
1.49%
1.43% 1.43% 1.39%
Q1 2019 Q2 2019 Q3 2019 Q4 2019
1.86% 1.82%
1.80% 1.77%
Q1 2019 Q2 2019 Q3 2019 Q4 2019

50.8%
23.6%
10.9%
14.8%
29
Fee Income
Fee Income Breakdown
Loan
YoY Comparison
NT$mn
Wealth Management
Credit Card Loan FX, Trust & Others
1,978
1,064
504
695
2,357
1,093
506
686
19%
2018 2019 2018 2019 2018 2019 2018 2019
Total=NT$4,642mn
FX, Trust &
Others
Wealth
Management
Credit Card
Note: Due to rounding, fee income breakdown may not add up to 100%

Wealth management income for 2019 was
NT$2.54bn, up 17.7% YoY. Momentum contributed
by mutual funds and overseas securities, with fee
income up 35.4% and 38.0% YoY, respectively
Investment products expected to remain sales
focus in 2020, along with stable momentum of
regular premium and FX insurance policies
Intelligent robo-advisory launched and online
marketing campaigns conducted for new funds and
client base
Wealth Management Center
Wealth Management
30
Wealth Management Income Breakdown
Overseas
Securities
Total =
Mutual funds
Bancassurance
NT$mn
Others
Note:
(1) Including income from structured products and foreign exchange transactions
(2) Due to rounding, WM income breakdown may not add up to 100%
50.6% 45.5%
20.4% 23.5%
19.7% 23.1%
9.2% 7.9%
2018 2019
2,161 2,543
(1)

385.3 440.5
Q3 2019 Q4 2019
NPL Ratio New NPL Generation
NT$mn
Coverage Ratio New NPL of NT$441mn generated in Q4 2019,
similar to previous quarter
NPL ratio for Q4 2019 was 0.20%, and coverage
ratio was 636.00%. SKB will continue to monitor
asset quality
0.22% 0.21% 0.20% 0.20%
Q1 2019 Q2 2019 Q3 2019 Q4 2019
599.73% 600.29% 635.07% 636.00%
Q1 2019 Q2 2019 Q3 2019 Q4 2019
Asset Quality
31

Continue to expand consumer lending while promoting corporate and
syndicated loans, with stringent credit risk control, to sustain loan growth
momentum.
Actively attract new funds and expand client base, along with sales focus
on investment products and insurance policies, to drive up wealth
management income.
Increase demand deposit and loan-to-deposit ratios in order to control cost
of funds and enhance fund utilization.
Enhance digital finance by promoting online marketing campaigns and
upgrading mobile payment services to increase fee income related to
mobile and internet banking; reach double-digit growth in digital accounts.
Hong Kong branch will stably develop corporate lending, as well as
strengthen investment and wealth management business to increase
offshore earnings.
Endeavor to obtain approval to establish branch in Binh Duong, Vietnam to
cultivate Asia-Pacific market.
Shin Kong Bank – 2020 Outlook
32

I. SKFH
II. Life Insurance Business
III. Banking Business IV. Securities Business
V. Appendix
• Market opportunities
• SKL Premium
• EV & AV Result
• Capital Adequacy
Agenda

34
MasterLink Securities
2019 Revenue Breakdown Financial Overview
NT$bn 2019 2018 2017
Brokerage market share was 3.70% in 2019, ranked 6th place in industry
Corporate bond underwriting amount was NT$53.17bn, ranked second place in industry
718 brokers through 47 local branches and 6 overseas offices to serve around 1 million clients
Stable capital structure with a long-term rating of twA and a short-term rating of twA-1 from Taiwan Ratings Corp.
Net Income 0.94 0.83 1.54
Total Assets 95.6 99.9 104.4
Shareholders’ Equity 21.5 22.9 24.4
ROE 4.43% 3.74% 6.52%
ROA 1.04% 0.85% 1.51%
Revenue: NT$6.02bn
Brokerage 50.8%
Others 2.6%
Prop. Trading 43.0%
Underwriting 3.7%
Note: Due to rounding, revenue breakdown may not add up to 100%

35
MasterLink Securities – 2019 Overview
2.2% 2.6% 4.0% 3.7%
27.6% 43.0%
66.2% 50.8%
2018 2019
Operating Revenue Breakdown
Underwriting
Total =
Prop. Trading
Others
Brokerage
5,085 6,020
NT$mn
Note: Due to rounding, revenue breakdown may not add up to 100%
Market Share
Brokerage Margin Loans
Boosted by strong growth in proprietary trading,
consolidated after-tax profit for 2019 rose 85.7%
YoY to NT$1.54bn
Proprietary trading income grew 84.0% YoY to
NT$2.59bn, driven by disposal gains from
equities and fixed incomes, up 218.9% YoY
Brokerage market share was 3.70%, ranked 6th
place in industry. Due to a 6.0% YoY decline in
average daily turnover, brokerage income
decreased NT$0.31bn YoY to NT$3.06bn
2018 2019
3.78% 3.70%
2018 2019
5.23% 5.34%

36
MasterLink Securities – 2020 Outlook
Brokerage and wealth management business
Strengthen functions of trading platform to handle continuous trading and odd-
lot intraday trading for target clients.
Promote electronic platform for overseas securities trading and roll out robo-
advisor services.
Introduce featured products (such as overseas bonds) to partner channels.
Enhance online counter-free services and launch AI customer support chatbot.
Underwriting business
Leverage group resources to earn decent underwriting deals and opportunities
for financial consulting.
Proprietary trading business
Develop quantitative models and diverse products as well as refine current
trading strategies.
Capitalize on market trends to drive up capital gains from fixed incomes.

I. SKFH
II. Life Insurance Business
III. Banking Business IV. Securities Business
V. Appendix
• Market opportunities
• SKL Premium
• EV & AV Result
• Capital Adequacy
Agenda

38
52 59
9 4 14
33 25
4
1,203.2 1,287.9
1,477.2 1,601.4
1,740.3 1,862.9
2,159.5 2,131.6 2191.9
Source: Insurance Institute
Life FYP
NT$bn
Growth
Percent
Life renewal premium
NT$bn
Growth
Percent
-0.8
8.7 7.0 15.9
New business breakdown
%
New business channel mix
%
2011 2019
Interest-sensitive
Investment-linked
Accident & health
Traditional life
2011 2019
Bancassurance
Traditional agents
-1.3
Insurance opportunity:
Changes in products and channels
2.8
-7.6 -14.4
5.0
19.6
7.0
Others
-7.1
14.7
39 38
57 54
4 8
995.1
1,190.4 1,106.3 1,169.7 1,186.3
1,270.5 1,260.7 1,379.9
1,274.7
5.7
8.4
1.4 7.1
14 2011 12 13 15 18
16 17 2019
14 2011 12 13 15 18
16 17 2019
9.5

39
Insurance opportunity:
Increasing penetration and density
7.6%
8.1%
8.3%
10.3%
16.8%
17.5%
Denmark
Finland
UK
South Africa
Hong Kong
Taiwan
Life Insurance Premiums/GDP, %
Source: Swiss Re, Sigma No.3/2019
Rank Rank
1
5
2
3
4
6
1
5
2
3
4
6 3,944
4,019
4,320
4,356
4,590
7,066
Singapore
Finland
Taiwan
Ireland
Denmark
Hong Kong
Life Insurance Expense Per Capita, US$

I. SKFH
II. Life Insurance Business
III. Banking Business IV. Securities Business
V. Appendix
• Market opportunities
• SKL Premium
• EV & AV Result
• Capital Adequacy
Agenda

NT$bn
2019 FYP Single
Premium
Regular
Premium
Flexible
Payment Total
Traditional 39.24 67.23 106.47
Investment-linked
VUL / VA 2.11 0.06 1.35 3.52
Structured note
Interest sensitive
Annuity / UL 0.51 0.49 1.00
PA, health and others
5.86 5.86
Total 41.86 73.16 1.84 116.86
Share 35.8% 62.6% 1.6% 100.0%
Note: Total may not add up exactly due to rounding
SP / RP Breakdown
41

253.7 264.1
6.0 6.0 0.5 1.0
46.9 47.1
2018 2019
Growth
Total
Driven by renewal premium up 11.6% YoY, total premium increased 3.6% YoY
Total premium of FX
policies for 2019
reached NT$137.29bn,
29.5% higher YoY
NT$bn
PA, Health & Group (1)
Interest Sensitive
Investment Linked
Traditional
Comments
3.6%
Market Share = 9.2%
Total Premium – 2019
42
318.2 307.1
0.4%
113.6% 0.9%
4.1%
Note: (1) Long-term disability policies are classified as health insurance (2) Total may not add up exactly due to rounding

43
Agent Number and Productivity by Tenure
1,054 660
938 623
666 487
3,981 8,409
Less than 6Months
6–12 Months
1–2 Years 2–3 Years 3–5 Years 5–7 Years Over 7Years
Total
2.14 3.80 4.17 4.24 5.08 5.46 7.45
Source: Shin Kong data
Average FYP Sold (NT$mn)
2019

I. SKFH
II. Life Insurance Business
III. Banking Business IV. Securities Business
V. Appendix
• Market opportunities
• SKL Premium
• EV & AV Result
• Capital Adequacy
Agenda

45
SKL – EV & AV Results Unit: NT$bn
2017.12 2018.12 YoY growth
In-force business investment yield
NTD 3.83%~5.10% USD 4.45%~5.62%
Equivalent investment yield: 4.42%
(rolling over to 2018 : 4.48%)
NTD 3.47%~5.00% USD 4.70%~5.60%
Equivalent investment yield: 4.30%
--
Future one year’s new business investment yield
NTD 3.50%~5.10% USD 4.43%~5.62%
NTD 3.34%~5.00% USD 4.43%~5.60%
--
Adjusted NAV 167.2 151.6 -9%
VIF 160.5 176.2 10%
COC 74.1 81.5 10%
EV 253.6 246.3 -3%
EV / per share (SKL / SKFH) 43.7 / 24.9 42.5 / 20.1 --
V1NB 23.0 24.1 5%
AV – 5 years NB 343.9 341.0 -1%
5-year AV / per share (SKL / SKFH) 59.3 / 33.7 58.8 / 27.9 --
AV – 20 years NB 452.2 454.7 1%
20-year AV / per share (SKL / SKFH) 78.0 / 44.4 78.4 / 37.2 --
Note: Based on SKL’s outstanding shares of 5.80bn as of the end of 2018 (5.80bn as of the end of 2017)
Based on SKFH’s outstanding shares of 12.23bn as of the end of 2018 (10.19bn as of the end of 2017)
Considering that Statutory Net Worth of Q1 2019 increased to NT$97.3bn, EV in 2018 would
have been no lower than EV in 2017

46
Note: Figures may not add up exactly due to rounding
Unit: NT$bn Valn Date: 31 Dec. 2018 Solvency Basis: 200% RBC
Base Case Scenario
All else equal except VIF
NTD 3.47%~5.00% USD 4.70%~5.60%
V1NB NTD 3.34%~5.00% USD 4.43%~5.60%
RDR 10.5%
All else equal except
Inv Return -0.25%
Inv Return +0.25%
RDR -1.0%
RDR +1.0%
Adjusted NAV 151.6 151.6 151.6 151.6 151.6
VIF 125.3 225.5 176.2 205.0 153.0
Cost of Capital (COC) 84.0 79.0 81.5 76.2 85.8
EV after COC 192.9 298.1 246.3 280.4 218.7
V1NB after COC 22.9 25.2 24.1 27.6 21.2
AV (5 years NB) 283.0 397.4 341.0 388.9 302.1
AV (20 years NB) 391.1 516.5 454.7 519.0 402.0
SKL – Estimate of Embedded / Appraisal Value

47
Changes between 31 Dec. 2017 and 31 Dec. 2018
broken down by components
SKL – Analysis of Change in Net Worth
Note:
(1) Including remeasurement of defined benefit plans and other items
(2) Figures may not add up exactly due to rounding
NT$bn
90.5
69.8
-25.9
+5.2 +0.1
Statutory Net Worthas of 31 Dec.
2017
The impact from IFRS9and Unrealized Gainson Financial Assets
2018Profits
Others Statutory Net Worthas of 31 Dec.
2018
(1)

48
Adjustments to Statutory Net Worth at 31 Dec. 2018
SKL – Adjusted NAV
NT$bn
Note:
(1) Including foreign exchange volatility reserve and other items
(2) Figures may not add up exactly due to rounding
69.8
151.6 +71.4
+5.6 +4.7
Statutory Net Worthas of 31 Dec.
2018
UnrealizedGains onProperty
Special Reserveof Unrealized Gains
on Property
OtherAdjustments
Adjusted NAVas of 31 Dec.
2018
(1)

49
Changes between 31 Dec. 2017 and 31 Dec. 2018
broken down by components
SKL – Analysis of Change in VIF
NT$bn
Note: Figures may not add up exactly due to rounding
176.2
160.5 +0.3
+15.2 +1.3 -5.6
-27.5 +32.1
VIF as of 31Dec. 2017
ModelChanges
Roll-forwardof Time
PortfolioChanges
Non-EconomicAssumption
Changes
EconomicAssumption
Changes
NewBusiness
VIF as of 31Dec. 2018

50
Changes between 31 Dec. 2017 and 31 Dec. 2018
broken down by components
SKL – Analysis of Change in V1NB
NT$bn
Note: Figures may not add up exactly due to rounding
24.1 23.0
+3.2 -1.6 -0.8 +0.2
V1NB as of 31Dec. 2017
Sales Volume Product Mix Non-EconomicAssumption
Changes
EconomicAssumption
Changes
V1NB as of 31Dec. 2018

I. SKFH
II. Life Insurance Business
III. Banking Business IV. Securities Business
V. Appendix
• Market opportunities
• SKL Premium
• EV & AV Result
• Capital Adequacy
Agenda

Capital Adequacy
52
279.3% 257.4%
227.4% 220.8%
2016 2017 2018 2019
CAR of SKFH RBC of Shin Kong Life
BIS of Shin Kong Bank
9.9% 10.4% 11.5% 11.8%
2.8% 2.6% 2.9% 2.6%
2016 2017 2018 2019
Tier 2
Tier 1
BIS 14.4%
12.7% 13.1%
124.4% 117.7% 113.7% 111.1%
2016 2017 2018 2019
383.0% 349.8%
392.0% 371.9%
2016 2017 2018 2019
BIS of MasterLink Securities
14.4%


