24
COMPANY OVERVIEW TOM MCCALLUM VP, INVESTOR RELATIONS January 12, 2016
COMPANY OVERVIEW
TOM MCCALLUMVP, INVESTOR RELATIONS
January 12, 2016
SAFE HARBOR FORWARD-LOOKING STATEMENTSCertain statements contained in this presentation may constitute "forward-looking statements" within the meaning of the Private Securities Litigation Reform Act of 1995. Forward-looking statements provide current expectations of future events based on certain assumptions and include any statement that does not directly relate to any historical or current fact. Actual results may differ materially from those indicated by such forward-looking statements as a result of various important factors, including: risks related to the ability of the Company to compete effectively; the ability to deliver and stimulate demand for new products and technological innovations on a timely basis; delays or reductions in information technology spending; the effects of industry consolidation; the integration of acquisitions and the ability to market successfully acquired technologies and products; uncertainty and adverse results in litigation and related settlements; the inability to adequately protect Company intellectual property and the potential for infringement or breach of license claims of or relating to third party intellectual property; risks related to data and information security vulnerabilities; ineffective management of, and control over, the Company's growth and international operations; fluctuations in exchange rates; and changes in and a dependence on key personnel, as well as other factors contained in our most recent Quarterly Report on Form 10-Q (copies of which may be accessed through the Securities and Exchange Commission's website at www.sec.gov), including those found therein under the captions "Risk Factors" and "Management's Discussion and Analysis of Financial Condition and Results of Operations." In addition to these factors, actual future performance, outcomes, and results may differ materially because of more general factors including (without limitation) general industry and market conditions and growth rates, economic and political conditions, governmental and public policy changes and the impact of natural disasters such as earthquakes and floods. The forward-looking statements included in this presentation represent the Company's views as of the date of this presentation and these views could change. However, while the Company may elect to update these forward-looking statements at some point in the future, the Company specifically disclaims any obligation to do so. These forward-looking statements should not be relied upon as representing the Company's views as of any date subsequent to the date of this presentation, January 12, 2016.
3
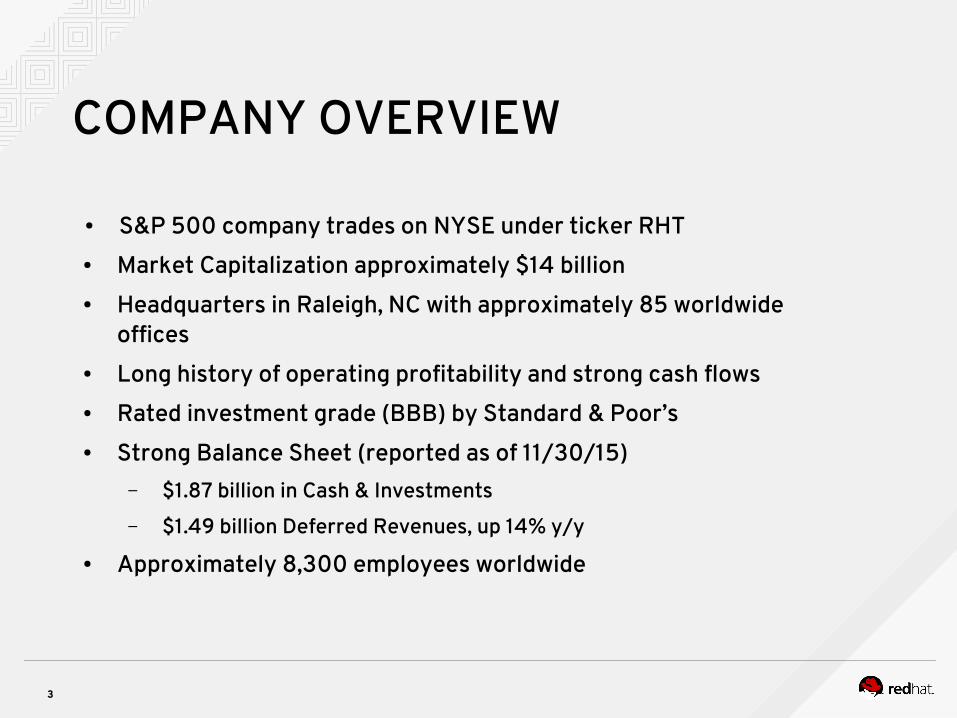
COMPANY OVERVIEW
● S&P 500 company trades on NYSE under ticker RHT● Market Capitalization approximately $14 billion● Headquarters in Raleigh, NC with approximately 85 worldwide
offices● Long history of operating profitability and strong cash flows● Rated investment grade (BBB) by Standard & Poor’s● Strong Balance Sheet (reported as of 11/30/15)
– $1.87 billion in Cash & Investments
– $1.49 billion Deferred Revenues, up 14% y/y
● Approximately 8,300 employees worldwide
4
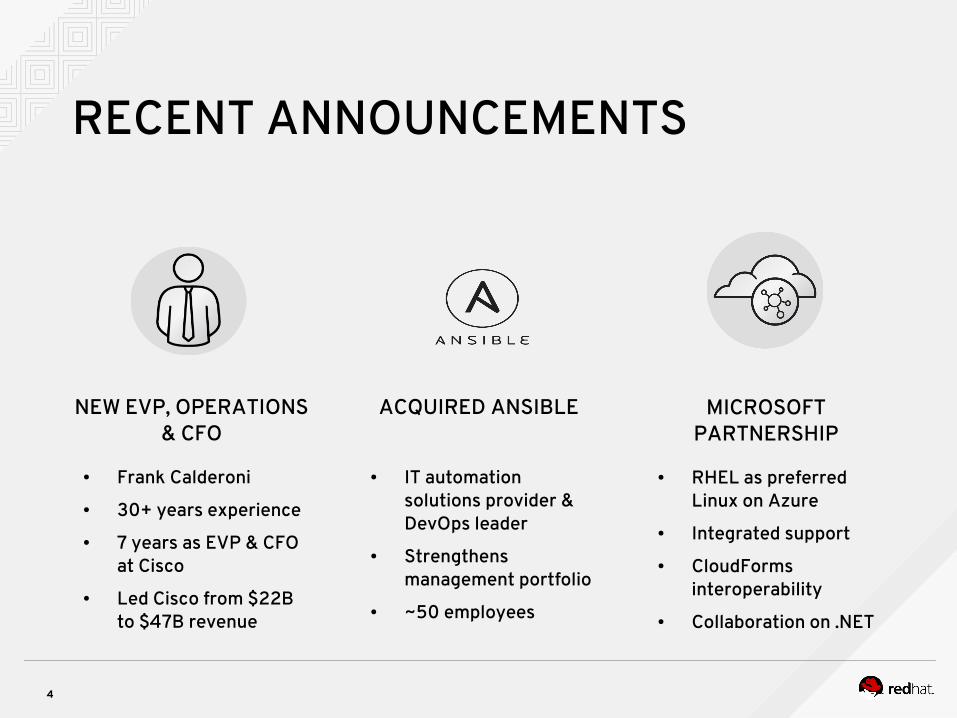
RECENT ANNOUNCEMENTS
ACQUIRED ANSIBLE
● IT automation solutions provider & DevOps leader
● Strengthens management portfolio
● ~50 employees
NEW EVP, OPERATIONS & CFO
● Frank Calderoni● 30+ years experience● 7 years as EVP & CFO
at Cisco● Led Cisco from $22B
to $47B revenue
MICROSOFT PARTNERSHIP
● RHEL as preferred Linux on Azure
● Integrated support● CloudForms
interoperability● Collaboration on .NET
TECHNOLOGY STRATEGY
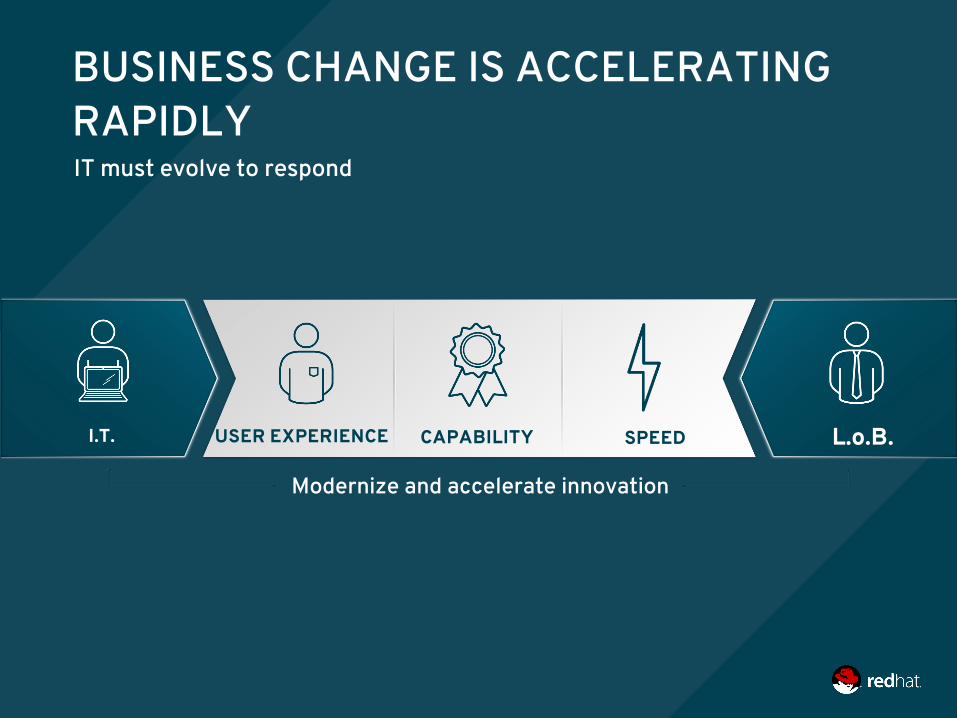
I.T. USER EXPERIENCE CAPABILITY SPEED L.o.B.
Modernize and accelerate innovation
BUSINESS CHANGE IS ACCELERATING RAPIDLYIT must evolve to respond
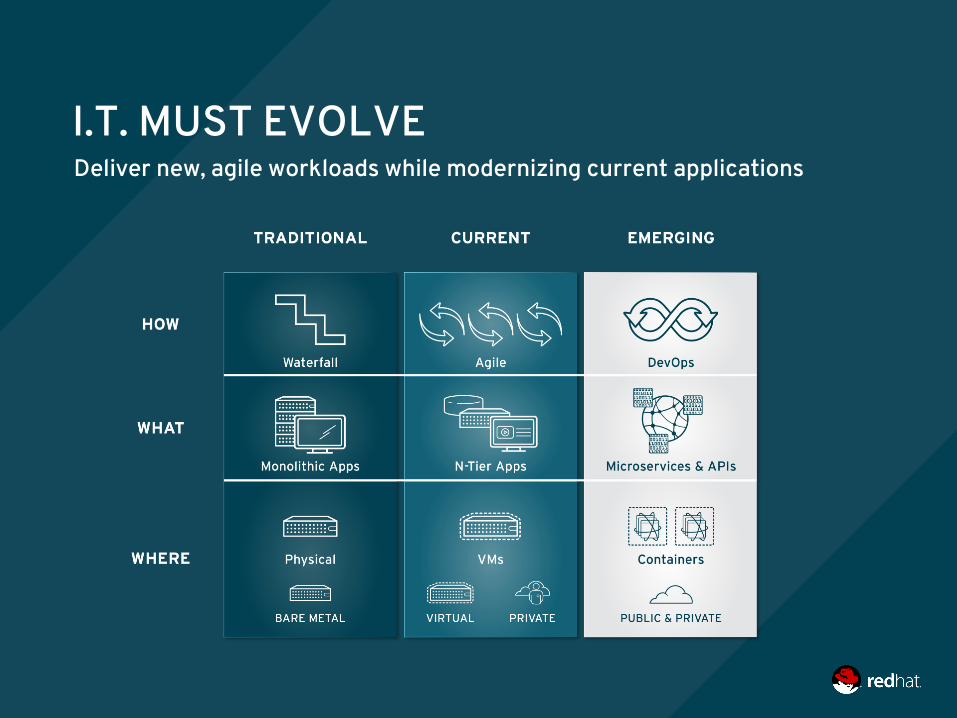
I.T. MUST EVOLVEDeliver new, agile workloads while modernizing current applications
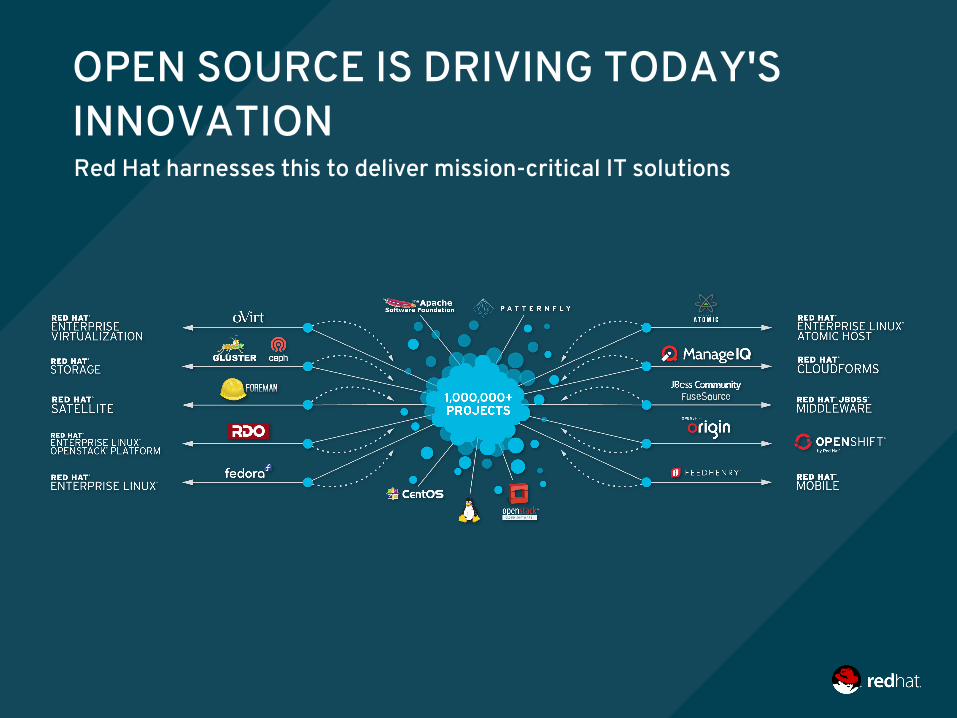
OPEN SOURCE IS DRIVING TODAY'S INNOVATIONRed Hat harnesses this to deliver mission-critical IT solutions

RED HAT'S VISION: OPEN HYBRID CLOUDCommon application services
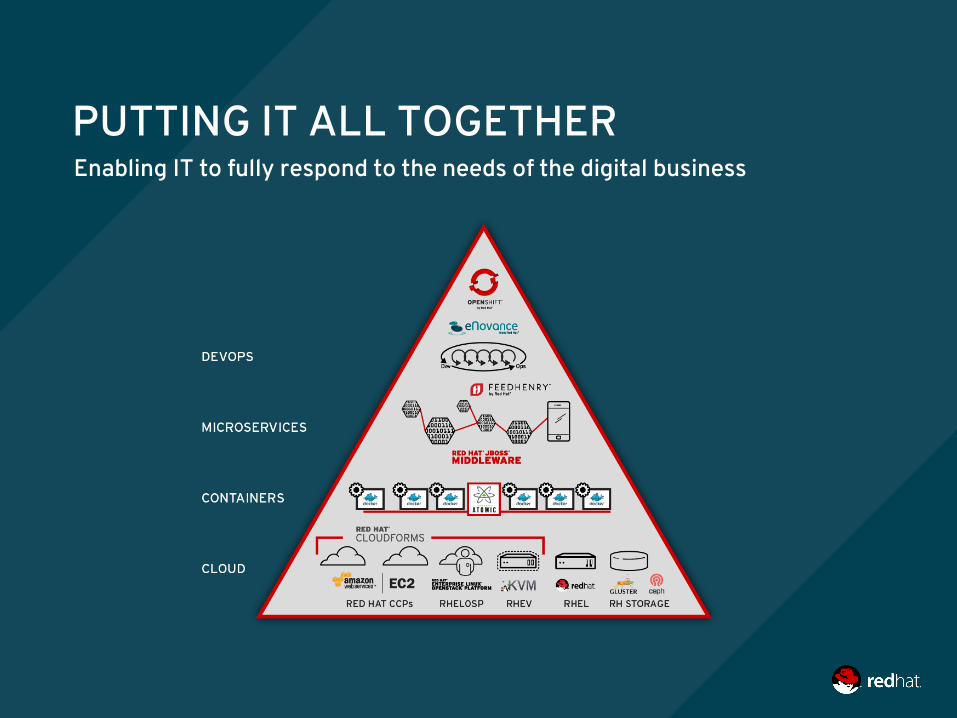
PUTTING IT ALL TOGETHEREnabling IT to fully respond to the needs of the digital business
RED HAT FINANCIALS
12
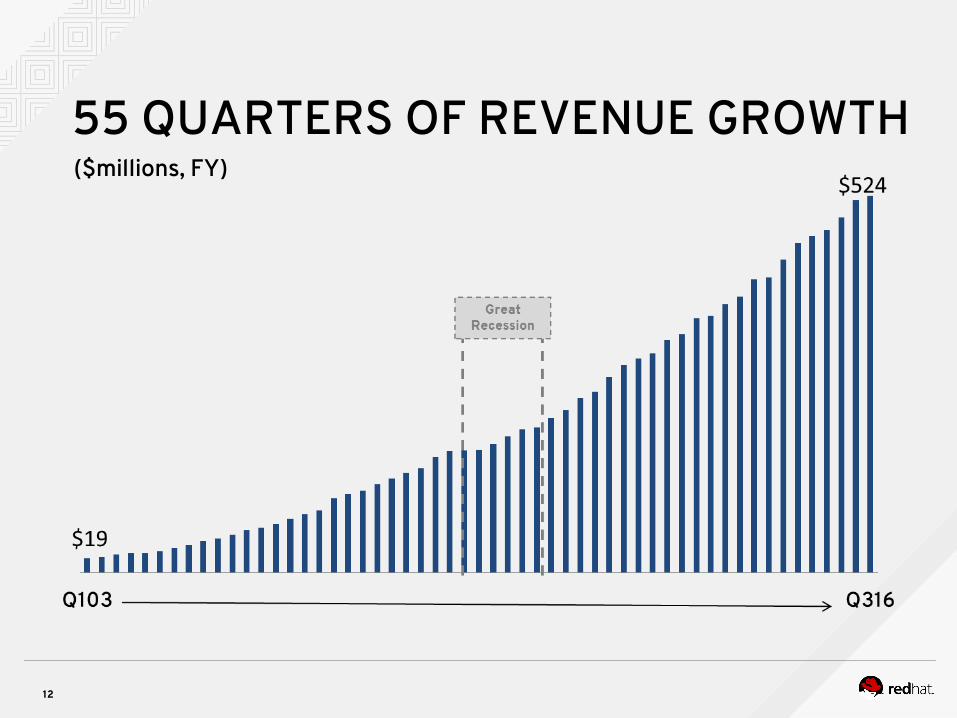
55 QUARTERS OF REVENUE GROWTH($millions, FY)
13
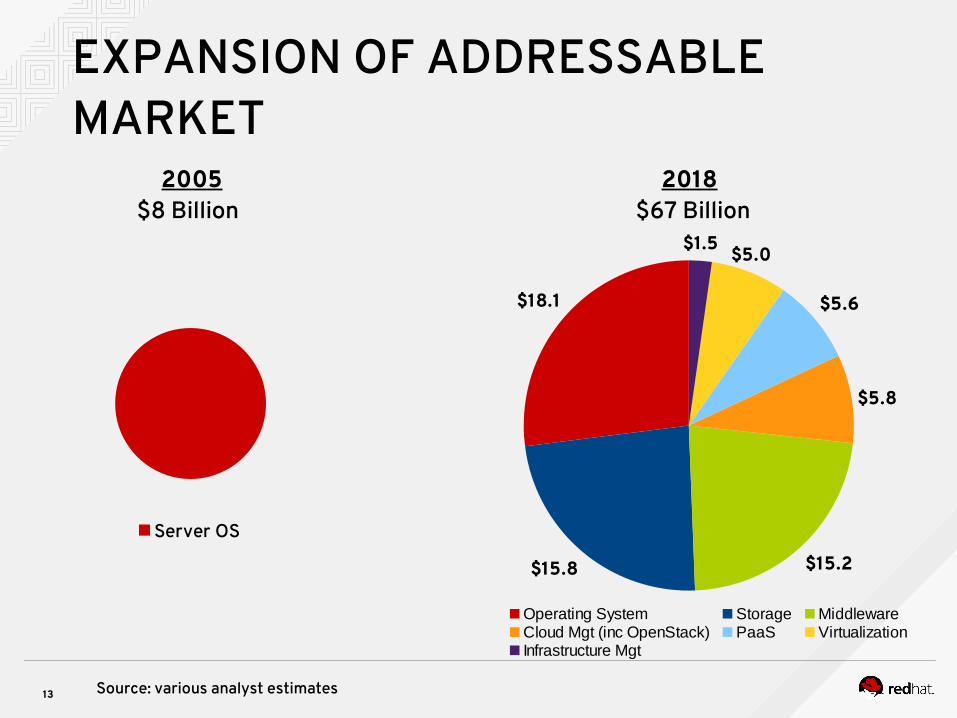
2005$8 Billion
EXPANSION OF ADDRESSABLE MARKET
2018$67 Billion
$18.1
$15.8 $15.2
$5.8
$5.6
$5.0$1.5
Operating System Storage MiddlewareCloud Mgt (inc OpenStack) PaaS VirtualizationInfrastructure Mgt
Server OS
Source: various analyst estimates
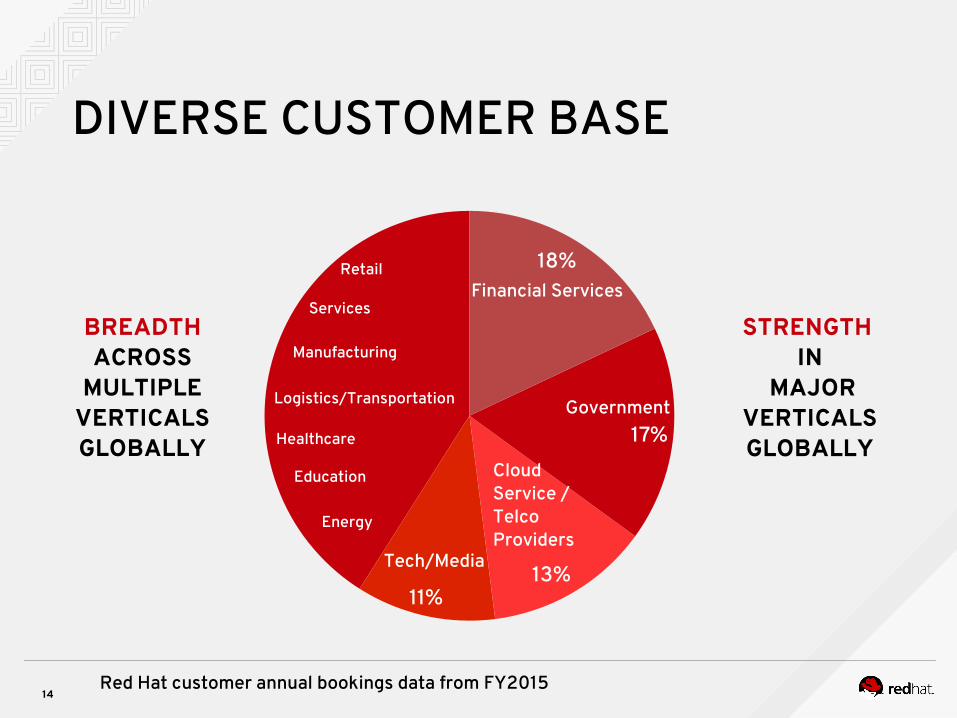
14Red Hat customer annual bookings data from FY2015
DIVERSE CUSTOMER BASE
11%13%
17%
18%Financial Services
Government
Cloud Service / Telco Providers
Tech/Media
Services
Retail
Manufacturing
Logistics/Transportation
Healthcare
Education
Energy
BREADTH ACROSS
MULTIPLE VERTICALS GLOBALLY
STRENGTH IN
MAJOR VERTICALS GLOBALLY
15
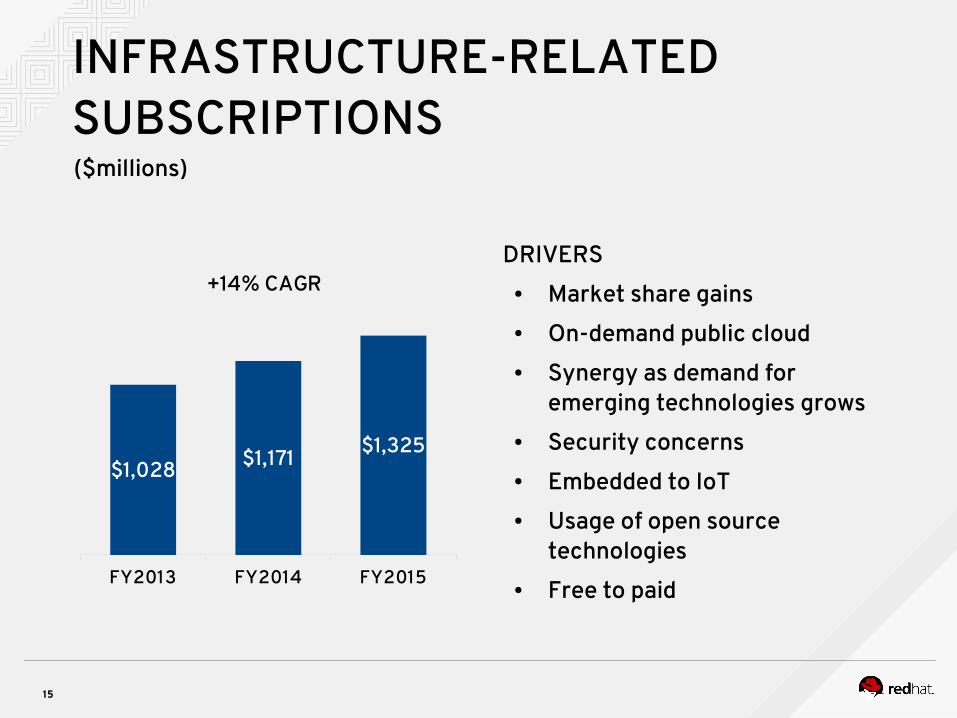
INFRASTRUCTURE-RELATED SUBSCRIPTIONS($millions)
DRIVERS● Market share gains● On-demand public cloud● Synergy as demand for
emerging technologies grows● Security concerns● Embedded to IoT● Usage of open source
technologies● Free to paidFY2013 FY2014 FY2015
$1,028 $1,171 $1,325
+14% CAGR

16
APP DEV-RELATED & EMERGING TECHNOLOGIES SUBSCRIPTIONS($millions)
DRIVERS● Broad middleware portfolio● Commoditization of traditional
middleware● Re-architecting the datacenter
for open hybrid cloud● DevOps, big data, containers
with microservices● Demand for OpenShift,
OpenStack and storageFY2013 FY2014 FY2015
$120$166
$237
+41% CAGR
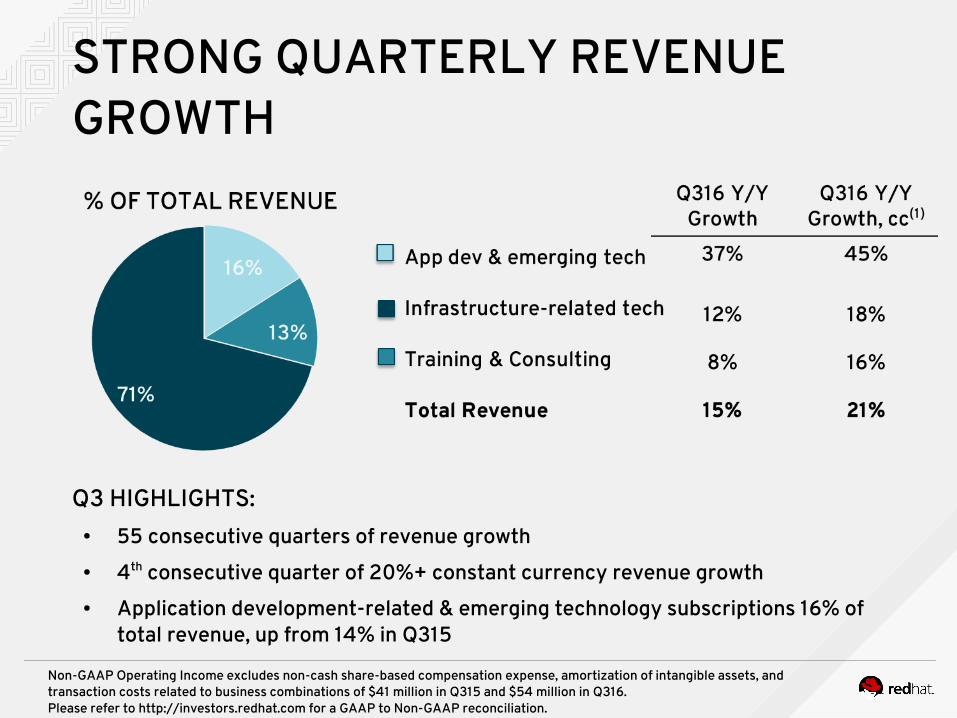
STRONG QUARTERLY REVENUE GROWTH
Q3 HIGHLIGHTS:● 55 consecutive quarters of revenue growth● 4th consecutive quarter of 20%+ constant currency revenue growth● Application development-related & emerging technology subscriptions 16% of
total revenue, up from 14% in Q315
Non-GAAP Operating Income excludes non-cash share-based compensation expense, amortization of intangible assets, and transaction costs related to business combinations of $41 million in Q315 and $54 million in Q316. Please refer to http://investors.redhat.com for a GAAP to Non-GAAP reconciliation.
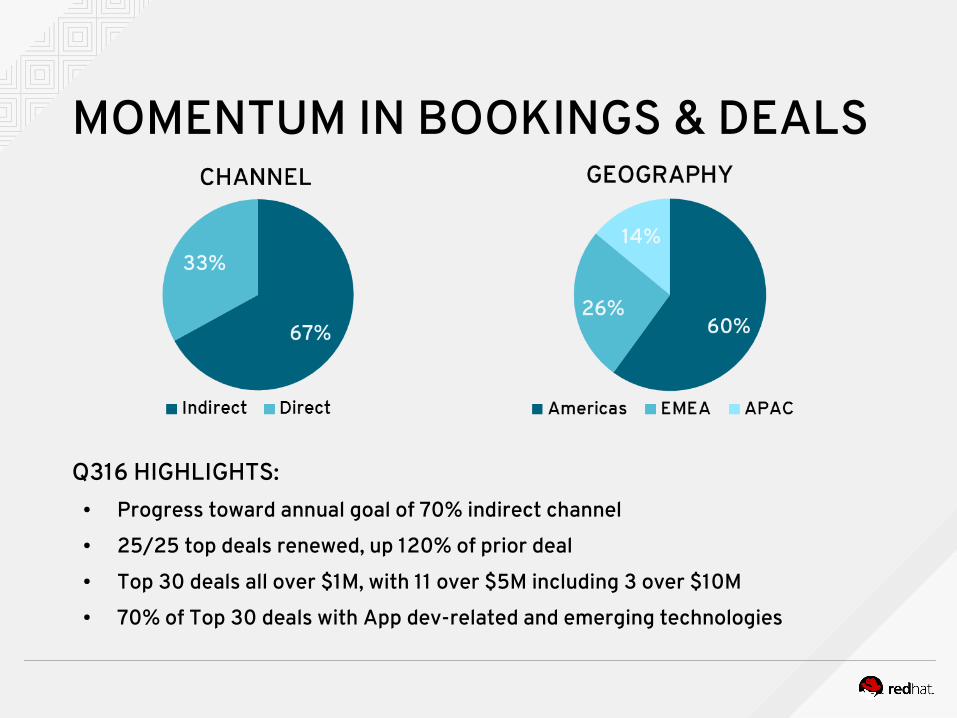
MOMENTUM IN BOOKINGS & DEALS
Q316 HIGHLIGHTS:● Progress toward annual goal of 70% indirect channel● 25/25 top deals renewed, up 120% of prior deal● Top 30 deals all over $1M, with 11 over $5M including 3 over $10M● 70% of Top 30 deals with App dev-related and emerging technologies
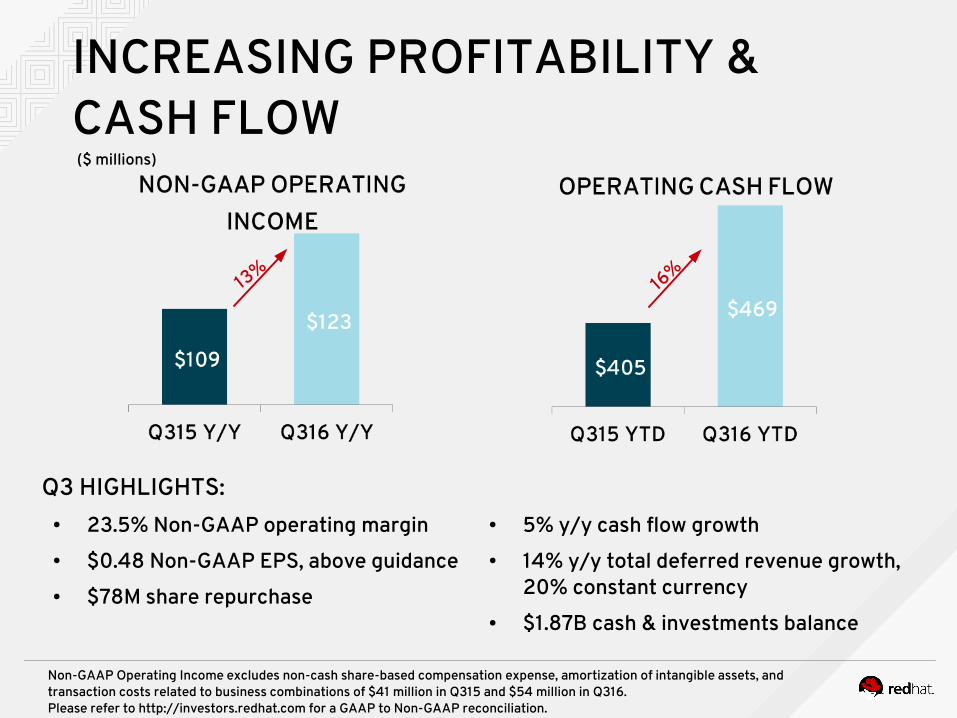
INCREASING PROFITABILITY & CASH FLOW($ millions)
● 5% y/y cash flow growth● 14% y/y total deferred revenue growth,
20% constant currency● $1.87B cash & investments balance
Q3 HIGHLIGHTS:● 23.5% Non-GAAP operating margin● $0.48 Non-GAAP EPS, above guidance● $78M share repurchase
13%16
%
Non-GAAP Operating Income excludes non-cash share-based compensation expense, amortization of intangible assets, and transaction costs related to business combinations of $41 million in Q315 and $54 million in Q316. Please refer to http://investors.redhat.com for a GAAP to Non-GAAP reconciliation.

SUMMARY
● Strong recurring revenue and cash flow growth● Strategic position drives larger deals● High-growth application development and other emerging
technologies● Cloud computing opportunity● Investing for future growth
INSERT DESIGNATOR, IF NEEDED 21
THANK YOU
12/17/2015
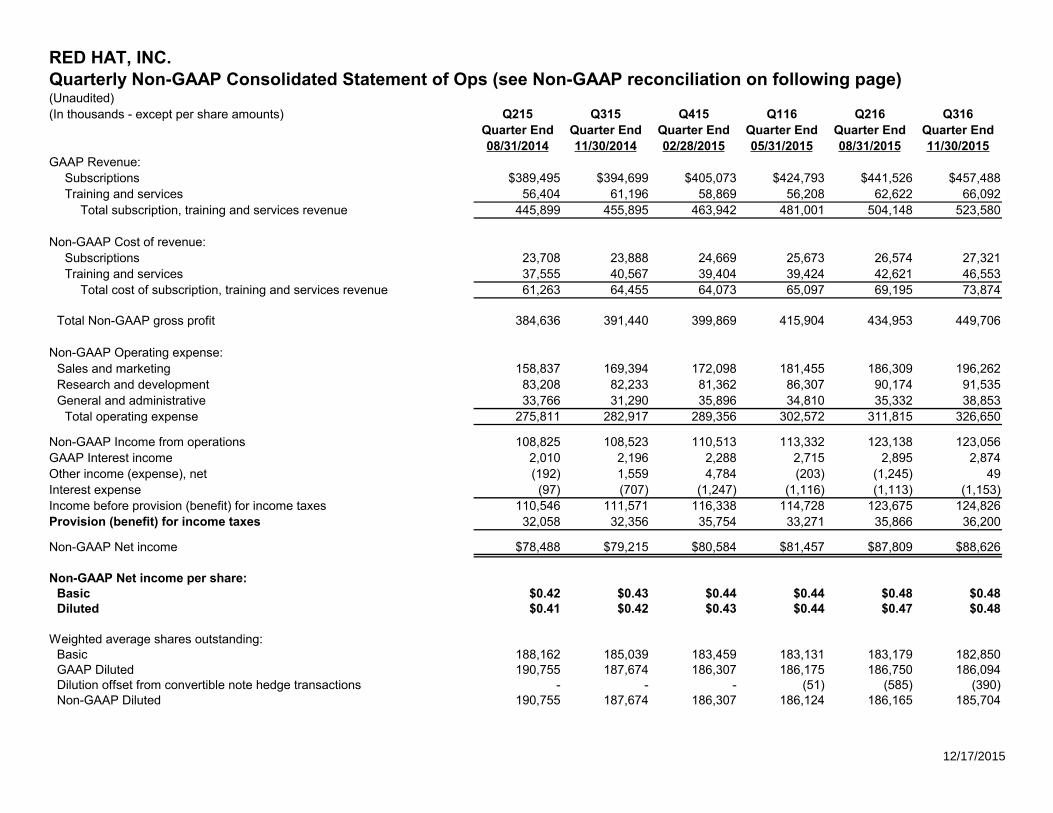
RED HAT, INC.Quarterly Non-GAAP Consolidated Statement of Ops (see Non-GAAP reconciliation on following page)(Unaudited)(In thousands - except per share amounts) Q215 Q315 Q415 Q116 Q216 Q316
Quarter End Quarter End Quarter End Quarter End Quarter End Quarter End08/31/2014 11/30/2014 02/28/2015 05/31/2015 08/31/2015 11/30/2015
GAAP Revenue:Subscriptions $389,495 $394,699 $405,073 $424,793 $441,526 $457,488Training and services 56,404 61,196 58,869 56,208 62,622 66,092
Total subscription, training and services revenue 445,899 455,895 463,942 481,001 504,148 523,580
Non-GAAP Cost of revenue:Subscriptions 23,708 23,888 24,669 25,673 26,574 27,321Training and services 37,555 40,567 39,404 39,424 42,621 46,553
Total cost of subscription, training and services revenue 61,263 64,455 64,073 65,097 69,195 73,874
Total Non-GAAP gross profit 384,636 391,440 399,869 415,904 434,953 449,706
Non-GAAP Operating expense:Sales and marketing 158,837 169,394 172,098 181,455 186,309 196,262Research and development 83,208 82,233 81,362 86,307 90,174 91,535General and administrative 33,766 31,290 35,896 34,810 35,332 38,853
Total operating expense 275,811 282,917 289,356 302,572 311,815 326,650
Non-GAAP Income from operations 108,825 108,523 110,513 113,332 123,138 123,056GAAP Interest income 2,010 2,196 2,288 2,715 2,895 2,874Other income (expense), net (192) 1,559 4,784 (203) (1,245) 49Interest expense (97) (707) (1,247) (1,116) (1,113) (1,153)Income before provision (benefit) for income taxes 110,546 111,571 116,338 114,728 123,675 124,826Provision (benefit) for income taxes 32,058 32,356 35,754 33,271 35,866 36,200
Non-GAAP Net income $78,488 $79,215 $80,584 $81,457 $87,809 $88,626
Non-GAAP Net income per share:Basic $0.42 $0.43 $0.44 $0.44 $0.48 $0.48Diluted $0.41 $0.42 $0.43 $0.44 $0.47 $0.48
Weighted average shares outstanding:Basic 188,162 185,039 183,459 183,131 183,179 182,850GAAP Diluted 190,755 187,674 186,307 186,175 186,750 186,094Dilution offset from convertible note hedge transactions - - - (51) (585) (390)Non-GAAP Diluted 190,755 187,674 186,307 186,124 186,165 185,704
12/17/2015
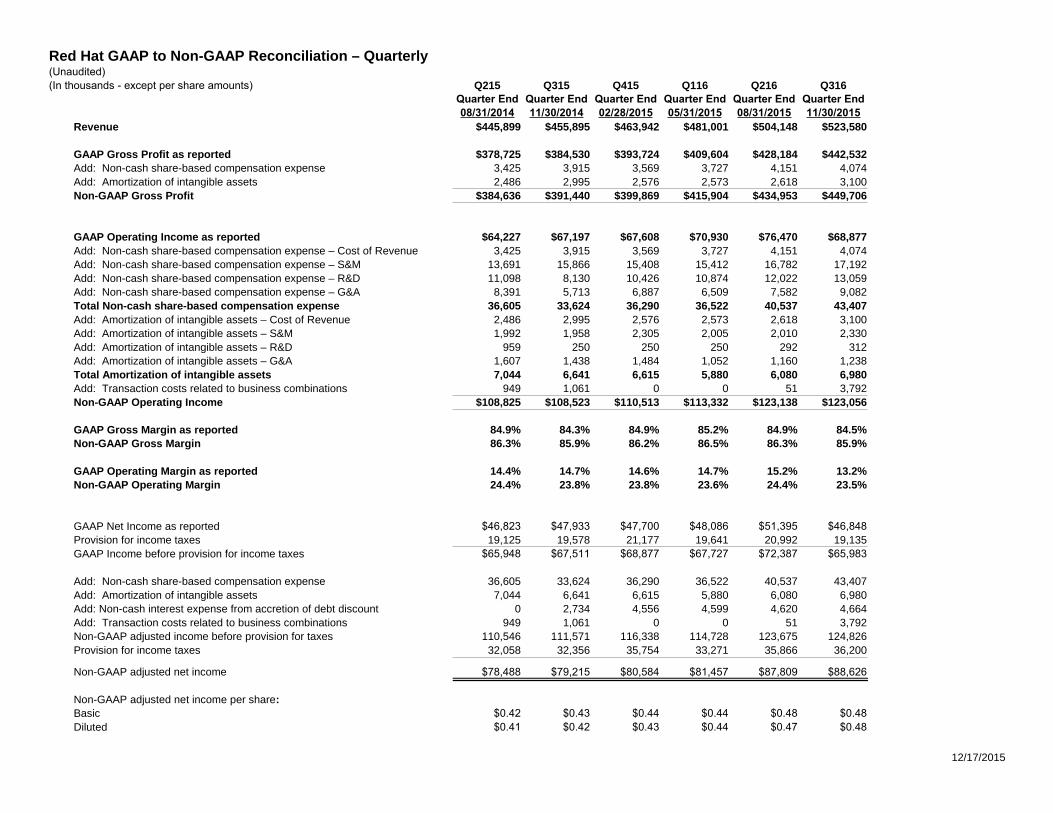
Red Hat GAAP to Non-GAAP Reconciliation – Quarterly(Unaudited)(In thousands - except per share amounts) Q215 Q315 Q415 Q116 Q216 Q316
Quarter End Quarter End Quarter End Quarter End Quarter End Quarter End08/31/2014 11/30/2014 02/28/2015 05/31/2015 08/31/2015 11/30/2015
Revenue $445,899 $455,895 $463,942 $481,001 $504,148 $523,580
GAAP Gross Profit as reported $378,725 $384,530 $393,724 $409,604 $428,184 $442,532Add: Non-cash share-based compensation expense 3,425 3,915 3,569 3,727 4,151 4,074Add: Amortization of intangible assets 2,486 2,995 2,576 2,573 2,618 3,100Non-GAAP Gross Profit $384,636 $391,440 $399,869 $415,904 $434,953 $449,706
GAAP Operating Income as reported $64,227 $67,197 $67,608 $70,930 $76,470 $68,877Add: Non-cash share-based compensation expense – Cost of Revenue 3,425 3,915 3,569 3,727 4,151 4,074Add: Non-cash share-based compensation expense – S&M 13,691 15,866 15,408 15,412 16,782 17,192Add: Non-cash share-based compensation expense – R&D 11,098 8,130 10,426 10,874 12,022 13,059Add: Non-cash share-based compensation expense – G&A 8,391 5,713 6,887 6,509 7,582 9,082Total Non-cash share-based compensation expense 36,605 33,624 36,290 36,522 40,537 43,407Add: Amortization of intangible assets – Cost of Revenue 2,486 2,995 2,576 2,573 2,618 3,100Add: Amortization of intangible assets – S&M 1,992 1,958 2,305 2,005 2,010 2,330Add: Amortization of intangible assets – R&D 959 250 250 250 292 312Add: Amortization of intangible assets – G&A 1,607 1,438 1,484 1,052 1,160 1,238Total Amortization of intangible assets 7,044 6,641 6,615 5,880 6,080 6,980Add: Transaction costs related to business combinations 949 1,061 0 0 51 3,792Non-GAAP Operating Income $108,825 $108,523 $110,513 $113,332 $123,138 $123,056
GAAP Gross Margin as reported 84.9% 84.3% 84.9% 85.2% 84.9% 84.5%Non-GAAP Gross Margin 86.3% 85.9% 86.2% 86.5% 86.3% 85.9%
GAAP Operating Margin as reported 14.4% 14.7% 14.6% 14.7% 15.2% 13.2%Non-GAAP Operating Margin 24.4% 23.8% 23.8% 23.6% 24.4% 23.5%
GAAP Net Income as reported $46,823 $47,933 $47,700 $48,086 $51,395 $46,848Provision for income taxes 19,125 19,578 21,177 19,641 20,992 19,135GAAP Income before provision for income taxes $65,948 $67,511 $68,877 $67,727 $72,387 $65,983
Add: Non-cash share-based compensation expense 36,605 33,624 36,290 36,522 40,537 43,407Add: Amortization of intangible assets 7,044 6,641 6,615 5,880 6,080 6,980Add: Non-cash interest expense from accretion of debt discount 0 2,734 4,556 4,599 4,620 4,664Add: Transaction costs related to business combinations 949 1,061 0 0 51 3,792Non-GAAP adjusted income before provision for taxes 110,546 111,571 116,338 114,728 123,675 124,826Provision for income taxes 32,058 32,356 35,754 33,271 35,866 36,200
Non-GAAP adjusted net income $78,488 $79,215 $80,584 $81,457 $87,809 $88,626
Basic $0.42 $0.43 $0.44 $0.44 $0.48 $0.48Diluted $0.41 $0.42 $0.43 $0.44 $0.47 $0.48
Non-GAAP adjusted net income per share:

12/17/2015
Red Hat GAAP to Non-GAAP Reconciliation – Quarterly Gross Margins(Unaudited) Q215 Q315 Q415 Q116 Q216 Q316(In thousands) Quarter End Quarter End Quarter End Quarter End Quarter End Quarter End
08/31/2014 11/30/2014 02/28/2015 05/31/2015 08/31/2015 11/30/2015GAAP Revenue:
Subscriptions $389,495 $394,699 $405,073 $424,793 $441,526 $457,488Training and services 56,404 61,196 58,869 56,208 62,622 66,092
Total subscription, training and services revenue 445,899 455,895 463,942 481,001 504,148 523,580
Non-GAAP Cost of revenue:Subscriptions 23,708 23,888 24,669 25,673 26,574 27,321Training and services 37,555 40,567 39,404 39,424 42,621 46,553
Total cost of subscription, training and services revenue 61,263 64,455 64,073 65,097 69,195 73,874
Total Non-GAAP gross profit 384,636 391,440 399,869 415,904 434,953 449,706
Non-GAAP Gross Margin 86.3% 85.9% 86.2% 86.5% 86.3% 85.9%Non-GAAP Subscription Gross Margin 93.9% 93.9% 93.9% 94.0% 94.0% 94.0%Non-GAAP Training and services Gross Margin 33.4% 33.7% 33.1% 29.9% 31.9% 29.6%
Cost of revenue reconciliation GAAP to non-GAAPSubscriptions (GAAP) 27,791 28,574 28,731 29,846 30,996 32,246
Less: non-cash share-based compensation expense 1,646 1,822 1,586 1,692 1,836 1,825Less: Amortization of intangible assets 2,437 2,864 2,476 2,481 2,586 3,100
Subscriptions (non-GAAP) 23,708 23,888 24,669 25,673 26,574 27,321
Training and services (GAAP) 39,383 42,791 41,487 41,551 44,968 48,802Less: non-cash share-based compensation expense 1,778 2,093 1,983 2,035 2,315 2,249Less: Amortization of intangible assets 50 131 100 92 32 -
Training and services (non-GAAP) 37,555 40,567 39,404 39,424 42,621 46,553


![Nucleus Software announces global collaboration with Red Hat [Company Update]](https://static.documents.pub/doc/80x56/577cb4951a28aba7118c905e/nucleus-software-announces-global-collaboration-with-red-hat-company-update.jpg)


