24
9Kld0265_Client_PPT_Pitchbook_Template.ppt January 2010 COMPANY PRESENTATION

9Kld0265_Client_PPT_Pitchbook_Template.ppt
January 2010
COMPANY PRESENTATION

9Kld0265_Client_PPT_Pitchbook_Template.ppt9Kld0265_Client_PPT_Pitchbook_Template.ppt
DISCLAIMER
1
Information contained in this presentation concerning Globaltrans Investment PLC, a company organized and existing under the laws of Cyprus (the “Company”, the “Group”), is for general information purposes only. These materials have been prepared by the Company, solely for your information and may not be reproduced, transmitted or further distributed to any other person or published, in whole or in part for any purpose or under any circumstances, without prior written permission of the Company. The contents of this presentation are not directed to, or intended for distribution to or use by, any person or entity that is a citizen or resident or located in any locality, state, country or other jurisdiction where such distribution, publication, availability or use would be contrary to law or regulation or which would require any registration or licensing within such jurisdiction. The opinions presented herein are based on general information gathered at the time of writing and are subject to change without notice. The Company relies on information obtained from sources believed to be reliable but does not guarantee its accuracy or completeness.
These materials may contain forward-looking statements regarding future events or the future financial performance of the Company. You can identify forward looking statements by terms such as “expect”, “believe”, “estimate”, “anticipate”, “intend”, “will”, “could”, “may”, or “might”, the negative of such terms or other similar expressions. These forward-looking statements include matters that are not historical facts and statements regarding the Company’s intentions, beliefs or current expectations concerning, among other things, the Company’s results of operations, financial condition, liquidity, prospects, growth, strategies, and the industry in which the Company operates. By their nature, forward-looking statements involve risks and uncertainties, because they relate to events and depend on circumstances that may or may not occur in the future. The Company cautions you that forward-looking statements are not guarantees of future performance and that the Company’s actual results of operations, financial condition, liquidity, prospects, growth, strategies and the development of the industry in which the Company operates may differ materially from those described in or suggested by the forward-looking statements contained in these materials. In addition, even if the Company’s results of operations, financial condition, liquidity, prospects, growth, strategies and the development of the industry in which the Company operates are consistent with the forward-looking statements contained in these materials, those results or developments may not be indicative of results or developments in future periods. The Company does not intend to update these statements to reflect events and circumstances occurring after the date hereof or to reflect the occurrence of unanticipated events. Many factors could cause the actual results to differ materially from those contained in forward-looking statements of the Company, including, among others, general economic conditions, the competitive environment, risks associated with operating in Russia, market change in the Russian freight rail market, as well as many other risks specifically related to the Company and its operations. No reliance may be placed for any purposes whatsoever on the information contained in this presentation or on its completeness, accuracy or fairness. The information in this presentation is subject to verification, completion and change. Accordingly, no representation or warranty, express or implied, is made or given by or on behalf of the Company or any of its shareholders, directors, officers or employees or any other person as to the accuracy, completeness or fairness of the information or opinions contained in these materials. None of the Company nor any of its shareholders, directors, officers or any other person accepts any liability whatsoever for any loss howsoever arising from any use of the contents of this presentation or otherwise arising in connection therewith. These materials do not constitute an offer or an advertisement of any securities in any jurisdiction.
By accepting these materials you agree to be bound by the foregoing terms regarding the information disclosed herein.

9Kld0265_Client_PPT_Pitchbook_Template.ppt2
IFRS Financial InformationCertain financial information presented herein regarding the Company is derived from the Consolidated Financial Statements of Globaltrans Investment PLC and its subsidiaries (the “Group”) for the year ended 31 December 2008; and consolidated condensed interim financial information of Globaltrans Investment PLC for the six months ended 30 June 2009 prepared in accordance with International Financial Reporting Standards as adopted by the European Union and requirements of Cyprus Companies Law. In addition, the Group’s consolidated condensed capsule Financial information included in this presentation is stated on a basis substantially consistent with the Consolidated Financial Statements. The full versions of financial statements are available on the Globaltrans corporate website (www.globaltrans.com) and at the registered office of Globaltrans.Certain financial information presented herein regarding OOO BaltTransServis, a limited liability company organised in the Russian Federation (“BTS”), is derived from audited financial statements for the years ended 31 December 2008 and 2007 and unaudited financial statements as of and for the six-month periods ended 30 June 2009 and 2008, and has been prepared in accordance with International Financial Reporting Standards.
Non-IFRS Financial and Operational InformationIn addition, management has elected to present certain non-IFRS financial information (adjusted revenue, net revenue from operation of rolling stock, EBITDA, adjusted EBITDA, empty run costs, ROCE) and operational information (average distance of loaded trip, average number of loaded trips per railcar, average price per trip, average rolling stock operated, empty run ratio, freight rail turnover, transportation volume, share of empty kilometres paid by the Group, rolling stock fleet, owned rolling stock fleet) which is unaudited and derived from management accounts.
Financial Information presented in Russian RoublesFor the sake of clarity, certain financial information of BTS (net revenue from operation of rolling stock, empty run cost, average price per trip, repair and maintenance costs) is presented in Russian Roubles based on the management accounts.
All financial and operational information presented in this document should be used only as an analytical tool, and investors should not consider any of them in isolation or any combination of them together, as a substitute for analysis of respective consolidated financial statements.
PRESENTATION OF INFORMATION

9Kld0265_Client_PPT_Pitchbook_Template.ppt9Kld0265_Client_PPT_Pitchbook_Template.ppt
Rail tank car19,270
Gondola15,508
GLOBALTRANS HIGHLIGHTS
3
► Largest Russian private freight rail operator
► Balanced fleet of rolling stock
Market capitalisation >$1.8bn1
LTM Adjusted EBITDA2 $168mln
36,033 units of rolling stock
Deep knowledge of customers’ transportation needsIntegrated part of customers’ logistics chain
► Long-standing relationships with blue-chip clients
► Experienced management team
► Advanced destination management and route optimisation systems
Efficient rolling stock management is a key competitive strength
Significant previous railway experienceBuilt a robust and flexible business capable of outperforming during downturn and recovery
(1) As of January 20th, 2010(2) LTM Adjusted EBITDA represents Adjusted EBITDA calculated for the twelve months prior to September 30th, 2009. Adjusted EBITDA represents EBITDA less net foreign
exchange gains/(losses) on financing activities, share of profit/(loss) of associates and other gains/(losses)—net. Other gains/(losses)—net include gains from the sale of subsidiaries, recognised deferred gains and other gains and losses
(3) Defined as the simple sum of Globaltrans’ and BTS’ fleets of rolling stock owned and leased under finance and operating leases as of 30 June 2009(4) Besides 15,508 gondolas and 19,270 rail tank cars combined fleet of Globaltrans’ and BTS’ included 76 locomotives and 1,179 other railcars. Combined fleet defined as the simple
sum of Globaltrans’ and BTS’ fleets of rolling stock owned and leased under finance and operating leases as of 30 June 2009
3,4

9Kld0265_Client_PPT_Pitchbook_Template.ppt9Kld0265_Client_PPT_Pitchbook_Template.ppt
26
19
32
22
Rail tank cars
Gondola cars
Service life RZD average
27.7% 31.0% 32.3% 36.2% 38.9%
2004 2005 2006 2007 2008
85%
33% 32%21%
Russia Brazil India China
ATTRACTIVE RUSSIAN RAIL FUNDAMENTALS
Backbone of transportation network
Favourable pricing environment Ongoing liberalisation
Limited alternatives to rail:
- Long transportation distances
- Large quantities of bulk freight
- Competitive cost
Tariff growth above CPI encourages private investment
Regulated RZD tariff increased by 9.4% as of January 1st, 2010
Private operators’pricing unregulated
Liberalisation programme initiated by Russian State continues
Private operators gaining market share
1 3 4
(1) Excluding pipelines(2) Brazil and China – Business Monitor International estimates(3) If pipeline freight transportation turnover is included rail would represent 43% of total(4) Including RZD subsidiaries(5) Rebased to 100%
4
SHARE OF FREIGHT RAIL IN BRIC (2008)1,2,3
Source: Business Monitor International (Q3 2009), Rosstat
Source: Rosstat, Press
CUMULATIVE RAILWAY TARIFF GROWTH VS CPI 5
PRIVATE FLEET AS % OF TOTAL FLEET
Source: Company data, RZD, ‘RZD-Partner’ industry journal
Private investment needed for renewal
Russian State Railway (RZD) fleet is old
RZD is focused on infrastructure investment
Investments have to come from private sector
2
RZD FLEET4 NEARING END OF USEFUL LIFE
Source: RZD Annual Report 2008, Company data
242k 280k 300k 353k 391k
Average railway tariff +21%
Average CPI +13%20
00
2001
2002
2003
2004
2005
2006
2007
2008
2009
2010
E
Railway tarif f CPI
351%
221%
130%

9Kld0265_Client_PPT_Pitchbook_Template.ppt9Kld0265_Client_PPT_Pitchbook_Template.ppt
RECOVERY OF RUSSIAN RAIL FREIGHT TRANSPORTATION MARKET
5
Linked to Russia’s major commodities
Sustained recovery since Q1 09
Rai
l fre
ight
vo
lum
e
RAIL FREIGHT VOLUME (mln tn)
Construction projects cancelled or postponed
Renewal of infrastructure and housing development vital for Russia in medium term
Con
stru
ctio
n m
ater
ials
2
Sharp decline due to inventory de-stocking at the end of 2008
Strong recovery since thenMet
als
and
min
ing
carg
oes
1
Source: Rosstat, RZD
Low volatility
Volumes stable despite price fluctuations
Oil
prod
ucts
an
d oi
l
Source: Rosstat
Source: Rosstat
Source: Rosstat
(1) Data series includes rail freight volumes for ferrous metals, scrap, iron, non-ferrous ore, coal(2) Data series includes rail freight volumes for construction materials and cement
05
10152025
Jan
Feb Mar
Apr
May Jun
Jul
Aug
Sep
Oct
Nov
Dec
2009 2008
50
75
100
125
Jan
Feb Mar
Apr
May Ju
n
Jul
Aug
Sep Oct
Nov
Dec
2009 2008
203040
5060
Jan
Feb Mar
Apr
May Ju
n
Jul
Aug
Sep Oct
Nov
Dec
2009 2008
10
15
20
25
Jan
Feb Mar
Apr
May Jun
Jul
Aug
Sep
Oct
Nov
Dec
2009 2008

9Kld0265_Client_PPT_Pitchbook_Template.ppt9Kld0265_Client_PPT_Pitchbook_Template.ppt
54%40%
-21%
-7%-4%
10%
Overall Russian f reight rail market
Globaltrans
PROVEN ABILITY TO OUTPERFORM THE MARKET DURING DOWNTURN AND RECOVERY
Operating metrics improved in Q3 09- Turnover ↑ 10% (vs. Q3 08)- Gondola empty run ratio2 ↓ to 40%- Price per trip3 ↑ by 7% to $629
(vs. H1 09)
Source: Rosstat, management accounts
(1) Freight Rail Turnover is a measure of freight carriage activity over a particular period calculated as the sum of tonnage of each loaded trip multiplied by the distance of each loaded trip, expressed in tonnes-km
(2) Empty Run ratio is calculated as the total of empty trips in kilometres by respective rolling stock type divided by total loaded trips in kilometres of such rolling stock type. Empty trips are only applicable to rolling stock operated (not including rolling stock in maintenance, purchased rolling stock in transition to its first place of commercial utilisation or rolling stock leased out)
(3) Average Price per Trip ($) is calculated as Net Revenue from Operation of Rolling Stock divided by total number of loaded trips during the relevant period
H1 09 Q3 09
6
FREIGHT RAIL TURNOVER1 (09 vs. 08 change)
GONDOLA EMPTY RUN RATIO2
Our business model enabled us to
maintain volumes and pricing
Specific initiatives included
- Leveraging client relationships
- Shifting gondolas to different cargoes
- Return of leased-in railcars
H1 09 Q3 09

9Kld0265_Client_PPT_Pitchbook_Template.ppt9Kld0265_Client_PPT_Pitchbook_Template.ppt
43.8% 50.3% 41.4% 43.0%
2007 2008 H1 2009 Q1-3 2009
352.8 433.9
149.2234.6
51.766.7
31.046.3
2007 2008 H1 2009 Q1-3 2009Revenue from leasingNet revenue from operation of rolling stock
404.5500.6
180.2280.9
(1) Net Revenue from Operation of Rolling Stock is defined as revenue from ‘‘railway transportation—operator’s services’’ less ‘‘infrastructure and locomotive tariffs: loaded trips’’ (excluding the impact of the transfer and consolidation of Spacecom and Intopex for all periods)
(2) Adjusted EBITDA represents EBITDA less net foreign exchange gains/(losses) on financing activities, share of profit/(loss) of associates and other gains/(losses)—net. Other gains/(losses)—net include gains from the sale of subsidiaries, recognised deferred gains and other gains and losses
(3) Adjusted EBITDA margin is calculated as Adjusted EBITDA / Adjusted revenue. Adjusted Revenue is calculated as ‘‘total revenue-operator’s services’’ plus ‘‘total revenue-operating lease’’ less ‘‘infrastructure and locomotive tariffs: loaded trips’’
(4) Calculated as % change between average RUB/USD exchange rate for 9m 08 and for 9m 09(5) Other costs defined as total cost of sales, selling general & administrative expenses less depreciation of PPE, infrastructure and locomotive tariff: loaded trips and empty
run trips
Source: Company data
9M 09 FINANCIAL HIGHLIGHTS
7
Depreciation of RUB by 35.6%4 negatively affected our financials
Adjusted EBITDA2 declined by 19% in RUB and 41% in $ (vs. 9M 08)
- Reflecting increase in empty run expenses
Other costs5 were reduced by $45.2mln
Adjusted EBITDA margin3 in Q1-3 09 improved by 1.6% from H1 09 to 43%
Financials supported by positive trends in:
- volume recovery
- improvements in cargo mix
- reductions in empty runs
- pricing environment
- FX
NET REVENUE FROM OPERATION OF ROLLING STOCK1
AND REVENUE FROM LEASING ($ mln)
ADJUSTED EBITDA2 ($ mln) AND MARGIN3
Source: Company data
Source: Company data
177.4 250.3 74.6 120.9

9Kld0265_Client_PPT_Pitchbook_Template.ppt9Kld0265_Client_PPT_Pitchbook_Template.ppt
513.2
334.0 320.82.9x
1.3x1.9x
2007 2008 Q1-3 2009
Net debt Net debt to Adjusted EBITDA
(1) Net debt is calculated as the balance of short term borrowings and long term borrowings including interest accrued, net of cash and cash equivalents(2) LTM Adjusted EBITDA represents Adjusted EBITDA calculated for the twelve months prior to the end of the reporting period. Adjusted EBITDA represents EBITDA less net foreign
exchange gains/(losses) on financing activities, share of profit/(loss) of associates and other gains/(losses)—net. Other gains/(losses)—net include gains from the sale of subsidiaries, recognised deferred gains and other gains and losses
(3) Carrying amounts, excluding accrued interest in amount of $1.8mln(4) Including bank borrowings, bank overdrafts, loans from third parties and related parties, finance leases liabilities(5) Net cash from operating activities, calculated for the twelve months prior to the end of the reporting period
REPAYMENT SCHEDULE OF BORROWINGS as of 30-Sep-20093,4 ($ mln)
SOLID FINANCIAL POSITION
8
NET DEBT1 EoP / LTM ADJUSTED EBITDA2
($ mln)
Source: Company data
Source: Company data
Reduced gross debt by $35mln to only $410mln since year end 2008
1.9x Net debt / LTM Adjusted EBITDA within our target coverage ratio
Increased proportion of RUB debt to 30% from 13% since beginning of 2009
Average interest rate decreased to 10.0% in Q3 09 from 10.4% in H1 09
Operating cash flow amply covers all near-term obligations
Long-term debt now available to strong players on attractive terms5
177.8
177.8
89.5
22.039.9 43.7
34.6 29.8
124.7
69.9
44.0
LTM OpCF
Cash and cash
equivalents(as of 30-Sep-09)
Q4 09 Q1 10 Q2 10 Q3 10 Q4 10 2011 2012 2013-2015
140.2
9Kld0265_Client_PPT_Pitchbook_Template.ppt9Kld0265_Client_PPT_Pitchbook_Template.ppt
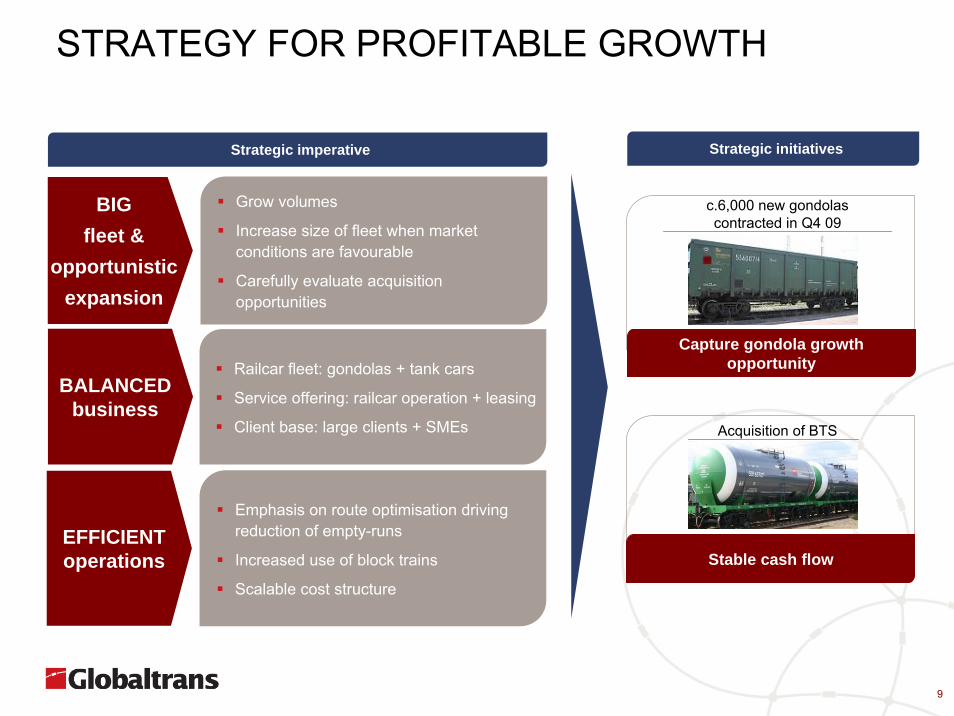
STRATEGY FOR PROFITABLE GROWTH
Grow volumes
Increase size of fleet when market conditions are favourable
Carefully evaluate acquisition opportunities
BIGfleet &
opportunisticexpansion
Emphasis on route optimisation driving reduction of empty-runs
Increased use of block trains
Scalable cost structure
EFFICIENT operations
BALANCED business
Railcar fleet: gondolas + tank cars
Service offering: railcar operation + leasing
Client base: large clients + SMEs
9
c.6,000 new gondolas contracted in Q4 09
Acquisition of BTS
Capture gondola growth opportunity
Stable cash flow
Strategic imperative Strategic initiatives

9Kld0265_Client_PPT_Pitchbook_Template.ppt9Kld0265_Client_PPT_Pitchbook_Template.ppt
26
19
6
3
Rail tank cars
Gondola cars
RZD average Remaining service life
35.8
50.6
78.6
42.4
2006 2007 2008 Oct-2009
10.814.5
19.2
14.3
2006 2007 2008 2009E
OPPORTUNISTIC GROWTH OF GONDOLA FLEET
Gondolas favourably priced because - many players have limited access to equity or debt- lack of demand- low steel prices
Gondola prices beginning to increase reflecting- normalisation of cargo volumes- projected tariff increases- expected scrapping of old railcars by RZD
Net Revenue from Operation of Rolling Stock2 of gondolas has decreased less than gondola pricesGlobaltrans has already contracted c.6,000 gondolas
- deliveries started in Nov-09
RZD RAILCAR FLEET1
GONDOLA PRICE (000s $)2
NET REVENUE FROM OPERATION OF ROLLING STOCK3
PER GONDOLA4 (000 $)
Source: Gondola price – Company data for 2006, ‘Industrials cargoes’ journal for 2007 – Oct-2009
Source: RZD Annual Report 2008, Company data Source: Company data
10
-46%
(1) Including RZD subsidiaries(2) Year-average gondola price of Altayyvagonzavod (ex-works) according to ‘Industrial cargoes’ journal(3) Net Revenue from Operation of Rolling Stock is defined as revenue from ‘‘railway transportation—operator’s services’’ less ‘‘infrastructure and locomotive tariffs: loaded
trips’’ (excluding the impact of the transfer and consolidation of Spacecom and Intopex for all periods)(4) 2009 – annualized, based on data for 9 months 2009
-26%

9Kld0265_Client_PPT_Pitchbook_Template.ppt
7.2
7.3
11.6
14.8
16.1
UTS
OTEKO
Globaltrans
6.6
7.2
7.3
9.5
11.6
14.8
BTS
UTS
Globaltrans
OTEKO
34.0% 28.7% 31.0% 34.7%
2007 2008 H1 08 H1 09
1.7x
1.2x
0.2x
Globaltrans BTS Postcontribution
proforma
NET DEBT / LTM ADJUSTED EBITDA H1 09
BTS volumes flat and margins increased during downturnAdditional customer diversityLeading operator of block trainsIntegration into the production processes at the refineries
BENEFITS OF BTS ACQUISITION
11
9,637 rail tank cars and 49 locomotives operated1
LTM adjusted EBITDA2 of $97mln
The largest private owner of rail tank cars post acquisition
Source: BTS, Globaltrans, RZD PartnerSource: Argus Source: Company financials
Minimal variation in volumes
High barriers to entry
Long-term customer relationships
High switching costs
Stable volumes, prices and margins even during downturn
Resilient cash flows, low capex and low net debt = extra firepower
2ADJUSTED EBITDA MARGIN (%) 2, 3
(1) As of 30 June 2009(2) Adjusted EBITDA represents EBITDA less other income, other expenses, foreign exchange (loss)/gain on non-operating activities and amortisation of the issued guarantee(3) Margin is calculated as Adjusted EBITDA / Adjusted Revenue. Adjusted Revenue is calculated as transportation services rendered plus rental income less infrastructure and
locomotive tariffs: loaded trips as part of the OAO ‘‘Russian Railways’’ infrastructure tariff component of cost of sales reported under IFRS(4) No pro forma adjustment
STRENGTHENED FINANCIAL POSITION
STABLE BUSINESS MODELLARGE ACQUISITION CONSTANT VOLUME
MARKET1 3 42
RUSSIAN OIL PRODUCTS RAIL TRANSPORT (mln tn)
Source: Company financials
MAJOR CLIENTS
PRIVATE RAIL TANK CAR OWNERS ‘000 (2008)
BEFOREACQUISITION
AFTERACQUISITION
140 136
0
30
60
90
120
150
9m08 9m09
4
Gazpromtrans
TEKEvrotrans
TEKEvrotrans
Gazpromtrans
pro forma

9Kld0265_Client_PPT_Pitchbook_Template.ppt9Kld0265_Client_PPT_Pitchbook_Template.ppt
KEY TAKEAWAYS
Successfully navigated downturn demonstrating strength of business model and management
Growth started along with economic recovery in Q3 09
12
BTS acquisition expected to substantially increase scale and stability of business
Right time to grow in gondolas
is a unique value proposition
1
2
4
3

9Kld0265_Client_PPT_Pitchbook_Template.ppt9Kld0265_Client_PPT_Pitchbook_Template.ppt
KEY TAKEAWAYS OF THE BTS ACQUISITION: COMBINED COMPANY AT A GLANCE
KEY FINANCIALS(1) ($ mln)
Source: Company data
Balance Sheet items As of 30 June 2009
Property, plant and equipment 847
Cash and cash equivalents 73
Total assets 1,089
Non-current Borrowings 273
Current Borrowings 151
Income Statements items 2008 H1 2009
Adjusted EBITDA(2) 348 127
Profit for the period 143 44
13
(1) Based on unaudited pro forma financial information(2) Defined as BTS Adjusted EBITDA plus Globaltrans Adjusted EBITDA. BTS Adjusted EBITDA represents EBITDA less other income, other expenses, foreign exchange
(loss)/gain on non-operating activities and amortisation of the issued guarantee. Globaltrans Adjusted EBITDA represents EBITDA less net foreign exchange gains/(losses) on financing activities, share of profit/(loss) of associates and other gains/(losses)—net. Other gains/(losses)—net include gains from the sale of subsidiaries, recognised deferred gains and other gains and losses
(3) Defined as simple sum of Globaltrans’ and BTS’ railcar fleets (owned and leased under finance and operating leases)(4) Calculated on a basis of a simple sum of Globaltrans’ and BTS’ transportation volumes for H1 2009
FLEET UNDER OPERATIONS3
(as of 30 June 2009)
Gondola43%
Rail tank cars53%
Other 3%36,033 railcars
Source: Company data
CARGO SPLIT4 (mln tn)(based on H1 09 data)
Metals and mining cargoes
35%
Oil products and oil56%
Construction materials
4%
Other 4%
26.1 mln tn
Source: Company data

9Kld0265_Client_PPT_Pitchbook_Template.ppt14
(1) Adjusted EBITDA represents EBITDA less other income, other expenses, foreign exchange (loss)/gain on non-operating activities and amortisation of the issued guarantee(2) Based on Net debt of $19.7mln as of 30 June 2009 and LTM Adjusted EBITDA of $97mln as of 30 June 2009(3) Based on market data as of 27 November 2009: Market cap of $1,006mln; Net debt of $321mln as of 30 September 2009; book value of minority interest of $36mln as of
30 September 2009; LTM Adjusted EBITDA of $168mln as of 30 September 2009(4) Return on investment is defined as LTM Adjusted EBITDA after depreciation of property, plant and equipment ($84mln as at 30 June 2009) divided by the transaction
Enterprise Value
ACCRETIVE TRANSACTION TERMS
Transaction multiple: 5.4x EV / LTM Adjusted EBITDA1,2
Globaltrans is currently trading at 8.1x EV / LTM Adjusted EBITDA1,3
Return on investment4 above Globaltrans’ cost of capital
Expected to be immediately EPS accretive
KEY BTS TRANSACTION TERMS
► In December 2009 Globaltrans acquired an effective 50% economic interest and a majority controlling interest in BTS from TIHL in exchange for newly issued shares
► Structured to allow control and consolidation of BTS
► Total value for stake is $250mln
► Right of first refusal over TIHL’s remaining stake and stake of minority shareholders
► Approved by the Independent and Disinterested Directors of Globaltrans
► Deutsche Bank and Morgan Stanley have provided Fairness Opinions

9Kld0265_Client_PPT_Pitchbook_Template.ppt
OIL PRODUCTS AND OIL TRANSPORT MARKET IS RESILIENT
15
Source: Argus
Source: Argus
RAIL TRANSPORTATION OF OIL PRODUCTS AND OIL (mln tn)
EXPORT VS TOTAL RUSSSIAN RAIL TRANSPORTATION OF OIL PRODUCTS (%)
Highly inelastic supply and demand -resilient sector during the downturnShare of transportation costs is not significant in product price
Oil productsNo transportation alternatives: limited product pipeline network with no plans for significant expansion Fuel oil, BTS key cargo, cannot be transported by pipelineVolumes growing as Russian refining industry continues to developTrip lengths increasing with greater share of exports
OilMost Russian crude is now transported by pipeline Remaining volumes highly defensible (high quality crude, fields away from pipeline, etc) Growing demand in Kazakhstan as megaprojects ramp up
161 175 182 187
140 136
2023 23 24
18 20
202218 225 231
173 17020
21 20 20
15 14
2005 2006 2007 2008 9m08 9m09Oil products, Russia Oil, Russia Kazakhstan
46% 46%
48%
51%
40%
50%
60%
2005 2006 2007 2008
(1) 100% rail logistics only, does not reflect multi-modal transportation including railway element
11

9Kld0265_Client_PPT_Pitchbook_Template.ppt
(1) Net Revenue from Operation of Rolling Stock is defined as transportation services rendered less infrastructure and locomotive tariffs: loaded trips as part of the OAO ‘‘Russian Railways’’ infrastructure tariff component of cost of sales reported under IFRS
(2) Adjusted Revenue is calculated as transportation services rendered plus rental income less infrastructure and locomotive tariffs: loaded trips as part of the OAO ‘‘Russian Railways’’ infrastructure tariff component of cost of sales reported under IFRS
(3) Adjusted EBITDA represents EBITDA less other income, other expenses, foreign exchange (loss)/gain on non-operating activities and amortisation of the issued guarantee
(4) Calculated as Adjusted EBITDA divided by Adjusted revenue(5) ROCE is defined as Adjusted EBITDA (LTM basis) minus depreciation of property, plant and equipment divided by the sum of average balances between balance sheet
dates of total net assets attributable to participants and total borrowings(6) Net debt is calculated as the balance of short term borrowings and long term borrowings including interest accrued, net of cash and cash equivalents
BTS FINANCIAL AND OPERATIONAL HIGHLIGHTS
16
6m09 6m08 ∆, % (in USD
terms)
∆, % (in RUB
terms)
2008 2007 ∆, % (in USD
terms)
∆, % (in RUB
terms)
Transportation volume, mln tonnes
10.1 8.6 18.1 19.5
Freight rail turnover, billion tonnes-km
8.7 9.0 16.8 16.9
Net revenue from operation of rolling stock, $ mln 1
146 165 -11 24 328 250 31 27
Adjusted revenue, $ mln 2
151 172 -12 22 341 262 30 27
Adjusted EBITDA, $ mln 3
52 53 -2 36 98 89 10 7
Adjusted EBITDA margin, % 4
35 31 29 34
ROCE, % 5 37 n/a 36 n/a
Net debt, $ mln 6 20 33 -41 -21 27 40 -33 -20
KEY FINANCIAL AND OPERATIONAL HIGHLIGHTS ($ mln)

9Kld0265_Client_PPT_Pitchbook_Template.ppt9Kld0265_Client_PPT_Pitchbook_Template.ppt
BTS CONDENSED FINANCIALS
17
Income Statementexpressed in US$ thousands (unless indicated otherwise)
6 months ended 30 June2009 2008
Revenue 343,826 422,692 Cost of sales (293,466) (372,414)Gross profit 50,361 50,279 Selling, general and administrative expenses (3,663) (4,557)Amortisation of the issued guarantee 1,717 431 Other income 322 309 Other expenses (898) (928)Operating profit 47,838 45,534 Interest expense – borrowings (990) (2,224)
Dividends to participants (26,059) (31,357)Finance income 89 396 Foreign exchange (loss)/gain on non-operating activities (2,707) 2,923 Profit before income tax 18,170 15,273 Income tax expense (8,857) (11,498)Change in surplus of net assets attributable to participants 9,313 3,775
(unaudited)
Balance Sheetexpressed in US$ thousands (unless indicated otherwise)
As at 30 June As at 30 June2009 2008
Current assetsCash and cash equivalents 8,835 31,969Accounts receivable 8,362 4,841Accounts receivable and prepayments– related parties 1,721 3,482Prepayments 10,024 18,133Value added taxes receivable 11,789 14,397Current income tax receivable 19 684Inventories 3,946 6,396Other receivables 289 521Total current assets 44,986 80,423
Non-current assetsProperty, plant and equipment 156,297 216,150Total non-current assets 156,297 216,150TOTAL ASSETS 201,284 296,573
Current liabilitiesAccounts payable and accrued expenses 3,316 2,923Advances from customers 1,235 19,893Accounts payable– related parties 492 262Current income tax liabilities 3,308 98Short-term borrowings 19,542 44,460Other liabilities 1,748 2,660Total current liabilities 29,641 70,296
Non-current liabilities excluding net assets, attributable to participantsLong-term borrowings 9,029 20,794Other non-current liabilities 617 2,739Deferred tax liability 318 288Total non-current liabilities excluding net assets, attributable to participants 9,964 23,821
Net assets, attributable to participantsCharter capital 3,808 5,080Cumulative surplus of net assets 157,871 197,376Total net assets, attributable to participants 161,679 202,456
Total liabilities excluding net assets, attributable to participants 39,605 94,117TOTAL LIABILITIES 201,284 296,573
(unaudited)

9Kld0265_Client_PPT_Pitchbook_Template.ppt9Kld0265_Client_PPT_Pitchbook_Template.ppt
GLOBALTRANS CONDENSED CONSOLIDATED FINANCIALS
18
Consolidated Income Statementexpressed in US$ thousands (unless indicated otherwise)
2009 2008
Revenue 330,351 522,979 Cost of sales (208,958) (314,213) Gross profit 121,393 208,766 Selling and marketing costs (1,091) (1,711) Administrative expenses (30,241) (39,244) Other gains—net 242 3,254 Operating profit 90,303 171,065 Finance income 1,907 2,770 Finance costs (51,037) (44,235) Finance costs—net (49,130) (41,465) Share of profit/(loss) of associates 462 519 Profit before income tax 41,635 130,119 Income tax expense (4,418) (28,676) Profit for the period 37,217 101,443 Attributable to:Equity holders of the Company 29,106 96,694 Minority interest 8,111 4,749
37,217 101,443
Nine months ended 30 September
(unaudited)
Consolidated Balance Sheetexpressed in US$ thousands (unless indicated otherwise)
As at 30 September As at 31 December
2009 2008
Non-current assetsProperty, plant and equipment 698,262 741,915 Investment in associate 1,490 926 Trade and other receivables 34,137 28,023 Total non-current assets 733,889 770,864
Current assetsInventories 1,504 660 Trade and other receivables 98,718 101,774 Current income tax assets 5,468 11,160 Cash and cash equivalents 89,535 111,602 Total current assets 195,225 225,196 Non-current assets held for sale 840 - Total assets 929,954 996,060
Capital and reserves Share capital 11,696 11,696 Share premium 279,145 279,145 Common control transaction reserve (158,527) (158,527) Translation reserve (61,703) (57,233) Capital contribution 90,000 90,000 Retained earnings 259,142 230,036 Total capital and reserves 419,753 395,117 Minority interest 36,018 26,325 Total equity 455,771 421,442
Non-current liabilitiesBorrowings 268,394 321,318 Trade and other payables - 24,129 Deferred gains 261 508 Deferred tax liabilities 17,517 15,563 Total non-current liabilities 286,172 361,518
Current liabilitiesBorrowings 141,927 124,310 Trade and other payables 44,931 85,836 Deferred gains 493 920 Current income tax liabilities 660 2,034 Total current liabilities 188,011 213,100 Total equity and liabilities 929,954 996,060
(unaudited)

9Kld0265_Client_PPT_Pitchbook_Template.ppt9Kld0265_Client_PPT_Pitchbook_Template.ppt
PRO FORMA CONDENSED FINANCIALS
19
Pro Forma Income Statement (Unaudited)expressed in US$ thousands (unless indicated otherwise)
Globaltrans Investment Plc
OOO BaltTransServis
Adjustment for contribution Pro forma
Revenue 215,573 343,826 (2,766) 556,633Cost of sales (143,074) (291,790) 2,766 (432,098)Gross profit 72,499 52,036 - 124,535Selling, marketing and administrative expenses (18,897) (5,339) - (24,236)Other gains/(losses) – net 474 (576) - (102)Operating profit 54,076 46,121 - 100,197Finance income 695 89 - 784Dividends paid to participants - (26,060) 23,453 (2,607)Finance costs (45,197) (1,980) - (47,177)Finance costs – net (44,502) (27,951) 23,453 (49,000)Share of profit of associates 331 - - 331Profit before tax 9,905 18,170 23,453 51,528Income tax expense 1,048 (8,857) - (7,809)Profit after tax 10,953 9,313 23,453 43,719
Attributable to:Equity holders of the Company 6,370 - 17,686 24,056Minority Interest 4,583 - 15,080 19,663Participants - 9,313 (9,313) -Profit for the year 10,953 9,313 23,453 43,719
Six months ended 30 June 2009
Pro Forma Balance Sheet (Unaudited)expressed in US$ thousands (unless indicated otherwise)
Globaltrans Investment Plc
OOO BaltTransServis
Adjustment for contribution Pro forma
AssetsNon-current assetsProperty, plant and equipment 691,136 156,295 - 847,431Investments in associates 1,308 - - 1,308Trade and other receivables 14,190 - - 14,190Total non-current assets 706,634 156,295 - 862,929
Current assetsInventories 1,098 3,946 - 5,044Trade and other receivables 98,990 32,186 (976) 130,200Current income tax assets 6,468 19 - 6,487Cash and cash equivalents 64,216 8,835 - 73,051Total current assets 170,772 44,986 (976) 214,782Non-current assets held for sale 10,871 - - 10,871Total assets 888,277 201,281 (976) 1,088,582
Equity and liabilitiesCapital and reservesEquity attributable to the shareholders of the Company 380,295 - 80,838 461,133Minority interest in equity 31,208 - 64,671 95,879Total equity 411,503 - 145,509 557,012Net assets attributable to participants - 161,677 (145,509) 16,168
Non-current liabilitiesBorrowings 263,556 9,029 - 272,585Trade and other payables 11,974 617 - 12,591Deferred gains 629 - - 629Deferred income tax liabilities 13,576 318 - 13,894Total non-current liabilities 289,735 9,964 - 299,699
Current liabilitiesBorrowings 131,373 19,541 - 150,914Trade and other payables 55,309 6,791 (976) 61,124Deferred gains 325 - - 325Current income tax liabilities 32 3,308 - 3,340Total current liabilities 187,039 29,640 (976) 215,703Total liabilities, excluding net assets attributable to participants
476,774 39,604 (976) 515,402
Total equity and liabilities 888,277 201,281 (976) 1,088,582
As at 30 June 2009
(1) Pro Forma as Adjusted for the Contribution
1 1

9Kld0265_Client_PPT_Pitchbook_Template.ppt9Kld0265_Client_PPT_Pitchbook_Template.ppt
GLOBALTRANS – SELECTED OPERATIONAL INFORMATION
20
1. Rolling Stock Fleet 1H 2009 1H 2008 Change, %
1.1. Rolling stock owned and leased under finance lease (at period end)
Gondola (open top) cars 13,057 12,098 8%Rail tank cars 9,543 9,489 1%Hopper cars 1,101 712 55%Locomotives 26 26 0%Flat cars 78 0 0%Other cars 0 0 0%
23,805 22,325 7%1.2. Rolling stock leased under operating lease (at
period end)Gondola (open top) cars 1,856 2,526 -27%Rail tank cars 685 920 -26%Hopper cars 0 113 -100%Locomotives 1 1 0%Flat cars 0 0 0%Other cars 0 0
2,542 3,560 -29%
1.3. Total rolling stock owned and leased under operating and finance leases (at period end) 26,347 25,885 2%
1.4. Rolling stock leased out under operating lease (at period end)
Gondola (open top) cars 150 250 -40%Rail tank cars 4,839 5,353 -10%Hopper cars 690 373 85%Locomotives 18 18 0%Flat cars 0 0 0%Other cars 0 0 0%
5,697 5,994 -5%1.5. Average age of rolling stock owned and leased
under finance lease (at period end)Gondola (open top) cars 4.5 3.8 -Rail tank cars 4.7 3.8 -Hopper cars 1.9 1.2 -Locomotives 4.8 3.8 -Flat cars 0.3 0.0 -Other cars 0.0 0.0 -
4.5 3.7 -
2. Operation of rolling stock 1H 2009 1H 2008 Change, %
2.1. Freight Rail Turnover(1), billion tonnes-km 31.2 32.6 -4%
2.1.1. Freight Rail Turnover(1) by cargo type, billion tonnes-kmFerrous metal 16.7 13.3 26%Scrap metal 0.4 1.8 -76%Iron ore 1.9 2.3 -17%Oil and oil products 6.2 6.4 -3%Construction materials - crushed stone 0.4 0.6 -37%Construction materials - cement 0.4 1.5 -76%Construction materials - other 0.5 0.8 -44%Coal (coke and energy coal) 3.8 2.6 44%Other 0.9 3.1 -72%
2.2. Transportation Volume, million tonnes 16.0 16.8 -5%
2.2.1. Transporation Volume by cargo type, million tonnesFerrous metal 4.8 4.6 3%Scrap metal 0.9 1.6 -42%Iron ore 0.5 1.0 -50%Oil and oil products 4.6 4.8 -4%Construction materials - crushed stone 0.4 0.5 -33%Construction materials - cement 0.4 0.7 -35%Construction materials - other 0.3 0.4 -13%Coal (coke and energy coal) 3.0 1.7 79%Other 1.1 1.5 -30%
2.2.2. Transportation Volume by cargo classClass 1 38% 34% -Class 2 25% 26% -Class 3 37% 40% -
2.2.3. Average Rolling Stock Operated(2)
Gondola (open top) cars 14,460 14,514 0%Rail tank cars 5,189 5,196 0%Hopper cars 519 314 65%Locomotives 4 4 0%Other cars 21 19 12%
20,194 20,047 1%2.2.4. Average Number of "Loaded Trips" per Railcar(3)
Gondola (open top) cars 11.9 12.9 -8%Rail tank cars 14.6 15.1 -3%Hopper cars 8.8 12.2 -27%
12.5 13.5 -7%

9Kld0265_Client_PPT_Pitchbook_Template.ppt9Kld0265_Client_PPT_Pitchbook_Template.ppt
GLOBALTRANS – SELECTED OPERATIONAL INFORMATION (CONT’D)
21
Operation of rolling stock (continued from the previous page)
1H 2009 1H 2008 Change, %
2.3. Average Distance of Loaded Trip, kmGondola (open top) cars 2,260.6 2,213.5 2%Rail tank cars 1,370.0 1,320.0 4%Hopper cars 937.6 662.9 41%
1,969.4 1,930.7 2%2.4. Empty Run Ratio(4)
Gondola (open top) cars 54% 19% -Rail tank cars and hopper cars 96% 100% -Total Emtpy Run Ratio(5) 63% 36% -
2.5. Average Price per Trip(6), USD 590.2 812.2 -27%
2.6. Net Revenue from Operation of Rolling Stock(7) by cargo type, million USDFerrous metal 72.0 82.6 -13%Scrap metal 2.8 17.0 -83%Iron ore 3.9 8.2 -52%Oil and oil products 44.2 68.8 -36%Coal (coke and energy coal) 10.7 8.9 20%Construction materials (incl. cement) 4.2 13.4 -69%Other 11.4 20.5 -45%
149.2 219.3 -32%2.7. Net Revenue from Operation of Rolling Stock(7) by
cargo classClass 1 17% 23% -Class 2 22% 29% -Class 3 60% 48% -
2.8. Net Revenue from Operation of Rolling Stock(7) by largest clients(8)
Severstal 7% 11% -MMK 21% 13% -Evraz 18% 10% -Ural steel 1% 2% -Mechel 1% 0% -Rosneft 2% 3% -Lukoil 20% 21% -RITEK 4% 6% -Other (small and medium size clients) 25% 34% -
2.9. Empty Run Costs(9), million USD 45.6 39.3 16%
2.10. Share of empty run kilometers paid by Globaltrans(10)
75% 62% 21%
3. Employees 1H 2009 1H 2008 Change, %
3.1. Employees by departments (simplified)Operations(11) 321 360 -11%Administrative(12) 213 189 13%
534 549 -3%
4. Notes(1)
(2)
(3)
(4)
(5)
(6)
(7)
(8)
(9)
(10)
(11)
(12)
Total Empty Run Ratio is calculated as total kilometers travelled empty divided by kilometers travelled loaded by the rolling stock fleet operated by Globaltrans (excluding fleet leased out) in the reporting period.
Average Price per Trip (USD) is calculated as Net Revenue from Operation of Rolling Stock divided by total number of loaded trips during the relevant period.
Net Revenue from Operation of Rolling Stock (Non-IFRS measure) is defined as revenue from railway transportation operators services less infrastructure and locomotive tariffs: loaded trips, it excludes the impact of the acquisition and consolidation of AS Spacecom and AS Intopex Trans both in 1H 2008 and 1H 2009 .
Largest clients defined as clients, as well as their affiliates and suppliers.
Empty Run Costs (Non-IFRS measure) are derived from management accounts and presented as the part of the “Empty run trips and services provided by other transportation organizations” component of cost of sales reported under EU IFRS. Empty Run Costs excludes the impact of the acquisition and consolidation of AS Spacecom and AS Intopex Trans both in 1H 2008 and 1H 2009.
Share of empty run kilometers paid by Globaltrans (in %).
Includes commercial, transport and transport management, IT, marketing and development, OAO "Russian Railways" liaison and logistics departments and local offices.
Includes employees of the administration, accounting and finance, public relations and other departments.
Freight Rail Turnover is a measure of freight carriage activity over a particular period calculated as sum of tonnage of each loaded trip multiplied by the distance of each loaded trip, expressed in tonnes-km.
Average Rolling Stock Operated is calculated as the average weighted (by days) number of railcars available for operator services (not including rolling stock in maintenance, purchased rolling stock in transition to its first place of commercial utilisation or rolling stock leased out).
Average Number of "Loaded Trips" per Railcar is calculated as the total number of loaded trips in the relevant year divided by Average Rolling Stock Operated.
Empty Run Ratio is calculated as a total of empty trips in kilometres by respective rolling stock type divided by a total of loaded trips in kilometres of such rolling stock type. Empty trips are only applicable to rolling stock operated (not including rolling stock in maintenance, purchased rolling stock in transition to its first place of commercial utilisation or rolling stock leased out).

9Kld0265_Client_PPT_Pitchbook_Template.ppt
GLOBALTRANS SHAREHOLDER STRUCTURE
22
OWNERSHIP STRUCTURE (as of end of 2009)
Globaltrans Investment PLC(Cyprus)
14.7%2
Envesta Investments Limited (EIL) is beneficially owned by two individuals:
- Sergey Maltsev (51% stake), Chief Executive Officer, Member of the Board of Directors, Globaltrans
- Alexander Eliseev (49% stake), Chairman of the Board of Directors, Globaltrans
Transportation Investments Holding Limited (Cyprus) Free FloatEnvesta Investments
Limited (Cyprus)
50.1%1 35.2%
TIHL BACKGROUND ENVESTA INVESTMENTS BACKGROUND
(1) Includes 5 ordinary shares held by companies affiliated with TIHL and wholly owned by the beneficial owners of TIHL.(2) Includes 430,000 GDRs owned by entities controlled by the beneficial owners of EIL.
Transportation Investments Holding Limited (TIHL) is one of the largest privately-owned transportation groups in Russia, the CIS and the Baltic Region with strategic interests in rail transportation and port operations and carries on business under the name of N-Trans.
Nikita Mishin, Konstantin Nikolaev and Andrey Filatov jointly control TIHL.

9Kld0265_Client_PPT_Pitchbook_Template.ppt 23
INVESTOR RELATIONS Priit PedajaMikhail Perestyuk
Phone: +357 25 503 153 E-mail: [email protected]: www.globaltrans.com


