22
Company Presentation Mensch und Maschine Software SE August 2008

CompanyPresentation
Mensch und Maschine Software SE
August 2008

Business model
Mensch und Maschine Software SEis one of the leading vendors of CAD/CAM solutions in Europe(CAD/CAM = Computer Aided Design/Manufacturing)
Well balanced business model within the CAD/CAM market in three respects:
Geographical markets Customers and industry segments Product portfolio

Business model Geographical markets:
Market access in 16 European countries
New since February 2008: Romania
Additional sales offices in the USA, APAC and Japan
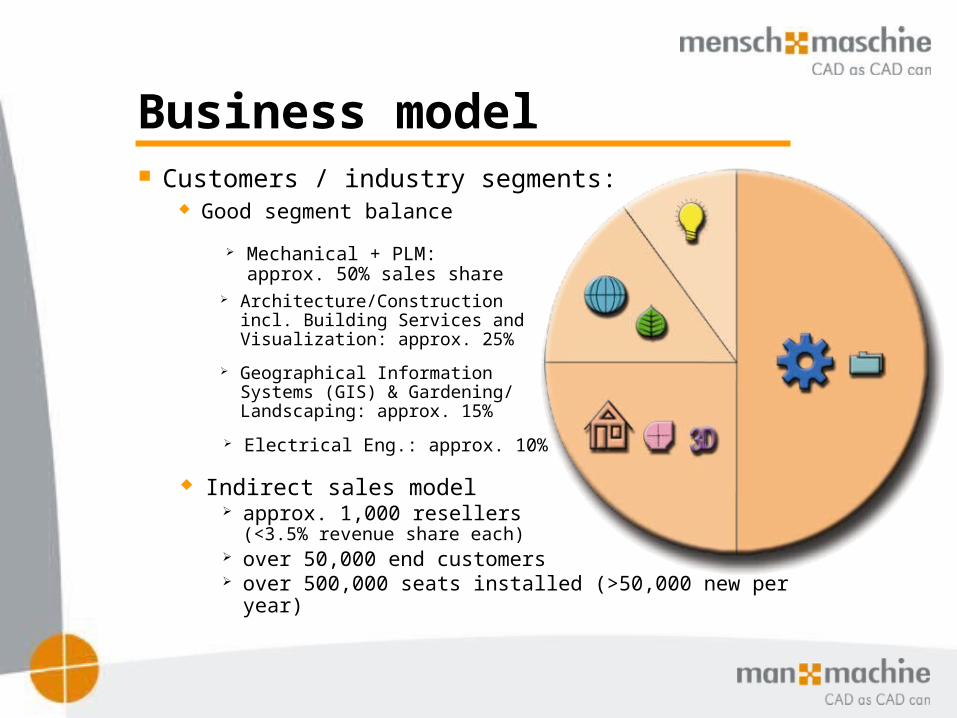
Business model Customers / industry segments:
Good segment balance Mechanical + PLM:
approx. 50% sales share Architecture/Construction
incl. Building Services and Visualization: approx. 25%
Geographical Information Systems (GIS) & Gardening/ Landscaping: approx. 15%
Electrical Eng.: approx. 10%
Indirect sales model approx. 1,000 resellers
(<3.5% revenue share each) over 50,000 end customers over 500,000 seats installed (>50,000 new per year)

Business model Product portfolio: Software development/distribution balance
M+M Software development (M+M Technology) Concentration on applications in addition to CAD standards High gross margin ~90%, 2007 EBIT margin 16.6% (potential 20-25%) Important for differentiation and profile in the CAD/CAM market
Value-Added Software Distribution (Trading products) Concentration on CAD market leader Autodesk High sales, gross margin ~16%, 2007 EBIT margin 3.2% (potential 4-5%) Important for market position
Gross margin mix: ~44% M+M software / ~56% Distribution
Approx. 2/3 sales new business + 1/3 recurring business
Wide price/performance range: Software from 100 Euro to more than 100,000 Euro per seat

Target market
Market volume CAD/CAM Software&Services: Worldwide > 10 bln EUR
(Sources: Daratech, Dressler-Verlag, own research)
Europe: > 3 bln EUR Market share M+M in Europe:
directly approx. 7% indirectly approx. 15% (end customer sales by resellers)
Market growth / market development: Solid market growth 5-10% p.a. M+M well positioned in growth segments e.g.:
Indirect sales / mid price systems CAM (highly innovative 5 axis milling)

History & Culture
M+M was founded in 1984 by Adi Drotleff 24 years of market experience / developed market position Public since 1997 / Listing in Prime standard
Developed Corporate Culture Employees in the M+M group are „Co-Entrepreneurs“
(profit oriented remuneration, options, decision making processes)
Low fluctuation & sickness rate
Experienced Management Team Most members are >10 years in the company Strong 2nd/3rd management level

M+M is European SE Since 12/2006, MuM is SE (Societas Europaea)
Seated in seven EU states, M+M already has the target SE structure – simple conversion was possible (Art 2 (4) EU-D. 2157)
Monistic board system Ideal board structure for entrepreneurial public company with a
shareholders‘ meeting majority held by management board Administrative Board: Adi Drotleff, Norbert Kopp, Thomas Becker Managing Directors: Adi Drotleff (CEO), Werner Schwenkert
(CTO), Peter Schützenberger (CFO), Michael Endres (Marketing), Jens Jansen (CIO)
M+M SE is pure group holding Operating business through subsidiaries
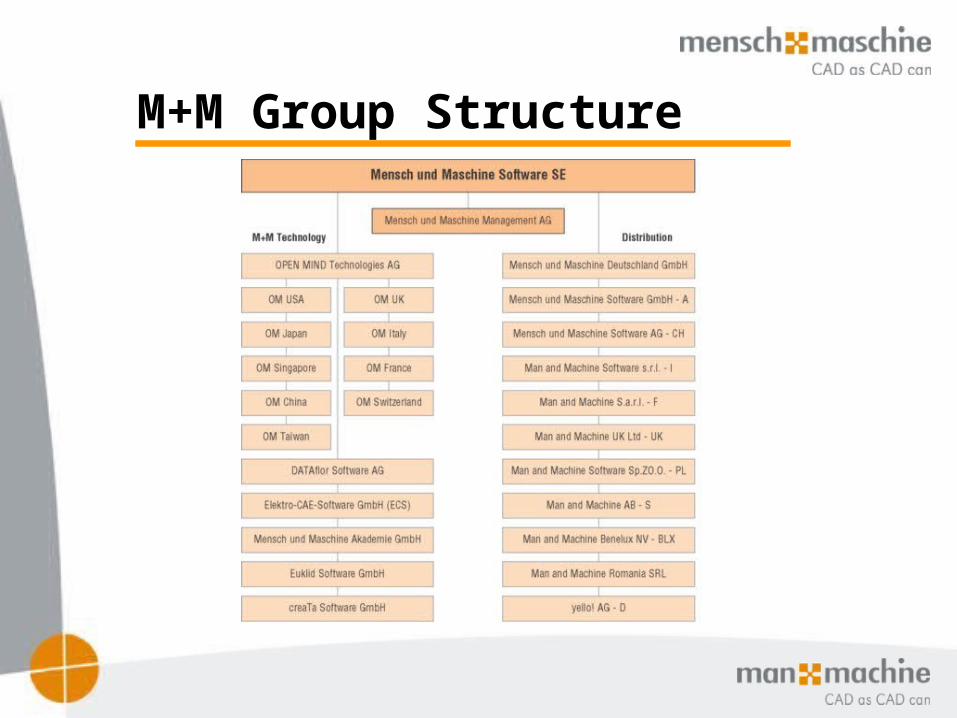
M+M Group Structure

Marketing Instruments Strong presence at trade shows:
2007: 47 shows in 14 countries
Live presentations via Internet 2007: ~600 presentations with
approx. 3,000 attendees Rapidly growing trend
Prospects database / CRM approx. 150,000 addresses Lead qualification (Telemarketing) Highly developed lead management dealers/endusers
approx. 10,000 qualified leads per yearpassed on to authorized dealers
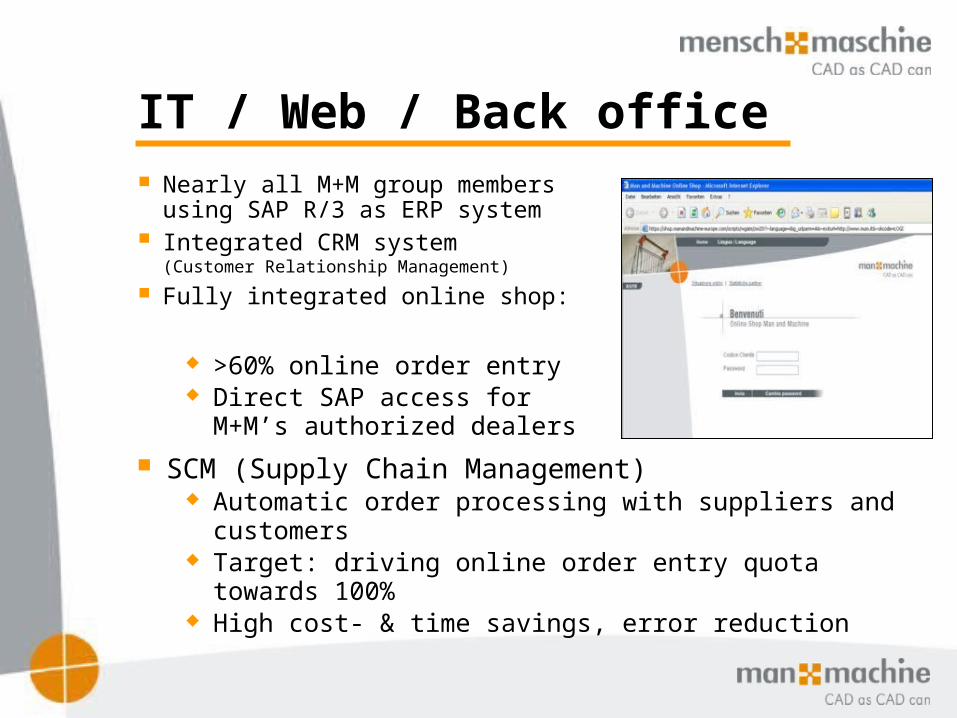
IT / Web / Back office Nearly all M+M group members
using SAP R/3 as ERP system Integrated CRM system
(Customer Relationship Management)
Fully integrated online shop: >60% online order entry Direct SAP access for
M+M’s authorized dealers
SCM (Supply Chain Management) Automatic order processing with suppliers and customers Target: driving online order entry quota towards 100% High cost- & time savings, error reduction

Autodesk to buy ecscad
Adhoc news August 20, 2008: Autodesk to buy ecscad technology from M+M
After Compass, C-Plan and RoCAD, ecscad is the fourth application technology Autodesk acquires from M+M
Only development and IP is sold to Autodesk, M+M continues to actively market and sell ecscad
– No material impact on future sales and earnings
Purchase price represents ~2.5x annual sales Estimated net cash inflow 2008 approx. EUR 2.5 mln
(after minority shares and escrow)
Estimated pretax disinvestment profit 2008 approx. EUR 2.0 mln
Closing scheduled for Q3/2008

Sales development Sales 2007: EUR 212.9 mln / +25%
CAGR 1997-2007: 15% p.a. Sales per share more than doubled:
1997: EUR 6.67 / 2007: EUR 16.64 International sales grew from
25% to 75% since 1997
0
25
50
75
100
125
150
175
200
225
97 98 99 00 01 02 03 04 05 06 07
Internat'lGermany
0
25
50
75
100
125
150
175
200
225
97 98 99 00 01 02 03 04 05 06 07
Internat'lGermany
+15%
p.a.
Quarterly seasonality 2007: Q1 with positive non-recurring effects Q4 slightly slower than normal
Sales 2008: Q1: EUR 67.0 mln / +4% Q2: EUR 52.6 mln / +15% 1-6: EUR 119.6 mln / +9% 0
25
50
75
Q1 Q2 Q3 Q4
200620072008
0
25
50
75
Q1 Q2 Q3 Q4
200620072008
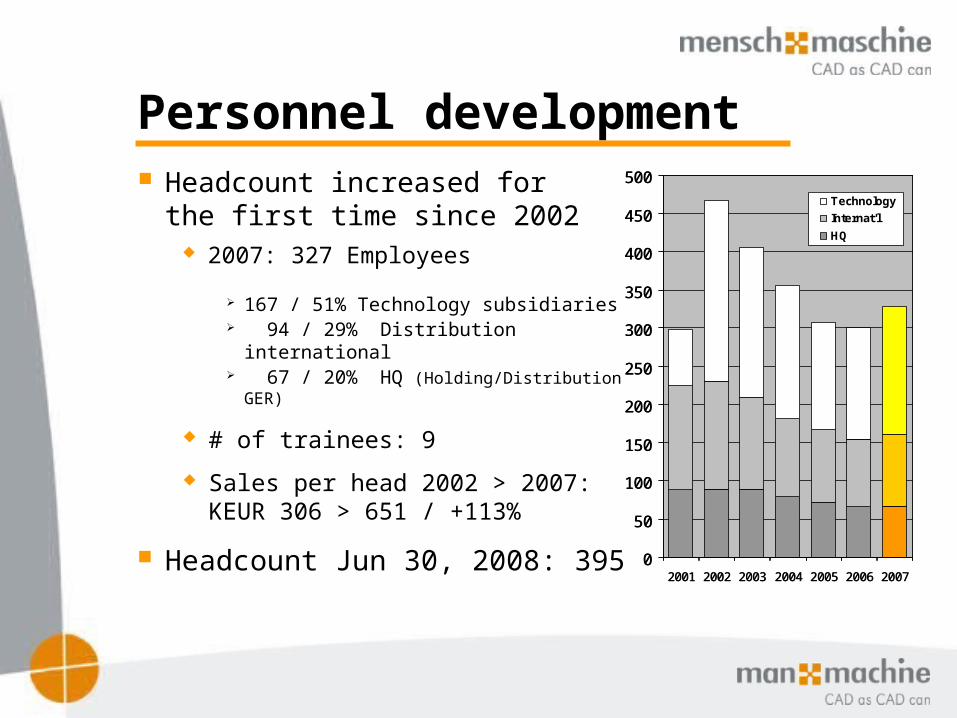
Personnel development Headcount increased for the
first time since 2002 2007: 327 Employees
167 / 51% Technology subsidiaries 94 / 29% Distribution international 67 / 20% HQ (Holding/Distribution GER)
# of trainees: 9
Sales per head 2002 > 2007: KEUR 306 > 651 / +113%
Headcount Jun 30, 2008: 395 0
50
100
150
200
250
300
350
400
450
500
2001 2002 2003 2004 2005 2006 2007
Technology
Internat'l
HQ
0
50
100
150
200
250
300
350
400
450
500
2001 2002 2003 2004 2005 2006 2007
Technology
Internat'l
HQ

Development of expenses 2002-2005, operating expense base
was lowered by approx. EUR 10 mln
2007: Opex EUR 45.5 mln Sales&Marketing: EUR 28.1 mln / +7% General&Admin: EUR 10.1 mln / +12% Development: EUR 7.3 mln / +22%
Attention: R&D expenses only occur for software development segment, not for trading segment
No capitalization of development costs according to IAS 38.45
Software library including many hundred man years of invested development is a hidden reserve
1-6/2008: Opex +9%
S&M62%
G&A22%
R&D16%
0
10
20
30
40
50
60
01 02 03 04 05 06 07
R&DG&AS&M
0
10
20
30
40
50
60
01 02 03 04 05 06 07
R&DG&AS&M

Profit development Operating profit EBITA 2007
EUR 10.0 mln (PY: 6.8 / +47%) EBITA margin 4.7% (PY: 4.0%) Quarterly seasonality following sales EBITDA 2007: EUR 10.9 mln (PY: 7.7)
0
2
4
6
8
10
12
2005 2006 2007
EBITA
Netto
Net earnings 2007 nearly doubled:EUR 6.1 mln (PY: 3.2)
Per share: EUR 0.47 (PY: 0.24) Dividend (tax free): EUR 0.20 (PY: 0.15)
Results 1-6/2008: EBITA: EUR 6.04 mln / +4% (Q2: +30%) Net: EUR 3.71 mln / +7% (Q2: +29%) Best first half year in company history
0
2
4
6
8
10
12
2005 2006 2007
EBITA
Netto
0
2
4
6
8
10
12
2005 2006 2007
EBITA
Netto
0
1
2
3
4
5
Q1 Q2 Q3 Q4
200620072008
0
1
2
3
4
5
Q1 Q2 Q3 Q4
200620072008
0
10
20
30
40
2001 2002 2003 2004 2005 2006 2007
50
60
70
80
90
2001 2002 2003 2004 2005 2006 2007
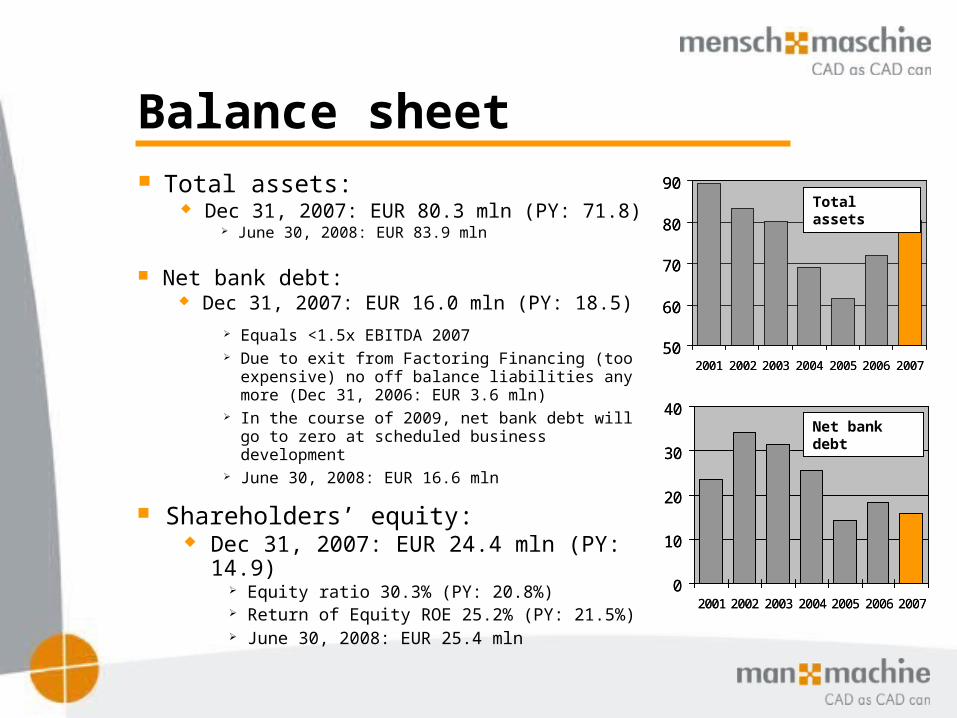
Balance sheet Total assets:
Dec 31, 2007: EUR 80.3 mln (PY: 71.8) June 30, 2008: EUR 83.9 mln
Net bank debt: Dec 31, 2007: EUR 16.0 mln (PY: 18.5)
Equals <1.5x EBITDA 2007 Due to exit from Factoring Financing (too
expensive) no off balance liabilities any more (Dec 31, 2006: EUR 3.6 mln)
In the course of 2009, net bank debt will go to zero at scheduled business development
June 30, 2008: EUR 16.6 mln
Shareholders’ equity: Dec 31, 2007: EUR 24.4 mln (PY: 14.9)
Equity ratio 30.3% (PY: 20.8%) Return of Equity ROE 25.2% (PY: 21.5%) June 30, 2008: EUR 25.4 mln
50
60
70
80
90
2001 2002 2003 2004 2005 2006 2007
0
10
20
30
40
2001 2002 2003 2004 2005 2006 2007
Total assets
Net bank debt
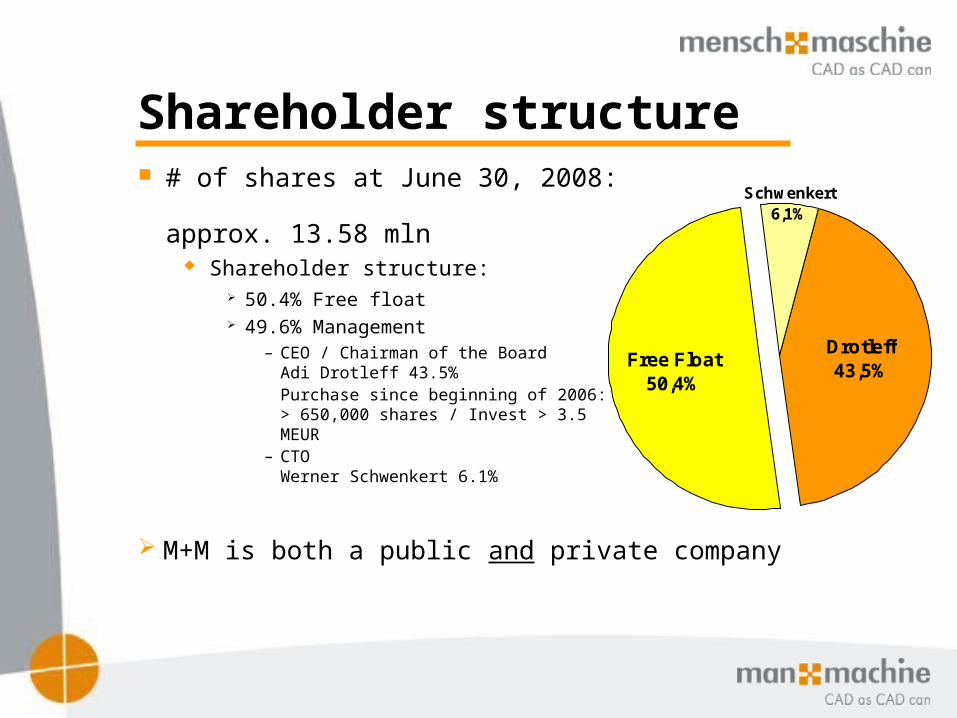
Shareholder structure # of shares at June 30, 2008:
approx. 13.58 mln Shareholder structure:
50.4% Free float 49.6% Management
– CEO / Chairman of the Board Adi Drotleff 43.5%Purchase since beginning of 2006:> 650,000 shares / Invest > 3.5 MEUR
– CTO Werner Schwenkert 6.1%
M+M is both a public and private company
Schwenkert6,1%
Free Float50,4%
Drotleff43,5%

Investor Relations Designated Sponsors:
LBBW, Stuttgart Close Seydler, Frankfurt
Analyst coverage: LBBW: „Buy“ - fair value EUR 7.60 Independent Research: „Buy“ - fair value EUR 7.70 SES Research: „Buy“ - fair value EUR 7.00 Performaxx: „Buy“ – fair value EUR 9.62 GSC Research: „Buy“ – fair value EUR 7.50
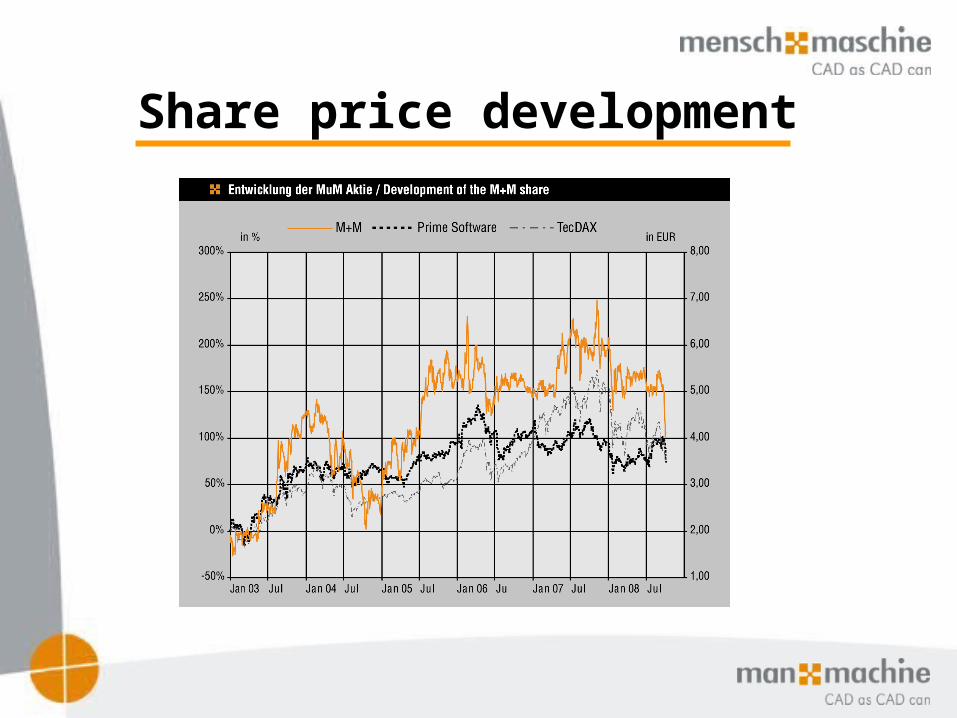
Share price development

Outlook Mid term goal: Moderate sales growth /
focus on improvement of profit margin Targets 2008:
Sales: EUR ~240 mln / ~+13% EBITA margin ~5.5% (2007: 4.7%)
EUR ~13 mln / ~+30% Net profit: EUR ~8.6 mln / ~+40%
approx. EUR 0.62 per share Dividend EUR 0.25 per share (tax free)
Targets 2009: Sales: EUR ~275 mln / ~+15% EBITA: EUR ~16.5 mln / margin ~6.0% Net profit: EUR ~11.6 mln / ~+35%
approx. EUR 0.84 per share Dividend EUR 0.30 per share (tax free)
0
50
100
150
200
250
300
2005 2006 2007 08E 09E
0
4
8
12
16
20
2005 2006 2007 08E 09E
EBITA
Netto
0
50
100
150
200
250
300
2005 2006 2007 08E 09E0
50
100
150
200
250
300
2005 2006 2007 08E 09E
0
4
8
12
16
20
2005 2006 2007 08E 09E
EBITA
Netto
0
4
8
12
16
20
2005 2006 2007 08E 09E
EBITA
Netto
0
4
8
12
16
20
2005 2006 2007 08E 09E
EBITA
Netto
0
4
8
12
16
20
2005 2006 2007 08E 09E
EBITA
Netto
Sales
Investment Highlights
Mensch und Maschine is: Established in the CAD/CAM market for 24 years Both a public and private company
Mensch und Maschine has: A good market position in a growth market A well balanced business model A consolidated growth story A profit margin potential for further improvement A conservative market valuation (P/S <0.4 / P/E08E <10) A good dividend yield (2008E: ~4.5-5.0% net)


