77
Company Presentation AUGUST 2018
Company Presentation
AUGUST 2018
Cautionary Statement
This presentation includes "forward-looking statements". Such forward-looking statements are subject to a number of risks and uncertainties, many of which are beyond AR’s control. All statements, except for statements of historical fact, made in this release regarding activities, events or developments AR expects, believes or anticipates will or may occur in the future, such as those regarding future commodity prices, future production targets, completion of natural gas or natural gas liquids transportation projects, future earnings, Consolidated Adjusted EBITDAX, Stand-Alone E&P Adjusted EBITDAX, Consolidated Adjusted Operating Cash Flow, Stand-Alone Adjusted Operating Cash Flow, Free Cash Flow, future capital spending plans, improved and/or increasing capital efficiency, continued utilization of existing infrastructure, gas marketability, estimated realized natural gas, natural gas liquids and oil prices, acreage quality, access to multiple gas markets, expected drilling and development plans (including the number, type, lateral length and location of wells to be drilled, the number and type of drilling rigs and the number of wells per pad), projected well costs, future financial position, future technical improvements and future marketing opportunities, are forward-looking statements within the meaning of Section 27A of the Securities Act of 1933 and Section 21E of the Securities Exchange Act of 1934. All forward-looking statements speak only as of the date of this release. Although Antero believes that the plans, intentions and expectations reflected in or suggested by the forward-looking statements are reasonable, there is no assurance that these plans, intentions or expectations will be achieved. Therefore, actual outcomes and results could materially differ from what is expressed, implied or forecast in such statements.
AR cautions you that these forward-looking statements are subject to all of the risks and uncertainties, most of which are difficult to predict and many of which are beyond the AR’s control, incident to the exploration for and development, production, gathering and sale of natural gas, NGLs and oil. These risks include, but are not limited to, commodity price volatility, inflation, lack of availability of drilling and production equipment and services, environmental risks, drilling and other operating risks, regulatory changes, the uncertainty inherent in estimating natural gas and oil reserves and in projecting future rates of production, cash flow and access to capital, the timing of development expenditures, and the other risks described under the heading "Item 1A. Risk Factors" in AR’s Annual Report on Form 10-K for the year ended December 31, 2017.
Any forward-looking statement speaks only as of the date on which such statement is made and the Company undertakes no obligation to correct or update any forward-looking statement, whether as a result of new information, future events or otherwise, except as required by applicable law.
This presentation includes certain financial measures that are not calculated in accordance with U.S. generally accepted accounting principles (―GAAP‖). These measures include (i) Consolidated Adjusted EBITDAX, (ii) Stand-Alone E&P Adjusted EBITDAX, (iii) Consolidated Adjusted Operating Cash Flow, (iv) Stand-Alone E&P Adjusted Operating Cash Flow, (v) Free Cash Flow. Please see ―Antero Definitions‖ and ―Antero Non-GAAP Measures‖ for the definition of each of these measures as well as certain additional information regarding these measures, including the most comparable financial measures calculated in accordance with GAAP.
ANTERO RESOURCES | AUGUST 2018 PRESENTATION
Antero Resources Corporation is denoted as ―AR‖ in the presentation, Antero Midstream Partners LP is denoted
as ―AM‖ and Antero Midstream GP LP is denoted as ―AMGP‖, which are their respective
New York Stock Exchange ticker symbols.
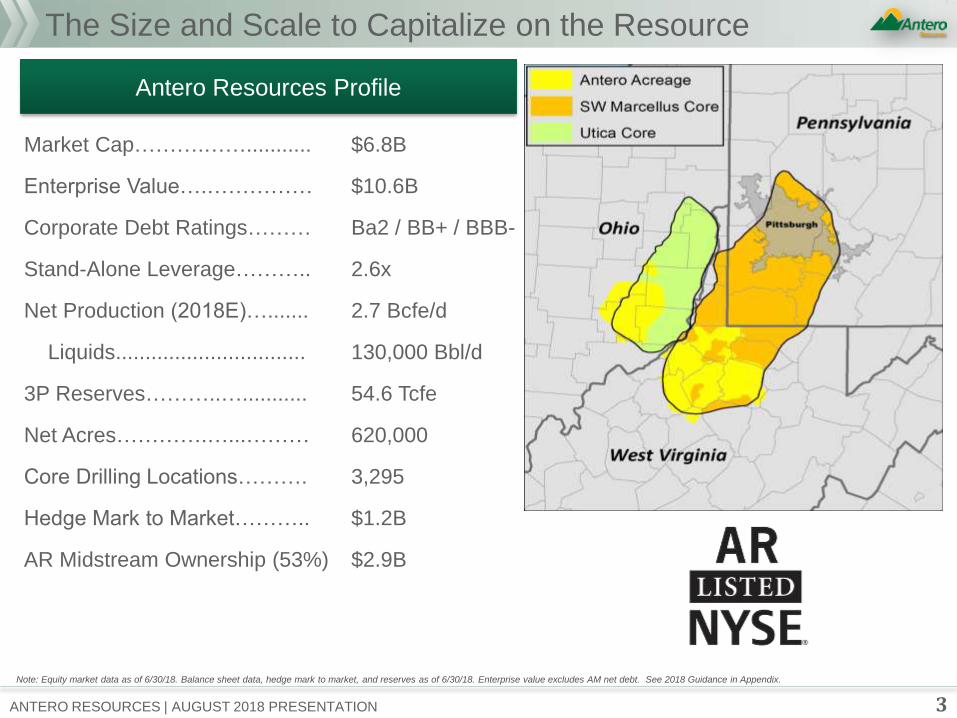
The Size and Scale to Capitalize on the Resource
3 ANTERO RESOURCES | AUGUST 2018 PRESENTATION
Market Cap……….……...........
Enterprise Value….……………
Corporate Debt Ratings………
Stand-Alone Leverage………..
Net Production (2018E)….......
Liquids................................
3P Reserves………..…...........
Net Acres………….…...………
Core Drilling Locations……….
Hedge Mark to Market………..
AR Midstream Ownership (53%)
$6.8B
$10.6B
Ba2 / BB+ / BBB-
2.6x
2.7 Bcfe/d
130,000 Bbl/d
54.6 Tcfe
620,000
3,295
$1.2B
$2.9B
Note: Equity market data as of 6/30/18. Balance sheet data, hedge mark to market, and reserves as of 6/30/18. Enterprise value excludes AM net debt. See 2018 Guidance in Appendix.
Antero Resources Profile
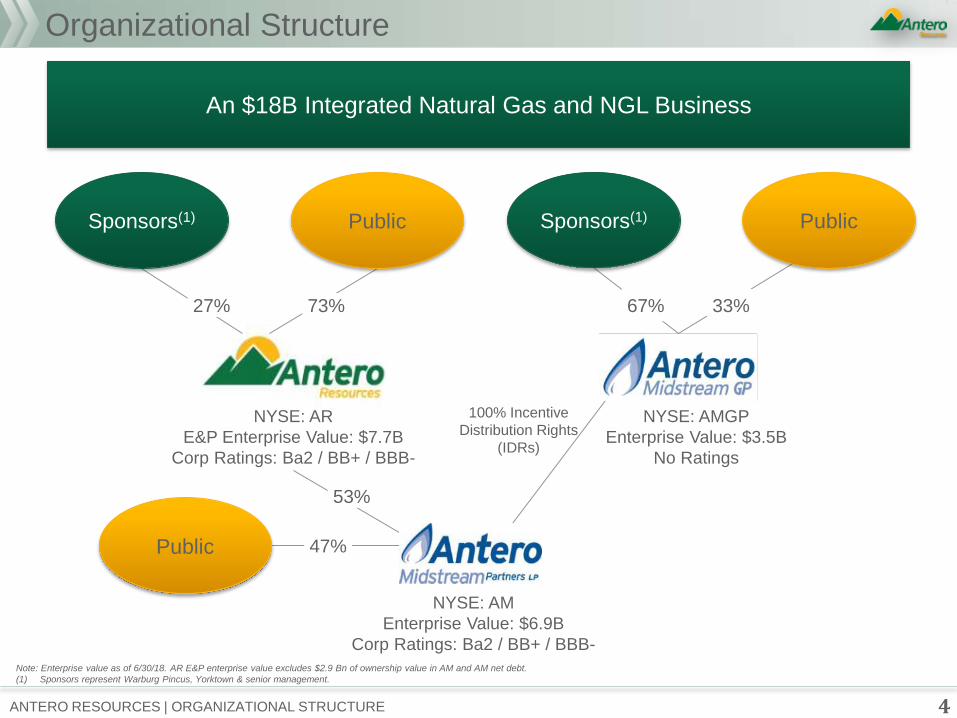
An $18B Integrated Natural Gas and NGL Business
Organizational Structure
4 ANTERO RESOURCES | ORGANIZATIONAL STRUCTURE
Note: Enterprise value as of 6/30/18. AR E&P enterprise value excludes $2.9 Bn of ownership value in AM and AM net debt.
(1) Sponsors represent Warburg Pincus, Yorktown & senior management.
100% Incentive
Distribution Rights
(IDRs)
NYSE: AMGP
Enterprise Value: $3.5B
No Ratings
NYSE: AM
Enterprise Value: $6.9B
Corp Ratings: Ba2 / BB+ / BBB-
NYSE: AR
E&P Enterprise Value: $7.7B
Corp Ratings: Ba2 / BB+ / BBB-
67% 33%
Sponsors(1) Sponsors(1)
53%
27% 73%
47% Public
Public Public
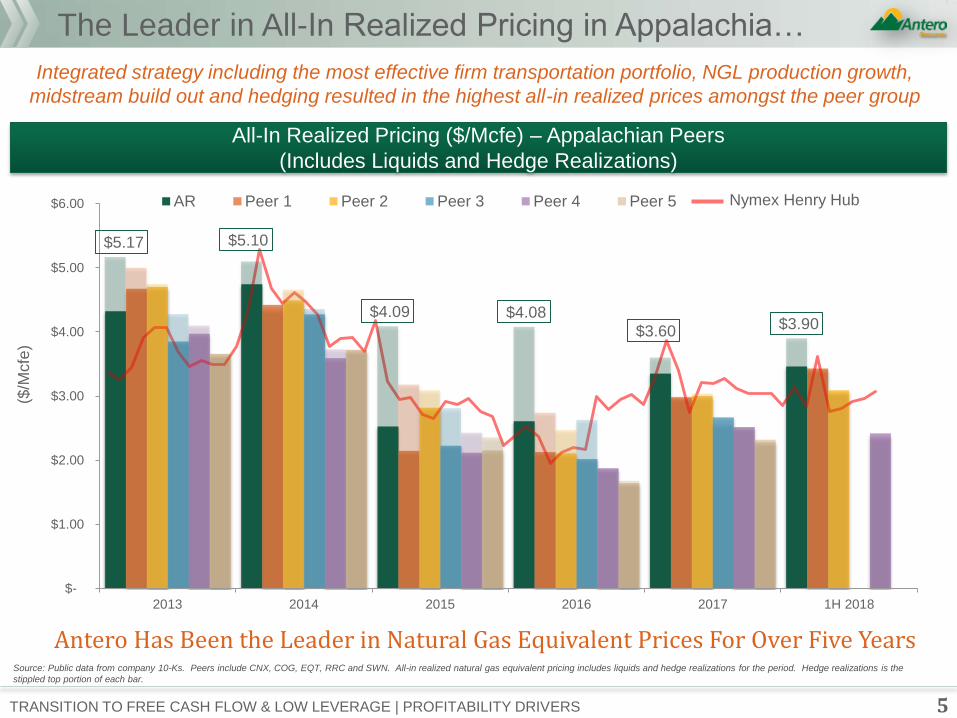
AR Peer 1 Peer 2 Peer 3 Peer 4 Peer 5
$5.17 $5.10
$4.09 $4.08
$3.60 $3.90
$-
$1.00
$2.00
$3.00
$4.00
$5.00
$6.00
2013 2014 2015 2016 2017 1H 2018
Source: Public data from company 10-Ks. Peers include CNX, COG, EQT, RRC and SWN. All-in realized natural gas equivalent pricing includes liquids and hedge realizations for the period. Hedge realizations is the
stippled top portion of each bar.
Integrated strategy including the most effective firm transportation portfolio, NGL production growth,
midstream build out and hedging resulted in the highest all-in realized prices amongst the peer group
The Leader in All-In Realized Pricing in Appalachia…
5 TRANSITION TO FREE CASH FLOW & LOW LEVERAGE | PROFITABILITY DRIVERS
Antero Has Been the Leader in Natural Gas Equivalent Prices For Over Five Years
($/M
cfe
)
Nymex Henry Hub
All-In Realized Pricing ($/Mcfe) – Appalachian Peers
(Includes Liquids and Hedge Realizations)
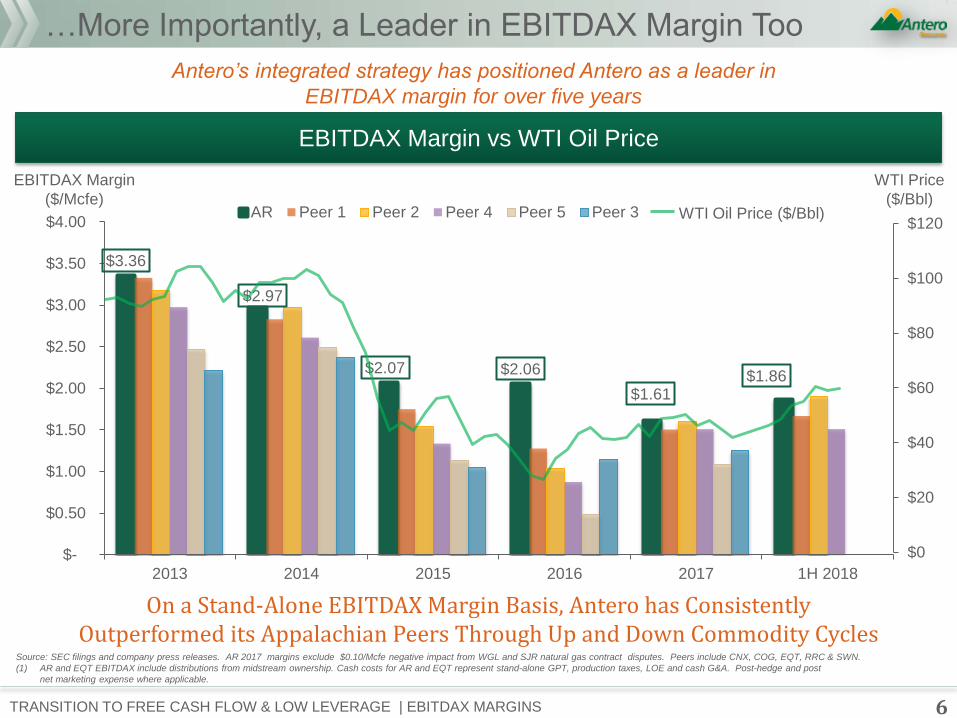
$3.36
$2.97
$2.07 $2.06
$1.61 $1.86
$-
$0.50
$1.00
$1.50
$2.00
$2.50
$3.00
$3.50
$4.00
2013 2014 2015 2016 2017 1H 2018
AR Peer 1 Peer 2 Peer 4 Peer 5 Peer 3
EBITDAX Margin
($/Mcfe)
6 TRANSITION TO FREE CASH FLOW & LOW LEVERAGE | EBITDAX MARGINS
…More Importantly, a Leader in EBITDAX Margin Too
On a Stand-Alone EBITDAX Margin Basis, Antero has Consistently Outperformed its Appalachian Peers Through Up and Down Commodity Cycles
Antero’s integrated strategy has positioned Antero as a leader in
EBITDAX margin for over five years
Source: SEC filings and company press releases. AR 2017 margins exclude $0.10/Mcfe negative impact from WGL and SJR natural gas contract disputes. Peers include CNX, COG, EQT, RRC & SWN.
(1) AR and EQT EBITDAX include distributions from midstream ownership. Cash costs for AR and EQT represent stand-alone GPT, production taxes, LOE and cash G&A. Post-hedge and post
net marketing expense where applicable.
WTI Price
($/Bbl) WTI Oil Price ($/Bbl)
$0
$20
$40
$60
$80
$100
$120
EBITDAX Margin vs WTI Oil Price
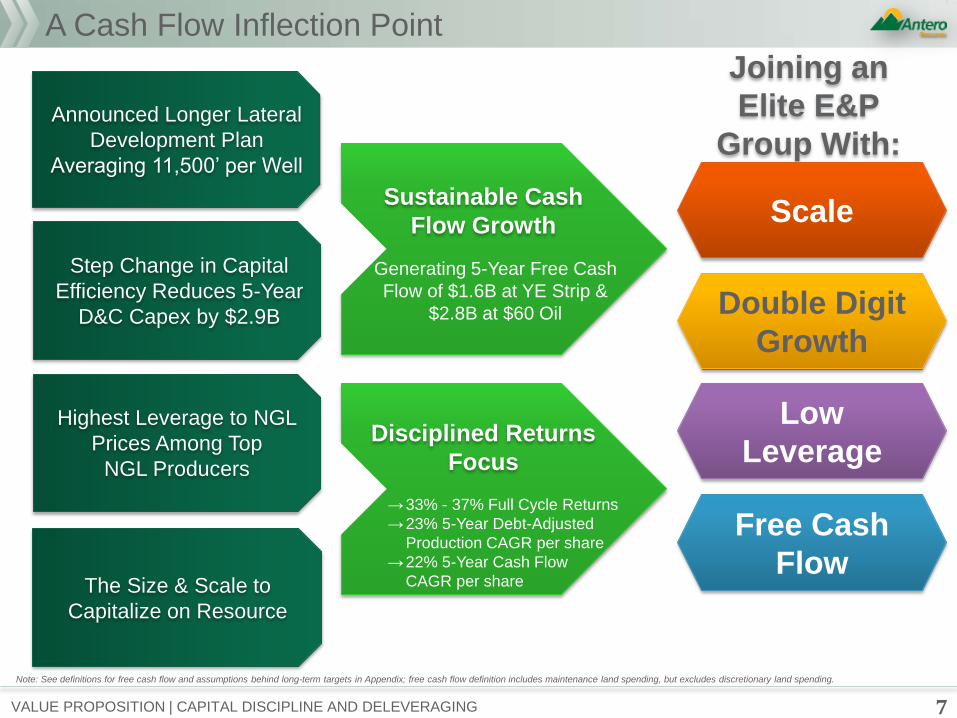
A Cash Flow Inflection Point
7
Step Change in Capital
Efficiency Reduces 5-Year
D&C Capex by $2.9B
The Size & Scale to
Capitalize on Resource
Announced Longer Lateral
Development Plan
Averaging 11,500’ per Well
Highest Leverage to NGL
Prices Among Top
NGL Producers
Sustainable Cash
Flow Growth
Generating 5-Year Free Cash
Flow of $1.6B at YE Strip &
$2.8B at $60 Oil
Joining an
Elite E&P
Group With:
Scale
Double Digit
Growth
Free Cash
Flow
Low
Leverage Disciplined Returns
Focus
→33% - 37% Full Cycle Returns
→23% 5-Year Debt-Adjusted
Production CAGR per share
→22% 5-Year Cash Flow
CAGR per share
Note: See definitions for free cash flow and assumptions behind long-term targets in Appendix; free cash flow definition includes maintenance land spending, but excludes discretionary land spending.
VALUE PROPOSITION | CAPITAL DISCIPLINE AND DELEVERAGING
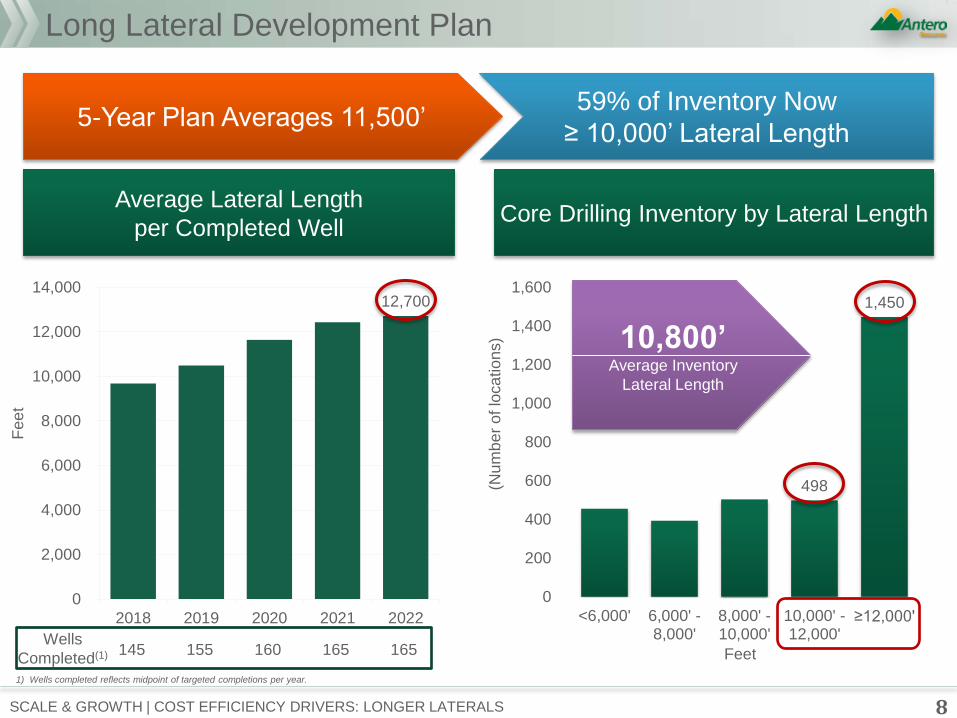
Long Lateral Development Plan
8 SCALE & GROWTH | COST EFFICIENCY DRIVERS: LONGER LATERALS
59% of Inventory Now
≥ 10,000’ Lateral Length 5-Year Plan Averages 11,500’
Average Lateral Length
per Completed Well Core Drilling Inventory by Lateral Length
10,800’ Average Inventory
Lateral Length
12,700
0
2,000
4,000
6,000
8,000
10,000
12,000
14,000
2018 2019 2020 2021 2022
145 155 160 165 165 Wells
Completed(1)
498
1,450
0
200
400
600
800
1,000
1,200
1,400
1,600
<6,000' 6,000' -8,000'
8,000' -10,000'
10,000' -12,000'
≥12,000'
Feet
Fee
t
(Num
be
r o
f lo
ca
tio
ns)
1) Wells completed reflects midpoint of targeted completions per year.
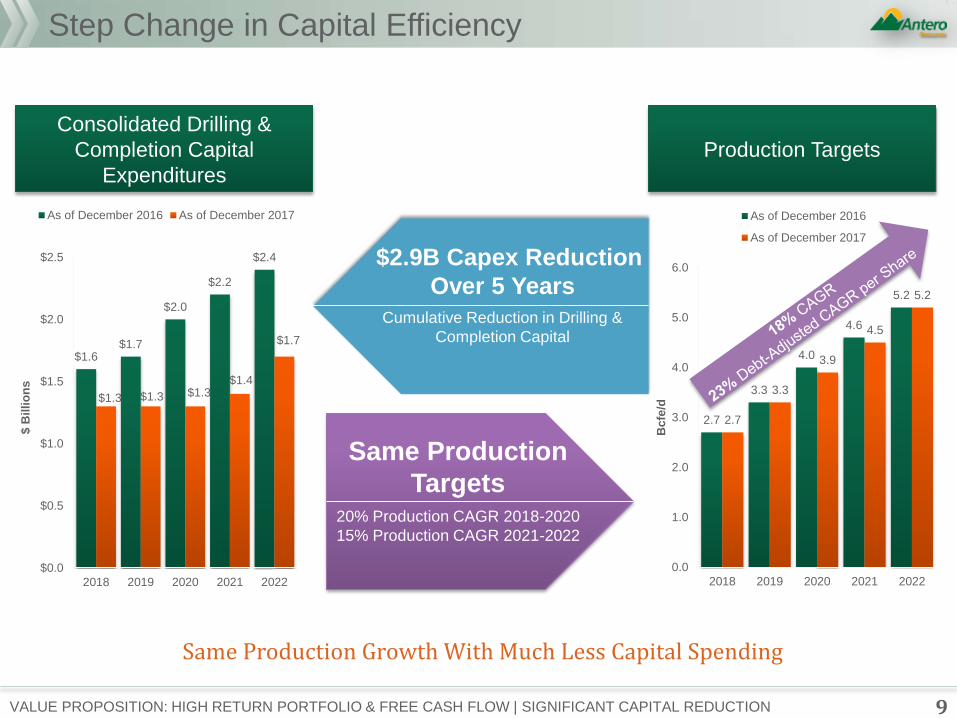
Step Change in Capital Efficiency
Consolidated Drilling &
Completion Capital
Expenditures
Production Targets
2.7
3.3
4.0
4.6
5.2
2.7
3.3
3.9
4.5
5.2
0.0
1.0
2.0
3.0
4.0
5.0
6.0
2018 2019 2020 2021 2022
Bcfe
/d
As of December 2016
As of December 2017
9 VALUE PROPOSITION: HIGH RETURN PORTFOLIO & FREE CASH FLOW | SIGNIFICANT CAPITAL REDUCTION
$2.9B Capex Reduction
Over 5 Years
Cumulative Reduction in Drilling &
Completion Capital
Same Production
Targets 20% Production CAGR 2018-2020
15% Production CAGR 2021-2022
Same Production Growth With Much Less Capital Spending
$1.6 $1.7
$2.0
$2.2
$2.4
$1.3 $1.3 $1.3 $1.4
$1.7
$0.0
$0.5
$1.0
$1.5
$2.0
$2.5
2018 2019 2020 2021 2022
$ B
illi
on
s
As of December 2016 As of December 2017
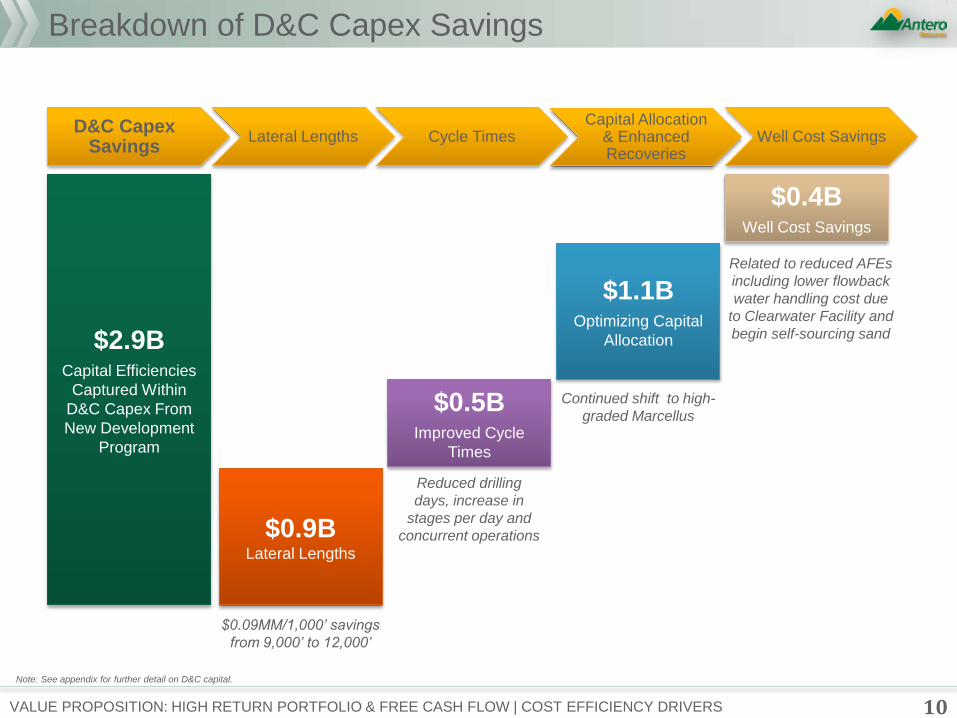
Breakdown of D&C Capex Savings
10
$2.9B Capital Efficiencies
Captured Within
D&C Capex From
New Development
Program
$0.9B Lateral Lengths
$0.5B Improved Cycle
Times
$1.1B Optimizing Capital
Allocation
$0.09MM/1,000’ savings
from 9,000’ to 12,000’
Reduced drilling
days, increase in
stages per day and
concurrent operations
Continued shift to high-
graded Marcellus
$0.4B Well Cost Savings
Related to reduced AFEs
including lower flowback
water handling cost due
to Clearwater Facility and
begin self-sourcing sand
D&C Capex Savings
Lateral Lengths Cycle Times Well Cost Savings Capital Allocation
& Enhanced Recoveries
VALUE PROPOSITION: HIGH RETURN PORTFOLIO & FREE CASH FLOW | COST EFFICIENCY DRIVERS
Note: See appendix for further detail on D&C capital.
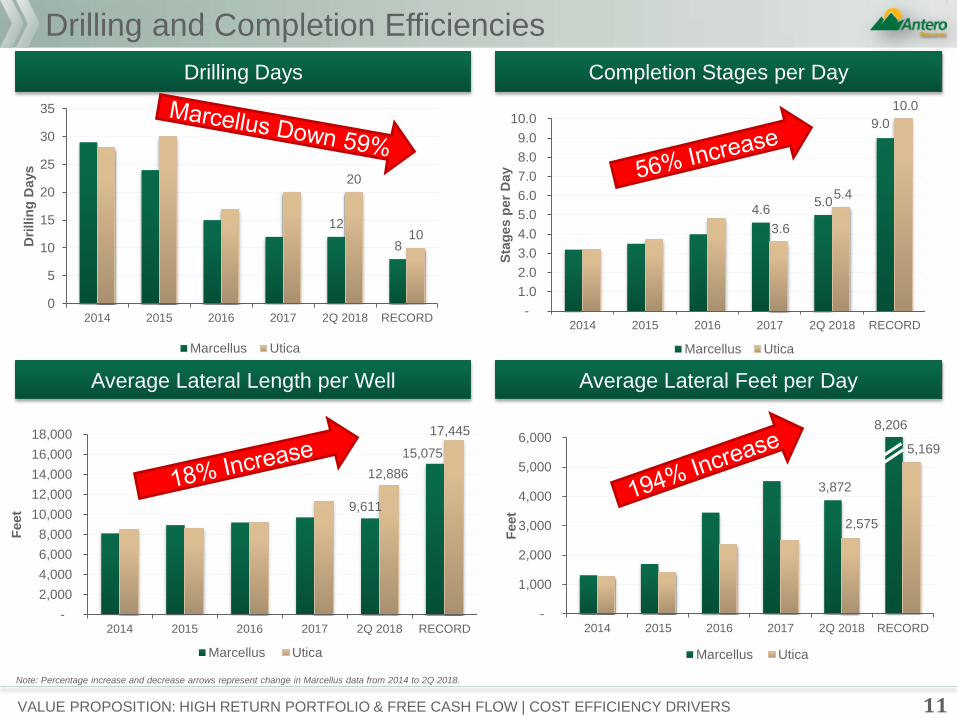
3,872
2,575
5,169
-
1,000
2,000
3,000
4,000
5,000
6,000
2014 2015 2016 2017 2Q 2018 RECORD
Fe
et
Marcellus Utica
9,611
15,075
12,886
17,445
-
2,000
4,000
6,000
8,000
10,000
12,000
14,000
16,000
18,000
2014 2015 2016 2017 2Q 2018 RECORD
Feet
Marcellus Utica
4.6 5.0
9.0
3.6
5.4
10.0
-
1.0
2.0
3.0
4.0
5.0
6.0
7.0
8.0
9.0
10.0
2014 2015 2016 2017 2Q 2018 RECORD
Sta
ges p
er
Day
Marcellus Utica
11
Drilling and Completion Efficiencies
Average Lateral Feet per Day
Drilling Days
Average Lateral Length per Well
Completion Stages per Day
VALUE PROPOSITION: HIGH RETURN PORTFOLIO & FREE CASH FLOW | COST EFFICIENCY DRIVERS
8,206
Note: Percentage increase and decrease arrows represent change in Marcellus data from 2014 to 2Q 2018.
12
8
20
10
0
5
10
15
20
25
30
35
2014 2015 2016 2017 2Q 2018 RECORD
Dri
llin
g D
ays
Marcellus Utica
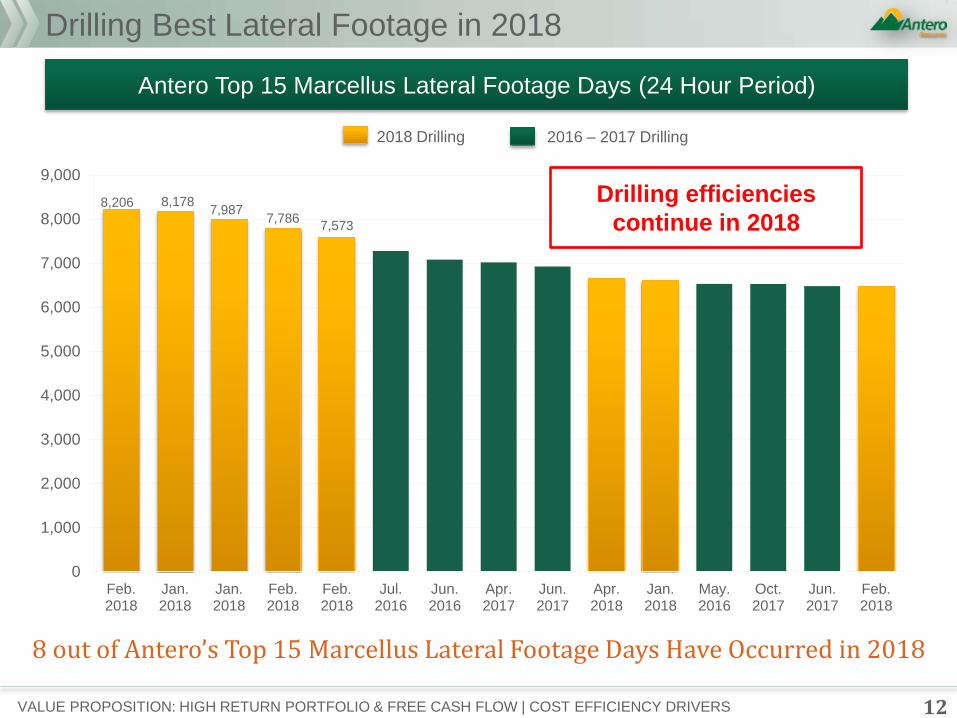
Drilling Best Lateral Footage in 2018
Antero Top 15 Marcellus Lateral Footage Days (24 Hour Period)
12
8,206 8,178 7,987
7,786 7,573
0
1,000
2,000
3,000
4,000
5,000
6,000
7,000
8,000
9,000
Feb.2018
Jan.2018
Jan.2018
Feb.2018
Feb.2018
Jul.2016
Jun.2016
Apr.2017
Jun.2017
Apr.2018
Jan.2018
May.2016
Oct.2017
Jun.2017
Feb.2018
2018 Drilling 2016 – 2017 Drilling
8 out of Antero’s Top 15 Marcellus Lateral Footage Days Have Occurred in 2018
VALUE PROPOSITION: HIGH RETURN PORTFOLIO & FREE CASH FLOW | COST EFFICIENCY DRIVERS
Drilling efficiencies
continue in 2018
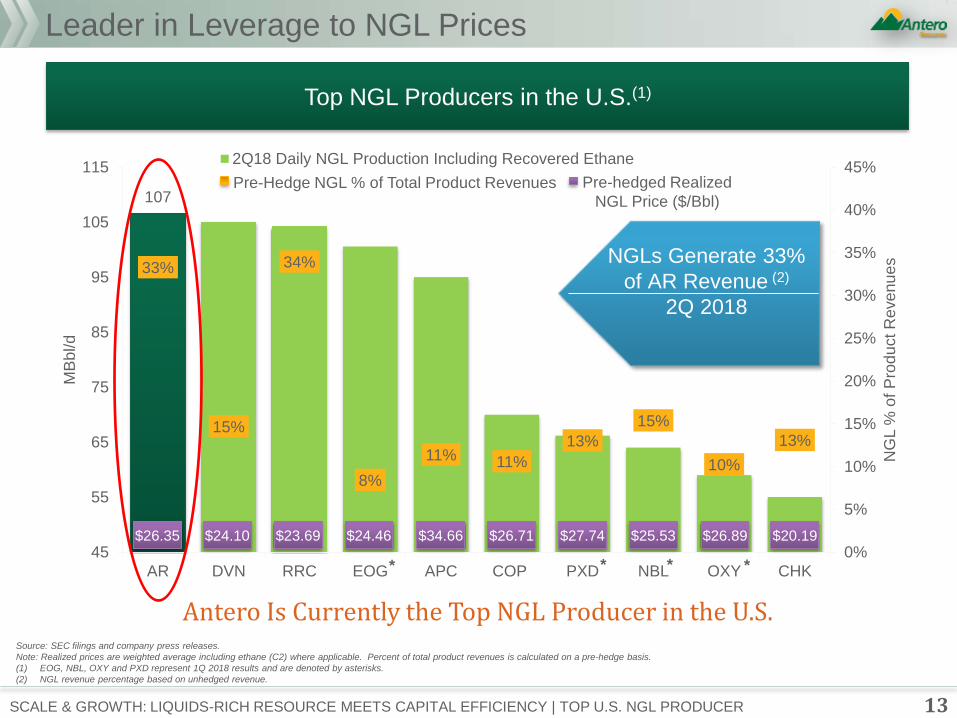
107
33%
15%
34%
8%
11% 11%
13%
15%
10%
13%
0%
5%
10%
15%
20%
25%
30%
35%
40%
45%
45
55
65
75
85
95
105
115
AR DVN RRC EOG APC COP PXD NBL OXY CHK
NG
L %
of
Pro
du
ct R
eve
nu
es
MB
bl/d
2Q18 Daily NGL Production Including Recovered Ethane
Leader in Leverage to NGL Prices
13 SCALE & GROWTH: LIQUIDS-RICH RESOURCE MEETS CAPITAL EFFICIENCY | TOP U.S. NGL PRODUCER
Top NGL Producers in the U.S.(1)
Source: SEC filings and company press releases.
Note: Realized prices are weighted average including ethane (C2) where applicable. Percent of total product revenues is calculated on a pre-hedge basis.
(1) EOG, NBL, OXY and PXD represent 1Q 2018 results and are denoted by asterisks.
(2) NGL revenue percentage based on unhedged revenue.
NGLs Generate 33%
of AR Revenue (2)
2Q 2018
$26.35 $24.10 $23.69 $24.46 $34.66 $26.71 $27.74 $25.53 $26.89 $20.19
Antero Is Currently the Top NGL Producer in the U.S.
Pre-hedged Realized
NGL Price ($/Bbl)
Pre-Hedge NGL % of Total Product Revenues
* * * *
0%
20%
40%
60%
80%
100%
120%
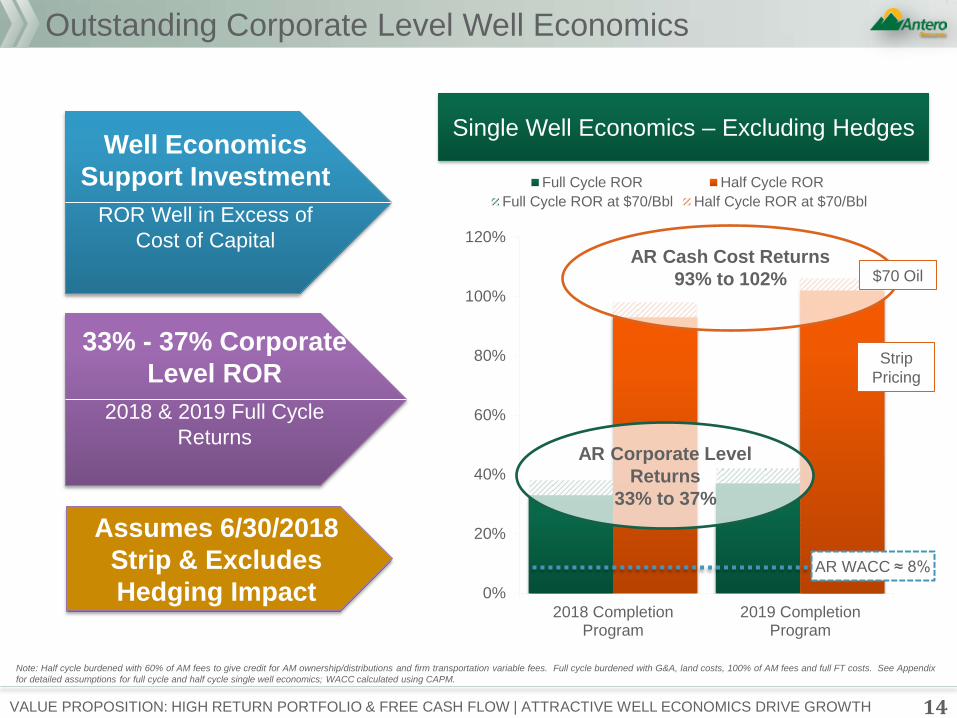
2018 CompletionProgram
2019 CompletionProgram
Full Cycle ROR at $70/Bbl Half Cycle ROR at $70/Bbl
Full Cycle ROR Half Cycle ROR
Outstanding Corporate Level Well Economics
14 VALUE PROPOSITION: HIGH RETURN PORTFOLIO & FREE CASH FLOW | ATTRACTIVE WELL ECONOMICS DRIVE GROWTH
Well Economics
Support Investment
ROR Well in Excess of
Cost of Capital
33% - 37% Corporate
Level ROR
2018 & 2019 Full Cycle
Returns
Single Well Economics – Excluding Hedges
Note: Half cycle burdened with 60% of AM fees to give credit for AM ownership/distributions and firm transportation variable fees. Full cycle burdened with G&A, land costs, 100% of AM fees and full FT costs. See Appendix
for detailed assumptions for full cycle and half cycle single well economics; WACC calculated using CAPM.
AR WACC ≈ 8%
Strip
Pricing
Assumes 6/30/2018
Strip & Excludes
Hedging Impact
AR Cash Cost Returns
93% to 102%
AR Corporate Level
Returns
33% to 37%
$70 Oil
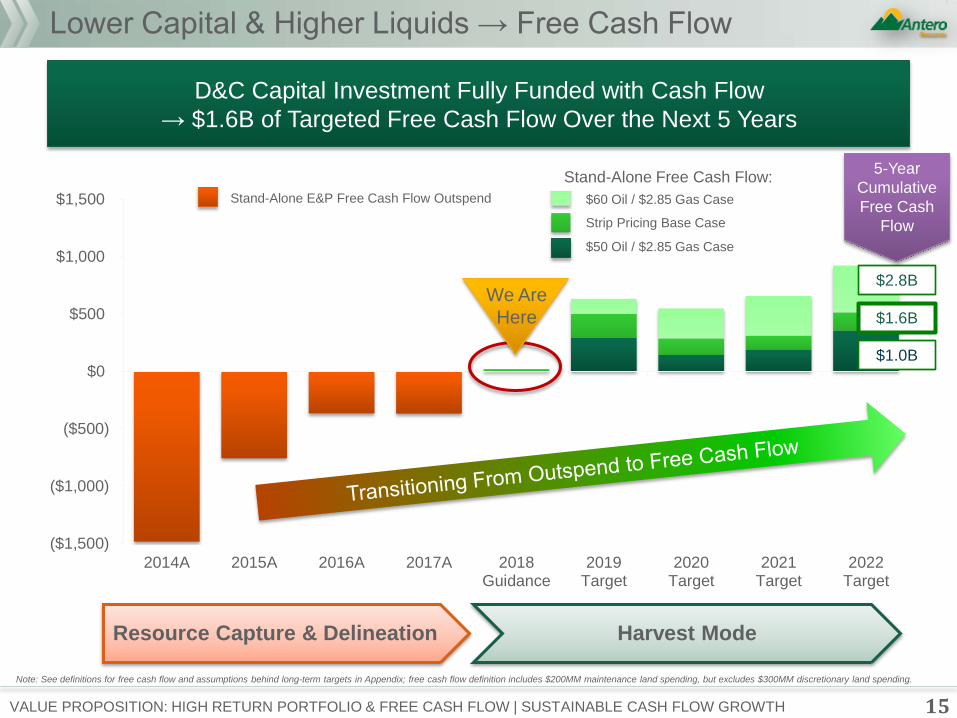
($1,500)
($1,000)
($500)
$0
$500
$1,000
$1,500
2014A 2015A 2016A 2017A 2018Guidance
2019Target
2020Target
2021Target
2022Target
Lower Capital & Higher Liquids → Free Cash Flow
VALUE PROPOSITION: HIGH RETURN PORTFOLIO & FREE CASH FLOW | SUSTAINABLE CASH FLOW GROWTH
$60 Oil / $2.85 Gas Case Stand-Alone E&P Free Cash Flow Outspend
Strip Pricing Base Case
Note: See definitions for free cash flow and assumptions behind long-term targets in Appendix; free cash flow definition includes $200MM maintenance land spending, but excludes $300MM discretionary land spending.
D&C Capital Investment Fully Funded with Cash Flow
→ $1.6B of Targeted Free Cash Flow Over the Next 5 Years
$50 Oil / $2.85 Gas Case
$2.8B
$1.0B
$1.6B
We Are
Here
5-Year
Cumulative
Free Cash
Flow
15
Stand-Alone Free Cash Flow:
Resource Capture & Delineation Harvest Mode
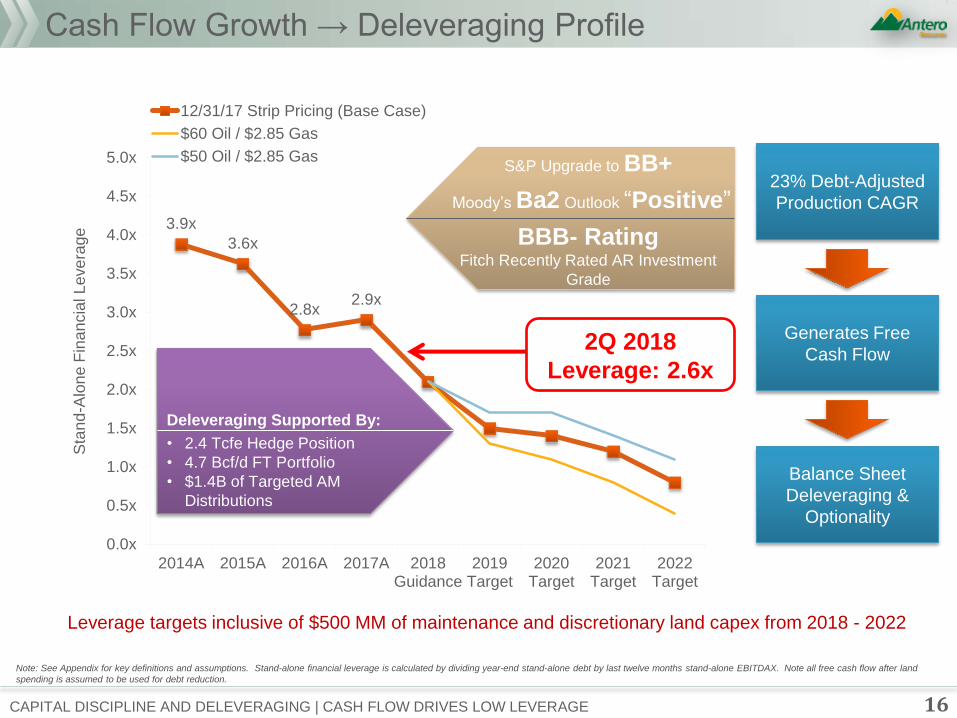
3.9x
3.6x
2.8x 2.9x
0.0x
0.5x
1.0x
1.5x
2.0x
2.5x
3.0x
3.5x
4.0x
4.5x
5.0x
2014A 2015A 2016A 2017A 2018Guidance
2019Target
2020Target
2021Target
2022Target
Sta
nd
-Alo
ne
Fin
an
cia
l L
eve
rage
12/31/17 Strip Pricing (Base Case)
$60 Oil / $2.85 Gas
$50 Oil / $2.85 Gas
Cash Flow Growth → Deleveraging Profile
23% Debt-Adjusted
Production CAGR
Generates Free
Cash Flow
Balance Sheet
Deleveraging &
Optionality
Note: See Appendix for key definitions and assumptions. Stand-alone financial leverage is calculated by dividing year-end stand-alone debt by last twelve months stand-alone EBITDAX. Note all free cash flow after land
spending is assumed to be used for debt reduction.
Leverage targets inclusive of $500 MM of maintenance and discretionary land capex from 2018 - 2022
Deleveraging Supported By:
• 2.4 Tcfe Hedge Position
• 4.7 Bcf/d FT Portfolio
• $1.4B of Targeted AM
Distributions
CAPITAL DISCIPLINE AND DELEVERAGING | CASH FLOW DRIVES LOW LEVERAGE
S&P Upgrade to BB+
Moody’s Ba2 Outlook ―Positive‖
BBB- Rating Fitch Recently Rated AR Investment
Grade
2Q 2018
Leverage: 2.6x
16
17 VALUE PROPOSITION: HIGH RETURN PORTFOLIO & FREE CASH FLOW | ATTRACTIVE VALUATION
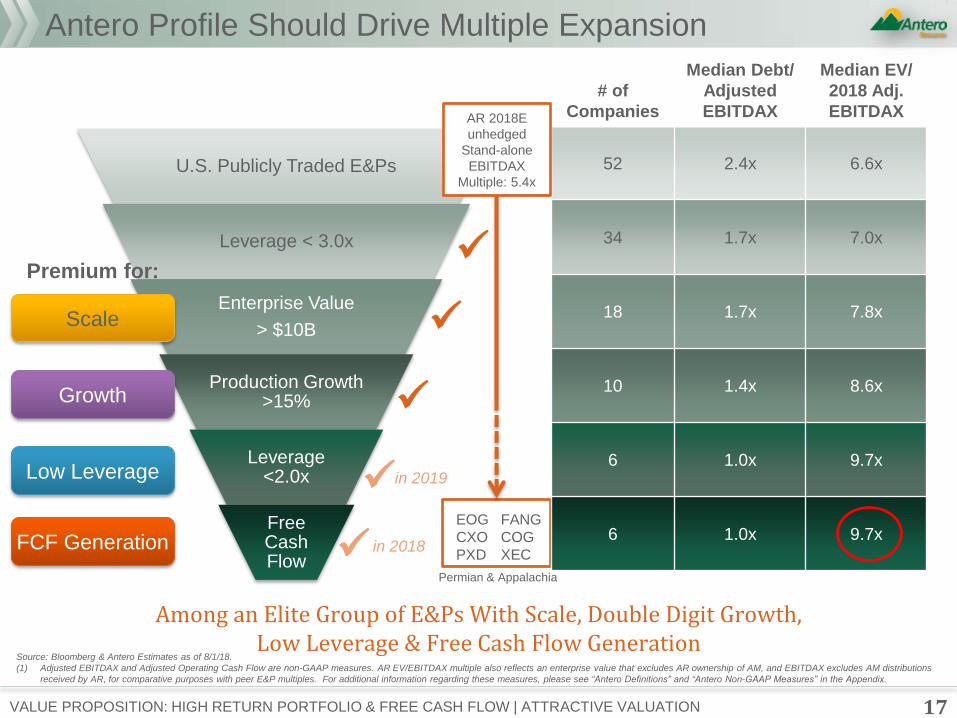
Antero Profile Should Drive Multiple Expansion
U.S. Publicly Traded E&Ps
Leverage < 3.0x
Enterprise Value
> $10B
Production Growth >15%
Leverage <2.0x
Free Cash Flow
Among an Elite Group of E&Ps With Scale, Double Digit Growth, Low Leverage & Free Cash Flow Generation
Source: Bloomberg & Antero Estimates as of 8/1/18.
(1) Adjusted EBITDAX and Adjusted Operating Cash Flow are non-GAAP measures. AR EV/EBITDAX multiple also reflects an enterprise value that excludes AR ownership of AM, and EBITDAX excludes AM distributions
received by AR, for comparative purposes with peer E&P multiples. For additional information regarding these measures, please see “Antero Definitions” and “Antero Non-GAAP Measures” in the Appendix.
# of
Companies
Median Debt/
Adjusted
EBITDAX
Median EV/
2018 Adj.
EBITDAX
52 2.4x 6.6x
34 1.7x 7.0x
18 1.7x 7.8x
10 1.4x 8.6x
6 1.0x 9.7x
6 1.0x 9.7x EOG
CXO
PXD
AR 2018E
unhedged
Stand-alone
EBITDAX
Multiple: 5.4x
Scale
Growth
Low Leverage
Permian & Appalachia
FCF Generation
FANG
COG
XEC
in 2019
in 2018
Premium for:
0%
1%
2%
3%
4%
5%
6%
7%
8%
2018 2019 2020
FC
F Y
ield
18 VALUE PROPOSITION: HIGH RETURN PORTFOLIO & FREE CASH FLOW | 5-YEAR OUTLOOK
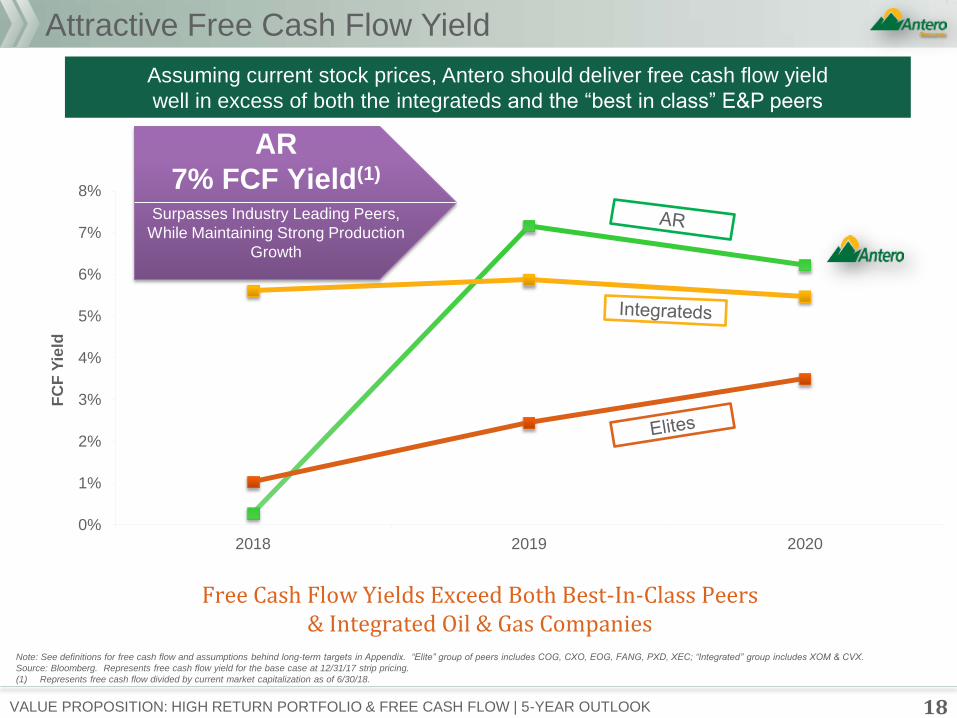
Attractive Free Cash Flow Yield
Note: See definitions for free cash flow and assumptions behind long-term targets in Appendix. “Elite” group of peers includes COG, CXO, EOG, FANG, PXD, XEC; “Integrated” group includes XOM & CVX.
Source: Bloomberg. Represents free cash flow yield for the base case at 12/31/17 strip pricing.
(1) Represents free cash flow divided by current market capitalization as of 6/30/18.
Free Cash Flow Yields Exceed Both Best-In-Class Peers & Integrated Oil & Gas Companies
AR
7% FCF Yield(1)
Surpasses Industry Leading Peers,
While Maintaining Strong Production
Growth
Assuming current stock prices, Antero should deliver free cash flow yield
well in excess of both the integrateds and the ―best in class‖ E&P peers
Scale & Growth: Liquids-Rich Resource Meets Capital Efficiency
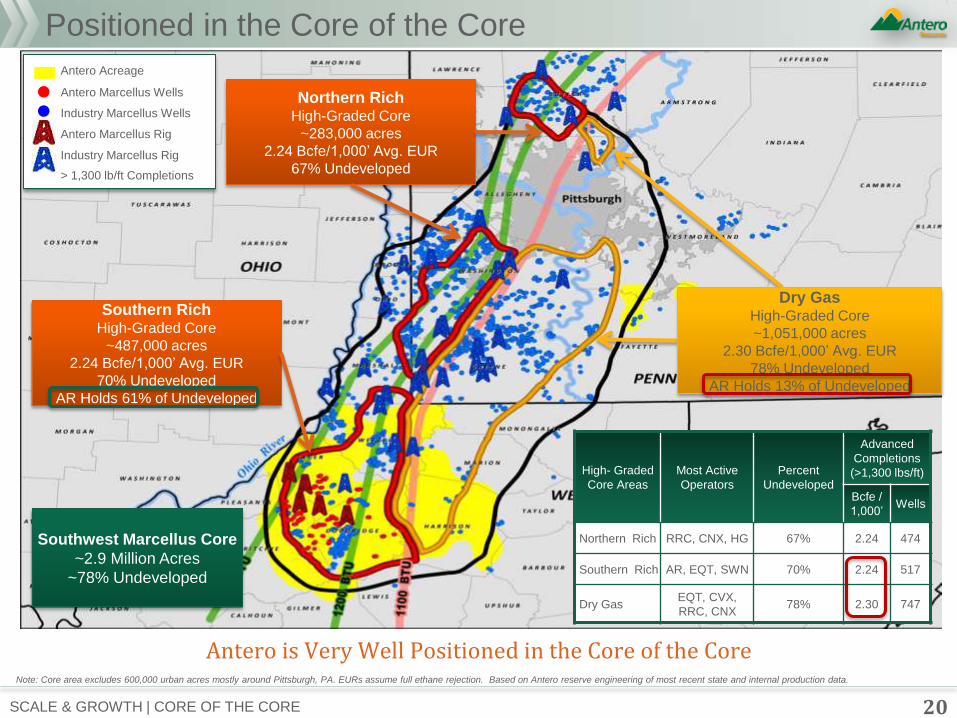
Antero is Very Well Positioned in the Core of the Core
20 SCALE & GROWTH | CORE OF THE CORE
Positioned in the Core of the Core
Northern Rich High-Graded Core
~283,000 acres
2.24 Bcfe/1,000’ Avg. EUR
67% Undeveloped
Southern Rich High-Graded Core
~487,000 acres
2.24 Bcfe/1,000’ Avg. EUR
70% Undeveloped
AR Holds 61% of Undeveloped
Southwest Marcellus Core
~2.9 Million Acres
~78% Undeveloped
Antero Acreage
Antero Marcellus Wells
Industry Marcellus Wells
Antero Marcellus Rig
Industry Marcellus Rig
Dry Gas High-Graded Core
~1,051,000 acres
2.30 Bcfe/1,000’ Avg. EUR
78% Undeveloped
AR Holds 13% of Undeveloped
> 1,300 lb/ft Completions
High- Graded
Core Areas
Most Active
Operators
Percent
Undeveloped
Advanced
Completions
(>1,300 lbs/ft)
Bcfe /
1,000’ Wells
Northern Rich RRC, CNX, HG 67% 2.24 474
Southern Rich AR, EQT, SWN 70% 2.24 517
Dry Gas EQT, CVX,
RRC, CNX 78% 2.30 747
Note: Core area excludes 600,000 urban acres mostly around Pittsburgh, PA. EURs assume full ethane rejection. Based on Antero reserve engineering of most recent state and internal production data.
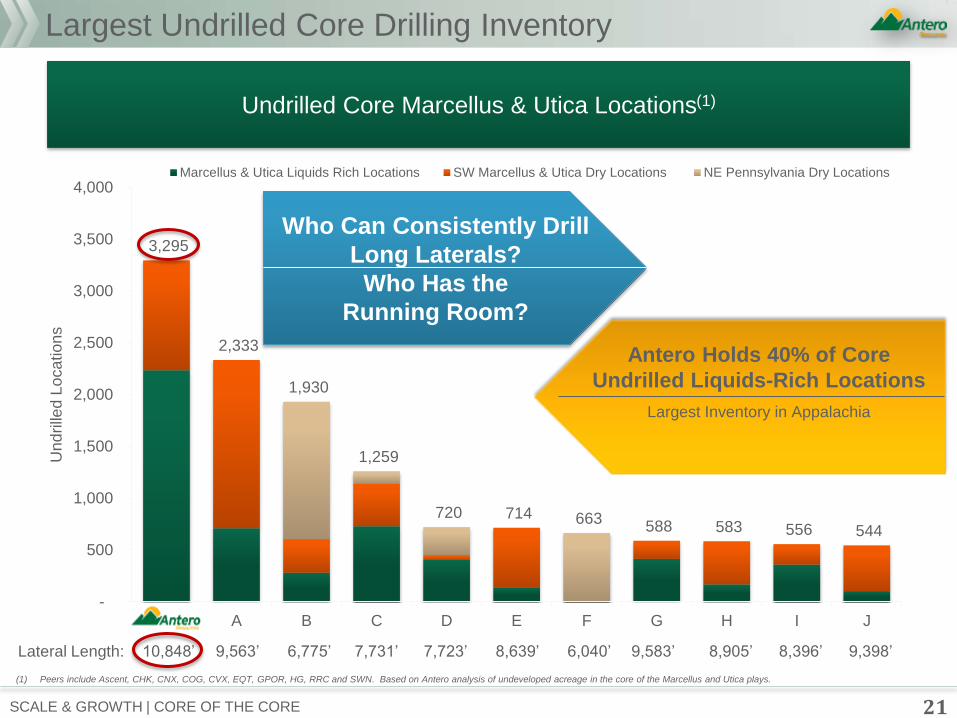
3,295
2,333
1,930
1,259
720 714 663 588 583 556 544
-
500
1,000
1,500
2,000
2,500
3,000
3,500
4,000
AR A B C D E F G H I J
Und
rille
d L
oca
tio
ns
Marcellus & Utica Liquids Rich Locations SW Marcellus & Utica Dry Locations NE Pennsylvania Dry Locations
Largest Undrilled Core Drilling Inventory
21 SCALE & GROWTH | CORE OF THE CORE
10,848’ 9,563’ 6,775’ 7,723’ 6,040’ 9,583’ 8,905’ 9,398’ 8,396’ 7,731’ 8,639’
Antero Holds 40% of Core
Undrilled Liquids-Rich Locations
Largest Inventory in Appalachia
(1) Peers include Ascent, CHK, CNX, COG, CVX, EQT, GPOR, HG, RRC and SWN. Based on Antero analysis of undeveloped acreage in the core of the Marcellus and Utica plays.
Who Can Consistently Drill
Long Laterals?
Who Has the
Running Room?
Undrilled Core Marcellus & Utica Locations(1)
Lateral Length:
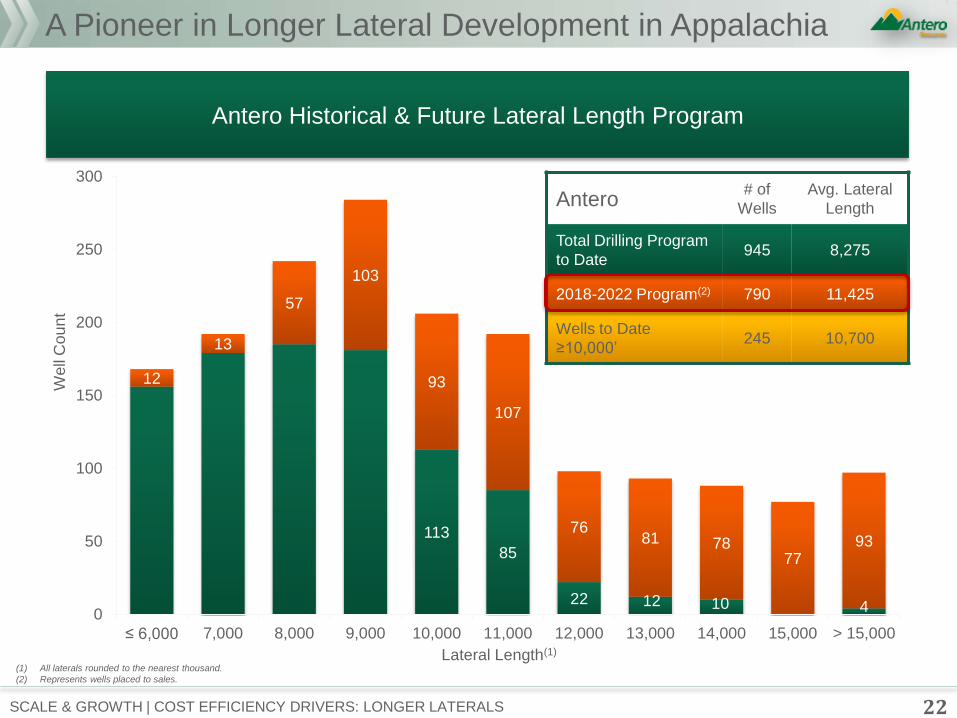
A Pioneer in Longer Lateral Development in Appalachia
22
(1) All laterals rounded to the nearest thousand.
(2) Represents wells placed to sales.
Antero Historical & Future Lateral Length Program
113
85
22 12 10 4
12
13
57
103
93
107
76 81 78
77 93
0
50
100
150
200
250
300
≤ 6,000 7,000 8,000 9,000 10,000 11,000 12,000 13,000 14,000 15,000 > 15,000
Well
Cou
nt
Lateral Length(1)
Antero # of
Wells
Avg. Lateral
Length
Total Drilling Program
to Date 945 8,275
2018-2022 Program(2) 790 11,425
Wells to Date
≥10,000’ 245 10,700
SCALE & GROWTH | COST EFFICIENCY DRIVERS: LONGER LATERALS
0
5
10
15
20
25
30
35
40
45
3,000 4,000 5,000 6,000 7,000 8,000 9,000 10,000 11,000 12,000 13,000 14,000 15,000 16,000
EU
R (
Bcfe
)
Lateral Length (ft)
EUR in Bcfe/1,000' 2.3 Bcfe/1,000'
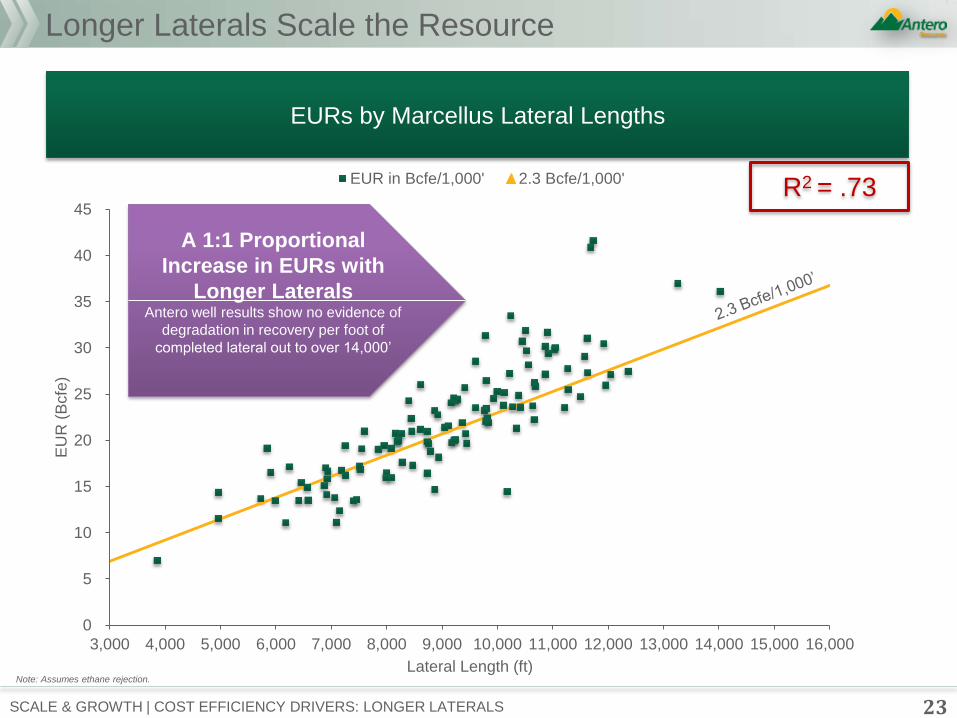
Longer Laterals Scale the Resource
23 SCALE & GROWTH | COST EFFICIENCY DRIVERS: LONGER LATERALS
EURs by Marcellus Lateral Lengths
A 1:1 Proportional
Increase in EURs with
Longer Laterals Antero well results show no evidence of
degradation in recovery per foot of
completed lateral out to over 14,000’
R2 = .73
Note: Assumes ethane rejection.
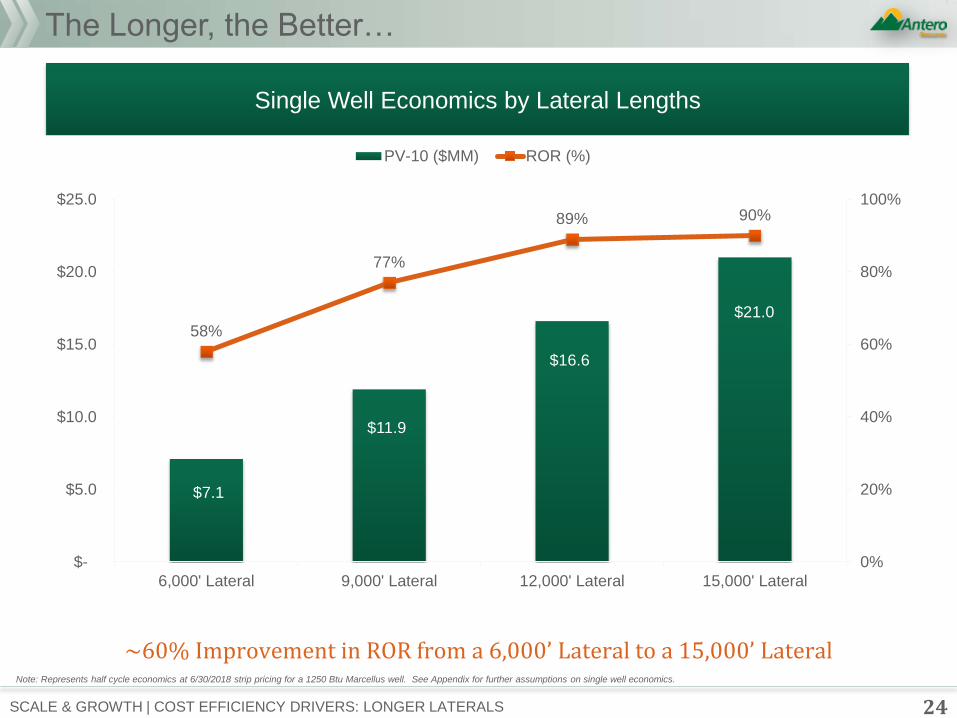
The Longer, the Better…
24 SCALE & GROWTH | COST EFFICIENCY DRIVERS: LONGER LATERALS
Note: Represents half cycle economics at 6/30/2018 strip pricing for a 1250 Btu Marcellus well. See Appendix for further assumptions on single well economics.
Single Well Economics by Lateral Lengths
$7.1
$11.9
$16.6
$21.0
58%
77%
89% 90%
0%
20%
40%
60%
80%
100%
$-
$5.0
$10.0
$15.0
$20.0
$25.0
6,000' Lateral 9,000' Lateral 12,000' Lateral 15,000' Lateral
PV-10 ($MM) ROR (%)
~60% Improvement in ROR from a 6,000’ Lateral to a 15,000’ Lateral
$0.60
$0.80
$1.00
$1.20
$1.40
$1.60
$1.80
$2.00
$2.20
3,000 6,000 9,000 12,00015,000
$M
M/1
,000 f
t of
late
ral
Lateral Length (ft)
Marcellus
2014 2017
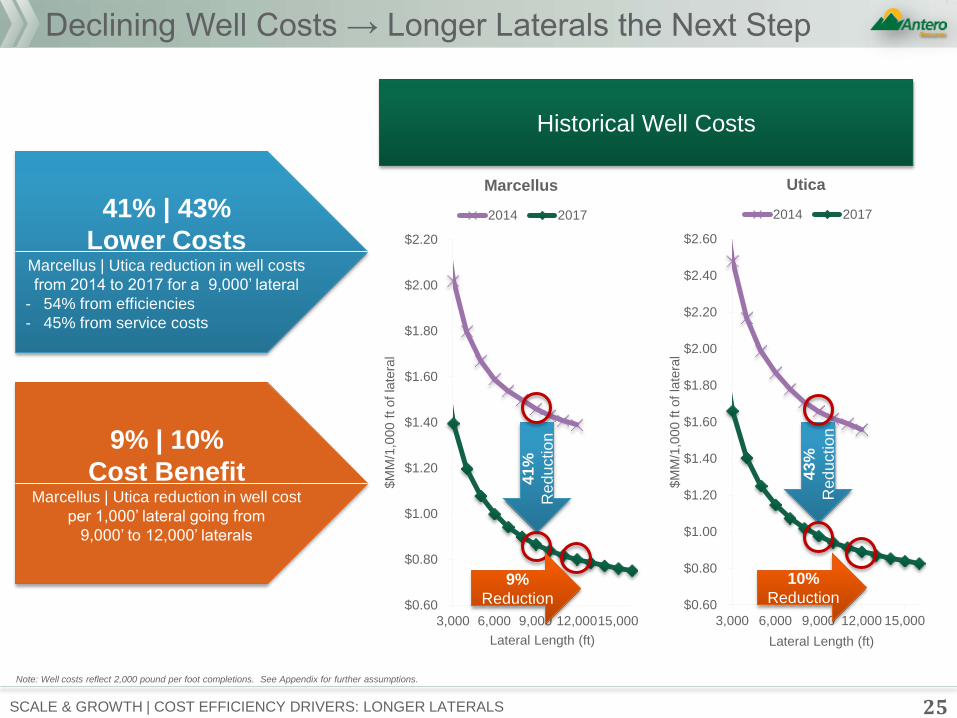
Declining Well Costs → Longer Laterals the Next Step
25 SCALE & GROWTH | COST EFFICIENCY DRIVERS: LONGER LATERALS
Note: Well costs reflect 2,000 pound per foot completions. See Appendix for further assumptions.
Historical Well Costs
41% | 43%
Lower Costs Marcellus | Utica reduction in well costs
from 2014 to 2017 for a 9,000’ lateral
- 54% from efficiencies
- 45% from service costs
9% | 10%
Cost Benefit Marcellus | Utica reduction in well cost
per 1,000’ lateral going from
9,000’ to 12,000’ laterals 4
1%
Red
uctio
n
$0.60
$0.80
$1.00
$1.20
$1.40
$1.60
$1.80
$2.00
$2.20
$2.40
$2.60
3,000 6,000 9,000 12,000 15,000
$M
M/1
,000 f
t of
late
ral
Lateral Length (ft)
Utica
2014 2017
43
%
Red
uctio
n
9%
Reduction
10%
Reduction
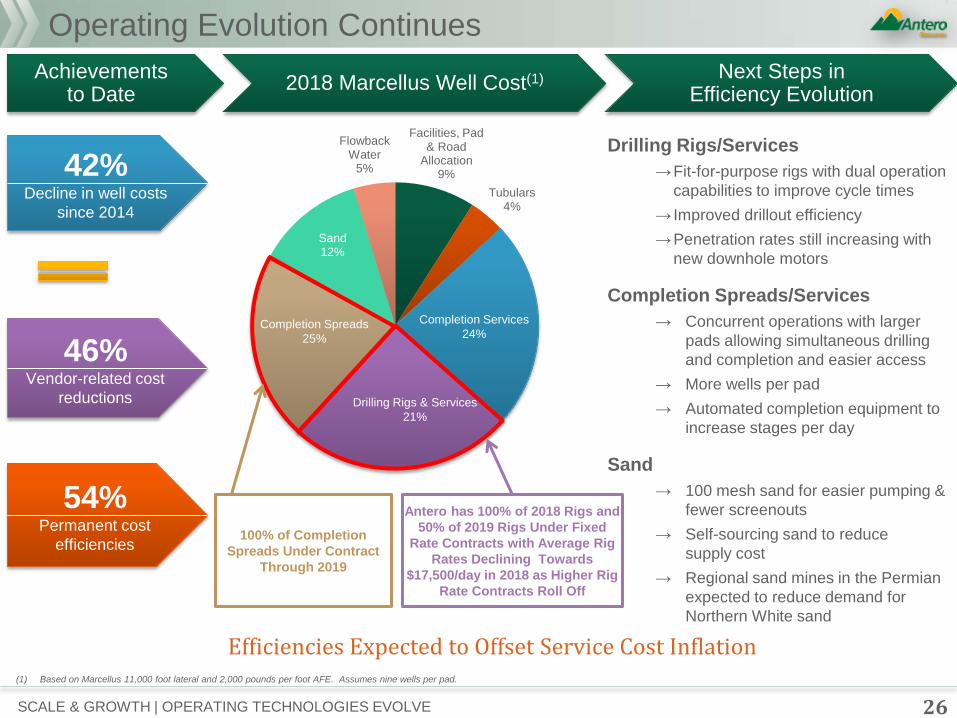
Operating Evolution Continues
26
(1) Based on Marcellus 11,000 foot lateral and 2,000 pounds per foot AFE. Assumes nine wells per pad.
Drilling
Efficiency (25%)
42%
Decline in well costs
since 2014
54% Permanent cost
efficiencies
46% Vendor-related cost
reductions
Efficiencies Expected to Offset Service Cost Inflation
Facilities, Pad & Road
Allocation 9%
Tubulars 4%
Sand 12%
Flowback Water
5%
Completion Spreads
25%
Drilling Rigs & Services
21%
Completion Services
24%
Drilling Rigs/Services
→Fit-for-purpose rigs with dual operation
capabilities to improve cycle times
→ Improved drillout efficiency
→Penetration rates still increasing with
new downhole motors
Completion Spreads/Services
→ Concurrent operations with larger
pads allowing simultaneous drilling
and completion and easier access
→ More wells per pad
→ Automated completion equipment to
increase stages per day
Sand
→ 100 mesh sand for easier pumping &
fewer screenouts
→ Self-sourcing sand to reduce
supply cost
→ Regional sand mines in the Permian
expected to reduce demand for
Northern White sand
• Fit-for-purpose rigs improves
cycle times
• Enhanced walking and dual operation
capabilities
• Concurrent operations
• Larger pads allowing for production at
one end and drilling at the other
• More wells per pad
• Automated completion equipment
→ increase stages per day
• Reduced cluster spacing
→ higher potential recoveries
• 100 Mesh Sand
→ easier pumping with fewer
screenouts and less cost
• Self-Sourcing Sand
→ reduce supply cost
• Improved Drillout Efficiency
100% of Completion
Spreads Under Contract
Through 2019
Antero has 100% of 2018 Rigs and
50% of 2019 Rigs Under Fixed
Rate Contracts with Average Rig
Rates Declining Towards
$17,500/day in 2018 as Higher Rig
Rate Contracts Roll Off
Achievements to Date
2018 Marcellus Well Cost(1) Next Steps in Efficiency Evolution
SCALE & GROWTH | OPERATING TECHNOLOGIES EVOLVE
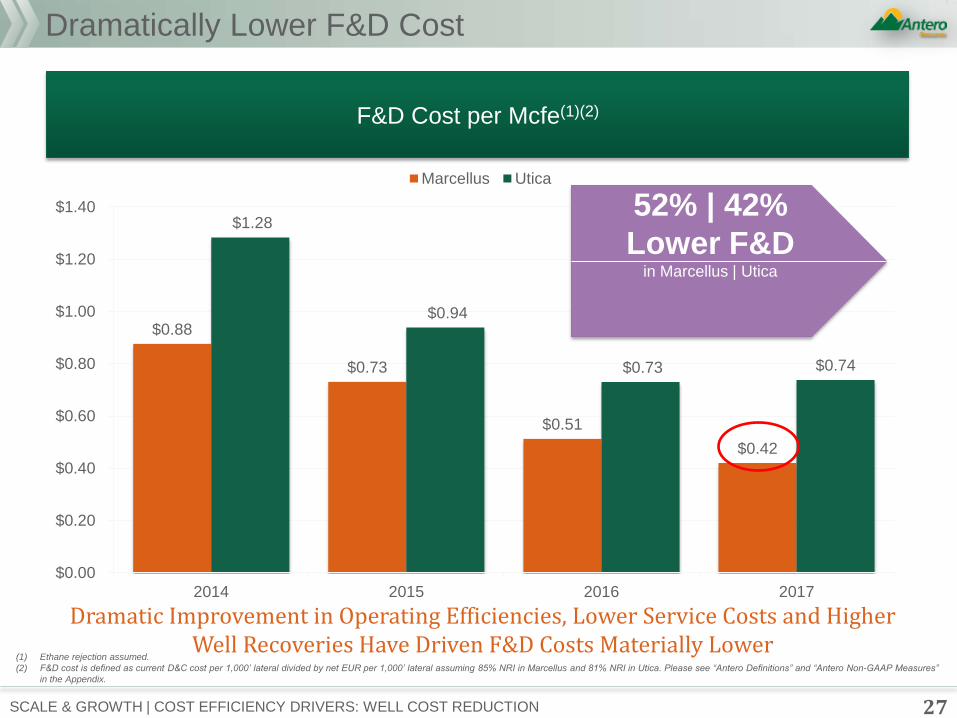
$0.88
$0.73
$0.51
$0.42
$1.28
$0.94
$0.73 $0.74
$0.00
$0.20
$0.40
$0.60
$0.80
$1.00
$1.20
$1.40
2014 2015 2016 2017
Marcellus Utica
27 SCALE & GROWTH | COST EFFICIENCY DRIVERS: WELL COST REDUCTION
Dramatically Lower F&D Cost
F&D Cost per Mcfe(1)(2)
(1) Ethane rejection assumed.
(2) F&D cost is defined as current D&C cost per 1,000’ lateral divided by net EUR per 1,000’ lateral assuming 85% NRI in Marcellus and 81% NRI in Utica. Please see “Antero Definitions” and “Antero Non-GAAP Measures”
in the Appendix.
Dramatic Improvement in Operating Efficiencies, Lower Service Costs and Higher Well Recoveries Have Driven F&D Costs Materially Lower
52% | 42%
Lower F&D in Marcellus | Utica
0
50,000
100,000
150,000
200,000
250,000
2014 2015 2016 2017 2018EGuidance
2019ETarget
2020ETarget
2021ETarget
2022ETarget
Natural Gasoline (C5+) IsoButane (iC4)
Normal Butane (nC4) Propane (C3)
Ethane (C2)
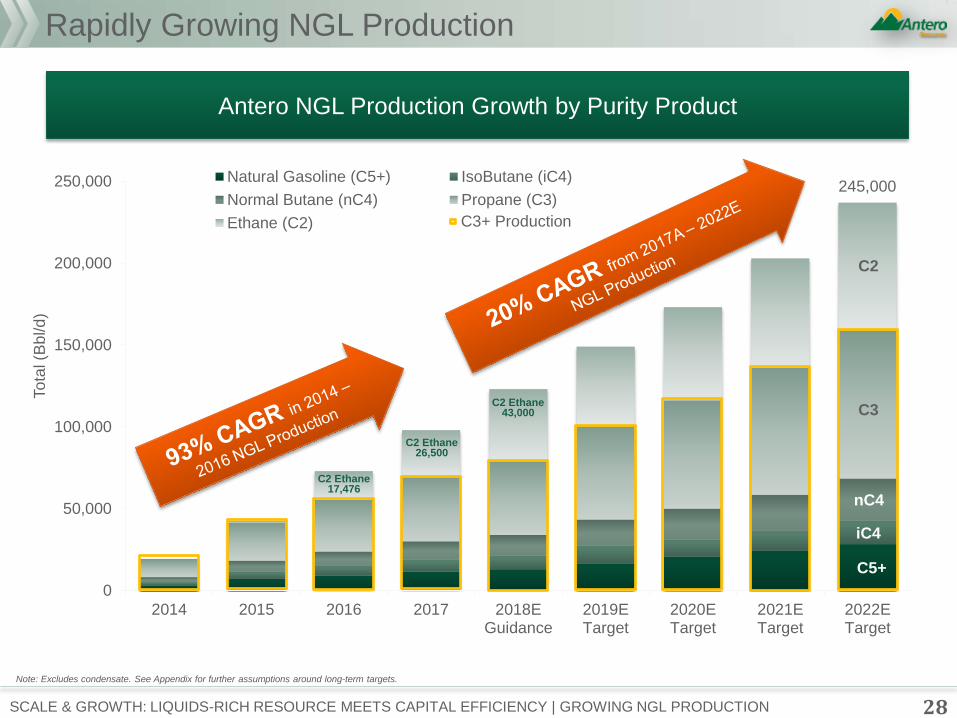
245,000
Rapidly Growing NGL Production
28 SCALE & GROWTH: LIQUIDS-RICH RESOURCE MEETS CAPITAL EFFICIENCY | GROWING NGL PRODUCTION
Antero NGL Production Growth by Purity Product
Note: Excludes condensate. See Appendix for further assumptions around long-term targets.
To
tal (B
bl/d
)
C5+
iC4
nC4
C3
C3+ Production
C2
C2 Ethane 17,476
C2 Ethane 26,500
C2 Ethane 43,000
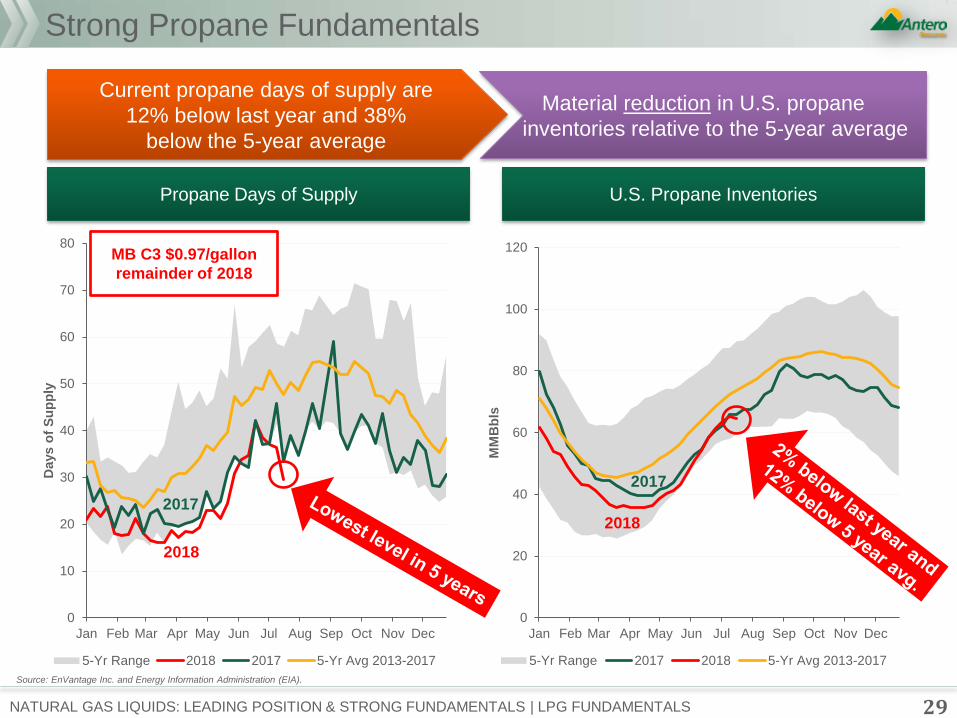
Material reduction in U.S. propane
inventories relative to the 5-year average
Current propane days of supply are
12% below last year and 38%
below the 5-year average
Strong Propane Fundamentals
29 NATURAL GAS LIQUIDS: LEADING POSITION & STRONG FUNDAMENTALS | LPG FUNDAMENTALS
Propane Days of Supply U.S. Propane Inventories
0
10
20
30
40
50
60
70
80
Jan Feb Mar Apr May Jun Jul Aug Sep Oct Nov Dec
Days o
f S
up
ply
5-Yr Range 2018 2017 5-Yr Avg 2013-2017
0
20
40
60
80
100
120
Jan Feb Mar Apr May Jun Jul Aug Sep Oct Nov Dec
MM
Bb
ls
5-Yr Range 2017 2018 5-Yr Avg 2013-2017
Source: EnVantage Inc. and Energy Information Administration (EIA).
MB C3 $0.97/gallon
remainder of 2018
2017
2018
2017
2018
$0.30
$0.40
$0.50
$0.60
$0.70
$0.80
$0.90
$1.00
$1.10
Jan-1
6
Feb
-16
Ma
r-1
6
Apr-
16
Ma
y-1
6
Jun-1
6
Jul-1
6
Aug-1
6
Sep-1
6
Oct-
16
No
v-1
6
De
c-1
6
Jan-1
7
Feb
-17
Ma
r-1
7
Apr-
17
Ma
y-1
7
Jun-1
7
Jul-1
7
Aug-1
7
Sep-1
7
Oct-
17
No
v-1
7
De
c-1
7
Jan-1
8
Feb
-18
Ma
r-1
8
Apr-
18
Ma
y-1
8
Jun-1
8
Jul-1
8
Aug-1
8
Sep-1
8
Oct-
18
No
v-1
8
De
c-1
8
Jan-1
9
Feb
-19
Ma
r-1
9
$ p
er
gallo
n
Spring (Apr - Jun) Winter (Dec - Feb)
Mont Belvieu Propane Prices Mont Belvieu Propane Futures
30 PROPANE PRICES: WINTER MONTHS HISTORICALLY EXCEED SPRING LEVELS
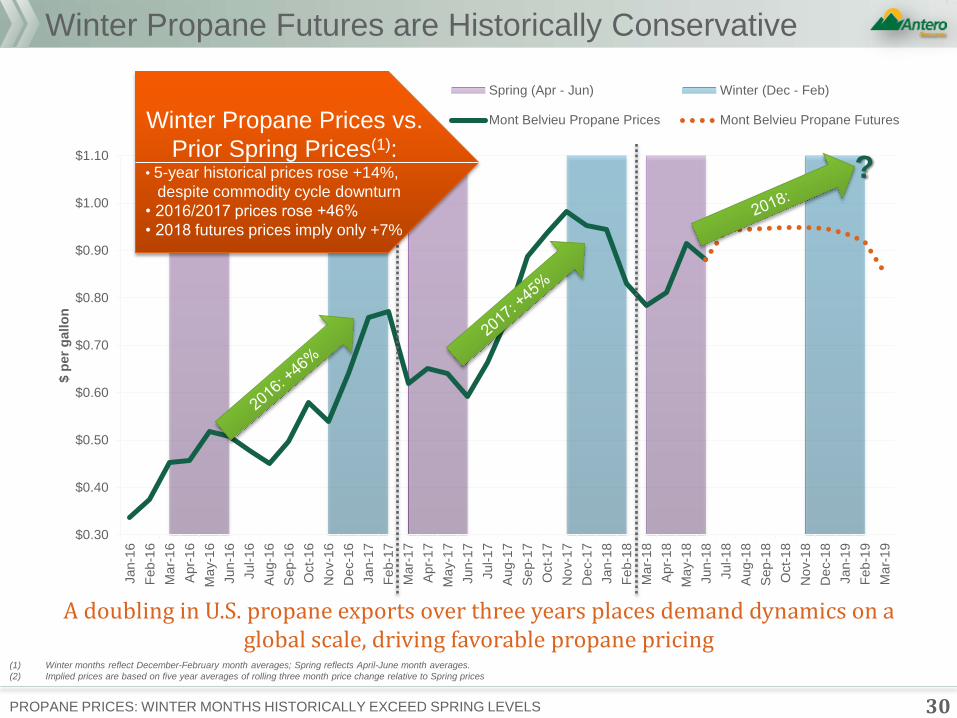
Winter Propane Futures are Historically Conservative
Winter Propane Prices vs.
Prior Spring Prices(1): • 5-year historical prices rose +14%,
despite commodity cycle downturn
• 2016/2017 prices rose +46%
• 2018 futures prices imply only +7%
A doubling in U.S. propane exports over three years places demand dynamics on a global scale, driving favorable propane pricing
(1) Winter months reflect December-February month averages; Spring reflects April-June month averages.
(2) Implied prices are based on five year averages of rolling three month price change relative to Spring prices
?
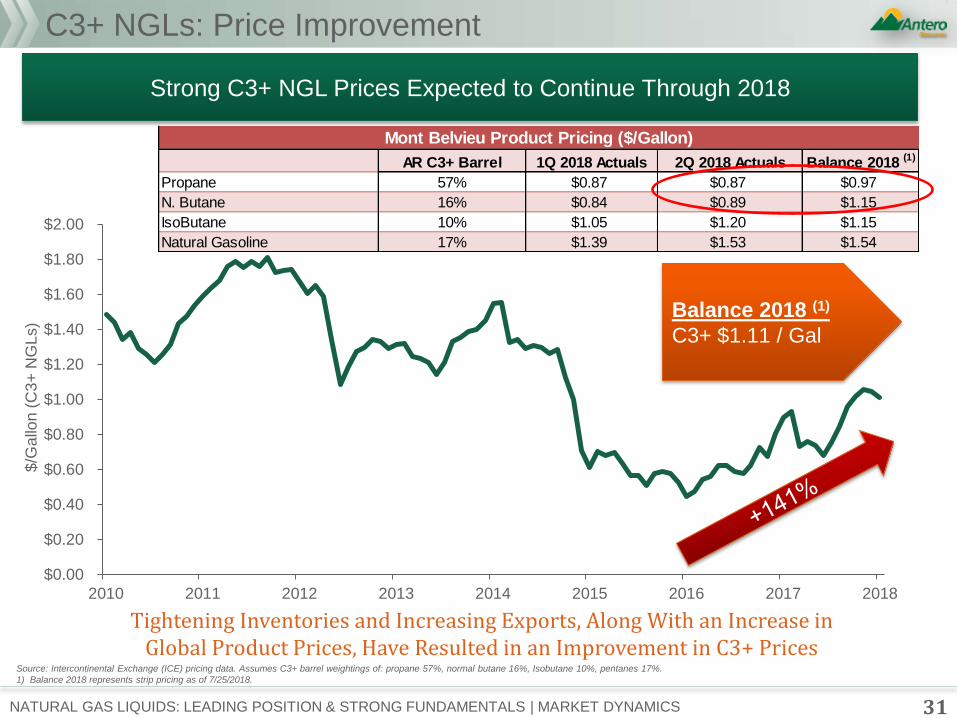
AR C3+ Barrel 1Q 2018 Actuals 2Q 2018 Actuals Balance 2018 (1)
Propane 57% $0.87 $0.87 $0.97
N. Butane 16% $0.84 $0.89 $1.15
IsoButane 10% $1.05 $1.20 $1.15
Natural Gasoline 17% $1.39 $1.53 $1.54
Mont Belvieu Product Pricing ($/Gallon)
$0.00
$0.20
$0.40
$0.60
$0.80
$1.00
$1.20
$1.40
$1.60
$1.80
$2.00
2010 2011 2012 2013 2014 2015 2016 2017 2018
$/G
allo
n (
C3
+ N
GL
s)
C3+ NGLs: Price Improvement
31 NATURAL GAS LIQUIDS: LEADING POSITION & STRONG FUNDAMENTALS | MARKET DYNAMICS
Tightening Inventories and Increasing Exports, Along With an Increase in Global Product Prices, Have Resulted in an Improvement in C3+ Prices
Strong C3+ NGL Prices Expected to Continue Through 2018
Source: Intercontinental Exchange (ICE) pricing data. Assumes C3+ barrel weightings of: propane 57%, normal butane 16%, Isobutane 10%, pentanes 17%.
1) Balance 2018 represents strip pricing as of 7/25/2018.
Balance 2018 (1)
C3+ $1.11 / Gal
Note: 2H 2018 based on 2018 balance strip pricing as of 7/25/2018. Local index represents a blend of Dominion South and TETCO M2 pricing. Midwest index represents a blend of Chicago and MichCon pricing. Gulf
Coast index represents a blend of Gulf and Nymex-based pricing.
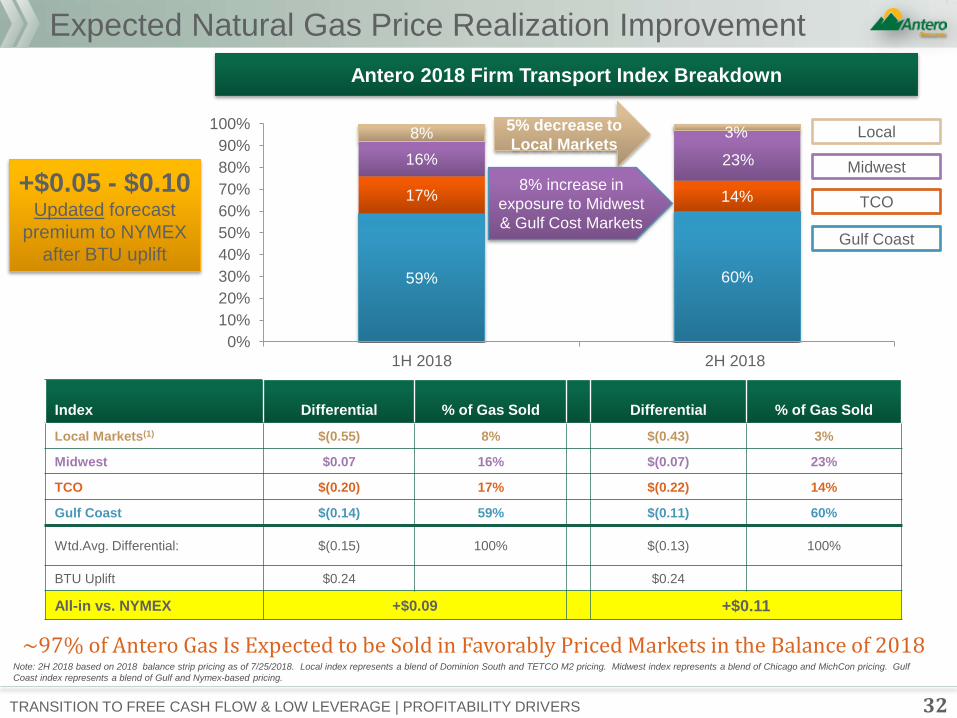
Antero 2018 Firm Transport Index Breakdown
Expected Natural Gas Price Realization Improvement
TRANSITION TO FREE CASH FLOW & LOW LEVERAGE | PROFITABILITY DRIVERS
~97% of Antero Gas Is Expected to be Sold in Favorably Priced Markets in the Balance of 2018
32
59% 60%
17% 14%
16% 23%
8% 3%
0%
10%
20%
30%
40%
50%
60%
70%
80%
90%
100%
1H 2018 2H 2018
Index Differential % of Gas Sold Differential % of Gas Sold
Local Markets(1) $(0.55) 8% $(0.43) 3%
Midwest $0.07 16% $(0.07) 23%
TCO $(0.20) 17% $(0.22) 14%
Gulf Coast $(0.14) 59% $(0.11) 60%
Wtd.Avg. Differential: $(0.15) 100% $(0.13) 100%
BTU Uplift $0.24 $0.24
All-in vs. NYMEX +$0.09 +$0.11
+$0.05 - $0.10 Updated forecast
premium to NYMEX
after BTU uplift
5% decrease to
Local Markets Local
Midwest
TCO
Gulf Coast
8% increase in
exposure to Midwest
& Gulf Cost Markets
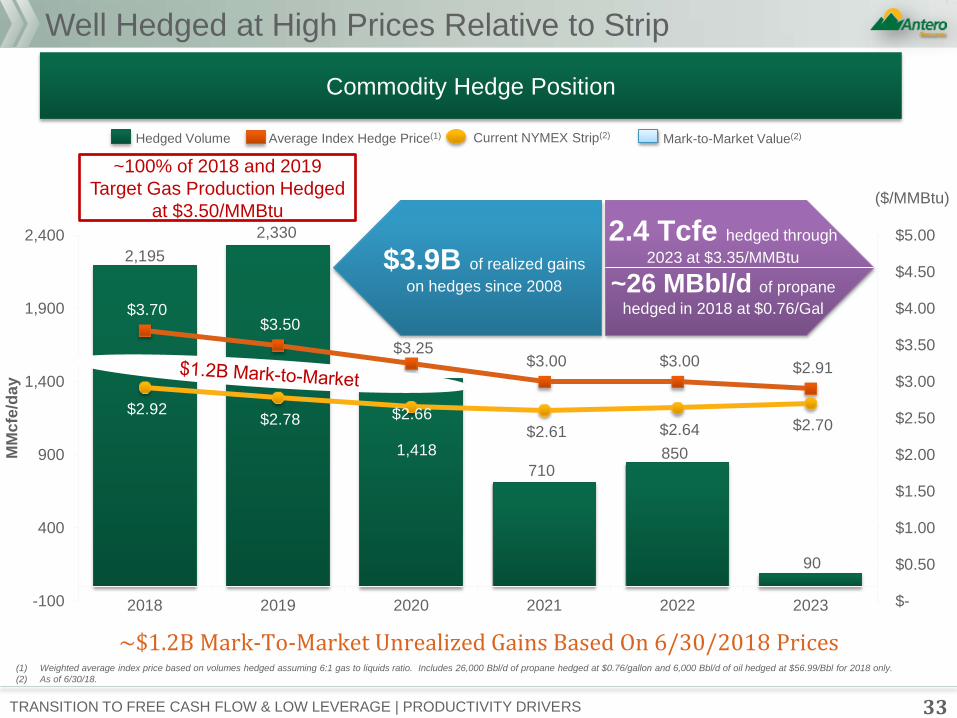
Well Hedged at High Prices Relative to Strip
TRANSITION TO FREE CASH FLOW & LOW LEVERAGE | PRODUCTIVITY DRIVERS
2,195
2,330
1,418
710 850
90
$3.70 $3.50
$3.25 $3.00 $3.00 $2.91
$2.92 $2.78 $2.66
$2.61 $2.64 $2.70
$-
$0.50
$1.00
$1.50
$2.00
$2.50
$3.00
$3.50
$4.00
$4.50
$5.00
-100
400
900
1,400
1,900
2,400
2018 2019 2020 2021 2022 2023
MM
cfe
/da
y
Average Index Hedge Price(1) Hedged Volume Current NYMEX Strip(2) Mark-to-Market Value(2)
(1) Weighted average index price based on volumes hedged assuming 6:1 gas to liquids ratio. Includes 26,000 Bbl/d of propane hedged at $0.76/gallon and 6,000 Bbl/d of oil hedged at $56.99/Bbl for 2018 only.
(2) As of 6/30/18.
Commodity Hedge Position
~$1.2B Mark-To-Market Unrealized Gains Based On 6/30/2018 Prices
2.4 Tcfe hedged through
2023 at $3.35/MMBtu
~26 MBbl/d of propane
hedged in 2018 at $0.76/Gal
$3.9B of realized gains
on hedges since 2008
33
~100% of 2018 and 2019
Target Gas Production Hedged
at $3.50/MMBtu ($/MMBtu)
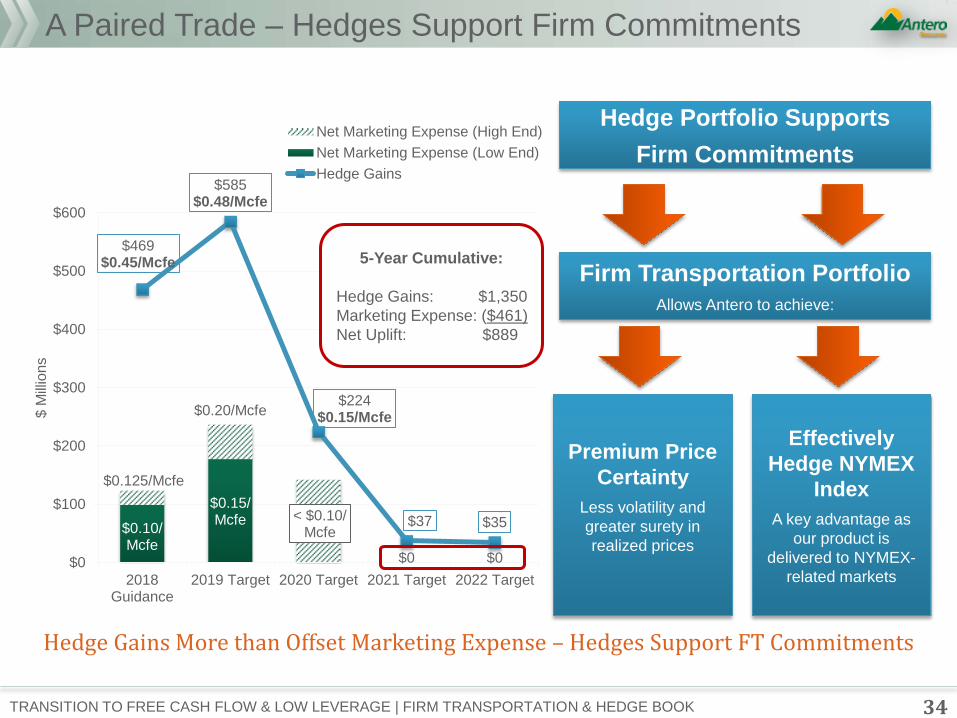
$0.10/ Mcfe
$0.15/ Mcfe < $0.10/
Mcfe
$0 $0
$0.125/Mcfe
$0.20/Mcfe
$469 $0.45/Mcfe
$585 $0.48/Mcfe
$224 $0.15/Mcfe
$37 $35
$0
$100
$200
$300
$400
$500
$600
2018Guidance
2019 Target 2020 Target 2021 Target 2022 Target
$ M
illio
ns
Net Marketing Expense (High End)
Net Marketing Expense (Low End)
Hedge Gains
34 TRANSITION TO FREE CASH FLOW & LOW LEVERAGE | FIRM TRANSPORTATION & HEDGE BOOK
A Paired Trade – Hedges Support Firm Commitments
Hedge Gains More than Offset Marketing Expense – Hedges Support FT Commitments
Firm Transportation Portfolio
Allows Antero to achieve:
Effectively
Hedge NYMEX
Index
A key advantage as
our product is
delivered to NYMEX-
related markets
Premium Price
Certainty
Less volatility and
greater surety in
realized prices
5-Year Cumulative:
Hedge Gains: $1,350
Marketing Expense: ($461)
Net Uplift: $889
Hedge Portfolio Supports
Firm Commitments
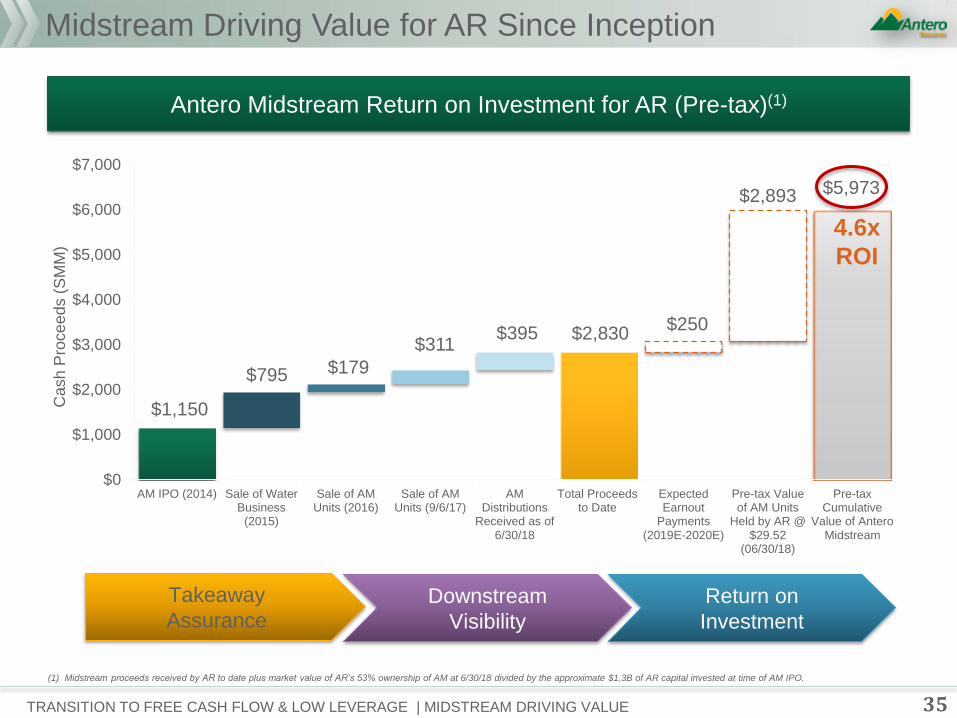
$1,150
$2,830
$5,973
$795 $179
$311 $395
$250
$2,893
$0
$1,000
$2,000
$3,000
$4,000
$5,000
$6,000
$7,000
AM IPO (2014) Sale of WaterBusiness
(2015)
Sale of AMUnits (2016)
Sale of AMUnits (9/6/17)
AMDistributions
Received as of6/30/18
Total Proceedsto Date
ExpectedEarnout
Payments(2019E-2020E)
Pre-tax Valueof AM Units
Held by AR @$29.52
(06/30/18)
Pre-taxCumulative
Value of AnteroMidstream
Cash
Pro
ce
ed
s (
SM
M)
Midstream Driving Value for AR Since Inception
Antero Midstream Return on Investment for AR (Pre-tax)(1)
4.6x
ROI
Takeaway
Assurance Return on
Investment
Downstream
Visibility
(1) Midstream proceeds received by AR to date plus market value of AR’s 53% ownership of AM at 6/30/18 divided by the approximate $1.3B of AR capital invested at time of AM IPO.
35 TRANSITION TO FREE CASH FLOW & LOW LEVERAGE | MIDSTREAM DRIVING VALUE
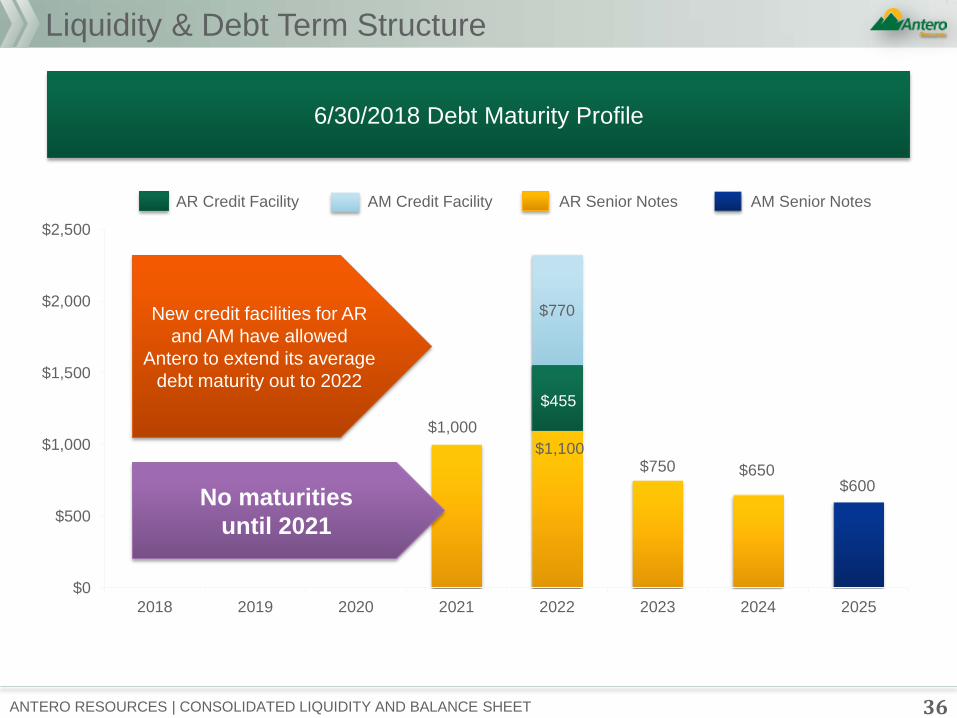
6/30/2018 Debt Maturity Profile
$1,000
$1,100 $750 $650
$600
$455
$770
$0
$500
$1,000
$1,500
$2,000
$2,500
2018 2019 2020 2021 2022 2023 2024 2025
Liquidity & Debt Term Structure
AR Credit Facility AM Credit Facility AR Senior Notes AM Senior Notes
New credit facilities for AR
and AM have allowed
Antero to extend its average
debt maturity out to 2022
36 ANTERO RESOURCES | CONSOLIDATED LIQUIDITY AND BALANCE SHEET
No maturities
until 2021
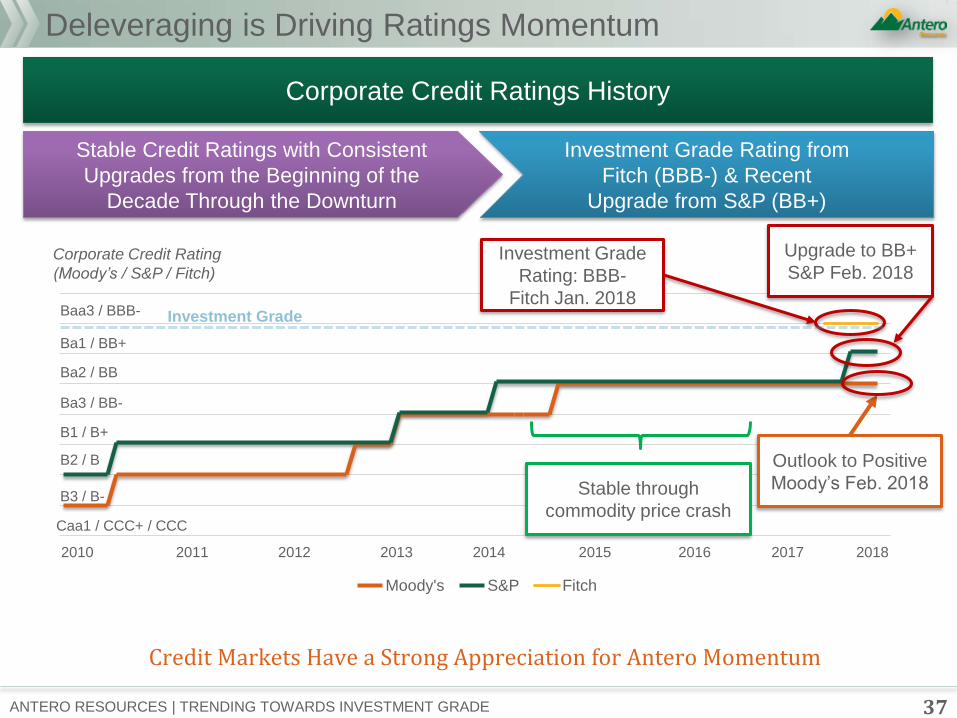
Deleveraging is Driving Ratings Momentum
37 ANTERO RESOURCES | TRENDING TOWARDS INVESTMENT GRADE
Moody's S&P Fitch
Corporate Credit Ratings History
Corporate Credit Rating
(Moody’s / S&P / Fitch)
Ba3 / BB-
B1 / B+
B2 / B
B3 / B-
Ba2 / BB
Ba1 / BB+
Caa1 / CCC+ / CCC
Baa3 / BBB-
2010
Investment Grade
Rating: BBB-
Fitch Jan. 2018
Stable through
commodity price crash
Credit Markets Have a Strong Appreciation for Antero Momentum
Investment Grade Rating from
Fitch (BBB-) & Recent
Upgrade from S&P (BB+)
Stable Credit Ratings with Consistent
Upgrades from the Beginning of the
Decade Through the Downturn
2011 2012 2013 2014 2015 2016 2017 2018
Upgrade to BB+
S&P Feb. 2018
Investment Grade
Outlook to Positive
Moody’s Feb. 2018
Antero Midstream Overview: Disciplined Capital Efficient Business Model
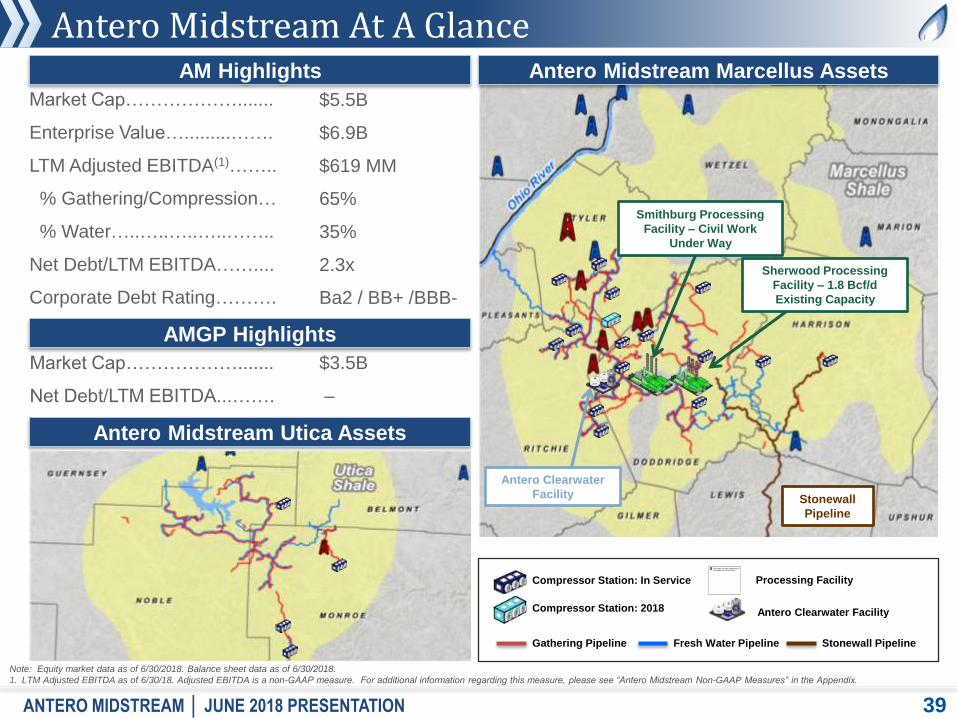
Antero Midstream At A Glance
39
Market Cap……………….......
Enterprise Value….........…….
LTM Adjusted EBITDA(1)……..
% Gathering/Compression…
% Water…..…..…..…..……..
Net Debt/LTM EBITDA……....
Corporate Debt Rating……….
$5.5B
$6.9B
$619 MM
65%
35%
2.3x
Ba2 / BB+ /BBB-
Note: Equity market data as of 6/30/2018. Balance sheet data as of 6/30/2018.
1. LTM Adjusted EBITDA as of 6/30/18. Adjusted EBITDA is a non-GAAP measure. For additional information regarding this measure, please see “Antero Midstream Non-GAAP Measures” in the Appendix.
ANTERO MIDSTREAM │ JUNE 2018 PRESENTATION
AM Highlights Antero Midstream Marcellus Assets
Compressor Station: In Service
Antero Clearwater Facility
Processing Facility
Compressor Station: 2018
Gathering Pipeline Fresh Water Pipeline Stonewall Pipeline
Sherwood Processing
Facility – 1.8 Bcf/d
Existing Capacity
Antero Clearwater
Facility Stonewall
Pipeline
AMGP Highlights
Market Cap……………….......
Net Debt/LTM EBITDA...…….
$3.5B
–
Antero Midstream Utica Assets
Smithburg Processing
Facility – Civil Work
Under Way
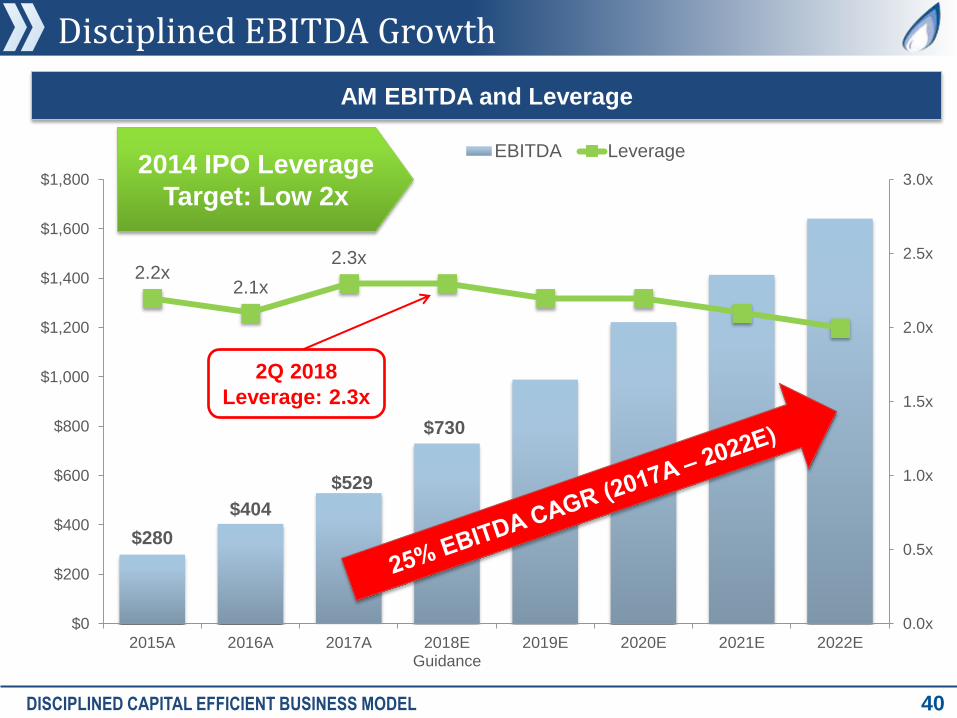
$280
$404
$529
$730
2.2x 2.1x
2.3x
0.0x
0.5x
1.0x
1.5x
2.0x
2.5x
3.0x
$0
$200
$400
$600
$800
$1,000
$1,200
$1,400
$1,600
$1,800
2015A 2016A 2017A 2018EGuidance
2019E 2020E 2021E 2022E
EBITDA Leverage
Disciplined EBITDA Growth
40
AM EBITDA and Leverage
2014 IPO Leverage
Target: Low 2x
DISCIPLINED CAPITAL EFFICIENT BUSINESS MODEL
2Q 2018
Leverage: 2.3x
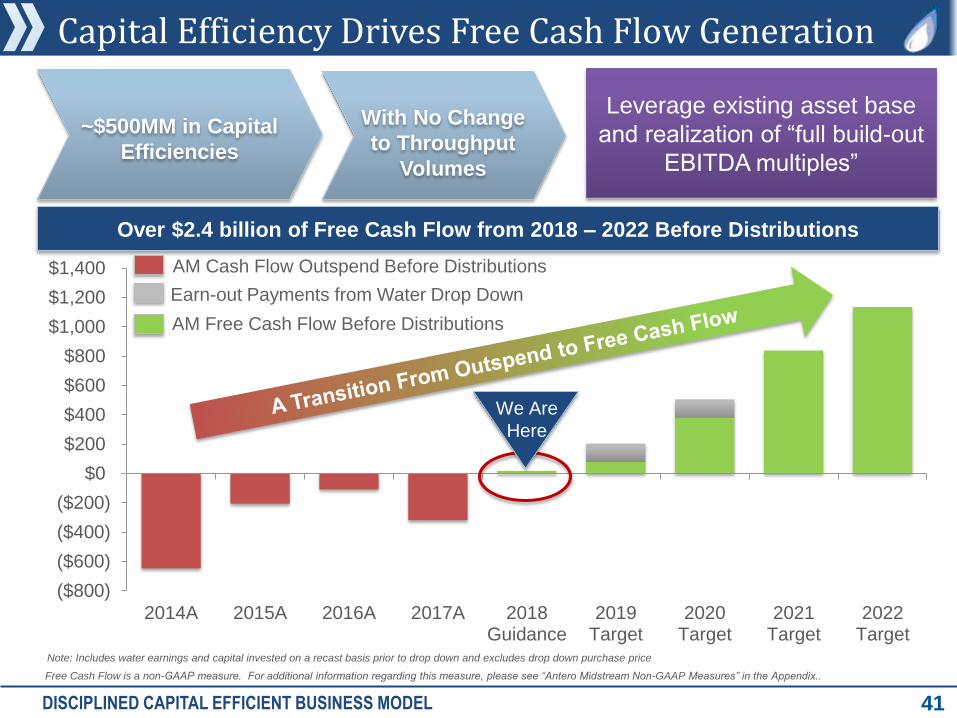
Capital Efficiency Drives Free Cash Flow Generation
DISCIPLINED CAPITAL EFFICIENT BUSINESS MODEL 41
AM Throughput Growth
Over $2.4 billion of Free Cash Flow from 2018 – 2022 Before Distributions
($800)
($600)
($400)
($200)
$0
$200
$400
$600
$800
$1,000
$1,200
$1,400
2014A 2015A 2016A 2017A 2018Guidance
2019Target
2020Target
2021Target
2022Target
AM Cash Flow Outspend Before Distributions
With No Change
to Throughput
Volumes
~$500MM in Capital
Efficiencies
Earn-out Payments from Water Drop Down
Leverage existing asset base
and realization of ―full build-out
EBITDA multiples‖
Note: Includes water earnings and capital invested on a recast basis prior to drop down and excludes drop down purchase price
We Are
Here
AM Free Cash Flow Before Distributions
Free Cash Flow is a non-GAAP measure. For additional information regarding this measure, please see “Antero Midstream Non-GAAP Measures” in the Appendix..
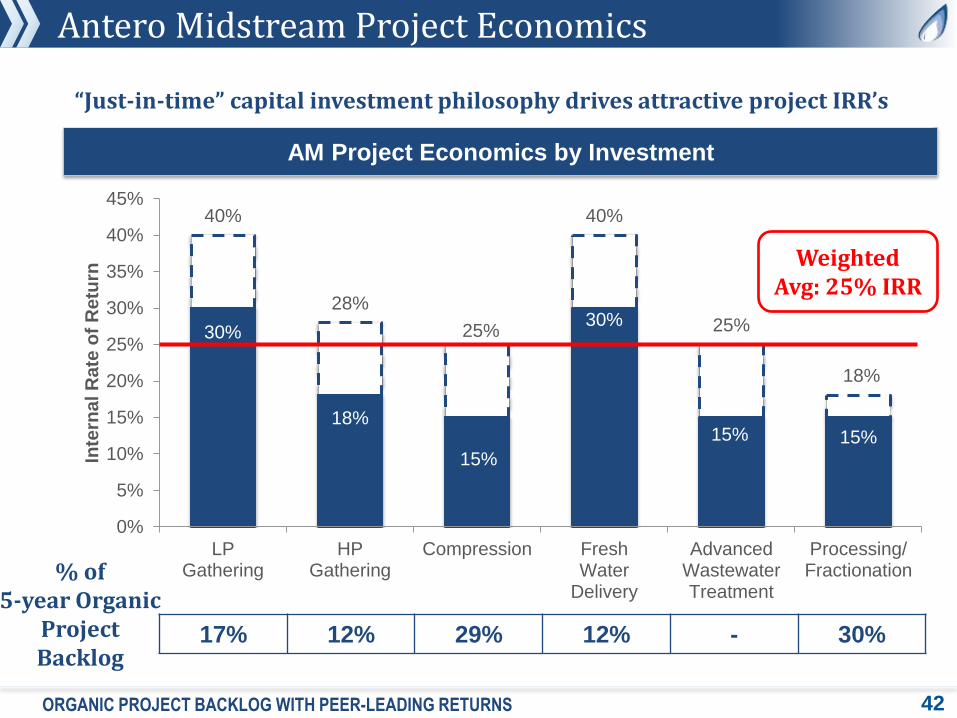
Antero Midstream Project Economics
42
AM Project Economics by Investment
30%
18%
15%
30%
15% 15%
40%
28%
25%
40%
25%
18%
0%
5%
10%
15%
20%
25%
30%
35%
40%
45%
LPGathering
HPGathering
Compression FreshWater
Delivery
AdvancedWastewaterTreatment
Processing/Fractionation
Inte
rna
l R
ate
of
Re
turn
“Just-in-time” capital investment philosophy drives attractive project IRR’s
17% 12% 29% 12% - 30%
% of 5-year Organic
Project Backlog
Weighted Avg: 25% IRR
ORGANIC PROJECT BACKLOG WITH PEER-LEADING RETURNS
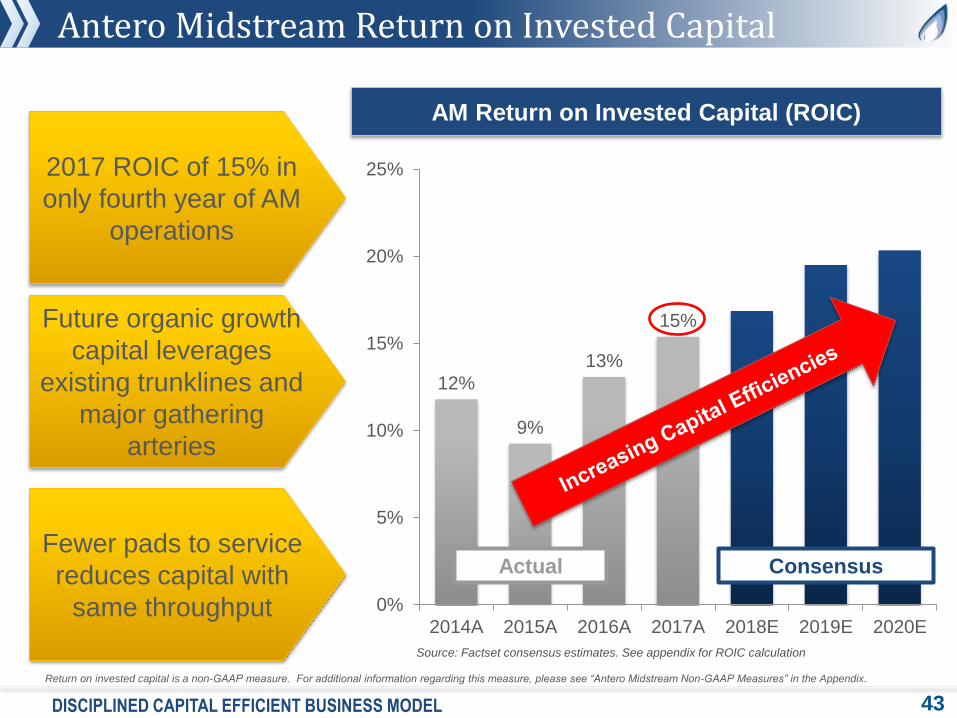
Antero Midstream Return on Invested Capital
43
AM Return on Invested Capital (ROIC)
2017 ROIC of 15% in
only fourth year of AM
operations
Future organic growth
capital leverages
existing trunklines and
major gathering
arteries
12%
9%
13%
15%
0%
5%
10%
15%
20%
25%
2014A 2015A 2016A 2017A 2018E 2019E 2020E
Actual Consensus
Source: Factset consensus estimates. See appendix for ROIC calculation
Fewer pads to service
reduces capital with
same throughput
DISCIPLINED CAPITAL EFFICIENT BUSINESS MODEL
Return on invested capital is a non-GAAP measure. For additional information regarding this measure, please see “Antero Midstream Non-GAAP Measures” in the Appendix.
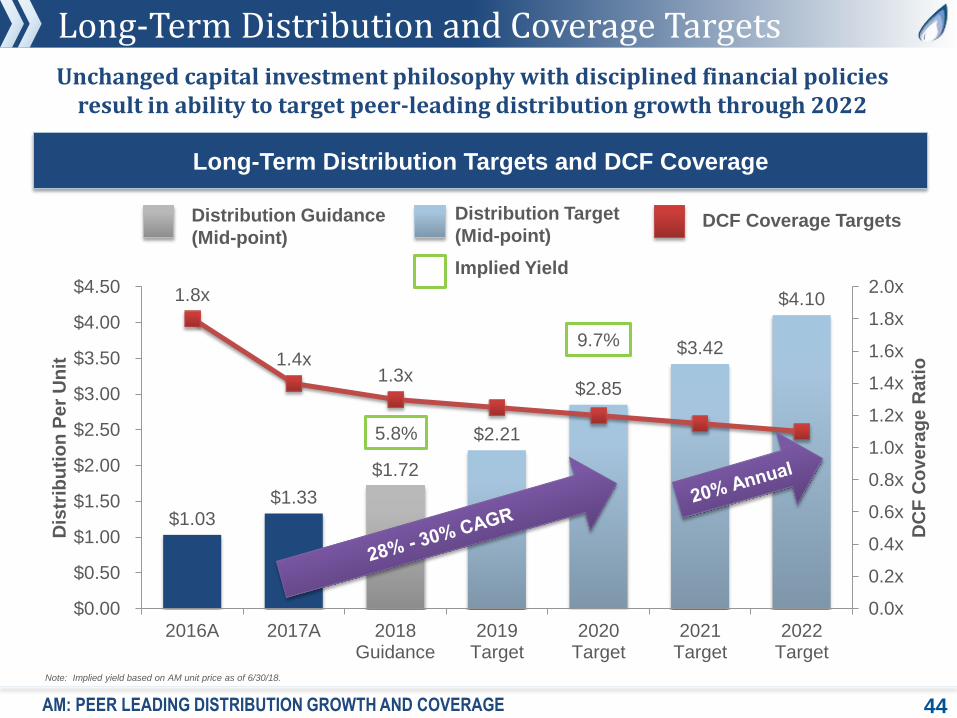
Long-Term Distribution and Coverage Targets
44
$1.03 $1.33
$1.72
$2.21
$2.85
$3.42
$4.10 1.8x
1.4x 1.3x
0.0x
0.2x
0.4x
0.6x
0.8x
1.0x
1.2x
1.4x
1.6x
1.8x
2.0x
$0.00
$0.50
$1.00
$1.50
$2.00
$2.50
$3.00
$3.50
$4.00
$4.50
2016A 2017A 2018Guidance
2019Target
2020Target
2021Target
2022Target
DC
F C
ove
rag
e R
ati
o
Dis
trib
uti
on
Pe
r U
nit
Distribution Guidance
(Mid-point)
Long-Term Distribution Targets and DCF Coverage
Unchanged capital investment philosophy with disciplined financial policies result in ability to target peer-leading distribution growth through 2022
Distribution Target
(Mid-point) DCF Coverage Targets
Note: Implied yield based on AM unit price as of 6/30/18.
Implied Yield
9.7%
5.8%
AM: PEER LEADING DISTRIBUTION GROWTH AND COVERAGE
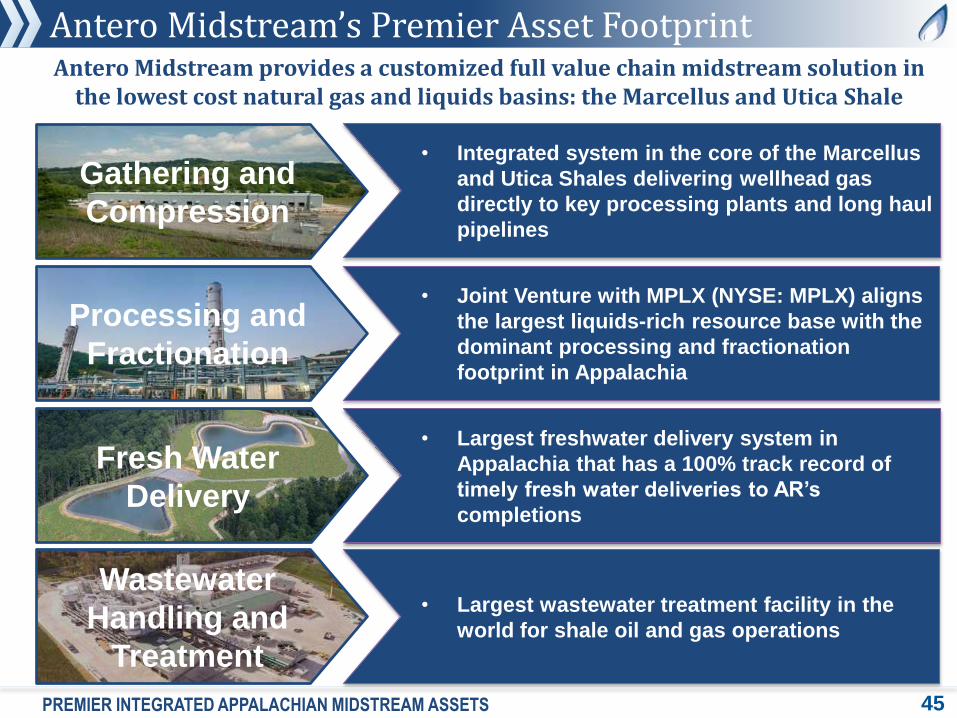
Antero Midstream’s Premier Asset Footprint
Gathering and
Compression
Fresh Water
Delivery
Wastewater
Handling and
Treatment
Processing and
Fractionation
Antero Midstream provides a customized full value chain midstream solution in the lowest cost natural gas and liquids basins: the Marcellus and Utica Shale
• Integrated system in the core of the Marcellus
and Utica Shales delivering wellhead gas
directly to key processing plants and long haul
pipelines
• Joint Venture with MPLX (NYSE: MPLX) aligns
the largest liquids-rich resource base with the
dominant processing and fractionation
footprint in Appalachia
• Largest freshwater delivery system in
Appalachia that has a 100% track record of
timely fresh water deliveries to AR’s
completions
• Largest wastewater treatment facility in the
world for shale oil and gas operations
PREMIER INTEGRATED APPALACHIAN MIDSTREAM ASSETS 45
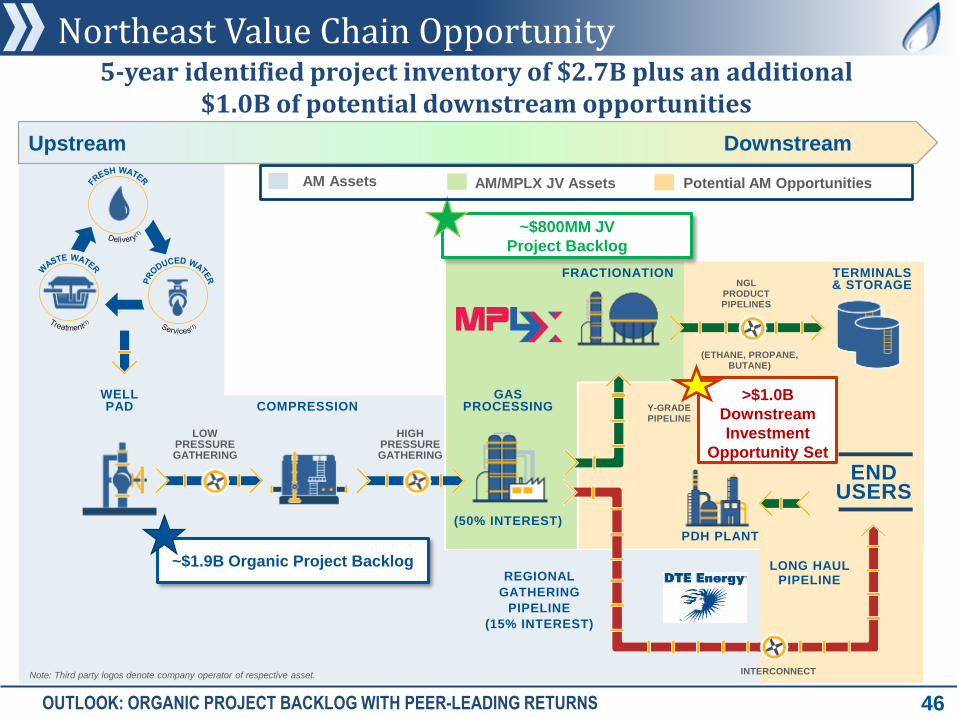
Northeast Value Chain Opportunity
46
~$1.9B Organic Project Backlog
~$800MM JV
Project Backlog
WELL PAD
LOW PRESSURE GATHERING
HIGH PRESSURE GATHERING
COMPRESSION
GAS PROCESSING
(50% INTEREST)
REGIONAL
GATHERING
PIPELINE
(15% INTEREST)
FRACTIONATION TERMINALS & STORAGE
Y-GRADE PIPELINE
(ETHANE, PROPANE, BUTANE)
NGL PRODUCT PIPELINES
LONG HAUL PIPELINE
INTERCONNECT
END USERS
PDH PLANT
>$1.0B
Downstream
Investment
Opportunity Set
Note: Third party logos denote company operator of respective asset.
AM Assets AM/MPLX JV Assets Potential AM Opportunities
Upstream Downstream
5-year identified project inventory of $2.7B plus an additional $1.0B of potential downstream opportunities
OUTLOOK: ORGANIC PROJECT BACKLOG WITH PEER-LEADING RETURNS
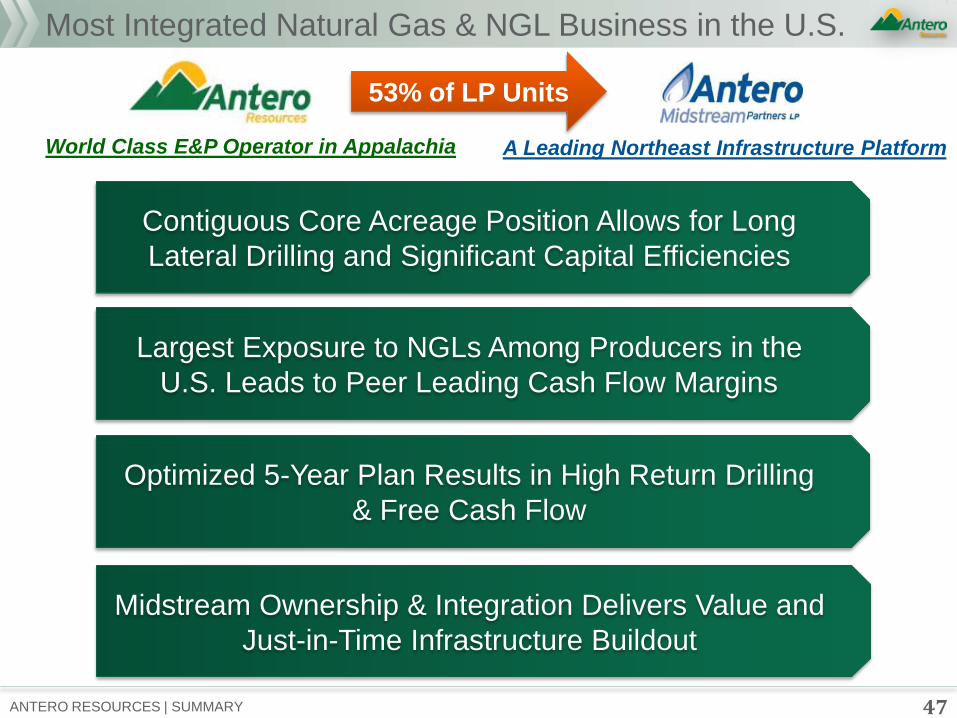
Most Integrated Natural Gas & NGL Business in the U.S.
47 ANTERO RESOURCES | SUMMARY
World Class E&P Operator in Appalachia A Leading Northeast Infrastructure Platform
Contiguous Core Acreage Position Allows for Long
Lateral Drilling and Significant Capital Efficiencies
Largest Exposure to NGLs Among Producers in the
U.S. Leads to Peer Leading Cash Flow Margins
Optimized 5-Year Plan Results in High Return Drilling
& Free Cash Flow
Midstream Ownership & Integration Delivers Value and
Just-in-Time Infrastructure Buildout
53% of LP Units
Appendix
APPENDIX | 2018 GUIDANCE
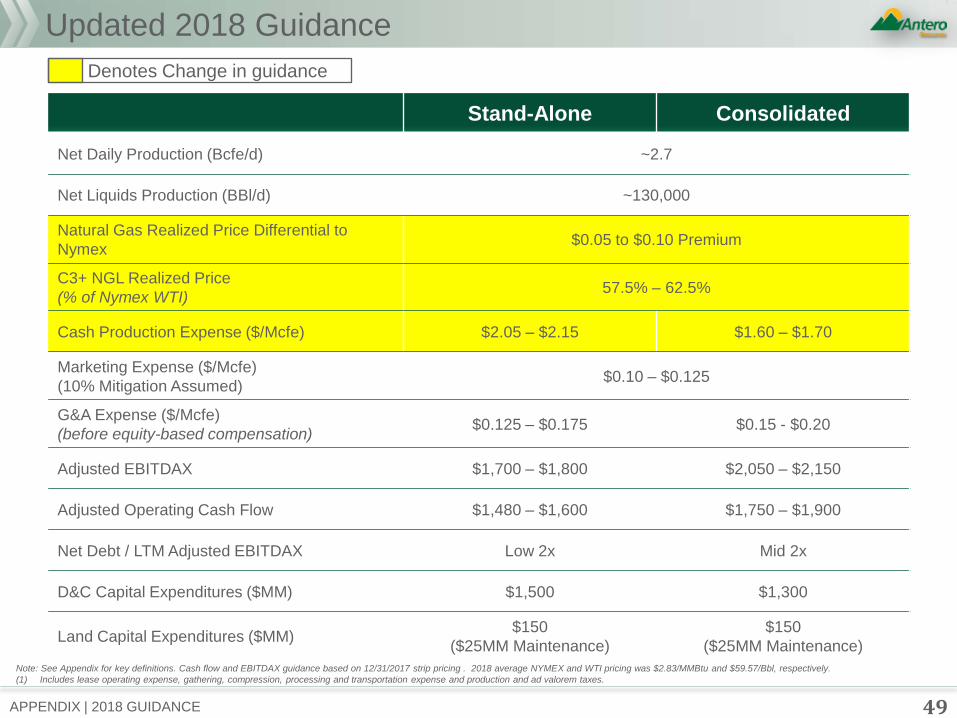
Updated 2018 Guidance
Stand-Alone Consolidated
Net Daily Production (Bcfe/d) ~2.7
Net Liquids Production (BBl/d) ~130,000
Natural Gas Realized Price Differential to
Nymex $0.05 to $0.10 Premium
C3+ NGL Realized Price
(% of Nymex WTI) 57.5% – 62.5%
Cash Production Expense ($/Mcfe) $2.05 – $2.15 $1.60 – $1.70
Marketing Expense ($/Mcfe)
(10% Mitigation Assumed) $0.10 – $0.125
G&A Expense ($/Mcfe)
(before equity-based compensation) $0.125 – $0.175 $0.15 - $0.20
Adjusted EBITDAX $1,700 – $1,800 $2,050 – $2,150
Adjusted Operating Cash Flow $1,480 – $1,600 $1,750 – $1,900
Net Debt / LTM Adjusted EBITDAX Low 2x Mid 2x
D&C Capital Expenditures ($MM) $1,500 $1,300
Land Capital Expenditures ($MM) $150
($25MM Maintenance)
$150
($25MM Maintenance)
Note: See Appendix for key definitions. Cash flow and EBITDAX guidance based on 12/31/2017 strip pricing . 2018 average NYMEX and WTI pricing was $2.83/MMBtu and $59.57/Bbl, respectively.
(1) Includes lease operating expense, gathering, compression, processing and transportation expense and production and ad valorem taxes.
49
Denotes Change in guidance
APPENDIX | 5-YEAR ASSUMPTIONS
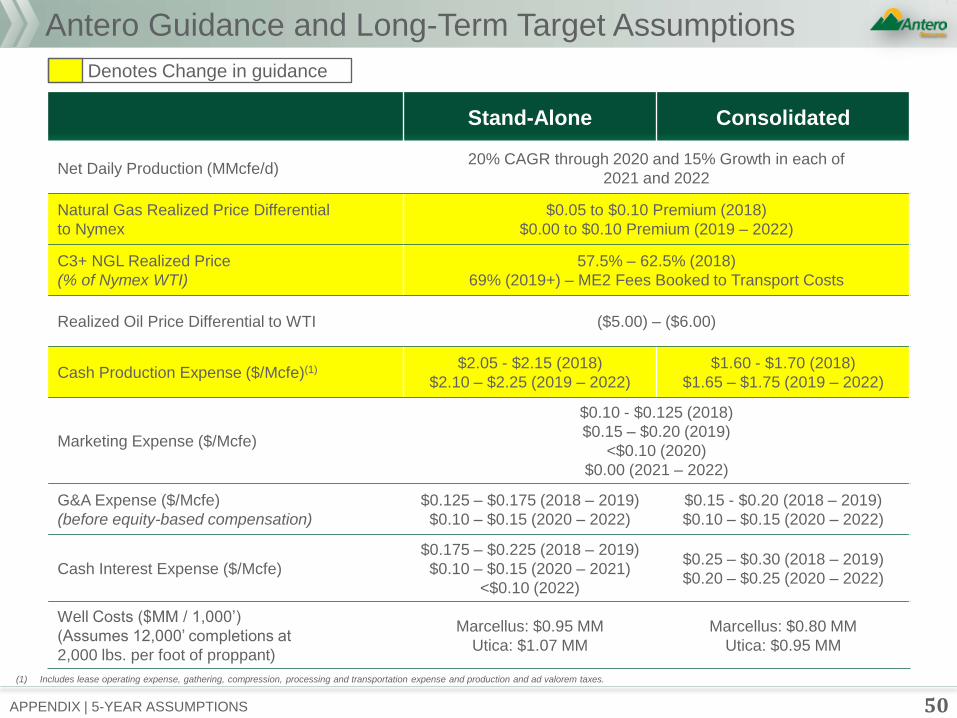
Antero Guidance and Long-Term Target Assumptions
Stand-Alone Consolidated
Net Daily Production (MMcfe/d) 20% CAGR through 2020 and 15% Growth in each of
2021 and 2022
Natural Gas Realized Price Differential
to Nymex
$0.05 to $0.10 Premium (2018)
$0.00 to $0.10 Premium (2019 – 2022)
C3+ NGL Realized Price
(% of Nymex WTI)
57.5% – 62.5% (2018)
69% (2019+) – ME2 Fees Booked to Transport Costs
Realized Oil Price Differential to WTI ($5.00) – ($6.00)
Cash Production Expense ($/Mcfe)(1) $2.05 - $2.15 (2018)
$2.10 – $2.25 (2019 – 2022)
$1.60 - $1.70 (2018)
$1.65 – $1.75 (2019 – 2022)
Marketing Expense ($/Mcfe)
$0.10 - $0.125 (2018)
$0.15 – $0.20 (2019)
<$0.10 (2020)
$0.00 (2021 – 2022)
G&A Expense ($/Mcfe)
(before equity-based compensation)
$0.125 – $0.175 (2018 – 2019)
$0.10 – $0.15 (2020 – 2022)
$0.15 - $0.20 (2018 – 2019)
$0.10 – $0.15 (2020 – 2022)
Cash Interest Expense ($/Mcfe)
$0.175 – $0.225 (2018 – 2019)
$0.10 – $0.15 (2020 – 2021)
<$0.10 (2022)
$0.25 – $0.30 (2018 – 2019)
$0.20 – $0.25 (2020 – 2022)
Well Costs ($MM / 1,000’)
(Assumes 12,000’ completions at
2,000 lbs. per foot of proppant)
Marcellus: $0.95 MM
Utica: $1.07 MM
Marcellus: $0.80 MM
Utica: $0.95 MM
(1) Includes lease operating expense, gathering, compression, processing and transportation expense and production and ad valorem taxes.
50
Denotes Change in guidance
51 APPENDIX | 5-YEAR ASSUMPTIONS
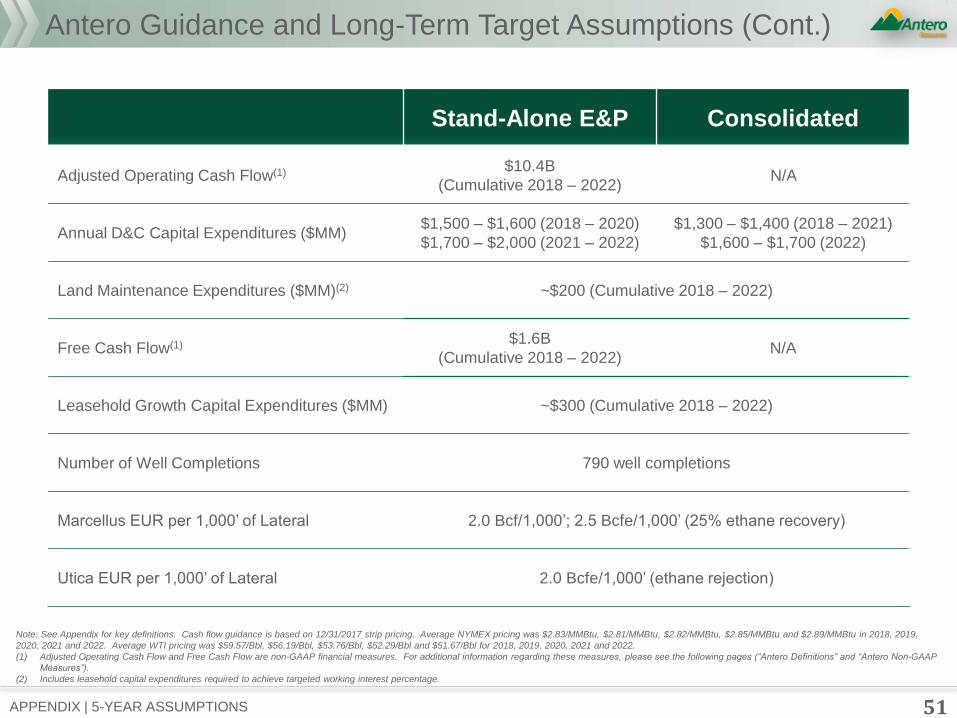
Antero Guidance and Long-Term Target Assumptions (Cont.)
Stand-Alone E&P Consolidated
Adjusted Operating Cash Flow(1) $10.4B
(Cumulative 2018 – 2022) N/A
Annual D&C Capital Expenditures ($MM) $1,500 – $1,600 (2018 – 2020)
$1,700 – $2,000 (2021 – 2022)
$1,300 – $1,400 (2018 – 2021)
$1,600 – $1,700 (2022)
Land Maintenance Expenditures ($MM)(2) ~$200 (Cumulative 2018 – 2022)
Free Cash Flow(1) $1.6B
(Cumulative 2018 – 2022) N/A
Leasehold Growth Capital Expenditures ($MM) ~$300 (Cumulative 2018 – 2022)
Number of Well Completions 790 well completions
Marcellus EUR per 1,000’ of Lateral 2.0 Bcf/1,000’; 2.5 Bcfe/1,000’ (25% ethane recovery)
Utica EUR per 1,000’ of Lateral 2.0 Bcfe/1,000’ (ethane rejection)
Note: See Appendix for key definitions. Cash flow guidance is based on 12/31/2017 strip pricing. Average NYMEX pricing was $2.83/MMBtu, $2.81/MMBtu, $2.82/MMBtu, $2.85/MMBtu and $2.89/MMBtu in 2018, 2019,
2020, 2021 and 2022. Average WTI pricing was $59.57/Bbl, $56.19/Bbl, $53.76/Bbl, $52.29/Bbl and $51.67/Bbl for 2018, 2019, 2020, 2021 and 2022.
(1) Adjusted Operating Cash Flow and Free Cash Flow are non-GAAP financial measures. For additional information regarding these measures, please see the following pages (“Antero Definitions” and “Antero Non-GAAP
Measures”).
(2) Includes leasehold capital expenditures required to achieve targeted working interest percentage.
52 APPENDIX | PROJECT ASSUMPTIONS
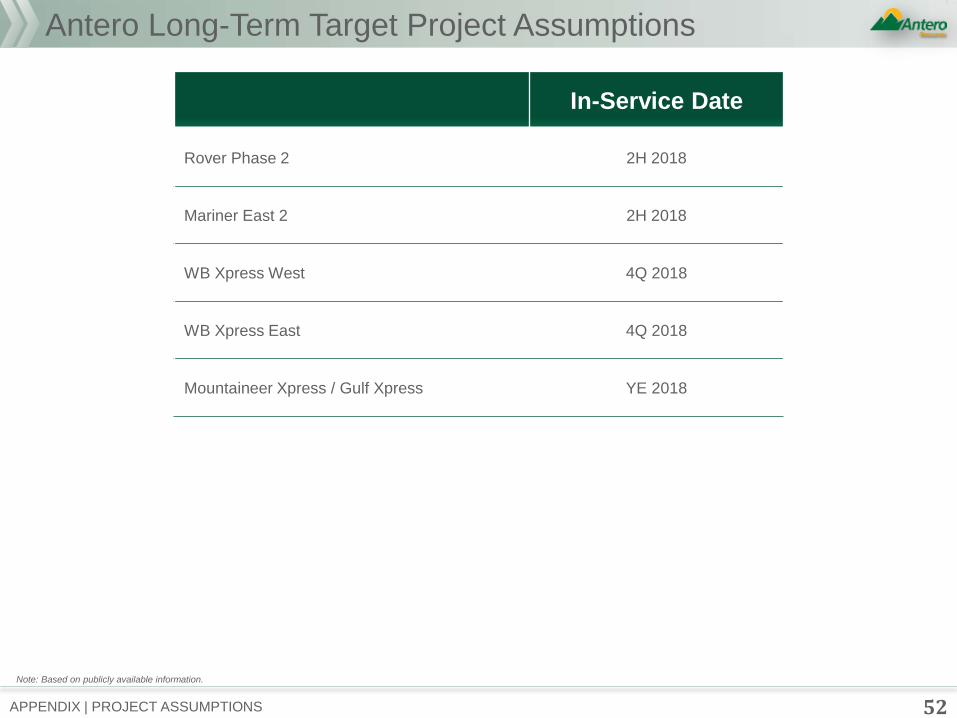
Antero Long-Term Target Project Assumptions
In-Service Date
Rover Phase 2 2H 2018
Mariner East 2 2H 2018
WB Xpress West 4Q 2018
WB Xpress East 4Q 2018
Mountaineer Xpress / Gulf Xpress YE 2018
Note: Based on publicly available information.
53 APPENDIX | ASSUMPTIONS
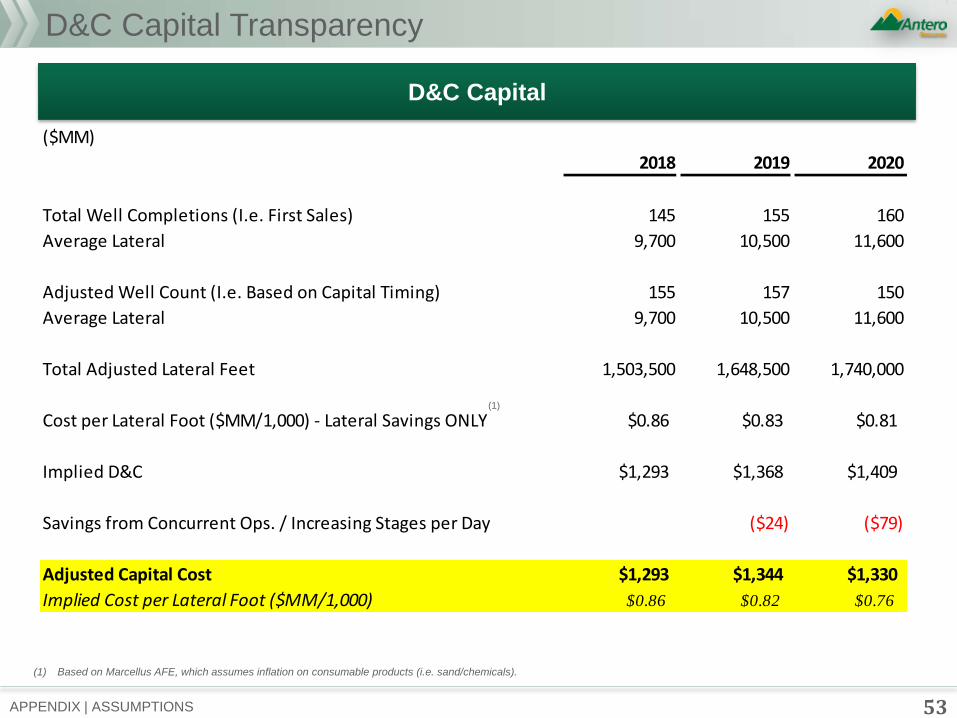
D&C Capital Transparency
D&C Capital
(1)
(1) Based on Marcellus AFE, which assumes inflation on consumable products (i.e. sand/chemicals).
($MM)
2018 2019 2020
Total Well Completions (I.e. First Sales) 145 155 160
Average Lateral 9,700 10,500 11,600
Adjusted Well Count (I.e. Based on Capital Timing) 155 157 150
Average Lateral 9,700 10,500 11,600
Total Adjusted Lateral Feet 1,503,500 1,648,500 1,740,000
Cost per Lateral Foot ($MM/1,000) - Lateral Savings ONLY $0.86 $0.83 $0.81
Implied D&C $1,293 $1,368 $1,409
Savings from Concurrent Ops. / Increasing Stages per Day ($24) ($79)
Adjusted Capital Cost $1,293 $1,344 $1,330
Implied Cost per Lateral Foot ($MM/1,000) $0.86 $0.82 $0.76
54 APPENDIX | PRICING ASSUMPTIONS
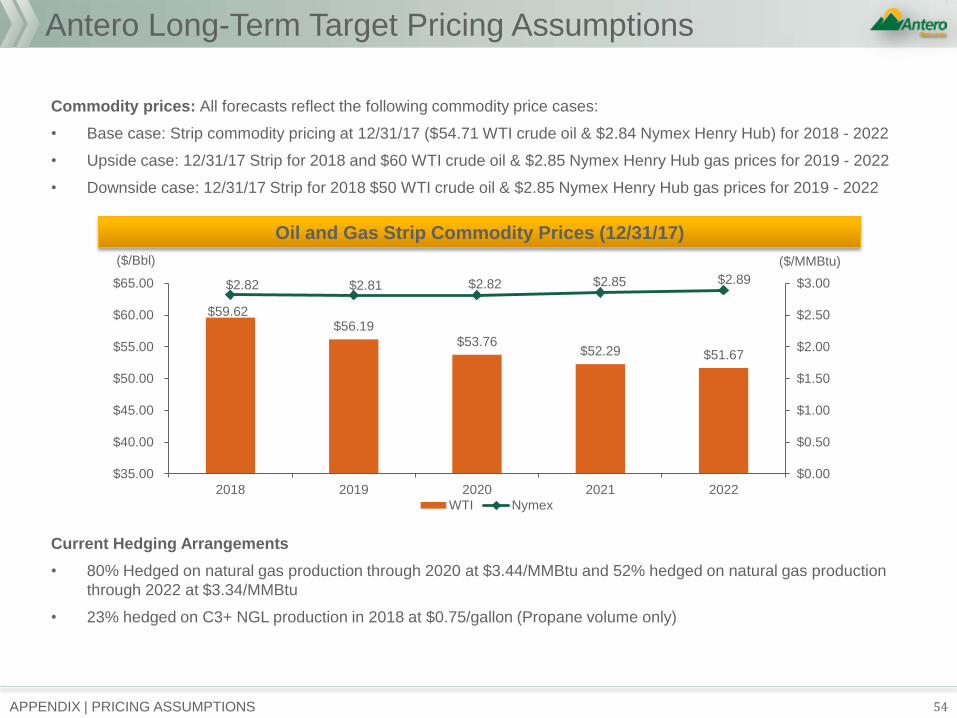
Antero Long-Term Target Pricing Assumptions
Commodity prices: All forecasts reflect the following commodity price cases:
• Base case: Strip commodity pricing at 12/31/17 ($54.71 WTI crude oil & $2.84 Nymex Henry Hub) for 2018 - 2022
• Upside case: 12/31/17 Strip for 2018 and $60 WTI crude oil & $2.85 Nymex Henry Hub gas prices for 2019 - 2022
• Downside case: 12/31/17 Strip for 2018 $50 WTI crude oil & $2.85 Nymex Henry Hub gas prices for 2019 - 2022
Current Hedging Arrangements
• 80% Hedged on natural gas production through 2020 at $3.44/MMBtu and 52% hedged on natural gas production
through 2022 at $3.34/MMBtu
• 23% hedged on C3+ NGL production in 2018 at $0.75/gallon (Propane volume only)
Oil and Gas Strip Commodity Prices (12/31/17)
$59.62 $56.19
$53.76 $52.29 $51.67
$2.82 $2.81 $2.82 $2.85 $2.89
$0.00
$0.50
$1.00
$1.50
$2.00
$2.50
$3.00
$35.00
$40.00
$45.00
$50.00
$55.00
$60.00
$65.00
2018 2019 2020 2021 2022WTI Nymex
($/Bbl) ($/MMBtu)
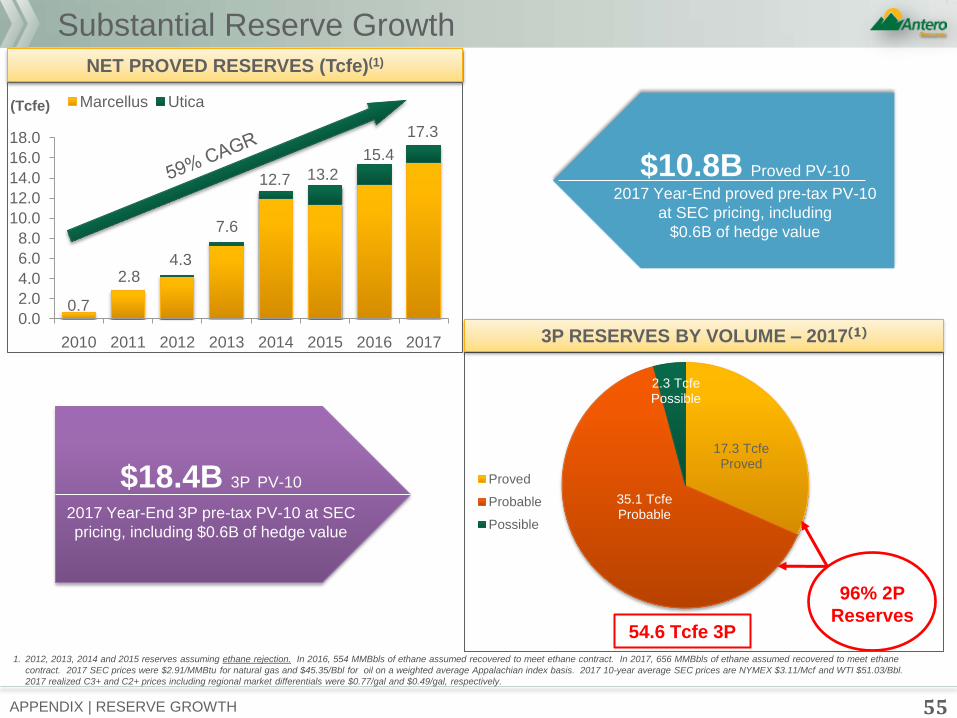
17.3 Tcfe Proved
35.1 Tcfe Probable
2.3 Tcfe Possible
Proved
Probable
Possible
54.6 Tcfe 3P
96% 2P
Reserves
1. 2012, 2013, 2014 and 2015 reserves assuming ethane rejection. In 2016, 554 MMBbls of ethane assumed recovered to meet ethane contract. In 2017, 656 MMBbls of ethane assumed recovered to meet ethane
contract. 2017 SEC prices were $2.91/MMBtu for natural gas and $45.35/Bbl for oil on a weighted average Appalachian index basis. 2017 10-year average SEC prices are NYMEX $3.11/Mcf and WTI $51.03/Bbl.
2017 realized C3+ and C2+ prices including regional market differentials were $0.77/gal and $0.49/gal, respectively.
3P RESERVES BY VOLUME – 2017(1)
NET PROVED RESERVES (Tcfe)(1)
6/30/2017 RESERVE ADDITIONS
• Proved reserves increased 7% to 16.5 Tcfe
− Proved pre-tax PV-10 at SEC pricing of $9.3 billion, including
$1.3 billion of hedge value
−Proved pre-tax PV-10 at strip pricing of $10.1 billion, including
$1.7 billion of hedge value
− Increased Marcellus wellhead type curve to 2.0 Bcf/1,000’ of
lateral for additional 199 PUD locations
• 3P reserves increased 14% to 53.0 Tcfe
− 3P PV-10 at strip pricing of $17.0 billion, including $1.7 billion of
hedge value
− Increased Marcellus wellhead type curve to 2.0 Bcf/1,000’ of
lateral for additional 398 Probable locations
• All-in F&D cost of $0.48/Mcfe for proved reserve additions
during six months ended 6/30/2017
0.0
2.0
4.0
6.0
8.0
10.0
12.0
14.0
16.0
18.0
2010 2011 2012 2013 2014 2015 2016 2017
Marcellus Utica
0.7
2.8 4.3
7.6
12.7
(Tcfe)
13.2
15.4
17.3
Substantial Reserve Growth
55 APPENDIX | RESERVE GROWTH
$10.8B Proved PV-10
2017 Year-End proved pre-tax PV-10
at SEC pricing, including
$0.6B of hedge value
$18.4B 3P PV-10
2017 Year-End 3P pre-tax PV-10 at SEC
pricing, including $0.6B of hedge value
56
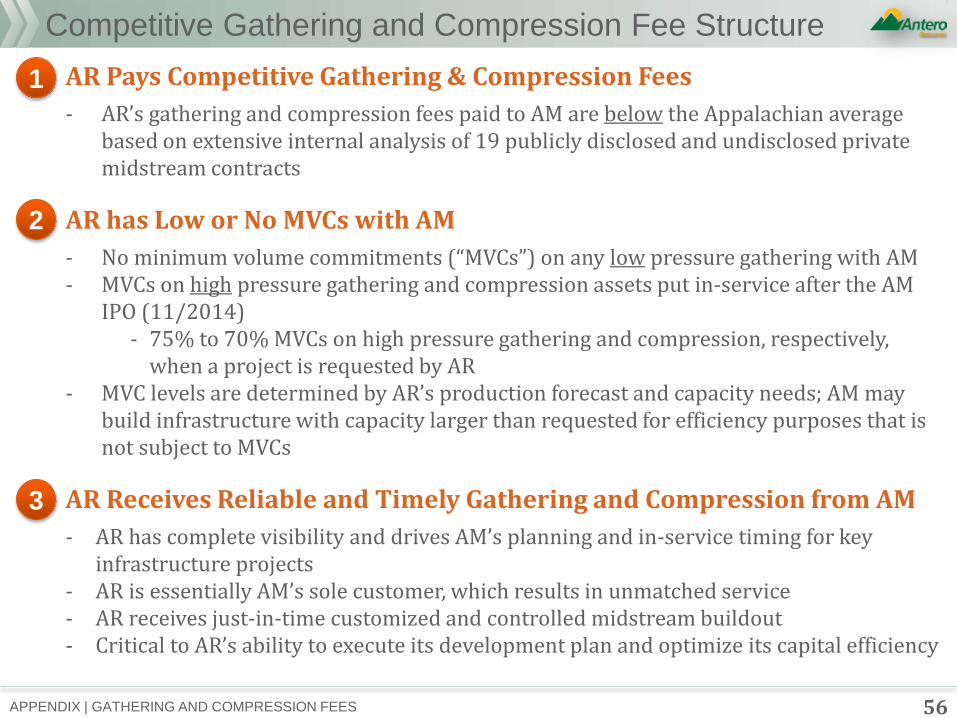
Competitive Gathering and Compression Fee Structure
AR Pays Competitive Gathering & Compression Fees
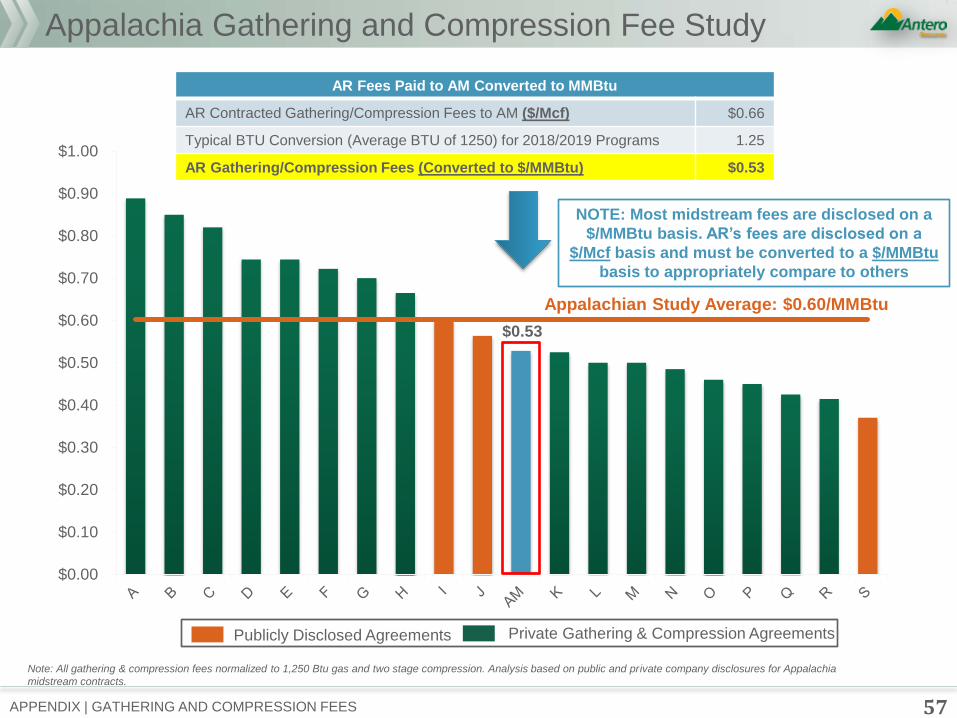
- AR’s gathering and compression fees paid to AM are below the Appalachian average based on extensive internal analysis of 19 publicly disclosed and undisclosed private midstream contracts
AR has Low or No MVCs with AM
- No minimum volume commitments (“MVCs”) on any low pressure gathering with AM - MVCs on high pressure gathering and compression assets put in-service after the AM
IPO (11/2014) - 75% to 70% MVCs on high pressure gathering and compression, respectively,
when a project is requested by AR - MVC levels are determined by AR’s production forecast and capacity needs; AM may
build infrastructure with capacity larger than requested for efficiency purposes that is not subject to MVCs
AR Receives Reliable and Timely Gathering and Compression from AM
- AR has complete visibility and drives AM’s planning and in-service timing for key infrastructure projects
- AR is essentially AM’s sole customer, which results in unmatched service - AR receives just-in-time customized and controlled midstream buildout - Critical to AR’s ability to execute its development plan and optimize its capital efficiency
APPENDIX | GATHERING AND COMPRESSION FEES
1
2
3
$0.53
$0.00
$0.10
$0.20
$0.30
$0.40
$0.50
$0.60
$0.70
$0.80
$0.90
$1.00
Appalachian Study Average: $0.60/MMBtu
57
Appalachia Gathering and Compression Fee Study
Note: All gathering & compression fees normalized to 1,250 Btu gas and two stage compression. Analysis based on public and private company disclosures for Appalachia
midstream contracts.
AR Fees Paid to AM Converted to MMBtu
AR Contracted Gathering/Compression Fees to AM ($/Mcf) $0.66
Typical BTU Conversion (Average BTU of 1250) for 2018/2019 Programs 1.25
AR Gathering/Compression Fees (Converted to $/MMBtu) $0.53
NOTE: Most midstream fees are disclosed on a
$/MMBtu basis. AR’s fees are disclosed on a
$/Mcf basis and must be converted to a $/MMBtu
basis to appropriately compare to others
APPENDIX | GATHERING AND COMPRESSION FEES
Private Gathering & Compression Agreements P Publicly Disclosed Agreements
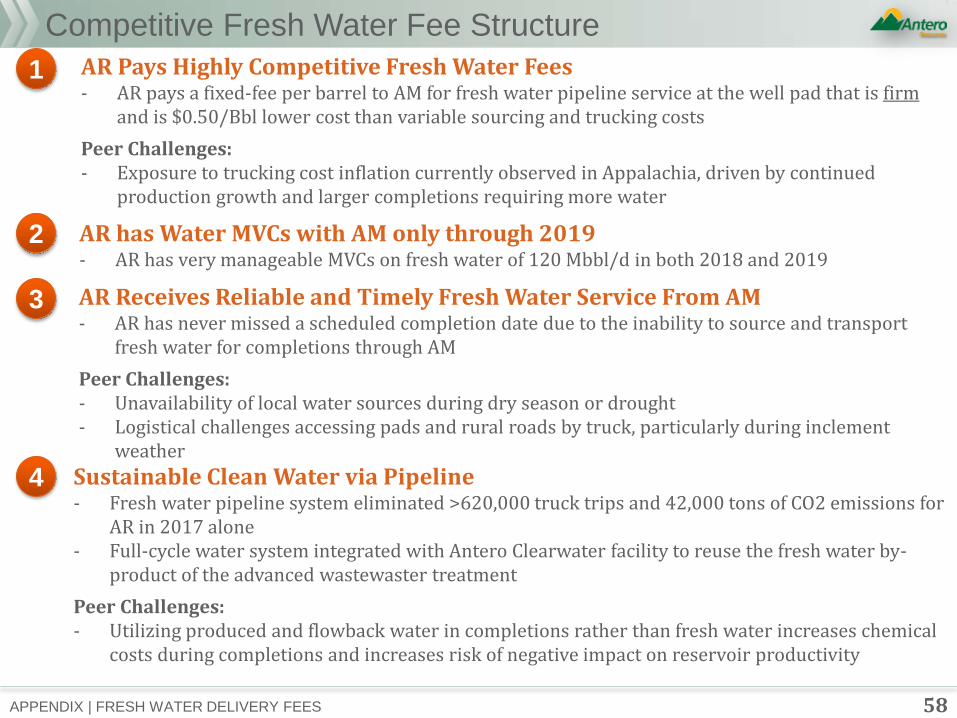
Competitive Fresh Water Fee Structure
58
AR Pays Highly Competitive Fresh Water Fees - AR pays a fixed-fee per barrel to AM for fresh water pipeline service at the well pad that is firm
and is $0.50/Bbl lower cost than variable sourcing and trucking costs
Peer Challenges: - Exposure to trucking cost inflation currently observed in Appalachia, driven by continued
production growth and larger completions requiring more water
AR Receives Reliable and Timely Fresh Water Service From AM - AR has never missed a scheduled completion date due to the inability to source and transport
fresh water for completions through AM
Peer Challenges: - Unavailability of local water sources during dry season or drought - Logistical challenges accessing pads and rural roads by truck, particularly during inclement
weather
Sustainable Clean Water via Pipeline - Fresh water pipeline system eliminated >620,000 truck trips and 42,000 tons of CO2 emissions for
AR in 2017 alone - Full-cycle water system integrated with Antero Clearwater facility to reuse the fresh water by-
product of the advanced wastewaster treatment
Peer Challenges: - Utilizing produced and flowback water in completions rather than fresh water increases chemical
costs during completions and increases risk of negative impact on reservoir productivity
AR has Water MVCs with AM only through 2019 - AR has very manageable MVCs on fresh water of 120 Mbbl/d in both 2018 and 2019
1
2
3
4
APPENDIX | FRESH WATER DELIVERY FEES
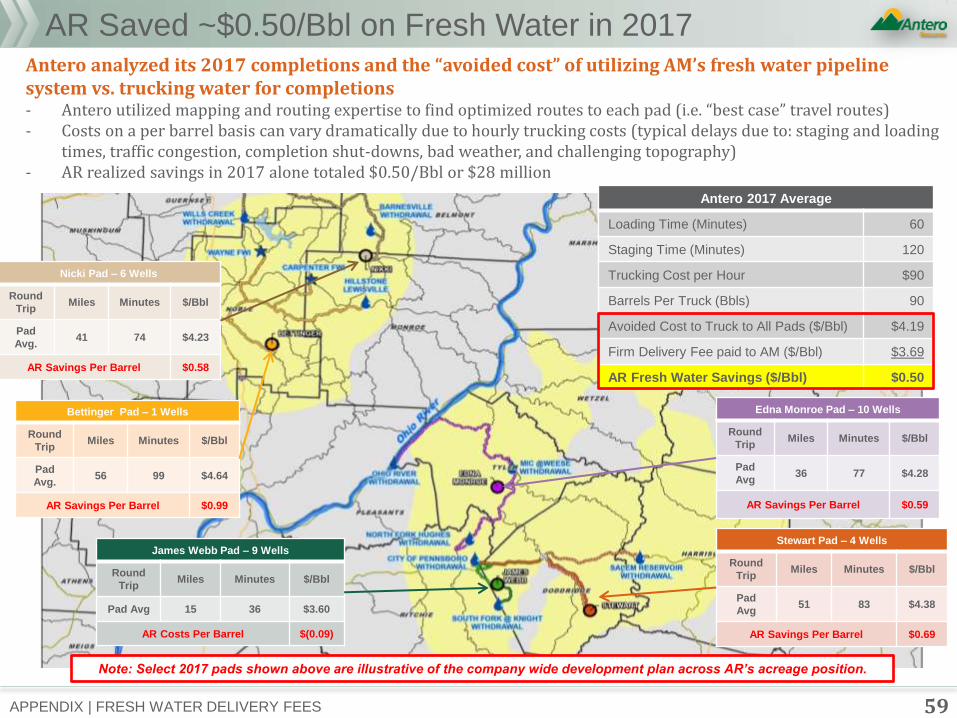
AR Saved ~$0.50/Bbl on Fresh Water in 2017
59
James Webb Pad – 9 Wells
Round
Trip Miles Minutes $/Bbl
Pad Avg 15 36 $3.60
AR Costs Per Barrel $(0.09)
Stewart Pad – 4 Wells
Round
Trip Miles Minutes $/Bbl
Pad
Avg 51 83 $4.38
AR Savings Per Barrel $0.69
Edna Monroe Pad – 10 Wells
Round
Trip Miles Minutes $/Bbl
Pad
Avg 36 77 $4.28
AR Savings Per Barrel $0.59
Bettinger Pad – 1 Wells
Round
Trip Miles Minutes $/Bbl
Pad
Avg. 56 99 $4.64
AR Savings Per Barrel $0.99
Antero 2017 Average
Loading Time (Minutes) 60
Staging Time (Minutes) 120
Trucking Cost per Hour $90
Barrels Per Truck (Bbls) 90
Avoided Cost to Truck to All Pads ($/Bbl) $4.19
Firm Delivery Fee paid to AM ($/Bbl) $3.69
AR Fresh Water Savings ($/Bbl) $0.50
Nicki Pad – 6 Wells
Round
Trip Miles Minutes $/Bbl
Pad
Avg. 41 74 $4.23
AR Savings Per Barrel $0.58
Antero analyzed its 2017 completions and the “avoided cost” of utilizing AM’s fresh water pipeline system vs. trucking water for completions - Antero utilized mapping and routing expertise to find optimized routes to each pad (i.e. “best case” travel routes) - Costs on a per barrel basis can vary dramatically due to hourly trucking costs (typical delays due to: staging and loading
times, traffic congestion, completion shut-downs, bad weather, and challenging topography) - AR realized savings in 2017 alone totaled $0.50/Bbl or $28 million
Note: Select 2017 pads shown above are illustrative of the company wide development plan across AR’s acreage position.
APPENDIX | FRESH WATER DELIVERY FEES
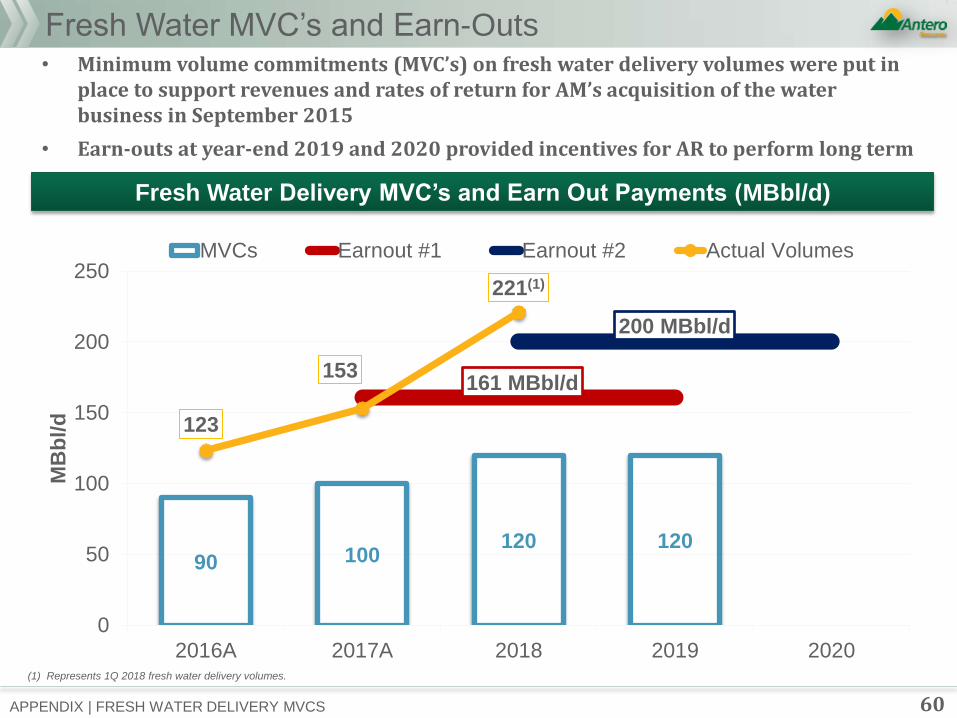
Fresh Water MVC’s and Earn-Outs
60
• Minimum volume commitments (MVC’s) on fresh water delivery volumes were put in place to support revenues and rates of return for AM’s acquisition of the water business in September 2015
• Earn-outs at year-end 2019 and 2020 provided incentives for AR to perform long term
Fresh Water Delivery MVC’s and Earn Out Payments (MBbl/d)
90 100 120 120
161 MBbl/d
200 MBbl/d
123
153
221(1)
0
50
100
150
200
250
2016A 2017A 2018 2019 2020
MB
bl/d
MVCs Earnout #1 Earnout #2 Actual Volumes
APPENDIX | FRESH WATER DELIVERY MVCS
(1) Represents 1Q 2018 fresh water delivery volumes.
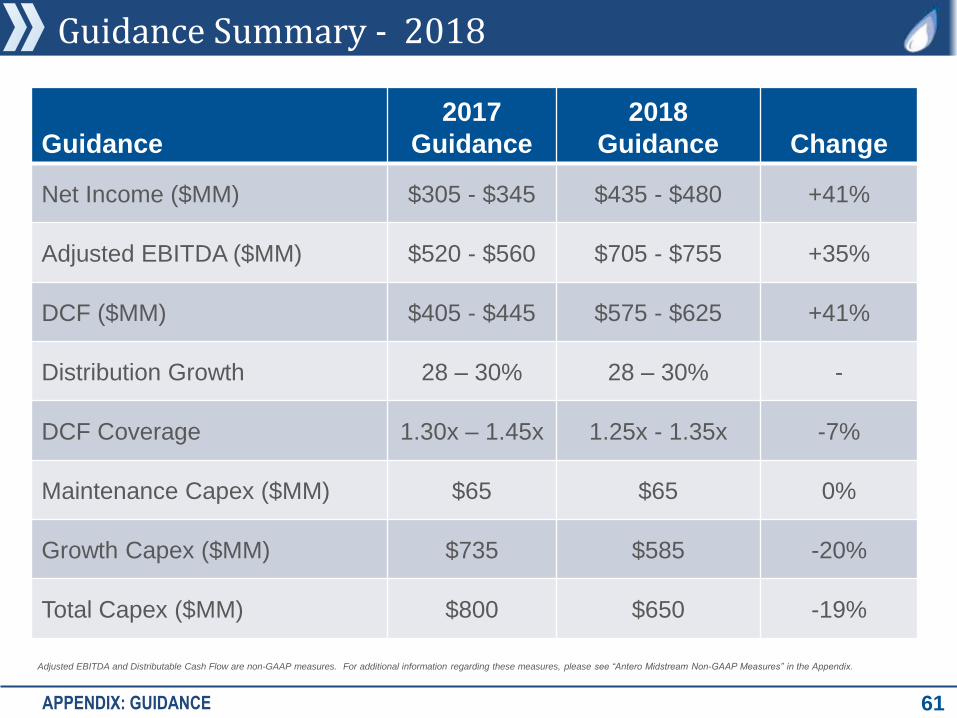
Guidance Summary - 2018
61
Guidance
2017
Guidance
2018
Guidance Change
Net Income ($MM) $305 - $345 $435 - $480 +41%
Adjusted EBITDA ($MM) $520 - $560 $705 - $755 +35%
DCF ($MM) $405 - $445 $575 - $625 +41%
Distribution Growth 28 – 30% 28 – 30% -
DCF Coverage 1.30x – 1.45x 1.25x - 1.35x -7%
Maintenance Capex ($MM) $65 $65 0%
Growth Capex ($MM) $735 $585 -20%
Total Capex ($MM) $800 $650 -19%
APPENDIX: GUIDANCE
Adjusted EBITDA and Distributable Cash Flow are non-GAAP measures. For additional information regarding these measures, please see “Antero Midstream Non-GAAP Measures” in the Appendix.
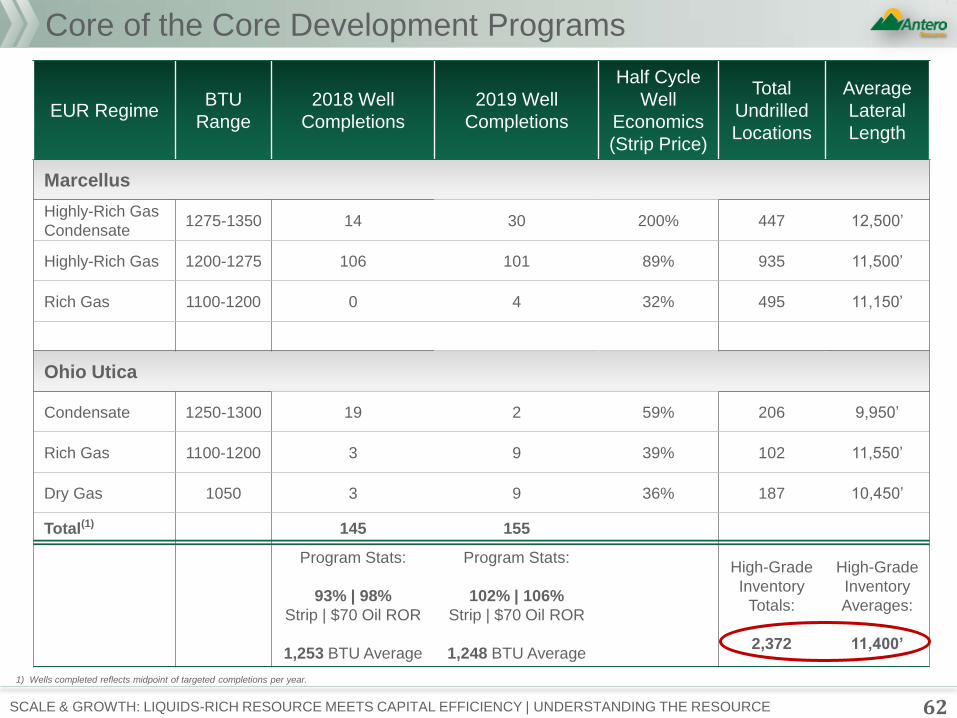
Core of the Core Development Programs
62 SCALE & GROWTH: LIQUIDS-RICH RESOURCE MEETS CAPITAL EFFICIENCY | UNDERSTANDING THE RESOURCE
EUR Regime BTU
Range
2018 Well
Completions
2019 Well
Completions
Half Cycle
Well
Economics
(Strip Price)
Total
Undrilled
Locations
Average
Lateral
Length
Marcellus
Highly-Rich Gas
Condensate 1275-1350 14 30 200% 447 12,500’
Highly-Rich Gas 1200-1275 106 101 89% 935 11,500’
Rich Gas 1100-1200 0 4 32% 495 11,150’
Ohio Utica
Condensate 1250-1300 19 2 59% 206 9,950’
Rich Gas 1100-1200 3 9 39% 102 11,550’
Dry Gas 1050 3 9 36% 187 10,450’
Total(1) 145 155
Program Stats:
93% | 98%
Strip | $70 Oil ROR
1,253 BTU Average
Program Stats:
102% | 106%
Strip | $70 Oil ROR
1,248 BTU Average
High-Grade
Inventory
Totals:
2,372
High-Grade
Inventory
Averages:
11,400’
1) Wells completed reflects midpoint of targeted completions per year.
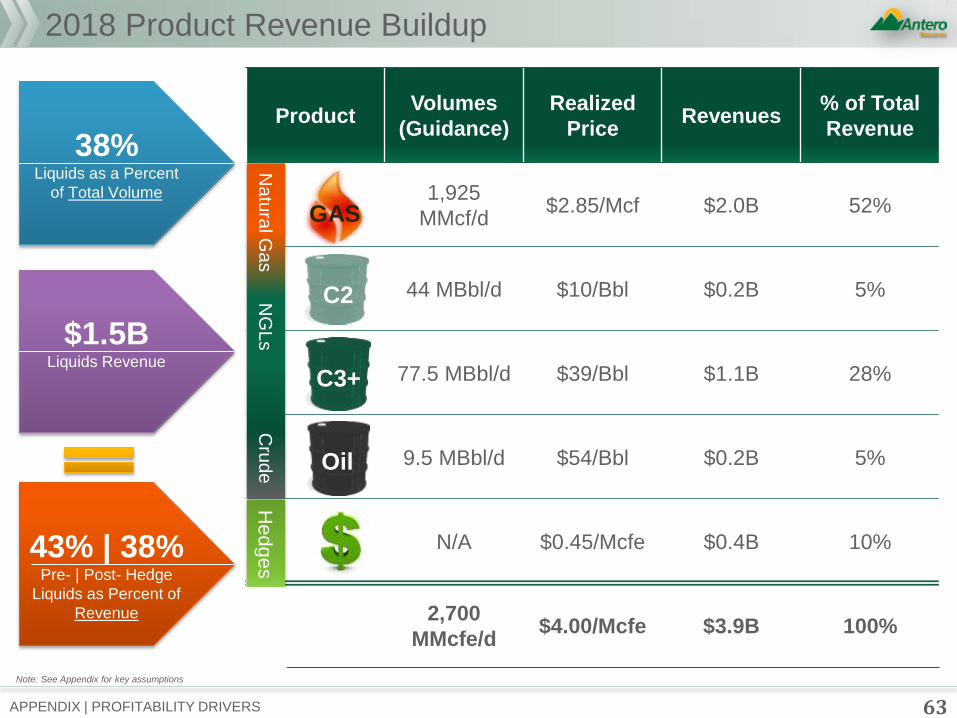
Product Volumes
(Guidance)
Realized
Price Revenues % of Total
Revenue
1,925
MMcf/d $2.85/Mcf $2.0B 52%
44 MBbl/d $10/Bbl $0.2B 5%
77.5 MBbl/d $39/Bbl $1.1B 28%
9.5 MBbl/d $54/Bbl $0.2B 5%
N/A $0.45/Mcfe $0.4B 10%
2,700
MMcfe/d $4.00/Mcfe $3.9B 100%
63 APPENDIX | PROFITABILITY DRIVERS
2018 Product Revenue Buildup
Na
tura
l Ga
s N
GL
s C
rud
e
GAS
C2
C3+
Oil
Hed
ge
s
$1.5B Liquids Revenue
38% Liquids as a Percent
of Total Volume
43% | 38% Pre- | Post- Hedge
Liquids as Percent of
Revenue
Note: See Appendix for key assumptions
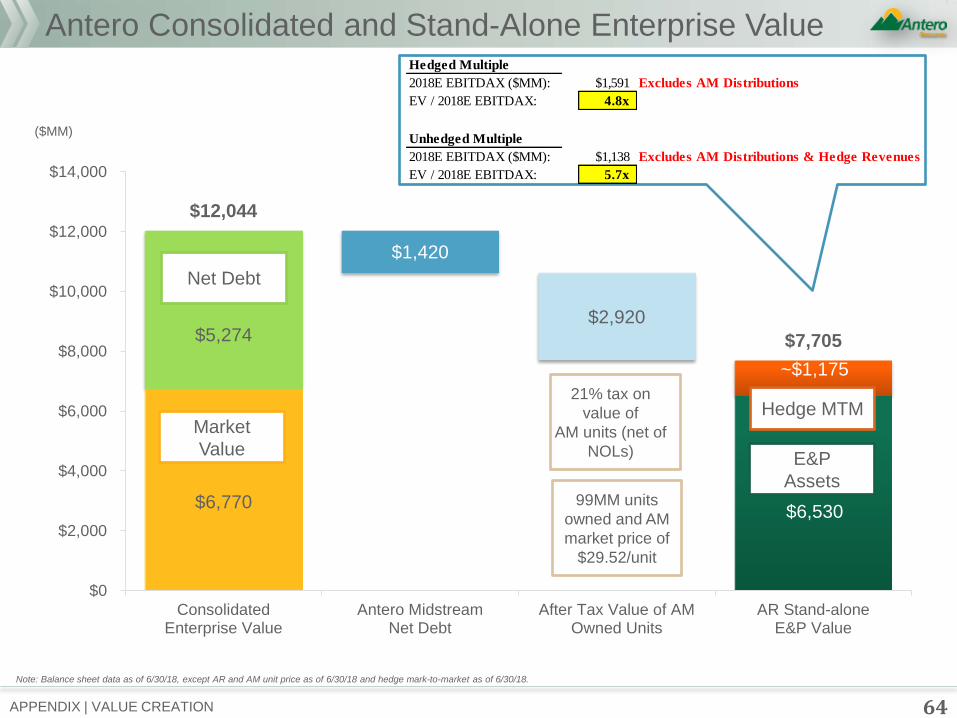
Hedged Multiple
2018E EBITDAX ($MM): $1,591 Excludes AM Distributions
EV / 2018E EBITDAX: 4.8x
Unhedged Multiple
2018E EBITDAX ($MM): $1,138 Excludes AM Distributions & Hedge Revenues
EV / 2018E EBITDAX: 5.7x
$6,770 $6,530
$5,274
$1,420
$2,920
~$1,175
$12,044
$7,705
$0
$2,000
$4,000
$6,000
$8,000
$10,000
$12,000
$14,000
ConsolidatedEnterprise Value
Antero MidstreamNet Debt
After Tax Value of AMOwned Units
AR Stand-aloneE&P Value
64 APPENDIX | VALUE CREATION
Antero Consolidated and Stand-Alone Enterprise Value
Note: Balance sheet data as of 6/30/18, except AR and AM unit price as of 6/30/18 and hedge mark-to-market as of 6/30/18.
99MM units
owned and AM
market price of
$29.52/unit
Market
Value
Net Debt
Hedge MTM
E&P
Assets
21% tax on
value of
AM units (net of
NOLs)
($MM)
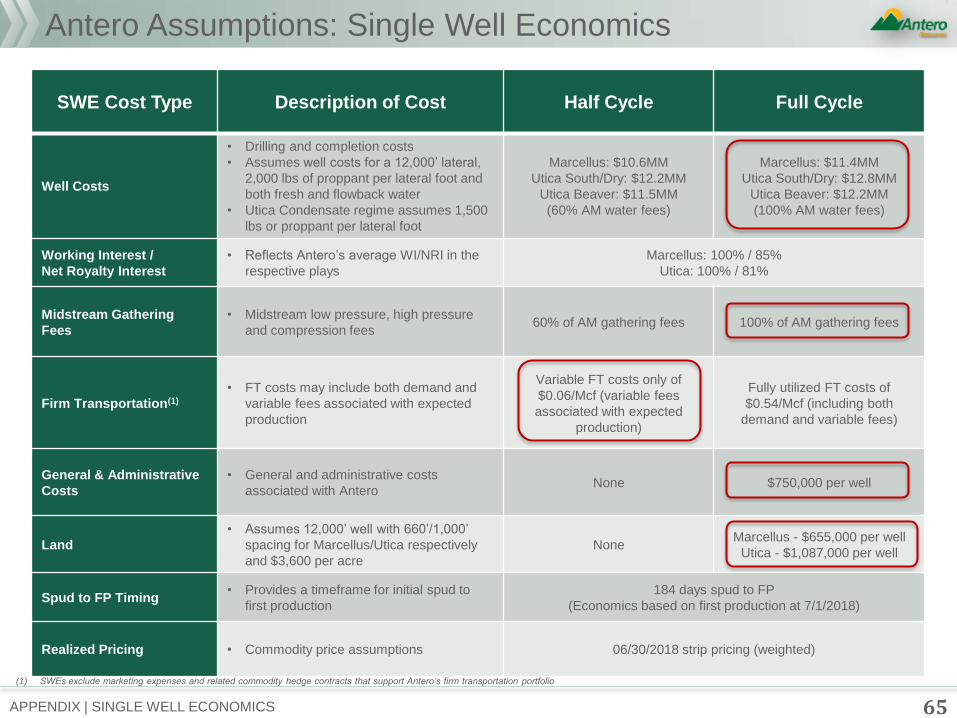
Antero Assumptions: Single Well Economics
65 APPENDIX | SINGLE WELL ECONOMICS
SWE Cost Type Description of Cost Half Cycle Full Cycle
Well Costs
• Drilling and completion costs
• Assumes well costs for a 12,000’ lateral,
2,000 lbs of proppant per lateral foot and
both fresh and flowback water
• Utica Condensate regime assumes 1,500
lbs or proppant per lateral foot
Marcellus: $10.6MM
Utica South/Dry: $12.2MM
Utica Beaver: $11.5MM
(60% AM water fees)
Marcellus: $11.4MM
Utica South/Dry: $12.8MM
Utica Beaver: $12.2MM
(100% AM water fees)
Working Interest /
Net Royalty Interest
• Reflects Antero’s average WI/NRI in the
respective plays
Marcellus: 100% / 85%
Utica: 100% / 81%
Midstream Gathering
Fees
• Midstream low pressure, high pressure
and compression fees 60% of AM gathering fees 100% of AM gathering fees
Firm Transportation(1)
• FT costs may include both demand and
variable fees associated with expected
production
Variable FT costs only of
$0.06/Mcf (variable fees
associated with expected
production)
Fully utilized FT costs of
$0.54/Mcf (including both
demand and variable fees)
General & Administrative
Costs
• General and administrative costs
associated with Antero None $750,000 per well
Land
• Assumes 12,000’ well with 660’/1,000’
spacing for Marcellus/Utica respectively
and $3,600 per acre
None Marcellus - $655,000 per well
Utica - $1,087,000 per well
Spud to FP Timing • Provides a timeframe for initial spud to
first production
184 days spud to FP
(Economics based on first production at 7/1/2018)
Realized Pricing • Commodity price assumptions 06/30/2018 strip pricing (weighted)
(1) SWEs exclude marketing expenses and related commodity hedge contracts that support Antero’s firm transportation portfolio
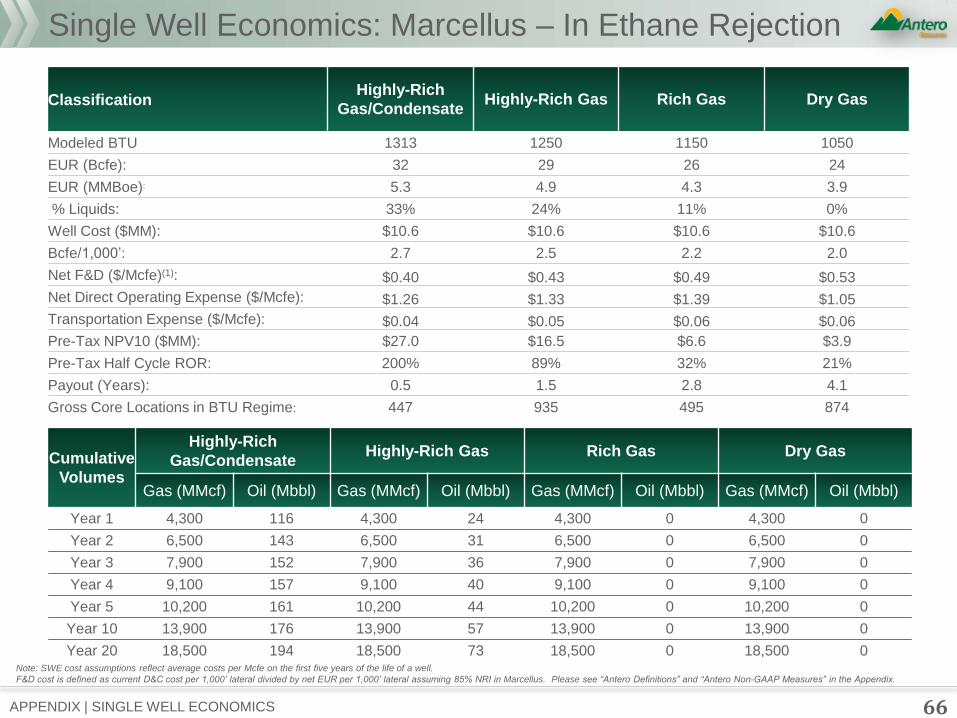
Single Well Economics: Marcellus – In Ethane Rejection
66 APPENDIX | SINGLE WELL ECONOMICS
Classification Highly-Rich
Gas/Condensate Highly-Rich Gas Rich Gas Dry Gas
Modeled BTU 1313 1250 1150 1050
EUR (Bcfe): 32 29 26 24
EUR (MMBoe): 5.3 4.9 4.3 3.9
% Liquids: 33% 24% 11% 0%
Well Cost ($MM): $10.6 $10.6 $10.6 $10.6
Bcfe/1,000’: 2.7 2.5 2.2 2.0
Net F&D ($/Mcfe)(1): $0.40 $0.43 $0.49 $0.53
Net Direct Operating Expense ($/Mcfe): $1.26 $1.33 $1.39 $1.05
Transportation Expense ($/Mcfe): $0.04 $0.05 $0.06 $0.06
Pre-Tax NPV10 ($MM): $27.0 $16.5 $6.6 $3.9
Pre-Tax Half Cycle ROR: 200% 89% 32% 21%
Payout (Years): 0.5 1.5 2.8 4.1
Gross Core Locations in BTU Regime: 447 935 495 874
Cumulative
Volumes
Highly-Rich
Gas/Condensate Highly-Rich Gas Rich Gas Dry Gas
Gas (MMcf) Oil (Mbbl) Gas (MMcf) Oil (Mbbl) Gas (MMcf) Oil (Mbbl) Gas (MMcf) Oil (Mbbl)
Year 1 4,300 116 4,300 24 4,300 0 4,300 0
Year 2 6,500 143 6,500 31 6,500 0 6,500 0
Year 3 7,900 152 7,900 36 7,900 0 7,900 0
Year 4 9,100 157 9,100 40 9,100 0 9,100 0
Year 5 10,200 161 10,200 44 10,200 0 10,200 0
Year 10 13,900 176 13,900 57 13,900 0 13,900 0
Year 20 18,500 194 18,500 73 18,500 0 18,500 0 Note: SWE cost assumptions reflect average costs per Mcfe on the first five years of the life of a well.
F&D cost is defined as current D&C cost per 1,000’ lateral divided by net EUR per 1,000’ lateral assuming 85% NRI in Marcellus. Please see “Antero Definitions” and “Antero Non-GAAP Measures” in the Appendix.
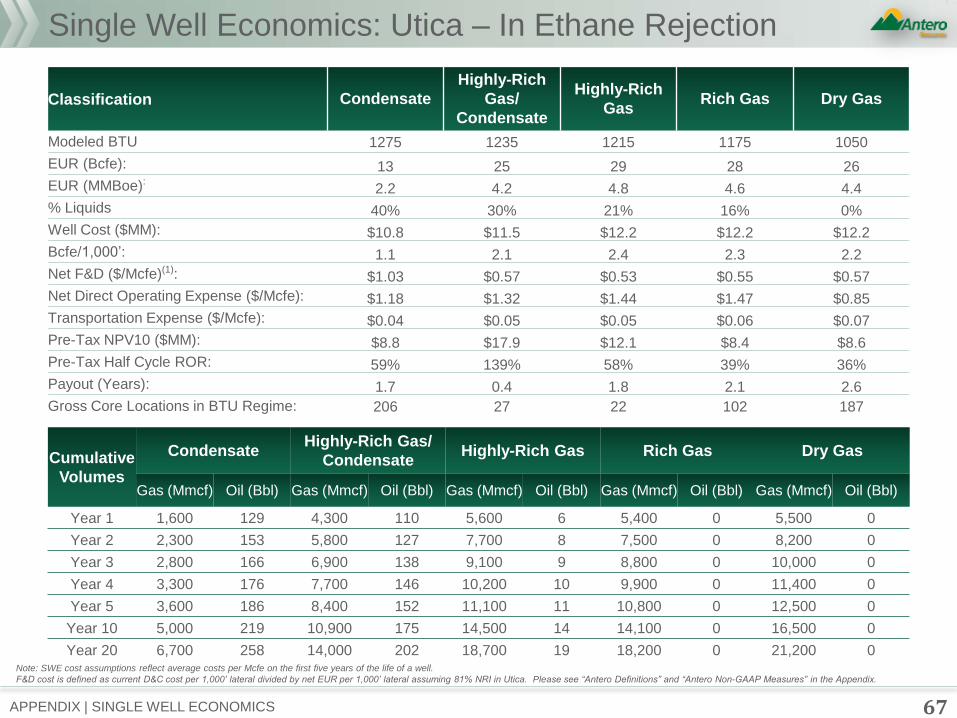
Single Well Economics: Utica – In Ethane Rejection
67 APPENDIX | SINGLE WELL ECONOMICS
Note: SWE cost assumptions reflect average costs per Mcfe on the first five years of the life of a well.
F&D cost is defined as current D&C cost per 1,000’ lateral divided by net EUR per 1,000’ lateral assuming 81% NRI in Utica. Please see “Antero Definitions” and “Antero Non-GAAP Measures” in the Appendix.
Classification Condensate
Highly-Rich
Gas/
Condensate
Highly-Rich
Gas Rich Gas Dry Gas
Modeled BTU 1275 1235 1215 1175 1050
EUR (Bcfe): 13 25 29 28 26
EUR (MMBoe): 2.2 4.2 4.8 4.6 4.4
% Liquids 40% 30% 21% 16% 0%
Well Cost ($MM): $10.8 $11.5 $12.2 $12.2 $12.2
Bcfe/1,000’: 1.1 2.1 2.4 2.3 2.2
Net F&D ($/Mcfe)(1): $1.03 $0.57 $0.53 $0.55 $0.57
Net Direct Operating Expense ($/Mcfe): $1.18 $1.32 $1.44 $1.47 $0.85
Transportation Expense ($/Mcfe): $0.04 $0.05 $0.05 $0.06 $0.07
Pre-Tax NPV10 ($MM): $8.8 $17.9 $12.1 $8.4 $8.6
Pre-Tax Half Cycle ROR: 59% 139% 58% 39% 36%
Payout (Years): 1.7 0.4 1.8 2.1 2.6
Gross Core Locations in BTU Regime: 206 27 22 102 187
Cumulative
Volumes
Condensate Highly-Rich Gas/
Condensate Highly-Rich Gas Rich Gas Dry Gas
Gas (Mmcf) Oil (Bbl) Gas (Mmcf) Oil (Bbl) Gas (Mmcf) Oil (Bbl) Gas (Mmcf) Oil (Bbl) Gas (Mmcf) Oil (Bbl)
Year 1 1,600 129 4,300 110 5,600 6 5,400 0 5,500 0
Year 2 2,300 153 5,800 127 7,700 8 7,500 0 8,200 0
Year 3 2,800 166 6,900 138 9,100 9 8,800 0 10,000 0
Year 4 3,300 176 7,700 146 10,200 10 9,900 0 11,400 0
Year 5 3,600 186 8,400 152 11,100 11 10,800 0 12,500 0
Year 10 5,000 219 10,900 175 14,500 14 14,100 0 16,500 0
Year 20 6,700 258 14,000 202 18,700 19 18,200 0 21,200 0
68 APPENDIX | DISCLOSURES & RECONCILIATIONS
Antero Non-GAAP Measures Consolidated Adjusted EBITDAX, Stand-alone E&P Adjusted EBITDAX, Consolidated Adjusted Operating Cash Flow, Stand-alone E&P
Adjusted Operating Cash Flow and Free Cash Flow are financial measures that are not calculated in accordance with U.S. generally
accepted accounting principles (―GAAP‖). The non-GAAP financial measures used by the company may not be comparable to similarly
titled measures utilized by other companies. These measures should not be considered in isolation or as substitutes for their nearest
GAAP measures. The Stand-alone measures are presented to isolate the results of the operations of Antero apart from the performance
of Antero Midstream, which is otherwise consolidated into the results of Antero.
Consolidated Adjusted EBITDAX and Stand-alone E&P Adjusted EBITDAX
The GAAP financial measure nearest to Consolidated Adjusted EBITDAX is net income or loss including noncontrolling interest that will
be reported in Antero’s consolidated financial statements. The GAAP financial measure nearest to Stand-alone E&P Adjusted
EBITDAX is Stand-alone net income or loss that will be reported in the Parent column of Antero’s guarantor footnote to its financial
statements. While there are limitations associated with the use of Consolidated Adjusted EBITDAX and Stand-alone E&P Adjusted
EBITDAX described below, management believes that these measures are useful to an investor in evaluating the company’s financial
performance because these measures:
• are widely used by investors in the oil and gas industry to measure a company’s operating performance without regard to
items excluded from the calculation of such term, which can vary substantially from company to company depending upon
accounting methods and book value of assets, capital structure and the method by which assets were acquired, among
other factors;
• helps investors to more meaningfully evaluate and compare the results of Antero’s operations (both on a consolidated and
Stand-alone basis) from period to period by removing the effect of its capital structure from its operating structure; and
• is used by management for various purposes, including as a measure of Antero’s operating performance (both on a
consolidated and Stand-alone basis), in presentations to the company’s board of directors, and as a basis for strategic
planning and forecasting. Consolidated Adjusted EBITDAX is also used by the board of directors as a performance measure
in determining executive compensation. Consolidated Adjusted EBITDAX, as defined by our credit facility, is used by our
lenders pursuant to covenants under our revolving credit facility and the indentures governing the company’s senior notes.
There are significant limitations to using Consolidated Adjusted EBITDAX and Stand-alone E&P Adjusted EBITDAX as measures of
performance, including the inability to analyze the effect of certain recurring and non-recurring items that materially affect the company’s
net income on a consolidated and Stand-alone basis, the lack of comparability of results of operations of different companies and the
different methods of calculating Adjusted EBITDAX reported by different companies. In addition, Consolidated Adjusted EBITDAX and
Stand-alone E&P Adjusted EBITDAX provide no information regarding a company’s capital structure, borrowings, interest costs, capital
expenditures, and working capital movement or tax position.
69 APPENDIX | DISCLOSURES & RECONCILIATIONS
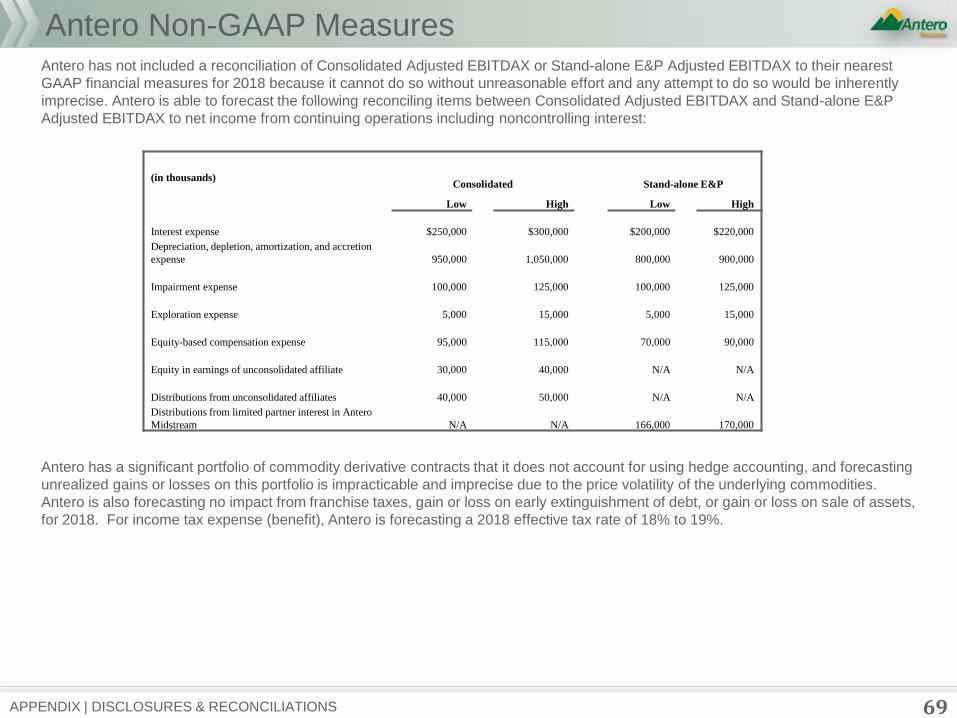
Antero Non-GAAP Measures Antero has not included a reconciliation of Consolidated Adjusted EBITDAX or Stand-alone E&P Adjusted EBITDAX to their nearest
GAAP financial measures for 2018 because it cannot do so without unreasonable effort and any attempt to do so would be inherently
imprecise. Antero is able to forecast the following reconciling items between Consolidated Adjusted EBITDAX and Stand-alone E&P
Adjusted EBITDAX to net income from continuing operations including noncontrolling interest:
Antero has a significant portfolio of commodity derivative contracts that it does not account for using hedge accounting, and forecasting
unrealized gains or losses on this portfolio is impracticable and imprecise due to the price volatility of the underlying commodities.
Antero is also forecasting no impact from franchise taxes, gain or loss on early extinguishment of debt, or gain or loss on sale of assets,
for 2018. For income tax expense (benefit), Antero is forecasting a 2018 effective tax rate of 18% to 19%.
(in thousands)
Consolidated Stand-alone E&P
Low High Low High
Interest expense $250,000 $300,000 $200,000 $220,000
Depreciation, depletion, amortization, and accretion
expense 950,000 1,050,000 800,000 900,000
Impairment expense 100,000 125,000 100,000 125,000
Exploration expense 5,000 15,000 5,000 15,000
Equity-based compensation expense 95,000 115,000 70,000 90,000
Equity in earnings of unconsolidated affiliate 30,000 40,000 N/A N/A
Distributions from unconsolidated affiliates 40,000 50,000 N/A N/A
Distributions from limited partner interest in Antero
Midstream N/A N/A 166,000 170,000
70 APPENDIX | DISCLOSURES & RECONCILIATIONS
Antero Non-GAAP Measures Consolidated Adjusted Operating Cash Flow, Stand-alone E&P Adjusted Operating Cash Flow and Free Cash Flow
The GAAP financial measure nearest to Consolidated Adjusted Operating Cash Flow is cash flow from operating activities as reported in
Antero’s consolidated financial statements. The GAAP financial measure nearest to Stand-alone E&P Adjusted Operating Cash Flow
and Free Cash Flow is Stand-alone cash flow from operating activities that will be reported in the Parent column of Antero’s guarantor
footnote to its financial statements. Management believes that Consolidated Adjusted Operating Cash Flow and Stand-alone E&P
Adjusted Operating Cash Flow are useful indicators of the company’s ability to internally fund its activities and to service or incur
additional debt on a consolidated and Stand-alone basis. Management believes that changes in current assets and liabilities, which are
excluded from the calculation of these measures, relate to the timing of cash receipts and disbursements and therefore may not relate to
the period in which the operating activities occurred and generally do not have a material impact on the ability of the company to fund its
operations. Management believes that Free Cash Flow is a useful measure for assessing the company’s financial performance and
measuring its ability to generate excess cash from its operations.
There are significant limitations to using Consolidated Adjusted Operating Cash Flow, Stand-alone E&P Adjusted Operating Cash Flow
and Free Cash Flow as measures of performance, including the inability to analyze the effect of certain recurring and non-recurring
items that materially affect the company’s net income on a consolidated and Stand-alone E&P basis, the lack of comparability of results
of operations of different companies and the different methods of calculating Consolidated Adjusted Operating Cash Flow and Stand-
alone E&P Adjusted Operating Cash Flow reported by different companies. Consolidated Adjusted Operating Cash Flow and Stand-
alone E&P Adjusted Operating Cash Flow do not represent funds available for discretionary use because those funds may be required
for debt service, capital expenditures, working capital, income taxes, franchise taxes, exploration expenses, and other commitments and
obligations.
Antero has not included reconciliations of Consolidated Adjusted Operating Cash Flow, Stand-alone E&P Adjusted Operating Cash
Flow and Free Cash Flow to their nearest GAAP financial measures for 2018 because it would be impractical to forecast changes in
current assets and liabilities. However, Antero is able to forecast the earn out payments expected from Antero Midstream associated
with the water drop down transaction that occurred in 2015, each of which is a reconciling item between Stand-alone E&P Adjusted
Operating Cash Flow and Free Cash Flow, as applicable, and cash flow from operating activities as reported in the Parent column of
Antero’s guarantor footnote to its financial statements. Antero forecasts these items to be $125 million in each of 2019 and 2020.
Additionally, Antero is able to forecast lease maintenance expenditures and Stand-alone drilling and completion capital, each of which is
a reconciling item between Free Cash Flow and its most comparable GAAP financial measure. For the 2018 to 2022 period, Antero
forecasts cumulative lease maintenance expenditures of $200 million and cumulative Stand-alone E&P drilling and completion capital of
$8.6 billion.
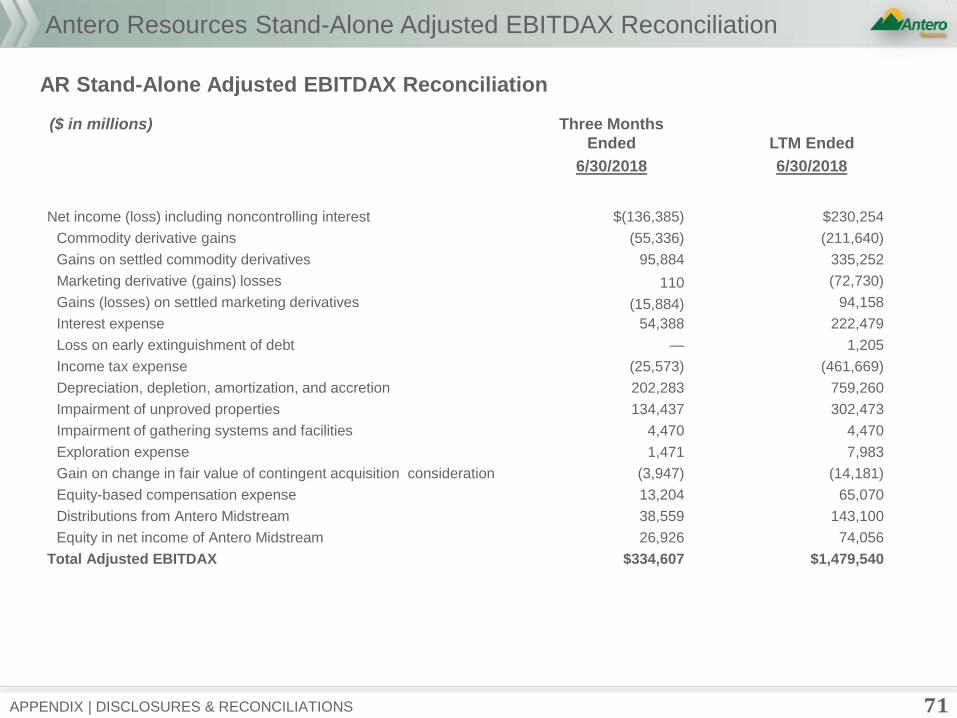
Antero Resources Stand-Alone Adjusted EBITDAX Reconciliation
APPENDIX | DISCLOSURES & RECONCILIATIONS
AR Stand-Alone Adjusted EBITDAX Reconciliation
($ in millions) Three Months
Ended
LTM Ended
6/30/2018 6/30/2018
Net income (loss) including noncontrolling interest $(136,385) $230,254
Commodity derivative gains (55,336) (211,640)
Gains on settled commodity derivatives 95,884 335,252
Marketing derivative (gains) losses 110 (72,730)
Gains (losses) on settled marketing derivatives (15,884) 94,158
Interest expense 54,388 222,479
Loss on early extinguishment of debt — 1,205
Income tax expense (25,573) (461,669)
Depreciation, depletion, amortization, and accretion 202,283 759,260
Impairment of unproved properties 134,437 302,473
Impairment of gathering systems and facilities 4,470 4,470
Exploration expense 1,471 7,983
Gain on change in fair value of contingent acquisition consideration (3,947) (14,181)
Equity-based compensation expense 13,204 65,070
Distributions from Antero Midstream 38,559 143,100
Equity in net income of Antero Midstream 26,926 74,056
Total Adjusted EBITDAX $334,607 $1,479,540
71
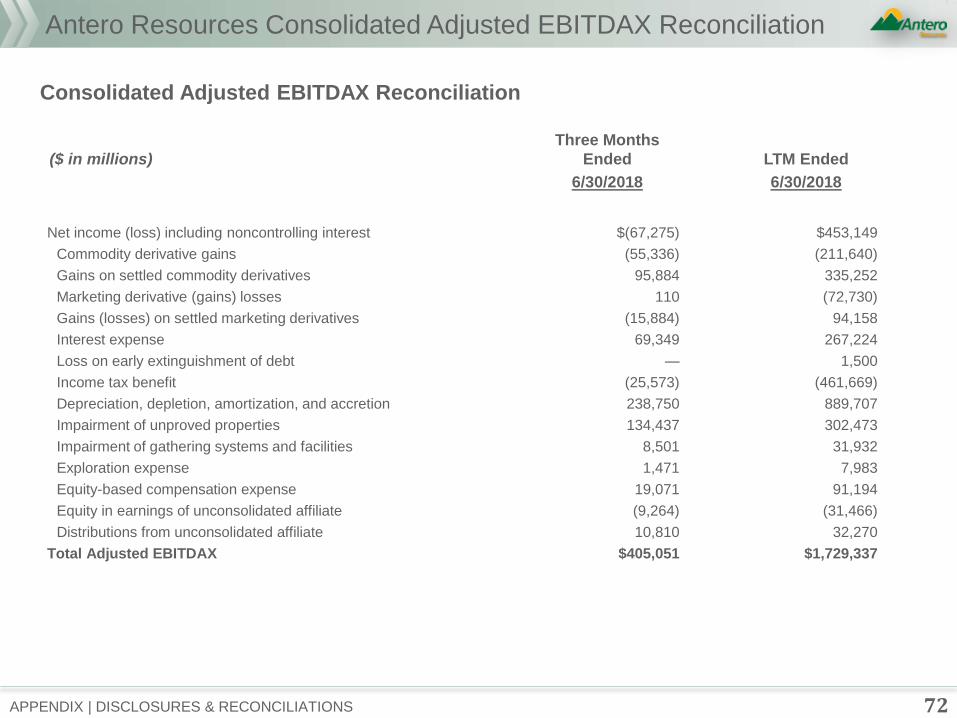
Antero Resources Consolidated Adjusted EBITDAX Reconciliation
Consolidated Adjusted EBITDAX Reconciliation
($ in millions)
Three Months
Ended
LTM Ended
6/30/2018 6/30/2018
Net income (loss) including noncontrolling interest $(67,275) $453,149
Commodity derivative gains (55,336) (211,640)
Gains on settled commodity derivatives 95,884 335,252
Marketing derivative (gains) losses 110 (72,730)
Gains (losses) on settled marketing derivatives (15,884) 94,158
Interest expense 69,349 267,224
Loss on early extinguishment of debt — 1,500
Income tax benefit (25,573) (461,669)
Depreciation, depletion, amortization, and accretion 238,750 889,707
Impairment of unproved properties 134,437 302,473
Impairment of gathering systems and facilities 8,501 31,932
Exploration expense 1,471 7,983
Equity-based compensation expense 19,071 91,194
Equity in earnings of unconsolidated affiliate (9,264) (31,466)
Distributions from unconsolidated affiliate 10,810 32,270
Total Adjusted EBITDAX $405,051 $1,729,337
APPENDIX | DISCLOSURES & RECONCILIATIONS 72
Antero Midstream Non-GAAP Measures
APPENDIX 73
Non-GAAP Financial Measures and Definitions
Antero Midstream views Adjusted EBITDA as an important indicator of the Partnership’s performance. Antero Midstream defines
Adjusted EBITDA as Net Income before interest expense, depreciation expense, impairment expense, accretion of contingent
acquisition consideration, equity-based compensation expense, excluding equity in earnings of unconsolidated affiliates and including
cash distributions from unconsolidated affiliates.
Antero Midstream uses Adjusted EBITDA to assess:
• the financial performance of the Partnership’s assets, without regard to financing methods in the case of Adjusted EBITDA, capital
structure or historical cost basis;
• its operating performance and return on capital as compared to other publicly traded partnerships in the midstream energy sector,
without regard to financing or capital structure; and
• the viability of acquisitions and other capital expenditure projects.
The Partnership defines Distributable Cash Flow as Adjusted EBITDA less interest paid, income tax withholding payments and cash
reserved for payments of income tax withholding upon vesting of equity-based compensation awards, cash reserved for bond interest
and ongoing maintenance capital expenditures paid. Antero Midstream uses Distributable Cash Flow as a performance metric to
compare the cash generating performance of the Partnership from period to period and to compare the cash generating performance for
specific periods to the cash distributions (if any) that are expected to be paid to unitholders. Distributable Cash Flow does not reflect
changes in working capital balances.
The Partnership defines Free Cash Flow as cash flow from operating activities before changes in working capital less capital
expenditures. Management believes that Free Cash Flow is a useful indicator of the Partnership’s ability to internally fund infrastructure
investments, service or incur additional debt, and assess the company’s financial performance and its ability to generate excess cash
from its operations. Management believes that changes in operating assets and liabilities relate to the timing of cash receipts and
disbursements and therefore may not relate to the period in which the operating activities occurred.
The Partnership defines Return on Invested Capital as net income plus interest expense divided by average total liabilities and partners’
capital, excluding current liabilities. Management believes that Return on Invested Capital is a useful indicator of the Partnership’s
return on its infrastructure investments.
The Partnership defines Adjusted Operating Cash Flow as net cash provided by operating activities before changes in current assets
and liabilities. See ―Non-GAAP Measures‖ for additional detail.
Antero Midstream Non-GAAP Measures
APPENDIX 74
The GAAP financial measure nearest to Adjusted Operating Cash Flow is cash flow from operating activities as reported in
Antero Midstream’s consolidated financial statements. Management believes that Adjusted Operating Cash Flow is a useful
indicator of the company’s ability to internally fund its activities and to service or incur additional debt. Management believes
that changes in current assets and liabilities, which are excluded from the calculation of these measures, relate to the timing of
cash receipts and disbursements and therefore may not relate to the period in which the operating activities occurred and
generally do not have a material impact on the ability of the company to fund its operations. Management believes that Free
Cash Flow is a useful measure for assessing the company’s financial performance and measuring its ability to generate
excess cash from its operations.
There are significant limitations to using Adjusted Operating Cash Flow and Free Cash Flow as measures of performance,
including the inability to analyze the effect of certain recurring and non-recurring items that materially affect the company’s net
income, the lack of comparability of results of operations of different companies and the different methods of calculating
Adjusted Operating Cash Flow reported by different companies. Adjusted Operating Cash Flow does not represent funds
available for discretionary use because those funds may be required for debt service, capital expenditures, working capital,
income taxes, and other commitments and obligations.
Antero Midstream has not included reconciliations of Adjusted Operating Cash Flow and Free Cash Flow to their nearest
GAAP financial measures for 2018 because it would be impractical to forecast changes in current assets and liabilities. Antero
Midstream is able to forecast capital expenditures, which is a reconciling item between Free Cash Flow and its most
comparable GAAP financial measure. For the 2018 to 2022 period, Antero forecasts cumulative capital expenditures of $2.7
billion.
Antero Resources non-GAAP measures and definitions are included in the Antero Resources analyst day presentation, which
can be found on www.anteroresources.com.
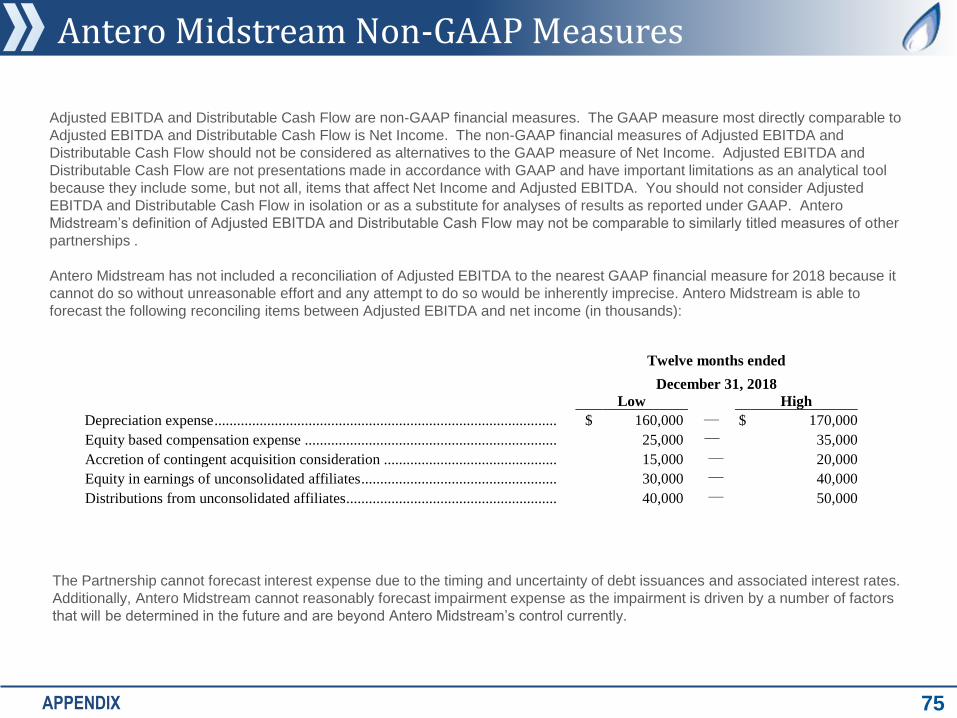
Antero Midstream Non-GAAP Measures
APPENDIX 75
Adjusted EBITDA and Distributable Cash Flow are non-GAAP financial measures. The GAAP measure most directly comparable to
Adjusted EBITDA and Distributable Cash Flow is Net Income. The non-GAAP financial measures of Adjusted EBITDA and
Distributable Cash Flow should not be considered as alternatives to the GAAP measure of Net Income. Adjusted EBITDA and
Distributable Cash Flow are not presentations made in accordance with GAAP and have important limitations as an analytical tool
because they include some, but not all, items that affect Net Income and Adjusted EBITDA. You should not consider Adjusted
EBITDA and Distributable Cash Flow in isolation or as a substitute for analyses of results as reported under GAAP. Antero
Midstream’s definition of Adjusted EBITDA and Distributable Cash Flow may not be comparable to similarly titled measures of other
partnerships .
Antero Midstream has not included a reconciliation of Adjusted EBITDA to the nearest GAAP financial measure for 2018 because it
cannot do so without unreasonable effort and any attempt to do so would be inherently imprecise. Antero Midstream is able to
forecast the following reconciling items between Adjusted EBITDA and net income (in thousands):
The Partnership cannot forecast interest expense due to the timing and uncertainty of debt issuances and associated interest rates.
Additionally, Antero Midstream cannot reasonably forecast impairment expense as the impairment is driven by a number of factors
that will be determined in the future and are beyond Antero Midstream’s control currently.
Twelve months ended
December 31, 2018
Low High
Depreciation expense ........................................................................................... $ 160,000 — $ 170,000
Equity based compensation expense ................................................................... 25,000 — 35,000
Accretion of contingent acquisition consideration .............................................. 15,000 — 20,000
Equity in earnings of unconsolidated affiliates .................................................... 30,000 — 40,000
Distributions from unconsolidated affiliates........................................................ 40,000 — 50,000
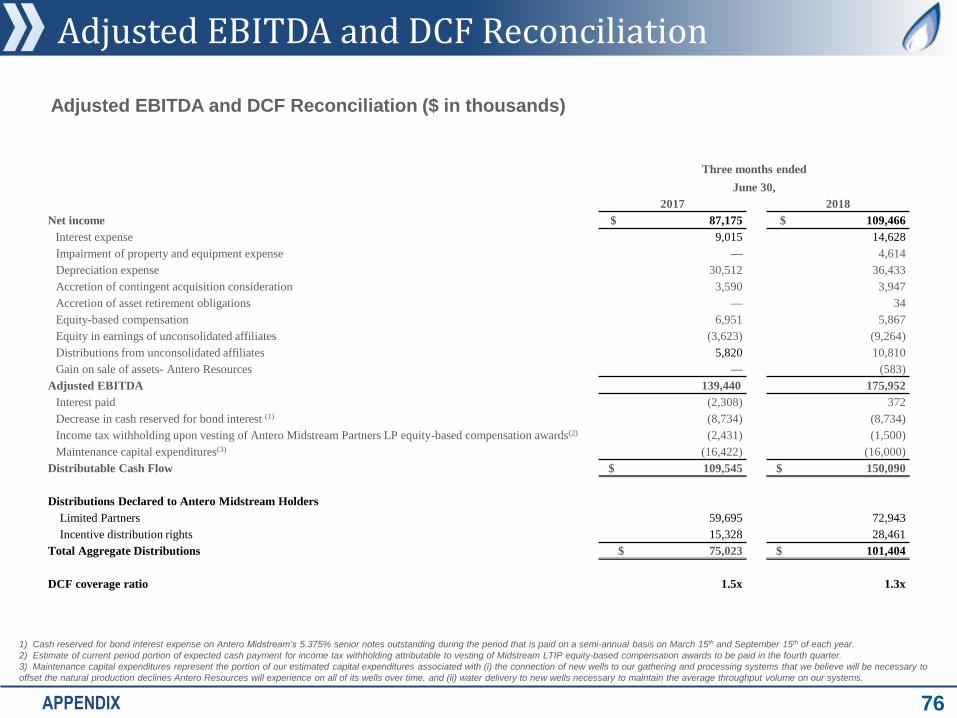
Adjusted EBITDA and DCF Reconciliation
APPENDIX 76
Adjusted EBITDA and DCF Reconciliation ($ in thousands)
Three months ended
June 30,
2017 2018
Net income $ 87,175 $ 109,466
Interest expense 9,015 14,628
Impairment of property and equipment expense — 4,614
Depreciation expense 30,512 36,433
Accretion of contingent acquisition consideration 3,590 3,947
Accretion of asset retirement obligations — 34
Equity-based compensation 6,951 5,867
Equity in earnings of unconsolidated affiliates (3,623) (9,264)
Distributions from unconsolidated affiliates 5,820 10,810
Gain on sale of assets- Antero Resources — (583)
Adjusted EBITDA 139,440 175,952
Interest paid (2,308) 372
Decrease in cash reserved for bond interest (1) (8,734) (8,734)
Income tax withholding upon vesting of Antero Midstream Partners LP equity-based compensation awards(2) (2,431) (1,500)
Maintenance capital expenditures(3) (16,422) (16,000)
Distributable Cash Flow $ 109,545 $ 150,090
Distributions Declared to Antero Midstream Holders
Limited Partners 59,695 72,943
Incentive distribution rights 15,328 28,461
Total Aggregate Distributions $ 75,023 $ 101,404
DCF coverage ratio 1.5x 1.3x
1) Cash reserved for bond interest expense on Antero Midstream’s 5.375% senior notes outstanding during the period that is paid on a semi-annual basis on March 15th and September 15th of each year.
2) Estimate of current period portion of expected cash payment for income tax withholding attributable to vesting of Midstream LTIP equity-based compensation awards to be paid in the fourth quarter.
3) Maintenance capital expenditures represent the portion of our estimated capital expenditures associated with (i) the connection of new wells to our gathering and processing systems that we believe will be necessary to
offset the natural production declines Antero Resources will experience on all of its wells over time, and (ii) water delivery to new wells necessary to maintain the average throughput volume on our systems.
Cautionary Note
Regarding Hydrocarbon Quantities
The SEC permits oil and gas companies, in their filings with the SEC, to disclose only proved, probable and possible reserve estimates (collectively, ―3P‖). Antero has provided internally generated estimates for proved, probable and possible reserves in this presentation in accordance with SEC guidelines and definitions. The estimates of proved, probable and possible reserves as of December 31, 2017 included in this presentation have been audited by Antero’s third-party engineers. Unless otherwise noted, reserve estimates as of December 31, 2017 assume ethane rejection and strip pricing.
Actual quantities that may be ultimately recovered from Antero’s interests may differ substantially from the estimates in this presentation. Factors affecting ultimate recovery include the scope of Antero’s ongoing drilling program, which will be directly affected by commodity prices, the availability of capital, drilling and production costs, availability of drilling services and equipment, drilling results, lease expirations, transportation constraints, regulatory approvals and other factors; and actual drilling results, including geological and mechanical factors affecting recovery rates.
In this presentation:
• ―3P reserves‖ refer to Antero’s estimated aggregate proved, probable and possible reserves as of December 31, 2016. The SEC prohibits companies from aggregating proved, probable and possible reserves in filings with the SEC due to the different levels of certainty associated with each reserve category.
• ―EUR,‖ or ―Estimated Ultimate Recovery,‖ refers to Antero’s internal estimates of per well hydrocarbon quantities that may be potentially recovered from a hypothetical future well completed as a producer in the area. These quantities do not necessarily constitute or represent reserves within the meaning of the Society of Petroleum Engineer’s Petroleum Resource Management System or the SEC’s oil and natural gas disclosure rules.
• ―Condensate‖ refers to gas having a heat content between 1250 BTU and 1300 BTU in the Utica Shale.
• ―Highly-Rich Gas/Condensate‖ refers to gas having a heat content between 1275 BTU and 1350 BTU in the Marcellus Shale and 1225 BTU and 1250 BTU in the Utica Shale.
• ―Highly-Rich Gas‖ refers to gas having a heat content between 1200 BTU and 1275 BTU in the Marcellus Shale and 1200 BTU and 1225 BTU in the Utica Shale.
• ―Rich Gas‖ refers to gas having a heat content of between 1100 BTU and 1200 BTU.
• ―Dry Gas‖ refers to gas containing insufficient quantities of hydrocarbons heavier than methane to allow their commercial extraction or to require their removal in order to render the gas suitable for fuel use.
77 APPENDIX | DISCLOSURES & RECONCILIATIONS


