† Vrije Universiteit Brussel, Pleinlaan 2, B-1050 Brussel, Belgium, Phone: ++32 (0)2 629 21 17, E-mail: [email protected]†† Vrije Universiteit Brussel, Pleinlaan 2, B-1050 Brussel, Belgium, Phone: ++32 (0)2 629 21 17, E-mail: [email protected]IASE/NAASE Working Paper Series, Paper No. 07-17 Revealed Comparative Advantage and Specialization in Athletics Cindy Du Bois † and Bruno Heyndels †† June 2007 Abstract Using entries in the 2005 IAAF rankings as a measure of a country’s success in athletics, we analyse intercountry differences in athletic specialisation (measured through an index for revealed symmetric comparative advantage). A Tobit II model identifies macro-economic, sociological and political conditions that shape patterns of specialisation. We observe geographical patterns: African and Carribean (and to a lesser extent Asian) countries have a ‘typical’ pattern of specialisation. Highly populated as well as richer countries diversify more. Larger countries specialise in sprinting and middle distance running while leading to comparative disadvantages in non-running events. Finally, (former) socialist countries have a significant revealed comparative advantage in non-running events and a disadvantage in sprinting. JEL Classification Codes: L83 Keywords: athletics, revealed comparative advantage, specialisation An earlier version of the paper was presented at the European Association for Sport Management (EASM) Conference held at Nicosia, Cyprus, 6-9 September 2006 and at the International Association of Sports Economists (IASE) Conference in Dayton, Ohio, 27-29 May 2007. The authors would like to thank participants for useful comments on earlier drafts. We thank Thomas Crispeels and Jan Vermeir for valuable research assistance.
Revealed Comparative Advantage and Specialization in Athletics
Cindy Du Bois† and Bruno Heyndels††
June 2007
AbstractUsing entries in the 2005 IAAF rankings as a measure of a country’s success in athletics,
we analyse intercountry differences in athletic specialisation (measured through an index forrevealed symmetric comparative advantage). A Tobit II model identifies macro-economic,sociological and political conditions that shape patterns of specialisation. We observegeographical patterns: African and Carribean (and to a lesser extent Asian) countries have a‘typical’ pattern of specialisation. Highly populated as well as richer countries diversify more. Larger countries specialise in sprinting and middle distance running while leading tocomparative disadvantages in non-running events. Finally, (former) socialist countries have asignificant revealed comparative advantage in non-running events and a disadvantage insprinting.
An earlier version of the paper was presented at the European Association for Sport Management(EASM) Conference held at Nicosia, Cyprus, 6-9 September 2006 and at the InternationalAssociation of Sports Economists (IASE) Conference in Dayton, Ohio, 27-29 May 2007. Theauthors would like to thank participants for useful comments on earlier drafts. We thankThomas Crispeels and Jan Vermeir for valuable research assistance.
2
REVEALED COMPARATIVE ADVANTAGE
&
SPECIALISATION IN ATHLETICS
Introduction
The degree to which individual countries are succesful in sports differs considerably.
Whereas some nations dominate (given) sports, others hardly ever come into the picture. A
lot of empirical work has been published demonstrating that the macro-economic,
geographical, sociological and political context plays a crucial role. These studies focus
mainly on the success during Olympic Games, notably the Summer Olympics. While
demonstrating that – indeed – (economic, sociological, ...) context matters for sporting
success in general, they also show that these determinants have divergent impacts on specific
sports. Recently, Glejser (2002) and Tcha and Pershin (2003) compare this to specialisation
in international trade. Just like some countries are (relatively) better in producing exotic
fruits and others have an advantage in the production of cars, the context of some countries
may create comparative advantages in specific sport disciplines: ‘producing’ athletes that are
succesful at the Winter Olympics is easier in Switzerland than in, say, Spain or Senegal.
Specialisation in specific disciplines is a natural result.
Recognition of the methodological similarity between specialisation in international trade
and in sports opens up a rich empirical toolbox for sports economists. Tcha and Pershin
(2003) illustrate this convincingly. They show how nations’ macro-economic, geographical,
sociological and political context affects their degree of specialisation in one or more olympic
sports. Mitchell and Stewart (2007) point out the importance of these comparative
3
advantages for the different sports in receiving government funding. A similar type of
comparative advantage can be expected to exist within a heterogeneous sport as athletics.
The context that is favourable to ‘produce’ long distance runners is likely to be different from
the context favouring success in pole vaulting. These type of differences in specialisation are
the focus of the present article. We analyse empirically how macro-contextual variables
shape specialisation patterns across countries. We ammend Tcha and Pershin’s framework
in two ways. First, we use a different indicator of specialisation. Tcha and Pershin (2003)
use an index of revealed comparative advantage (RCA) as developed by Balassa (1965). Still, as
demonstrated by Laursen (2000) this indicator suffers from a number of weaknesses,
especially in the context of empirical work as we envisage here. Thereto, for our own
empirical work we make use of Laursen’s index of revealed symmetric comparative advantage
(RSCA). Second, whereas Tcha and Pershin (2003) use Tobit I analysis, we make use of a
Tobit II estimator. This allows us to disentangle two interrelated characteristics of a
country’s performance in sports: its level of success on the one hand and its degree of
specialisation in specific sports on the other.
The paper is organised as follows. In section 1 we briefly discuss the literature on
determinants of nations’ sports successes and introduce the theoretical notion of (revealed)
comparative advantage. In section 2 we demonstrate how indicators developed by Balassa
(1965) and Laursen (2000) allow to measure the different degrees and natures of
specialisation in sub-disciplines within athletics. Section 3 presents the empirical model
explaining intercountry differences in revealed comparative advantage. The main results are
discussed in section 4. Section 5 concludes.
4
1. International success and specialisation in sports
Many authors explore the relationship between international sporting success of countries
and the macro-economic, sociological and political context (recent examples are Bernard and
Busse, 2000; Hoffman, Ging and Ramasamy, 2002; Johnson and Ayfer, 2002; De Bosscher et
al., 2003; Lins et al., 2003). The two central environmental factors for success are population
and wealth. For obvious reasons, a larger population as a rule increases the level of success
in sports. The larger is the pool of talent in a country, the more likely it is that ‘exceptional’
talents are detected and developed. Wealth (expressed as per capita GDP) is an important
determinant of success as it not only increases countries’ potential to invest in sports but it is
also a proxy for the living conditions of the population. Other important determinants of
success are: area (larger countries generally have a greater physiological, as well as
climatological and geographical diversity), degree of urbanisation (sports tend to be an
urban activity), religion (the protestant value system tends to translate into sporting success,
the muslim countries ‘underperform’) and politics (former communist countries tend to be
more successful).
This literature focuses on determinants of sporting success, most often in terms of success at
the Olympics. The typical focus is the level of success as measured by the (weighted)
number of medals won. As a complement to the standard approach in the literature that
focusses on the level of sport success, Tcha and Pershin (2003) analyse the issue of
specialisation. While a country may or may not be succesful in sports in general, typically it
will have some specific sports where its performances are relatively better and other sports
where its success is less impressive. To analyse this, Tcha and Pershin (2003) introduce the
5
notion of comparative advantage into the sports economics literature. The notion was
introduced as early as 1817 in the economics of international trade by Ricardo, who showed
that it may be beneficial for countries to specialise (and trade) even if those countries are
able to produce every item more cheaply than any other country. As a rule, a country is
expected to specialise in the production of those items where its cost advantage is largest in
relative – or comparative - terms. If in a two-country world country A can produce both
goods X and Y more cheaply, it is said to have an absolute cost advantage for both. It may
still benefit from specialising and trading in the good where the ratio of production costs is
most beneficial. For example specialisation in X is beneficial for country A if this country can
produce X three times as cheaply as country B while it can produce Y ‘only’ twice as cheap.
In that case country B should specialise in the production of Y (where its relative cost
disadvantage is smallest) and both countries will benefit from mutual trade. As a result,
comparative cost advantages in the production of X and/or Y translate into different
patterns of production and import/export.
Tcha and Pershin (2003) show that a similar type of specialisation is present in sports. Even
if some countries are ‘better’ in all (or many) sports, they will specialise. This specialisation
depends upon the underlying cost and production functions which, in turn, depend on the
context. Just as in international trade, these cost and production functions are not
observable. Still, the actual trade patterns and sports specialisation (successes in
international competitions) are. In the trade literature a number of indicators have been
developed to empirically identify the specialisation patterns. The ‘classic’ indicator is
Balassa (1965)’s measure of Revealed Comparative Advantage (RCA). “The concept of RCA
pertains to the relative trade performances of individual countries in particular commodities,
and it is based on the assumption that the commodity pattern of trade reflects intercountry
6
differences in relative costs, as well as in nonprice factors” (Balassa; 1965 in Tcha & Pershin;
2003; p. 219).
Tcha and Pershin (2003) use Balassa’s indicator to measure the comparative advantages in
‘producing’ success at the summer Olympics. The intuition is similar to the idea underlying
the notion of revealed comparative advantage in international trade: “For example, in a
simple two-factor (capital and labor) model, a developed country with a relatively large
supply of capital but a small population would specialize in capital-intensive sports, such as
yachting. In contrast, a poor country with a relatively low level of capital would specialize in
those sports where capital is relatively less important (or labor-intensive), say marathon
running or boxing” (Tcha & Pershin, 2003, p.220). The identification of comparative
advantages means in practical terms that for each country i and sport j the authors calculate
Balassa (1965)’s RCA-index (Rij) as:
Mij / Mi
Rij = (1)
Tj / T
Where Mi is the total amount of medals won by country i. Mij is country i's number of
medals in sport j. T is the total number of medals at the Olympics (over all sports) and Tj is
the number of medals won in sport j. Put differently: the denominator of the RCA-index for
a given sport j gives the share of all (Olympic) medals in that specific sport. The nominator
gives the corresponding share for country i. The indicator will take a value 1 if – for country
i - the share of medals from sport j (as a percentage of all medals won by i) equals the share
of medals that were given in that specific sport. Larger values indicate that in relative terms
7
country i won more medals in sport j than the average country (and thus is considered to
reveal a comparative advantage in that sport). Smaller values indicate that it won less
medals than average (and thus reveals a comparative disadvantage, RCD).
In their empirical analysis Tcha and Pershin (2003) consider performance in 5 sports
(swimming, athletics, weights, ball games, gymnastics) and a rest category. Of course, the
ranking of countries in terms of RCA diverges from the ‘typical’ rankings in terms of
absolute or relative (to population size) measures. For example, Tcha and Pershin (2003)
observe that for the Summer Olympics from 1988 to 1996 the US is the country with the
highest medal total in athletics. In terms of RCA, the US ranks 20th. Still, when comparing
the RCA values over the different sports for the US the RCA index for athletics (Rij = 1.55) is
higher than for any other sport. This reflects that the US has a (revealed) comparative
advantage in athletics. The fact that in spite of this the country only ranks 20th merely
illustrates that 19 countries have an even stronger RCA. In practical terms this often means
that those are countries that may (or may not) be highly successful in absolute terms but that
they at the same time are unsuccessful elsewhere. Examples are countries like Uganda and
Zambia that won respectively 1 and 2 Olympic medals in athletics (compared to the 174 by
the US) but for which these were the only medals (whereas the US totalled 632 Olympic
medals).
Tcha and Pershin (2003) find clear patterns in the degrees of specialisation across countries.
For example: in athletics the RCA index is significantly affected by countries’ land mass,
altitude, per capita GDP and the length of their coastlines. While the first three determinants
exert a positive influence on the RCA index, the length of the coastline leads to a revealed
comparative disadvantage. Finally, African countries have a systematically higher RCA
8
index indicating that they perform better in athletics than in the other sports under
consideration.
2. Revealed comparative advantage in athletics
As discussed, Tcha and Pershin (2003) find clear evidence of inter-country differences in
specialisation in sports. But, of course, just as the set of all Olympic Sports is highly
heterogeneous it is the case that (some) sports are themselves highly heterogeneous.
Athletics is a case in point. It goes without saying that an environment that is favourable to
produce ‘marathon success’ is likely to be different from an environment producing ‘pole
vaulting success’. For example, whereas the former involves little ‘capital’, the latter is
highly capital-intensive. This is true for physical capital: in contrast to the pole vaulter a
marathon runner hardly needs any specialised infrastructure to practice. This is also true for
‘human’ capital: whereas the starting age for marathon runners is relatively unimportant –
indeed, many successful marathon runners started running at (almost) adult age – the high
technical demands on pole vaulters makes it necessary to start the sports education at a
relatively young age in order to develop the necessary skills. An immediate implication is
that a country’s success in pole vaulting is expected to depend much more on its system of
talent detection and on the available infrastructure and training facilities (which in turn
likely depend on a.o. the country’s wealth). These differences between marathon running
and pole vaulting can be expected to exist between most events within athletics. As a result
we may expect that countries will have comparative advantages (or disadvantages) in the
events depending on their macro-economic, political and sociological environment.
9
To investigate RCA in athletics, we did not restrict ourselves to success at the Summer
Olympics but chose for a more general approach based on data from the official 2005 IAAF-
rankings (International Association of Athletics Federations).1 Both women and men’s
performances were considered. The rankings give – for each event – all performances above
a given threshold as defined by the IAAF.2,3 For 2005 a total of 7,856 athletes were thus
considered (3,901 male and 3,955 female), coming from 141 different countries. While, of
course, the number of athletes passing a given threshold differs from year to year and among
events this corresponds to considering on average the top-167 in the world. We only
consider ‘classic’ disciplines (leaving out ranking information on 1000 m, mile, 2000 m
running as well as the relays) and grouped the remaing disciplines. In a first step we
consider four main categories:
1 Data obtained from http://www.iaaf.org/statistics/toplists/index.html as of December 24th 2005.
2 Of course, it often occurs that some athletes more than once performed better than the IAAF
threshold. Evidently, for our calculations we only took each athlete into account once. For example,
100 m sprint world record holder Asafa Powell appears 6 times in the ranking. To determine
Jamaica’s success we, of course, consider this as ‘1’ Powell’s appearance in the 200m rankings is,
however, considered as a separate Jamaican ‘output’.
3 Note that alternatives could be advocated if only because in the existing empirical work on Olympic
success such double counting is not controlled for. When counting the number of medals it is not
common practice to account for the fact that some athletes win more than just one medal. Note that
this may bias results in favor of countries that specialise in sports where single talents can win more
medals (like in swimming or athletics).
10
1. sprinting (incl. hurdling) and middle distance running
2. long distance running
3. non-running events
4. race walking
Of course, these are still highly heterogeneous categories. For example, specialisation in
hammer throwing is likely to depend on other environmental characteristics than
specialisation in long jump. Similarly the lumping together of sprinting events with middle
distance running is likely to miss out crucial differences between these events. Therefore, in
a second step we further subdivide the above categories into 12 subcategories:4
1. Sprinting: 100m, 200m, 400m
2. Hurdling: 110m & 400 hurdles
3. Middle distance: 800m and 1500m
4. Long distance: 3000m, 5000m, 10000m and 3000m steeplechase
5. Street running: (1/2) marathon
6. Long jump & Triple jump
7. High jump
8. Pole Vault
9. Shot put & Discuss throw
10. Javelin throw
11. Hammer throw
12. Heptathlon and Decathlon
4 Race walking is not subdivided further.
11
While Balassa’s indicator captures the notion of comparative advantage, Laursen (2000)
demonstrates that if the index is to be used for econometric analysis, it should be replaced by
a symmetric version of it. Indeed, as can be seen from expression (1) the Rij index for RCA
ranges from zero to one if a country is not specialised while it ranges from 1 to infinity in
case of specialisation. The index is thus clearly asymmetric. The higher values unavoidably
bias empirical estimates in a model trying to explain degrees of specialisation. Therefore,
Laursen (2000) suggests transforming Balassa’s indicator to an index of Revealed Symmetric
Comparative Advantage (RSCA). This indicator is defined as:
Rij - 1
RSij = (2)
Rij+ 1
The RSij index ranges between –1 and +1. Positive numbers indicate specialisation. Negative
numbers indicate that a country i is not specialised in discipline j. The special ‘status’ of –1
observations should be noted. This value is obtained if Balassa’s indicator Rij=0, that is if a
country has not a single entry in the corresponding IAAF-ranking. This means that the
comparative advantage or disdavantage is not revealed. The estimation technique in a model
explaining cross-country differences in revealed comparative advantage should explicitly
account for this. We return to this issue further in the text.
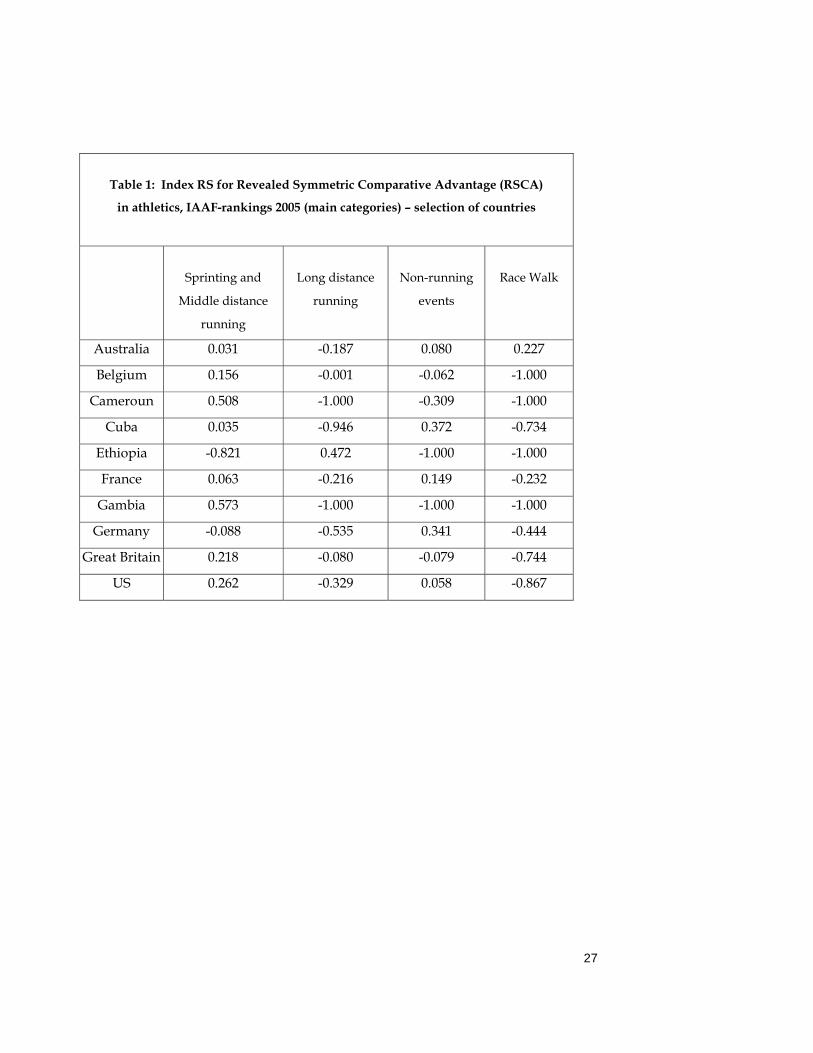
Table 1 gives the values for a selection of countries and for the main event categories as
defined earlier. Table A1 in appendix gives similar information for the more detailed set of
athletic events.
12
_______________________
Table 1 here
_______________________
Table 1 (and A1 in appendix) reveals a number of important general characteristics. First, as
expected, some countries have IAAF-entries in only a selected number of events. Countries
like the US and Australia, however, have entries in all the event categories in table 1. Table
A1 shows that even when we subdivide the events further, the US and Australia still have
entries for the 12 subcategories. At the other extreme, countries like Cameroun or Gambia
have few athletes that surpass the IAAF thresholds. Gambia only has sprinters passing the
IAAF standard threshold (see table A1). This is taken to reflect very strong specialisation.
Such a lack of diversification is a typical characteristic of smaller and/or less developed
countries. The situation is analogous to ‘regular’ trade situations: “In terms of RCA, Balassa
(1977) pointed out that large countries are expected to have a more diversified export
structure (have RCA for more goods but to a smaller degree), mainly because their large
domestic markets permit the exploitation of economies of scale in a wide range of industries”
(Tcha & Pershin, 2003, p.231).
A second characteristic that is apparent from table 1 is that for those countries that have
entries in all disciplines RSij exceeds 0 for some events while being negative for other. This
reflects the fact that specialisation in a set of events X by definition means that a country is
not specialised in the complement set –X. Taking the US as an example, in table A1, we see
that the country is specialised in sprinting, hurdling, pole vaulting, shot put & discus
throwing and heptathlon/decathlon. (positive values for the index of RS). They have a
revealed comparative disadvantage for all other events (negative values). Specialisation is
strongest in sprinting (RS=0.371) and weakest street running (RS=-0.750). The issue is more
13
complicated for countries that have a number of -1-entries. As discussed, this reflects the fact
that no comparative advantage nor disadvantage is revealed. It is of crucial importance to see
that the fact that the comparative (dis-)advantage is not revealed does not mean it is not
there. The reason for this lies in the measure of success that we use: the presence of an
athlete in the 2005 IAAF rankings. A country that has no athletes in any of the IAAF
rankings may in certain disciplines have athletes that ‘almost’ made it to the rankings
whereas in other disciplines they are much further away from the threshold performance
[then the country would have a comparative advantage in the former events while having a
comparative disadvantage in the latter].5 This insight is crucial when empirically testing a
model that aims to explain cross-country variation in the index of RSCA. Intuïtively, it
should be clear that a value RSij = -1.000 is not to be interpreted as a value that lies close to
say, - 0.999. Whereas the latter value would be an indication of very strong comparative
disadvantage, the RSij= -1.000 may ‘hide’ comparative disadvantage or advantage. 6
5 Put differently, suppose we would be using a much stricter definition of success, like the number of
Olympic medals. In that case countries that did not win a medal would turn up having no revealed
comparative advantage. It is needless to say that still for most countries the likelihood of winning a
medal differs across disciplines.
6 While there may be reasons to expect that the likelihood of there being a comparative disadvantage
is larger in athletic event j=y with RSiy =-1.00 if a country has revealed comparative (dis-)advantage
for all other events (i.e. RSij >-1.00 for j≠y) nothing can be said with respect to this likelihood if the
country has –1.00 values for multiple or even all other events.
14
3. Empirical model and method
A stylized model explaining inter-country differences in specialisation can be written as:
Tobin,J. (1958). Estimation of relationships for limited dependent variables. Econometrica,
26(1), 24-37.
Verbeek,M. (2002). A guide to modern econometrics, New York, John Wiley & Sons.
26
APPENDIX
_______________________
Table A1 here
_______________________
27
Table 1: Index RS for Revealed Symmetric Comparative Advantage (RSCA)
in athletics, IAAF-rankings 2005 (main categories) – selection of countries
Sprinting and
Middle distance
running
Long distance
running
Non-running
events
Race Walk
Australia 0.031 -0.187 0.080 0.227
Belgium 0.156 -0.001 -0.062 -1.000
Cameroun 0.508 -1.000 -0.309 -1.000
Cuba 0.035 -0.946 0.372 -0.734
Ethiopia -0.821 0.472 -1.000 -1.000
France 0.063 -0.216 0.149 -0.232
Gambia 0.573 -1.000 -1.000 -1.000
Germany -0.088 -0.535 0.341 -0.444
Great Britain 0.218 -0.080 -0.079 -0.744
US 0.262 -0.329 0.058 -0.867
28
Table 2: Explaining RSCA-index (main categories)
Sprinting & Middle
distance running
Long distance running
Non-running events
Race Walking
Selection Equation
Outcome equation
Selection equation
Outcome equation
Selection equation
Outcome equation
Selection equation
Outcome equation
C -0.47 (-1.27)
0.13 (1.28)
-0.73 (-2.29)
-0.33 (-1.98)
0.20 (0.56)
0.23 (2.52)
-0.93 (-2.68)
0.29 (1.45)
POP 19.92 (1.74)
-0.18 (-1.82)
-1.27 (-0.94)
-0.08 (-0.42)
6.09 (2.89)
-0.07 (-0.52)
18.44 (3.28)
0.13 (0.38)
PCGDP
58.17 (2.71)
-9.10 (-2.29)
60.19 (3.44)
5.53 (0.91)
47.98 (2.25)
-5.15 (-1.18)
35.65 (2.03)
-21.35 (-2.44)
AREA 0.01 (0.06)
0.03 (3.56)
0.44 (1.43)
0.00 (-0.34)
0.02 (0.16)
-0.01 (-2.57)
0.12 (1.35)
-0.01 (-0.63)
SOC 0.93 (2.31)
-0.28 (-3.07)
0.75 (1.99)
-0.11 (-0.94)
0.70 (1.54)
0.12 (1.69)
0.53 (1.51)
0.08 (0.51)
ASIA -0.11 (-0.25)
-0.13 (-1.25)
-0.23 (-0.66)
0.22 (1.46)
-0.35 (-0.83)
0.06 (0.60)
-1.41 (-3.49)
-0.17 (-0.89)
AFRIC 0.73 (1.91)
0.11 (1.08)
0.25 (0.70)
0.48 (3.47)
-0.85 (-2.19)
-0.31 (-2.50)
-1.75 (-2.45)
-0.64 (-2.48)
CARI 1.46 (2.78)
0.45 (6.27)
-0.69 (-1.57)
-0.36 (0.11)
-0.69 (-1.68)
-0.32 (-3.11)
-1.19 (-2.31)
-1.65 (-8.35)
Rho 0.43 0.34 0.28 0.83 Sigma 0.30 0.32 0.27 0.43 LL -78.97 -99.23 -75.65 -66.59 N° observations 141 141 141 141 N° uncensored obs. 112 74 101 44 z-values based on heteroskedasticity-consistent standard errors in parentheses POP, PCGDP, AREA expressed in billion, million € and million km² respectively
29
Table 3.a: Explaining RSCA-index (sub categories) Only outcome equations are reported
Sprinting
Hurdling
Middle distance
Long
distance
Street
running
Long &
triple jump C 0.14
(1.00) 0.45
(3.16) 0.011 (0.06)
-0.43 (-3.84)
0.18 (1.26)
0.41 (0.80)
POP -0.30 (-1.35)
-0.03 (-0.20)
-0.58 (-4.15)
-0.02 (-0.11)
-0.35 (-1.90)
-0.23 (-0.73)
PCGDP
-14.06 (-2.35)
-15.51 (-2.55)
3.40 (-0.46)
13.05 (2.67)
-20.36 (-3.38)
-21.49 (-1.41)
AREA 0.03 (2.88)
0.00 (0.22)
0.03 (3.16)
-0.01 (-0.64)
0.00 (-0.18)
0.00 (0.07)
SOC -0.37 (-3.06)
-0.31 (-2.55)
-0.10 (-0.82)
-0.02 (-0.22)
-0.38 (-3.14)
0.08 (0.31)
ASIA 0.13 (0.66)
-0.12 (-0.98)
0.14 (0.85)
0.15 (0.89)
0.37 (2.54)
0.11 (0.75)
AFRIC 0.31 (2.03)
-0.19 (-0.96)
0.06 (0.35)
0.54 (3.28)
0.13 (0.75)
-0.08 (-0.61)
CARI 0.67 (6.13)
0.05 (0.40)
-0.01 (-0.07)
-0.32 (-1.28)
-0.19 (-0.48)
-0.10 (-0.57)
Rho 0.26 0.05 0.64 0.26 0.12 0.26 Sigma 0.33 0.36 0.36 0.32 0.34 0.30 LL -98.42 -118.86 -98.67 -89.71 -98.47 -94.84 N° observations 141 141 141 141 141 141 N° uncensored obs. 77 74 72 60 64 78 z-values based on heteroskedasticity-consistent standard errors in parentheses POP, PCGDP, AREA expressed in billion, million € and million km² respectively
30
Table 3.b: Explaining RSCA-index (sub categories - continued) Only outcome equations are reported
High jump
Pole vault
Shot put &
discus
Javelin
Hammer
Heptathlon Decathlon
C 0.34 (2.66)
0.20 (1.66)
0.29 (1.88)
-0.19 (-0.73)
0.33 (1.12)
-0.03 (-0.11)
POP -0.52 (-3.25)
-0.15 (-0.67)
0.44 (2.19)
-0.06 (-0.21)
-0.40 (-1.76)
-0.06 (-0.23)
PCGDP
-10.76 (-1.87)
2.66 (0.47)
-13.70 (-2.00)
8.23 (0.94)
-10.59 (-1.12)
5.30 (0.48)
AREA 0.00 (-0.27)
-0.01 (-1.07)
-0.02 (-1.58)
-0.02 (-1.68)
-0.01 (-0.70)
-0.02 (-1.48)
SOC 0.11 (1.10)
-0.04 (-0.32)
-0.03 (-0.26)
0.31 (1.88)
0.09 (0.52)
0.26 (1.55)
ASIA 0.08 (0.49)
-0.05 (-0.19)
-0.20 (-1.18)
0.41 (2.45)
-0.02 (-0.09)
-0.15 (-0.45)
AFRIC -0.05 (-0.28)
-0.19 (-1.10)
-0.41 (-2.20)
0.02 (0.09)
-0.23 (-0.76)
-0.12 (-0.37)
CARI -0.17 (-0.96)
-0.12 (-0.48)
-0.82 (-3.54)
-0.37 (-1.54)
-0.40 (-1.58)
-0.09 (-0.30)
Rho 0.46 0.16 0.89 0.89 0.54 0.51 Sigma 0.29 0.33 0.40 0.40 0.36 0.38 LL -76.26 -75.86 -22.84 -75.02 -79.61 -79.70 N° observations 141 141 141 141 141 141 N° uncensored obs. 57 48 65 52 46 46 z-values based on heteroskedasticity-consistent standard errors in parentheses POP, PCGDP, AREA expressed in billion, million € and million km² respectively
31
Table A1: Index for Revealed Symmetric Comparative Advantage in athletics for 12 event categories – selected countries