The Pacific Journal of Science and Technology –159– http://www.akamaiuniversity.us/PJST.htm Volume 16. Number 1. May 2015 (Spring) Comparative Analysis of GSM Network and IS-95 CDMA Network Using Signal Strength. N.T. Makanjuola 1 ; O.O. Shoewu 1 ; L.A. Akinyemi 1,2 ; and A.A. Ajasa 1 1 Department of Electronic and Computer Engineering, Lagos State University, Epe Campus, Epe, Lagos, Nigeria. 2 Department of Electrical Engineering, Faculty of Engineering and the Built Environment, University of Cape Town, South Africa. E-mail: [email protected][email protected][email protected][email protected]ABSTRACT This paper discusses the technical differences between the world’s two biggest wireless networks – GSM and CDMA. The experiment was based on a rural area in Lagos state, Nigeria called Agbado. It focuses on the quantitative comparison between the GSM networks standard and CDMA networks standard. However, comparative analysis was made in endeavor to distinguish the signal capacities (strength and quality) of both network standards using TEMS investigation software. The main focus was how to exploit the capacity potential to achieve the system features required. The overall picture is that a very careful system design in ideal conditions is necessary to utilize the full potential of CDMA as well as GSM systems. For the purpose of this work our range was from -110 to -10 dBm for the received signal level (Rx Level) and (Rx Power) and then from -18 to 0 dBm for the received signal quality (Rx Quality). But for the Energy per chip to Interference energy ratio (Ec/Io) our range was from -24 to 0 dBm. It was ascertained that the GSM analysis done, offered more signal strength in the area investigated (Agbado) compared to its CDMA counterpart, which offered less signal strength in the same region of Lagos state. (Keywords: CDMA, code division multiple access, GSM, global system for mobile communications, signal capacity, Ec/Io, energy per chip, interference energy) INTRODUCTION In cellular service there are two main competing network technologies: Global System for Mobile Communications (GSM) and Code Division Multiple Access (CDMA). [6] Cellular carriers including Sprint PCS, Cingular Wireless, Verizon and T-Mobile use one or the other. Over the years, the mobile communication has witness a remarkable success in development in mobile communication networks. These developments were based on solving the problem of limitation of transmission channels in mobile communication network. The effort to increase the network capacity and coverage has lead into different techniques. These new developed techniques formed the basic rock of different mobile communication standards. The GSM network and CDMA network are two major mobile communication standards found in Nigeria. Therefore, there is need to carry out holistic comparison between these mobile communication standards. According to Madanpuri and Rao (2010) who worked on “CDMA & GSM technology comparison”, in the context of this paper, the generic term CDMA is used to refer to the CDMA portion of the IS-95 standard and the generic term GSM is used to refer to the GSM standard operating around the frequency regions 900MHz, 1800MHz, and 1900MHz. Additionally, Osahenvemwen and Ojieabu (2012) who researched on “Quantitative Comparison between the GSM Networks and CDMA2000 Networks” and holistic literature review was deployed to examine the working
Transcript
The Pacific Journal of Science and Technology –159– http://www.akamaiuniversity.us/PJST.htm Volume 16. Number 1. May 2015 (Spring)
Comparative Analysis of GSM Network and IS-95 CDMA Network Using Signal Strength.
N.T. Makanjuola1; O.O. Shoewu1; L.A. Akinyemi1,2; and A.A. Ajasa1
1Department of Electronic and Computer Engineering, Lagos State University, Epe Campus,
Epe, Lagos, Nigeria. 2Department of Electrical Engineering, Faculty of Engineering and the Built Environment,
ABSTRACT This paper discusses the technical differences between the world’s two biggest wireless networks – GSM and CDMA. The experiment was based on a rural area in Lagos state, Nigeria called Agbado. It focuses on the quantitative comparison between the GSM networks standard and CDMA networks standard. However, comparative analysis was made in endeavor to distinguish the signal capacities (strength and quality) of both network standards using TEMS investigation software. The main focus was how to exploit the capacity potential to achieve the system features required. The overall picture is that a very careful system design in ideal conditions is necessary to utilize the full potential of CDMA as well as GSM systems. For the purpose of this work our range was from -110 to -10 dBm for the received signal level (Rx Level) and (Rx Power) and then from -18 to 0 dBm for the received signal quality (Rx Quality). But for the Energy per chip to Interference energy ratio (Ec/Io) our range was from -24 to 0 dBm. It was ascertained that the GSM analysis done, offered more signal strength in the area investigated (Agbado) compared to its CDMA counterpart, which offered less signal strength in the same region of Lagos state. (Keywords: CDMA, code division multiple access, GSM,
global system for mobile communications, signal capacity, Ec/Io, energy per chip, interference energy)
INTRODUCTION
In cellular service there are two main competing network technologies: Global System for Mobile Communications (GSM) and Code Division Multiple Access (CDMA). [6] Cellular carriers including Sprint PCS, Cingular Wireless, Verizon and T-Mobile use one or the other. Over the years, the mobile communication has witness a remarkable success in development in mobile communication networks. These developments were based on solving the problem of limitation of transmission channels in mobile communication network. The effort to increase the network capacity and coverage has lead into different techniques. These new developed techniques formed the basic rock of different mobile communication standards. The GSM network and CDMA network are two major mobile communication standards found in Nigeria. Therefore, there is need to carry out holistic comparison between these mobile communication standards. According to Madanpuri and Rao (2010) who worked on “CDMA & GSM technology comparison”, in the context of this paper, the generic term CDMA is used to refer to the CDMA portion of the IS-95 standard and the generic term GSM is used to refer to the GSM standard operating around the frequency regions 900MHz, 1800MHz, and 1900MHz. Additionally, Osahenvemwen and Ojieabu (2012) who researched on “Quantitative Comparison between the GSM Networks and CDMA2000 Networks” and holistic literature review was deployed to examine the working
The Pacific Journal of Science and Technology –160– http://www.akamaiuniversity.us/PJST.htm Volume 16. Number 1. May 2015 (Spring)
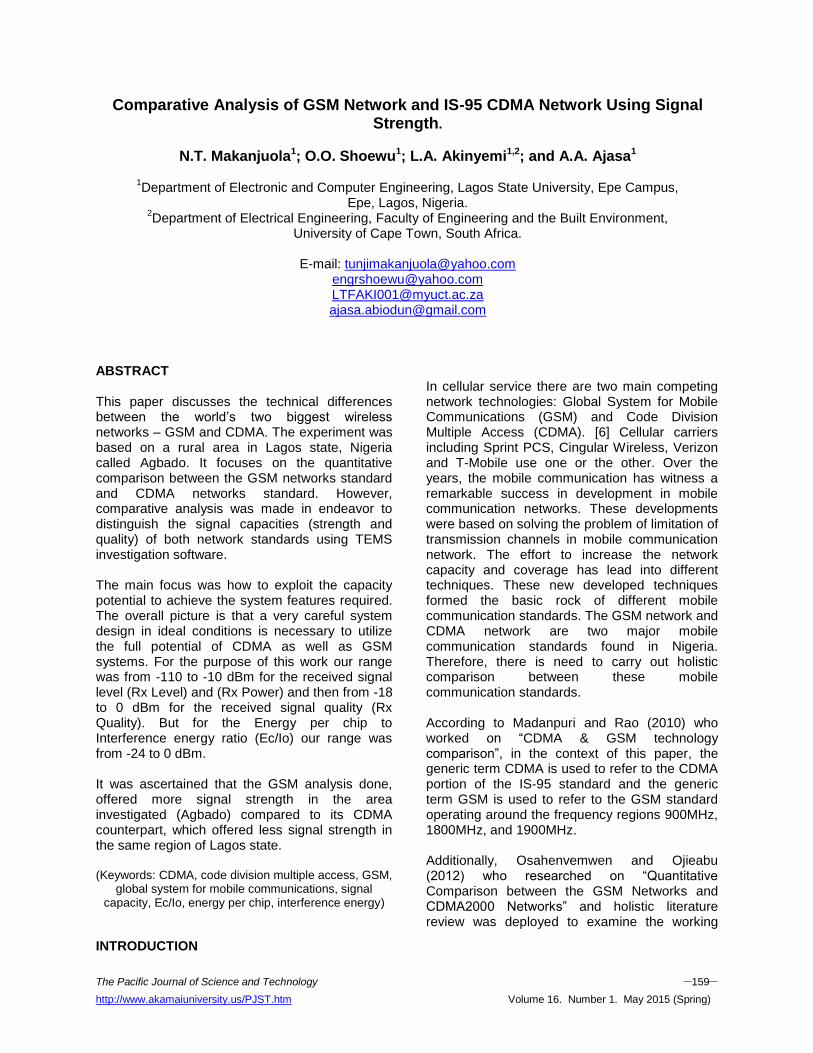
principles (operation) and architecture system of both mobile communication standards. More so, Leichstein (2012) who worked on the “Comparison of CDMA and GSM” whose paper focused on how telecommunication administrator and operators are usually concerned with 6 key factors to determine on the selection of technology and investment, those are coverage, capacity, clarity, choice, cost, and customer satisfaction. Also, Martınez-Olmos, Murillo-Fuentes, and Esteve, of Vodafone Group Research & Development. (2011) researched on “Analyzing Signal Strength versus Quality Levels In Cellular Systems: A Case Study In GSM”. In which they proposed a new tool to analyze the performance of a cellular base station. The main objective of the paper was to fully describe and, therefore, to detect situations involving abnormal interference levels in UL and DL. In addition, Hughes (2012) who worked on the “Difference between GSM and CDMA”, stated that the major difference between the two lies in terms of the technology they use, security factors, their global reach and the data transfer speeds. Approximately 80% of the mobile communications industry uses GSM technology, with IS-95 following at approximately 10-15% [9]. As the market shifts to 3G technologies, GSM is moving towards the implementation of Wideband CDMA (W-CDMA), while the successor of IS-95 is CDMA2000.
Figure 1: Global Reach of Both Networks.
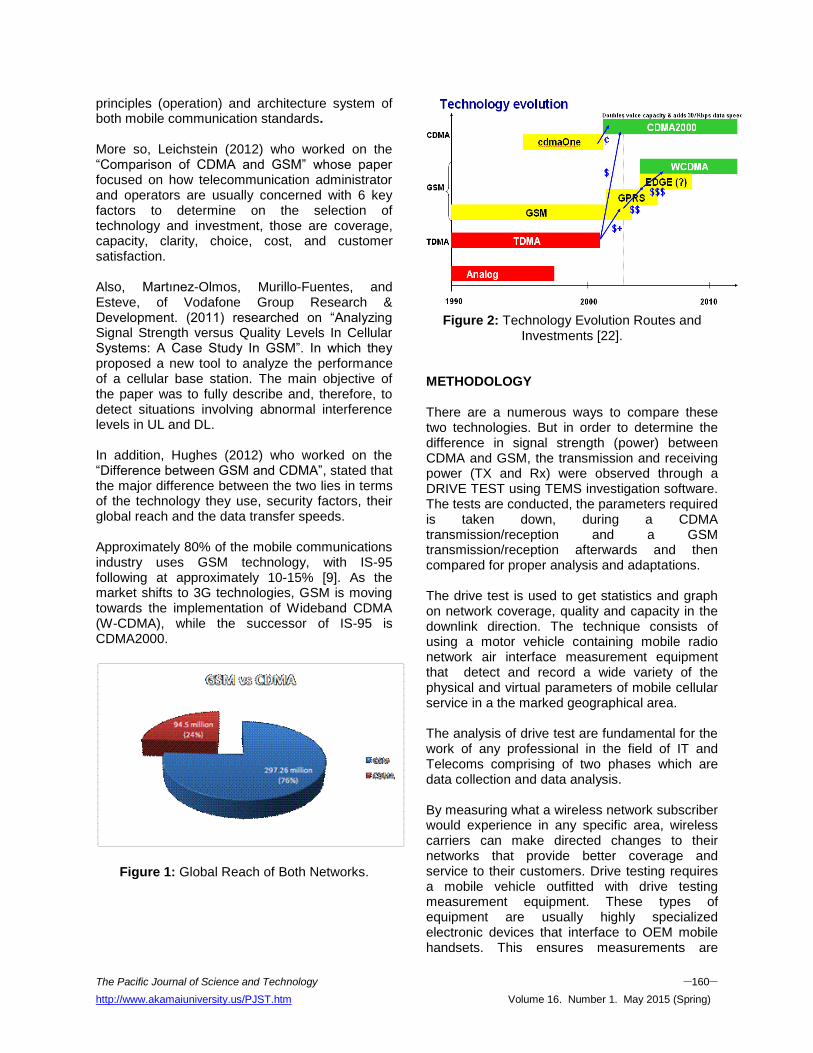
Figure 2: Technology Evolution Routes and Investments [22].
METHODOLOGY There are a numerous ways to compare these two technologies. But in order to determine the difference in signal strength (power) between CDMA and GSM, the transmission and receiving power (TX and Rx) were observed through a DRIVE TEST using TEMS investigation software. The tests are conducted, the parameters required is taken down, during a CDMA transmission/reception and a GSM transmission/reception afterwards and then compared for proper analysis and adaptations. The drive test is used to get statistics and graph on network coverage, quality and capacity in the downlink direction. The technique consists of using a motor vehicle containing mobile radio network air interface measurement equipment that detect and record a wide variety of the physical and virtual parameters of mobile cellular service in a the marked geographical area. The analysis of drive test are fundamental for the work of any professional in the field of IT and Telecoms comprising of two phases which are data collection and data analysis. By measuring what a wireless network subscriber would experience in any specific area, wireless carriers can make directed changes to their networks that provide better coverage and service to their customers. Drive testing requires a mobile vehicle outfitted with drive testing measurement equipment. These types of equipment are usually highly specialized electronic devices that interface to OEM mobile handsets. This ensures measurements are
The Pacific Journal of Science and Technology –161– http://www.akamaiuniversity.us/PJST.htm Volume 16. Number 1. May 2015 (Spring)
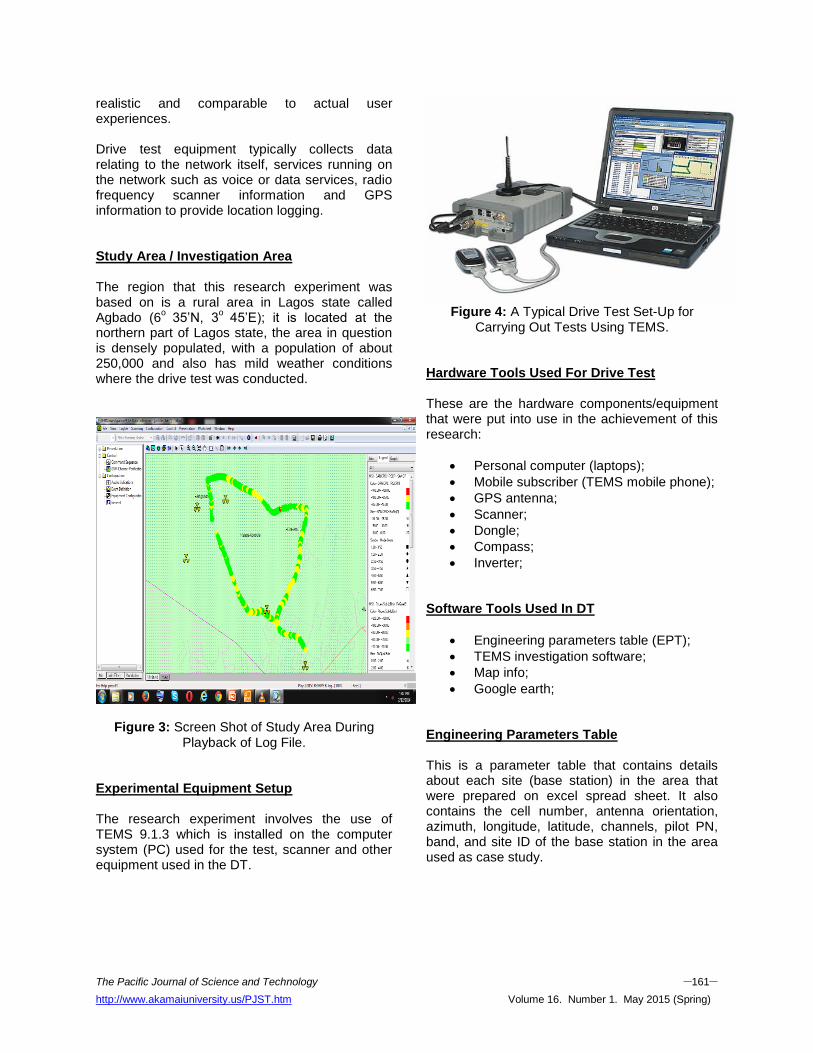
realistic and comparable to actual user experiences. Drive test equipment typically collects data relating to the network itself, services running on the network such as voice or data services, radio frequency scanner information and GPS information to provide location logging. Study Area / Investigation Area The region that this research experiment was based on is a rural area in Lagos state called Agbado (6
o 35’N, 3
o 45’E); it is located at the
northern part of Lagos state, the area in question is densely populated, with a population of about 250,000 and also has mild weather conditions where the drive test was conducted.
Figure 3: Screen Shot of Study Area During Playback of Log File.
Experimental Equipment Setup The research experiment involves the use of TEMS 9.1.3 which is installed on the computer system (PC) used for the test, scanner and other equipment used in the DT.
Figure 4: A Typical Drive Test Set-Up for
Carrying Out Tests Using TEMS.
Hardware Tools Used For Drive Test These are the hardware components/equipment that were put into use in the achievement of this research:
Personal computer (laptops);
Mobile subscriber (TEMS mobile phone);
GPS antenna;
Scanner;
Dongle;
Compass;
Inverter;
Software Tools Used In DT
Engineering parameters table (EPT);
TEMS investigation software;
Map info;
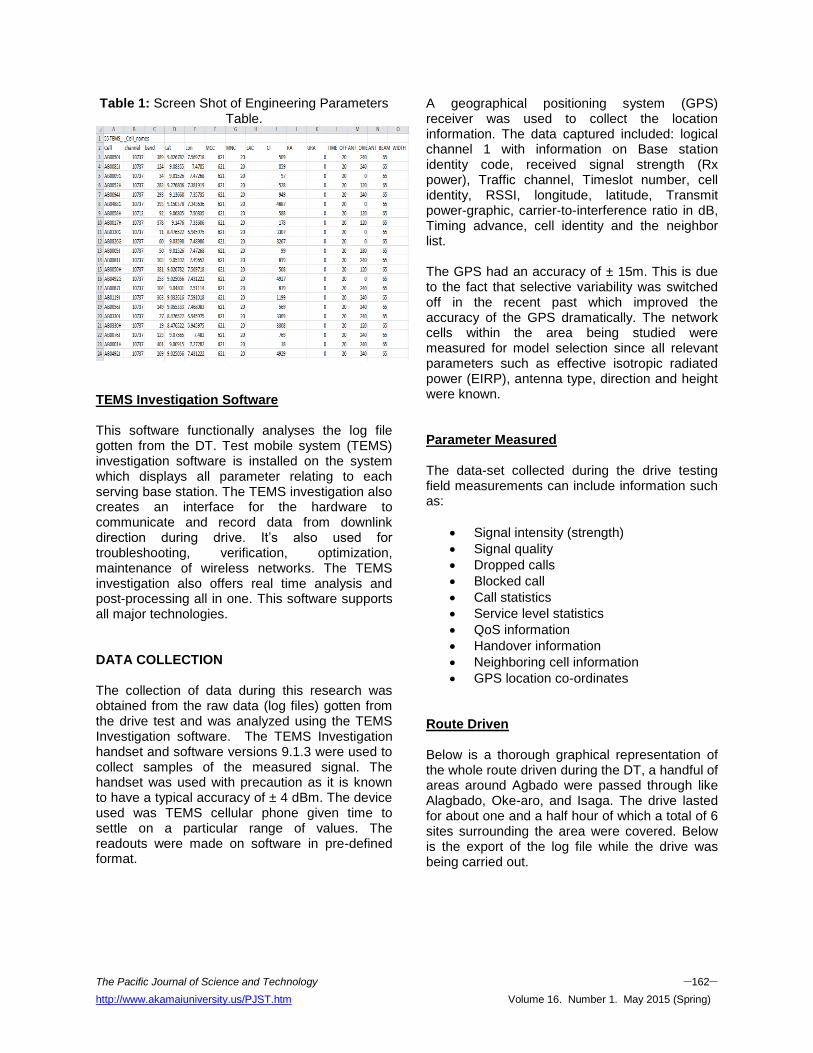
Google earth; Engineering Parameters Table This is a parameter table that contains details about each site (base station) in the area that were prepared on excel spread sheet. It also contains the cell number, antenna orientation, azimuth, longitude, latitude, channels, pilot PN, band, and site ID of the base station in the area used as case study.
The Pacific Journal of Science and Technology –162– http://www.akamaiuniversity.us/PJST.htm Volume 16. Number 1. May 2015 (Spring)
Table 1: Screen Shot of Engineering Parameters Table.
TEMS Investigation Software This software functionally analyses the log file gotten from the DT. Test mobile system (TEMS) investigation software is installed on the system which displays all parameter relating to each serving base station. The TEMS investigation also creates an interface for the hardware to communicate and record data from downlink direction during drive. It’s also used for troubleshooting, verification, optimization, maintenance of wireless networks. The TEMS investigation also offers real time analysis and post-processing all in one. This software supports all major technologies. DATA COLLECTION The collection of data during this research was obtained from the raw data (log files) gotten from the drive test and was analyzed using the TEMS Investigation software. The TEMS Investigation handset and software versions 9.1.3 were used to collect samples of the measured signal. The handset was used with precaution as it is known to have a typical accuracy of ± 4 dBm. The device used was TEMS cellular phone given time to settle on a particular range of values. The readouts were made on software in pre-defined format.
A geographical positioning system (GPS) receiver was used to collect the location information. The data captured included: logical channel 1 with information on Base station identity code, received signal strength (Rx power), Traffic channel, Timeslot number, cell identity, RSSI, longitude, latitude, Transmit power-graphic, carrier-to-interference ratio in dB, Timing advance, cell identity and the neighbor list. The GPS had an accuracy of ± 15m. This is due to the fact that selective variability was switched off in the recent past which improved the accuracy of the GPS dramatically. The network cells within the area being studied were measured for model selection since all relevant parameters such as effective isotropic radiated power (EIRP), antenna type, direction and height were known. Parameter Measured The data-set collected during the drive testing field measurements can include information such as:
Signal intensity (strength)
Signal quality
Dropped calls
Blocked call
Call statistics
Service level statistics
QoS information
Handover information
Neighboring cell information
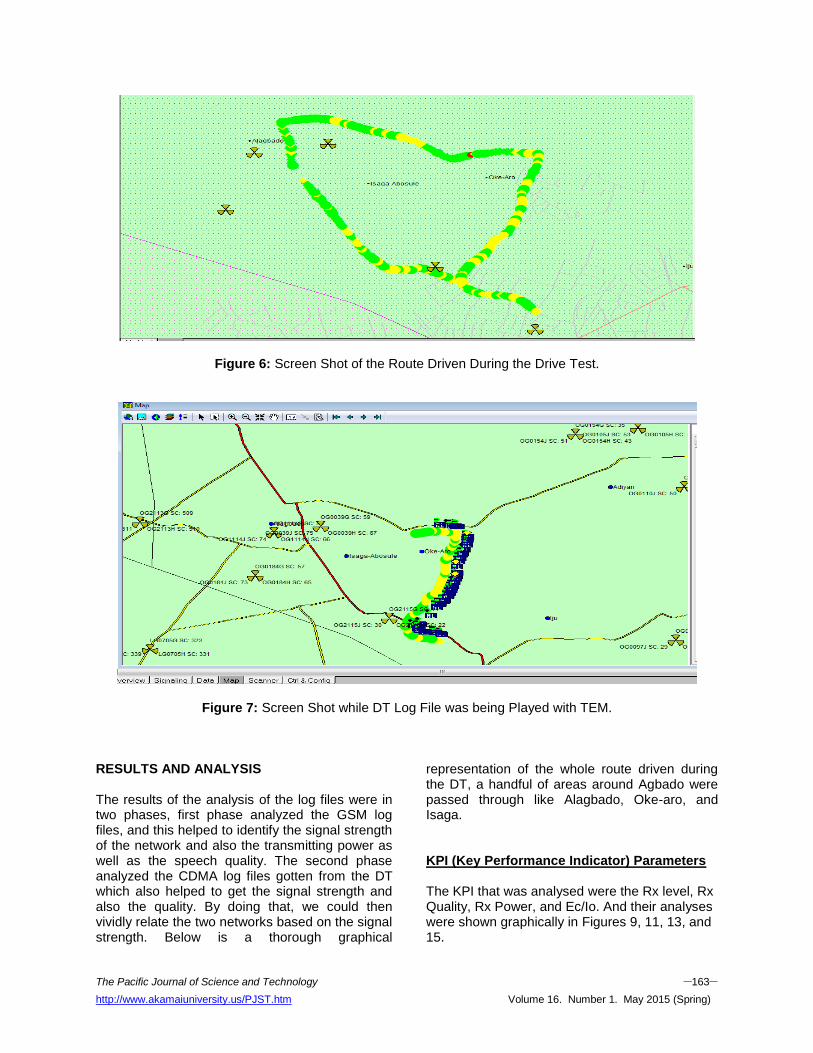
GPS location co-ordinates Route Driven Below is a thorough graphical representation of the whole route driven during the DT, a handful of areas around Agbado were passed through like Alagbado, Oke-aro, and Isaga. The drive lasted for about one and a half hour of which a total of 6 sites surrounding the area were covered. Below is the export of the log file while the drive was being carried out.
The Pacific Journal of Science and Technology –163– http://www.akamaiuniversity.us/PJST.htm Volume 16. Number 1. May 2015 (Spring)
Figure 6: Screen Shot of the Route Driven During the Drive Test.
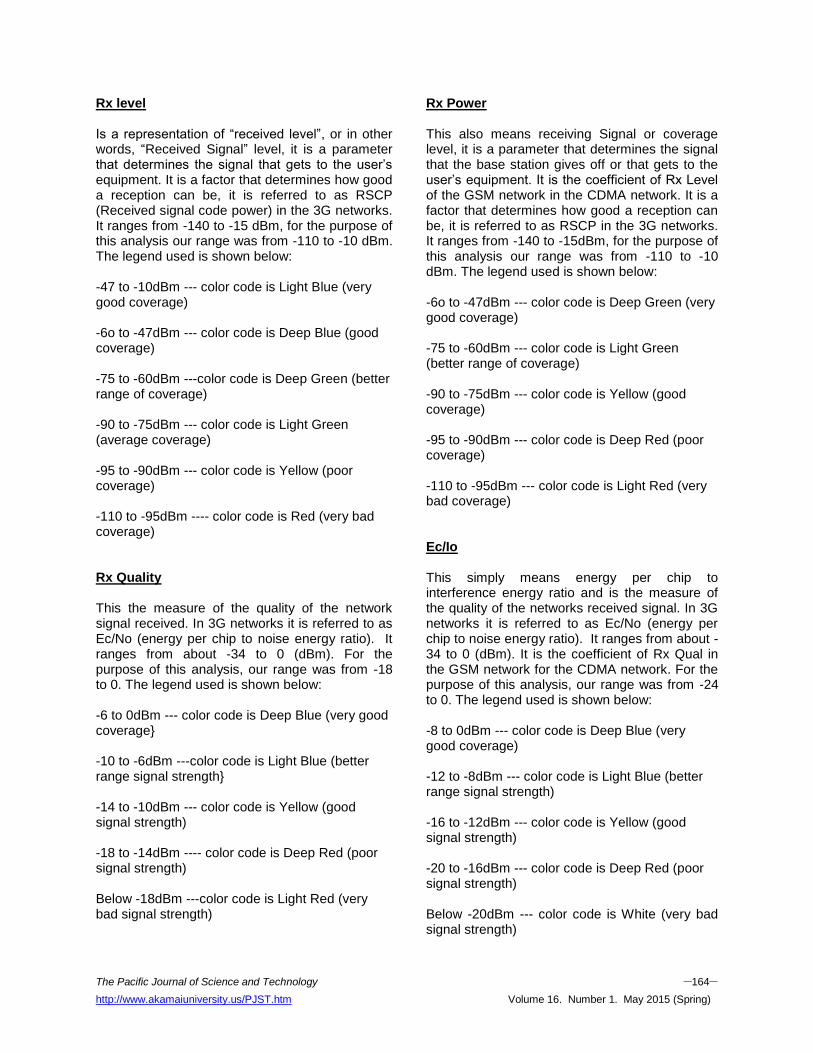
Figure 7: Screen Shot while DT Log File was being Played with TEM.
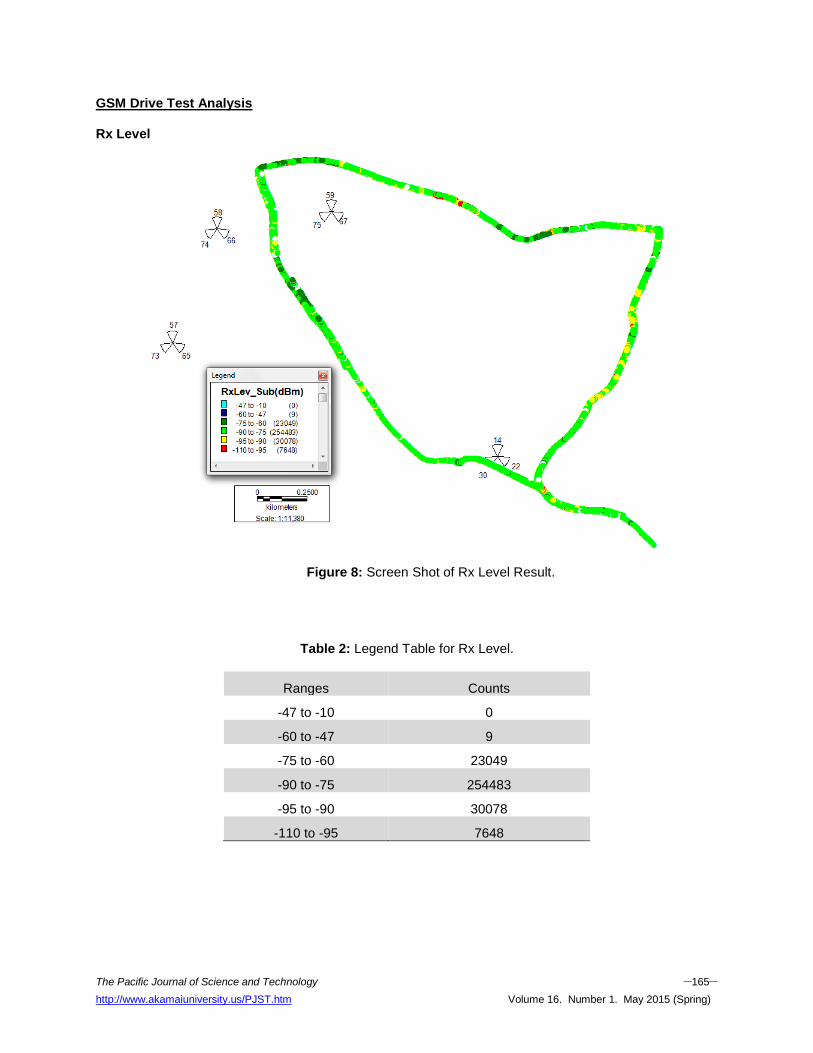
RESULTS AND ANALYSIS The results of the analysis of the log files were in two phases, first phase analyzed the GSM log files, and this helped to identify the signal strength of the network and also the transmitting power as well as the speech quality. The second phase analyzed the CDMA log files gotten from the DT which also helped to get the signal strength and also the quality. By doing that, we could then vividly relate the two networks based on the signal strength. Below is a thorough graphical
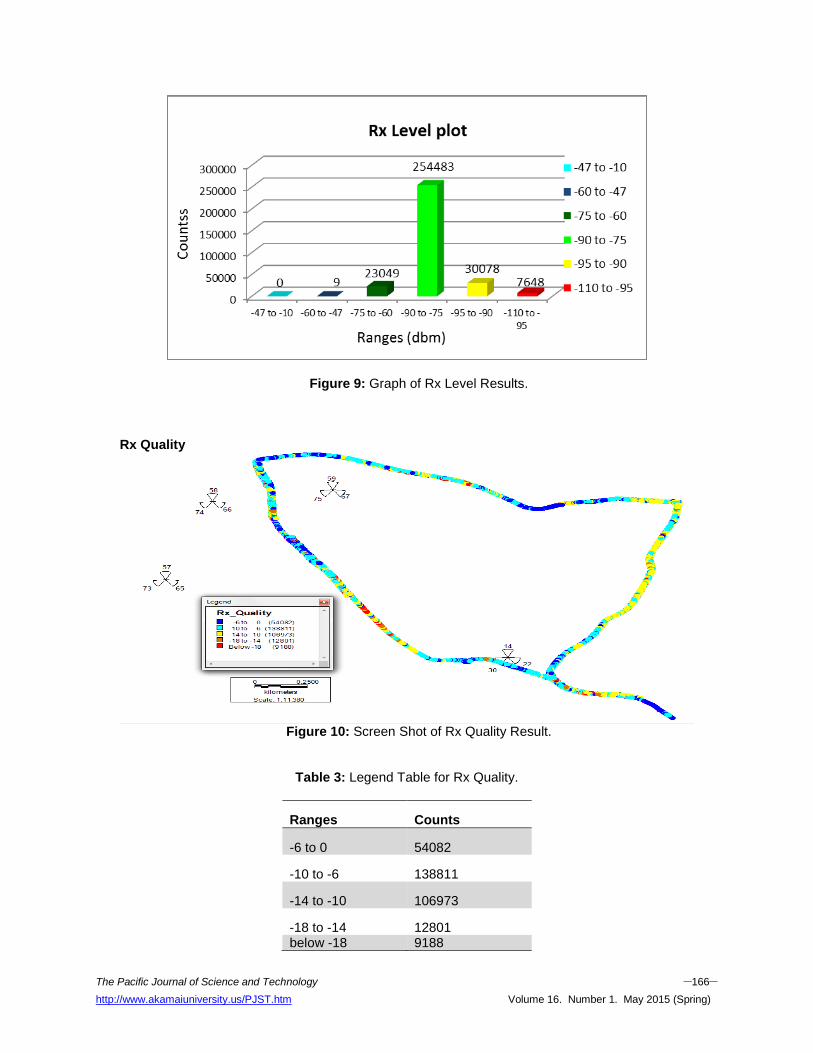
representation of the whole route driven during the DT, a handful of areas around Agbado were passed through like Alagbado, Oke-aro, and Isaga. KPI (Key Performance Indicator) Parameters The KPI that was analysed were the Rx level, Rx Quality, Rx Power, and Ec/Io. And their analyses were shown graphically in Figures 9, 11, 13, and 15.
The Pacific Journal of Science and Technology –164– http://www.akamaiuniversity.us/PJST.htm Volume 16. Number 1. May 2015 (Spring)
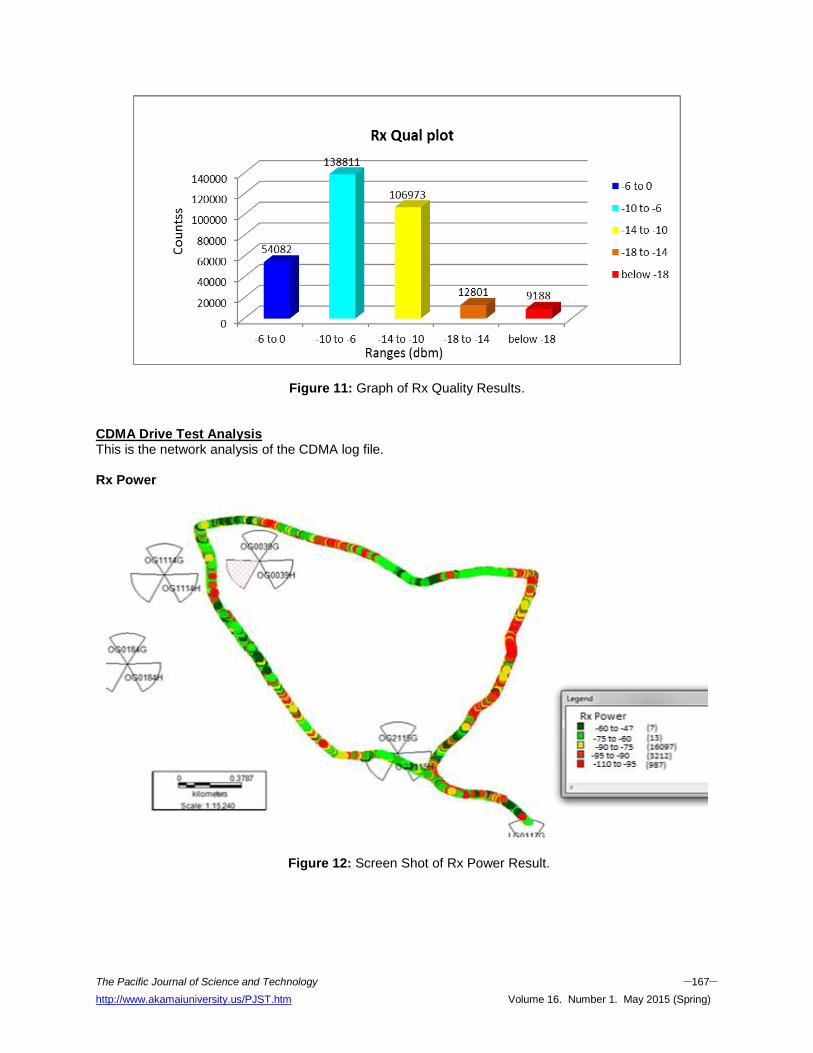
Rx level Is a representation of “received level”, or in other words, “Received Signal” level, it is a parameter that determines the signal that gets to the user’s equipment. It is a factor that determines how good a reception can be, it is referred to as RSCP (Received signal code power) in the 3G networks. It ranges from -140 to -15 dBm, for the purpose of this analysis our range was from -110 to -10 dBm. The legend used is shown below: -47 to -10dBm --- color code is Light Blue (very good coverage) -6o to -47dBm --- color code is Deep Blue (good coverage) -75 to -60dBm ---color code is Deep Green (better range of coverage) -90 to -75dBm --- color code is Light Green (average coverage) -95 to -90dBm --- color code is Yellow (poor coverage) -110 to -95dBm ---- color code is Red (very bad coverage) Rx Quality This the measure of the quality of the network signal received. In 3G networks it is referred to as Ec/No (energy per chip to noise energy ratio). It ranges from about -34 to 0 (dBm). For the purpose of this analysis, our range was from -18 to 0. The legend used is shown below: -6 to 0dBm --- color code is Deep Blue (very good coverage} -10 to -6dBm ---color code is Light Blue (better range signal strength} -14 to -10dBm --- color code is Yellow (good signal strength) -18 to -14dBm ---- color code is Deep Red (poor signal strength) Below -18dBm ---color code is Light Red (very bad signal strength)
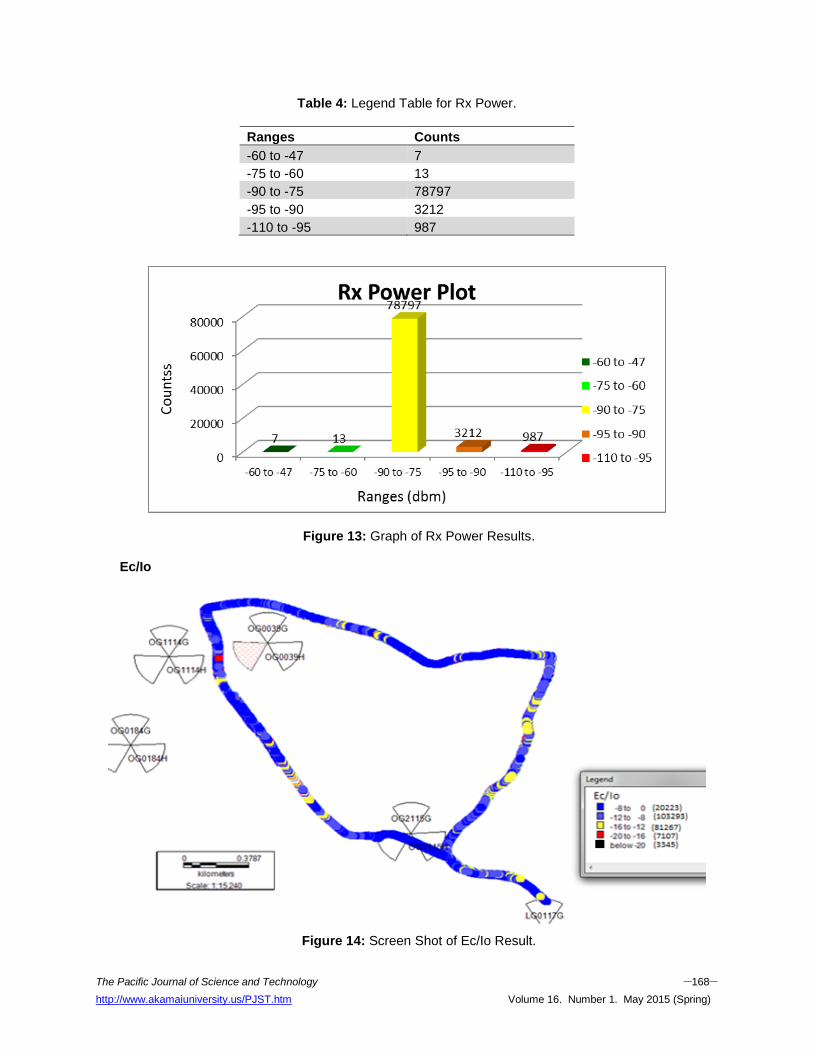
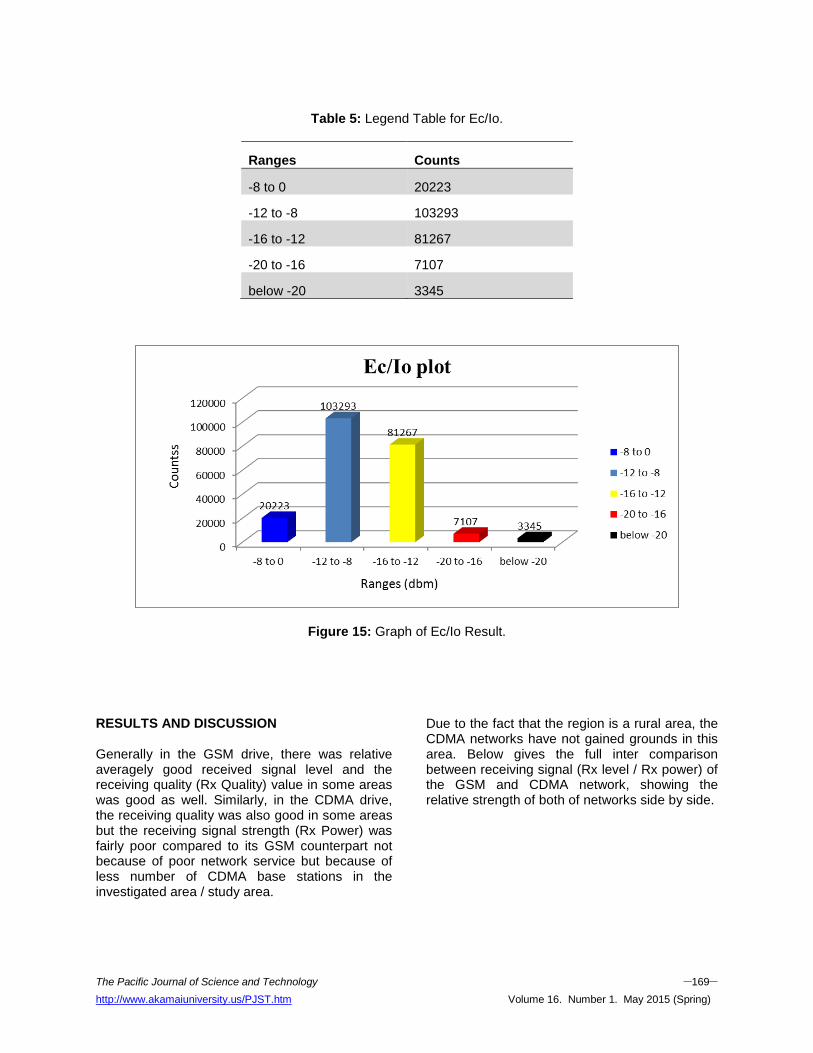
Rx Power This also means receiving Signal or coverage level, it is a parameter that determines the signal that the base station gives off or that gets to the user’s equipment. It is the coefficient of Rx Level of the GSM network in the CDMA network. It is a factor that determines how good a reception can be, it is referred to as RSCP in the 3G networks. It ranges from -140 to -15dBm, for the purpose of this analysis our range was from -110 to -10 dBm. The legend used is shown below: -6o to -47dBm --- color code is Deep Green (very good coverage) -75 to -60dBm --- color code is Light Green (better range of coverage) -90 to -75dBm --- color code is Yellow (good coverage) -95 to -90dBm --- color code is Deep Red (poor coverage) -110 to -95dBm --- color code is Light Red (very bad coverage) Ec/Io This simply means energy per chip to interference energy ratio and is the measure of the quality of the networks received signal. In 3G networks it is referred to as Ec/No (energy per chip to noise energy ratio). It ranges from about -34 to 0 (dBm). It is the coefficient of Rx Qual in the GSM network for the CDMA network. For the purpose of this analysis, our range was from -24 to 0. The legend used is shown below: -8 to 0dBm --- color code is Deep Blue (very good coverage) -12 to -8dBm --- color code is Light Blue (better range signal strength) -16 to -12dBm --- color code is Yellow (good signal strength) -20 to -16dBm --- color code is Deep Red (poor signal strength) Below -20dBm --- color code is White (very bad signal strength)
The Pacific Journal of Science and Technology –169– http://www.akamaiuniversity.us/PJST.htm Volume 16. Number 1. May 2015 (Spring)
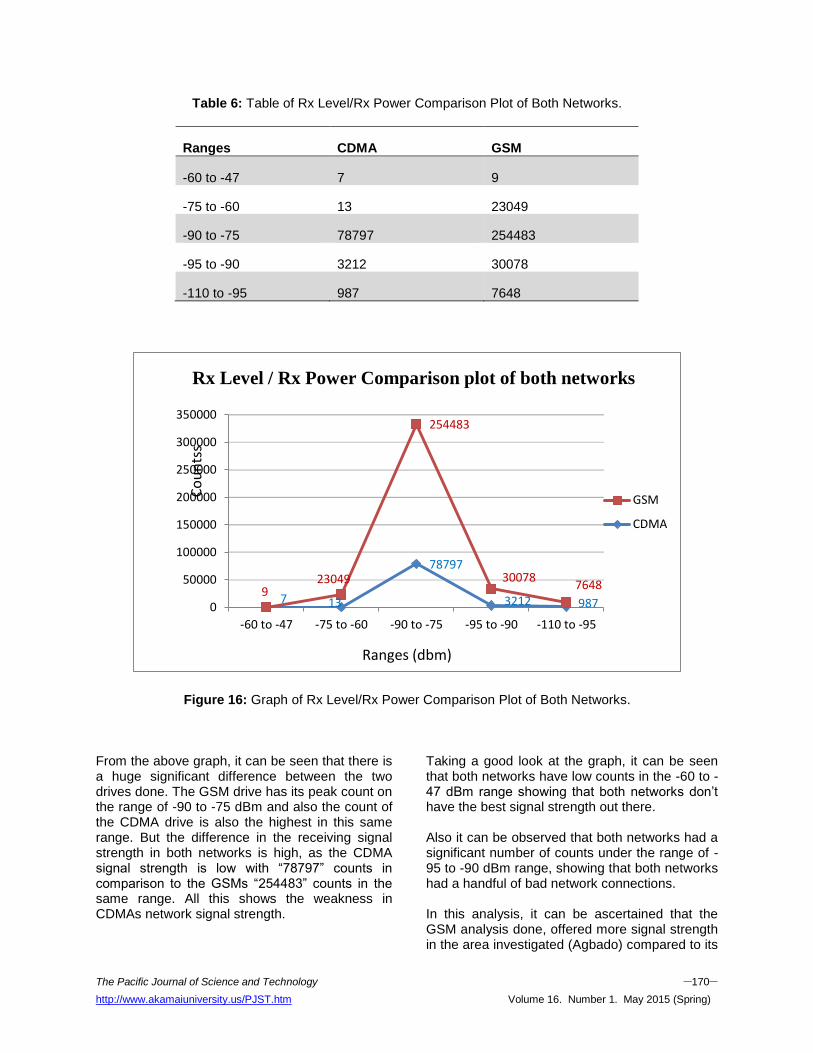
Table 5: Legend Table for Ec/Io.
Ranges Counts
-8 to 0 20223
-12 to -8 103293
-16 to -12 81267
-20 to -16 7107
below -20 3345
Figure 15: Graph of Ec/Io Result.
RESULTS AND DISCUSSION Generally in the GSM drive, there was relative averagely good received signal level and the receiving quality (Rx Quality) value in some areas was good as well. Similarly, in the CDMA drive, the receiving quality was also good in some areas but the receiving signal strength (Rx Power) was fairly poor compared to its GSM counterpart not because of poor network service but because of less number of CDMA base stations in the investigated area / study area.
Due to the fact that the region is a rural area, the CDMA networks have not gained grounds in this area. Below gives the full inter comparison between receiving signal (Rx level / Rx power) of the GSM and CDMA network, showing the relative strength of both of networks side by side.
The Pacific Journal of Science and Technology –170– http://www.akamaiuniversity.us/PJST.htm Volume 16. Number 1. May 2015 (Spring)
Table 6: Table of Rx Level/Rx Power Comparison Plot of Both Networks.
Ranges CDMA GSM
-60 to -47 7 9
-75 to -60 13 23049
-90 to -75 78797 254483
-95 to -90 3212 30078
-110 to -95 987 7648
7 13
78797
3212 9879
23049
254483
300787648
0
50000
100000
150000
200000
250000
300000
350000
-60 to -47 -75 to -60 -90 to -75 -95 to -90 -110 to -95
GSM
CDMA
Ranges (dbm)
Rx Level / Rx Power Comparison plot of both networks
Co
un
tss
Figure 16: Graph of Rx Level/Rx Power Comparison Plot of Both Networks.
From the above graph, it can be seen that there is a huge significant difference between the two drives done. The GSM drive has its peak count on the range of -90 to -75 dBm and also the count of the CDMA drive is also the highest in this same range. But the difference in the receiving signal strength in both networks is high, as the CDMA signal strength is low with “78797” counts in comparison to the GSMs “254483” counts in the same range. All this shows the weakness in CDMAs network signal strength.
Taking a good look at the graph, it can be seen that both networks have low counts in the -60 to -47 dBm range showing that both networks don’t have the best signal strength out there. Also it can be observed that both networks had a significant number of counts under the range of -95 to -90 dBm range, showing that both networks had a handful of bad network connections. In this analysis, it can be ascertained that the GSM analysis done, offered more signal strength in the area investigated (Agbado) compared to its
The Pacific Journal of Science and Technology –171– http://www.akamaiuniversity.us/PJST.htm Volume 16. Number 1. May 2015 (Spring)
CDMA counterpart which offered less signal strength in the same region of Lagos state. CONCLUSIONS Considering the results obtained from this research study, the following conclusions were made:
The receiving signal quality (Rx Quality) was averagely good in both the GSM and CDMA networks, showing that both networks have the capacity to produce good signal quality notwithstanding the area based.
Considering the fact that, GSM has more coverage area in this part of the world thereby having more users on its network, therefore more GSM base stations are present in the area of study boosting its signal strength higher than the CDMA signal strength just as seen in the results gotten, Although CDMA has more coverage area to one base station.
It can also be concluded that, in the area of study, the GSM network will sustain more calls until a “call drop”, due to its stronger signal strength in the region, unlike the CDMA, which can only maintain good signal quality during a call.
Also, due to the fact that the number of BTS (Base Transceiver Station) required for CDMA coverage in the same area is 80% less than that of GSM coverage, the real capacity of a CDMA base station would be much higher if employed in the region.
From this research, the conclusion is that when comparing CDMA and GSM as multiple access schemes, the signal strength and capacity is not the only issue. The main point is how to exploit the capacity potential and achieve the system features wanted. The overall picture is that a very careful system design in ideal conditions is necessary to utilize the full potential of CDMA as well as GSM systems.
REFERENCES
1. CDMA & GSM Cellular Technology: Wireless Communication Protocols and Standards.
Retrieved from the Internet at: www.protocols.com/pbook/cellular.htm
2. CDMA2000™. “Standardization”. Retrieved from the Internet at: http://www.ericsson.com/cdmasystems/3gcdma2000.shtml
3. Clarke, M. 2003. “Shaping the Industry through CDMA2000 Technology Leadership: Innovative Design and Development Approaches are Key Factors in How Operators Choose their Wireless Supply Partners – Advertorial”. Innovative Vendors are in Demand Telecom Asia 8-12.
4. International Engineering Consortium. 2005. “Time Division Multiple Access (TDMA)”. Retrieved from the Internet at: http://www.iec.org/online/tutorials/tdma/
5. Laurie, S. 1993. “GSM Expansion may Drive Cellular Subscriber Growth Worldwide Global System for Mobile Communications”. Mobile Phone News. 16-19
6. Alcatel. 2004. Introduction to the Alcatel GSM Network training manual. Alcatel University-BAS
90125 0216 VH ZZA Ed.01.
7. “GSM and CDMA Technology”. 2004. http://www.mivfone.com.au pg 1-3.
8. “3G Mobile Communication Network”. 2006. http//www.asadasif.com/es/files/3g pg2-8.
9. “Difference between GSM and CDMA”. 2004. http//www.4shared.com/account/home
The Pacific Journal of Science and Technology –172– http://www.akamaiuniversity.us/PJST.htm Volume 16. Number 1. May 2015 (Spring)
16. Hughes. J.C. 2012. “Difference Between GSM and CDMA”.
17. Leichstein, H.P. 2012. “Comparison of CDMA and GSM”.
18. Martınez-Olmos, P., J. José Murillo-Fuentes, and G. Esteve. 2011. “Analysing Signal Strength versus Quality Levels In Cellular Systems: A Case Study in GSM”. Vodafone Group Research & Development.
20. Shoewu, O. 2014. “Investigation of Call Quality in CDMA”.
21. “Momentum Building as 3GSM Matures” 2004. Retrieved from the Internet at: http://www.3g.co.uk/PR/June2004/7906.htm
22. Mosam, A. 2003. “Machine-to-Machine Communication over GSM Cellular Networks”. Retrieved from the Internet at: www.cas.mcmaster.ca/~wmfarmer/SE-4C03-03/projects/papers/mosam_m2m.pdf
23. Raciti, C.R. 1995. “Cellular Technology”. Retrieved from the Internet at: http://scis.nova.edu/~raciti/cellular.html
24. Tarlin, R.J. 1990. “Beyond Technology: Market Forces Drive GSM”. Global Mobile Communications Standard Telephony. 11:15-18
25. Whelan, C. 1998. “CDMA vs. GSM – Code Division Multiple Access Faces Competition from European Global Standard for Mobile Communications in Wireless Market”. Technology Information. Electronic News. 8:21-24
26. “Wireless Carriers in Americas already Receiving Benefits of GSM/GPRS Technology” 2003. Retrieved from the Internet at: http://www.portel.it/news/VPOnews.asp?id=382
27. “Wireless Technologies – Overview”. Retrieved from the Internet at: http://www.masterlinenet.com/pages/wireless_technologies01.html
28. Narisetti, M. 2006. “Implementation of Vertical Handoff Algorithm”.
29. Chem, L. 2013. “Performance Engineering of Mobile Broadband”. Capacity Analysis, Cellular Network, Optimization & Design of m-Building Solution.
30. Robert, A.K.L. 2006. “Subscriber Maximization in CDMA Networks”.