Page 1
ORIGINAL ARTICLE
European Journal of Biology and Biotechnology www.ejbio.org
DOI: http://dx.doi.org/10.24018/ejbio.2020.1.5.85 Vol 1 | Issue 5 | October 2020 1
I. INTRODUCTION
Burukutu, sometimes referred as BKT is a brown
coloured alcoholic beverage brewed traditionally by
Africans which has the flavour of vinegar [1]. The opaque
colour of burukutu is due to the presence of yeast materials
and suspended solid [2]-[3]. It is consumed by an estimated
population of 10 million people in West Africa especially in
Republic of Benin and Ghana. Both male and female of all
ages including children and pregnant women consume
burukutu [4]. In Nigeria, it is a choice drink for mainly
indigenes of northern guinea savannah. The alcoholic
content of burukutu ranges between 3-6% [2] [5]. Burukutu
is one of the African traditional beers popularly used in
serving guests during ceremonies and festivals. Due to low
alcoholic content, unhygienic brewing process, short shelf
Comparative Assessment of the Microbiological and
Physicochemical Quality of a Laboratory Brewed
‘Burukutu’ and Commercialized Products Sold in Some
Markets in Port Harcourt Nigeria
Francis Sopuruchukwu Ire, Precious Afoke Edio and Ndukwe Maduka
ABSTRACT
Burukutu is an indigenous, brown coloured, cloudy, alcoholic beverage
traditionally brewed using mainly sorghum grains. This study was aimed at the
comparison of microbial quality, physicochemical properties, proximate
composition and minerals content of laboratory brewed burukutu (LBB) and
commercial products sold in some markets in Port Harcourt. Sixteen (16)
samples of the commercialized product were evaluated from Elele (EM),
Rumuokoro (RM) and Choba (CM) markets, Port Harcourt, Rivers State
using Standard Methods while LBB was produced in our laboratory using
Standard Procedures. Our result indicated an increase in aerobic mesophiles,
total coliforms, faecal coliforms, fungi and lactic acid bacteria (LAB) counts
during the early stages of the brewing process of laboratory produced
burukutu but only LAB was detected in the final product. The overall
microbial count of burukutu from the three markets revealed that
CM>EM>RM although all the samples had higher microbial count compared
with the LBB. Staphylococcus aureus, Escherichia coli, Lactobacillus sp.,
Lactobacillus sp., Aspergillus sp. and Saccharomyces cerevisiae were present
during the brewing stages of burukutu. Enterobacter aerogenes and Mucor sp.
were detected in the commercial samples purchased from the three markets.
Lactobacillus fermentum and L. brevis had the highest and least frequency of
occurrence in all the samples, respectively. The pH, titratable acidity, alcohol
content and soluble solids of the fermenting LBB were within the range of 3.0-
3.4, 0.6-0.97%, 3.0-4.7% and 0.98-0.99%, whereas in the commercialized
samples, the equivalent values were 3.0-3.1, 0.00-0.10%, 2.1-4.0% and 0.65-
0.82%, respectively. Moisture, crude fat, ash, crude protein and carbohydrate
content of the commercialized samples were within the range of 29.1-31.2%,
10.8-14.2%, 3.8-4.85%, 2.9-5.7%, and 44.7-51.7% compared to the range of
values obtained in the LBB (52.1%, 15.7%, 9.8%, 7.6% and 15.4%),
respectively. The following minerals elements K, Ca, Na, Zn and Mg present in
the LBB were higher than the values obtained in the commercialized alcoholic
beverage. The results from this study, suggest that the quality of LBB is better
than the commercialized products. Therefore, it is recommended that in order
to improve the overall quality of commercially brewed burukutu for the
benefit of everyone irrespective of social status, good manufacturing practices
(GMP) and good hygienic practices (GHP) should be strictly adhered to by
local producers and vendors.
Keywords: Sorghum, Brewing, Burukutu, Microbiological,
Physicochemical, Food Quality and Safety.
Published Online: October 8, 2020
ISSN: 2684-5199
DOI :10.24018/ejbio.2020.1.5.85
F. S. Ire*
Department of Microbiology, Faculty of
Science, University of Port Harcourt,
Nigeria. (francis.ire uniport.edu.ng)
P. A. Edio
Department of Microbiology Technology,
Faculty of Science Laboratory Technology,
University of Port Harcourt, Nigeria.
N. Maduka
Department of Biological Science, College of Natural and Applied Sciences,
Wellspring University, Benin City, Edo
State, Nigeria. (maduka.ndukwe wellspringuni.edu.ng)
*Corresponding author
@
@
Page 2
ORIGINAL ARTICLE
European Journal of Biology and Biotechnology www.ejbio.org
DOI: http://dx.doi.org/10.24018/ejbio.2020.1.5.85 Vol 1 | Issue 5 | October 2020 2
life, inconsistent organoleptic properties and unsatisfactory
conservation, burukutu is far less attractive to lovers of
alcoholic beverages compared with Western beers. High
patronage of burukutu instead of Western beers especially
among impoverished individuals and low income earners is
because it is an affordable alcoholic beverage [1]. European
barley beers generally have less nutritional value compared
with sorghum beer as a result of high yeast content, Lactic
acid bacteria and other suspended materials. Brewing of
burukutu involves lactic acid fermentation unlike European
beer [6]. Lactic acid which is always present in burukutu
and pH of the product ranging between 3.3-3.5 is
responsible for its sour taste [7]-[8].
Traditionally, the preparation of burukutu mainly
involves the use of starchy grains of guinea corn (Sorghum
bicolor and Sorghum vulgare), millet and maize which
involves several stages [8]-[9]. Sorghum is a staple food for
the poor, providing protein and energy for millions of
people especially those living in the Southern Sahara [10].
Burukutu which is regarded as a cereal food drink is an
income earner for women that produce it at household level
[11]. It serves as a cheap meal for anyone any time of the
day [4]. One litre (1 L) of burukutu contains 5.9 and 26.7 g
of protein and starch, respectively. Burukutu contains
varying levels of iron, ascorbic acid, sodium, vitamins,
manganese, magnesium, calcium and phosphorus depending
on the raw materials used for its preparation [2], [12].
The stages involved in preparing burukutu are steeping,
germination, fermentation, and maturation. Oftentimes,
further enhancement of aromatic properties of burukutu is
achieved by adding garri during its production [13]. At the
fermentation stage, mainly bacteria, yeast and sometimes
mould is involved. Candida and Saccharomyces are the
predominant yeast while Lactic acid bacteria such as
Lactobacillus, and Leuconostoc are found in burukutu.
Bacteria associated with sorghum seeds and the finished
product (burukutu) are Lactobacillus cellobiosis, L.
fermentum, L. bulgaris, Leuconostoc meseteroides, and
acetic acid bacteria while the fungi involved are
Saccharomyces chavelieria, Candida krusei and C.
guilliermondii [14].
Burukutu is largely produced in households usually under
unhygienic conditions. Also, the use of contaminated water
and poor personal hygiene of the processors predisposes the
product to microbial contamination [10]. Most often,
burukutu is sold and consumed in a microbiologically active
state within a highly populated vicinity where its production
takes place [4]. Burukutu has a short shelf life ranging
between 1-8 days which could be attributed to low titratable
acidity, lactic acid and alcohol content, high concentration
of vitamins as well as the presence of lipoxidation products
[14]-[15]. However, spoilage of burukutu could be delayed
for almost two weeks if the product is pasteurized [3].
Extending the shelf life of European beer is achieved by
flash-pasteurization. Disappointingly, it promotes starch
gelatinization in sorghum beer which increases its viscosity,
cause the removal of amylolytic enzymes and active yeasts
resulting in poor effervescence [6].
In recent times, many researchers have assessed the
microbiological quality, mineral contents, physicochemical
properties and proximate composition of burukutu sold in
different towns and localities [3], [5], [14]-[15]. Currently,
there is limited studies which compared the quality of
burukutu sold in various locations and a similar product
brewed in the laboratory using standard procedures.
Consequently, this study is aimed at comparing the
microbiological quality, proximate composition, minerals
content and physicochemical properties of burukutu sold in
different locations in Port Harcourt with a similar product
brewed in a laboratory-controlled environment.
II. MATERIALS AND METHODS
A. Sample collection
A total of sixteen (16) samples of burukutu made from
sorghum were randomly purchased from three locations -
Elele, Rumuokoro and Choba markets in Port Harcourt,
Rivers State. From each of the markets, four (4) samples of
burukutu were randomly purchased from four (4) vendors
using sterile plastic bottles with a lid. All the samples were
kept in ice pack and transported immediately to the Food
and Industrial Microbiology Laboratory, University of Port
Harcourt for analysis within 12 h. Also taken to the
laboratory alongside the samples of burukutu were five
kilograms (5 Kg) of sorghum grains (Sorghum bicolor)
purchased from a trader in Alakahia market, Port Harcourt
using sterile plastic buckets with a lid and ten kilograms (10
Kg) of garri from another trader.
B. Isolation of Saccharomyces cerevisiae from
commercial burukutu
1. Serial dilution
A composite sample of the commercialized burukutu
were serially diluted by pipetting 1 ml of the stock sample
into 9 ml of normal saline using a sterile automatic pipette.
This process was repeated till 10-6 dilution was obtained
using sterile pipette for each transfer.
2. Isolation and identification of yeasts
The 10-3 and 10-4 dilutions of the composite sample of
commercialized burukutu was plated into Yeast extract
dextrose agar plates in duplicates using pour plate method.
The culture plates were incubated for 72 h at room
temperature (24-37 oC) after which the colonies observed
were subcultured repeatedly unto fresh plates to obtain pure
colonies. Macroscopic examination of the isolates was
determined in accordance with the methods described by
[16]-[18] while microscopical examination of the isolates
involved using the procedure adopted by [19]. Lactophenol
cotton blue staining of isolates involved placing a drop of
lactophenol cotton blue stain on a clean slide, and with the
aid of a mounting needle, a small portion of mycelial was
placed on the slide. A cover slip was gently placed on the
slide. The slide was observed under the light microscope
with x10 and x40 objective lenses. The yeast
(Saccharomyces cerevisiae) isolated from commercialized
burukutu was used for fermentation of the sorghum wort
during the process of preparing laboratory brewed burukutu.
Page 3
ORIGINAL ARTICLE
European Journal of Biology and Biotechnology www.ejbio.org
DOI: http://dx.doi.org/10.24018/ejbio.2020.1.5.85 Vol 1 | Issue 5 | October 2020 3
C. Laboratory-controlled brewing of burukutu
1. Malting
The procedure described by [7], [15] was adopted.
Sorghum grains were manually sorted to remove any foreign
materials, damaged and non-viable grains. Four
kilogrammes (4 Kg) of sorted sorghum grains (Sorghum
bicolor) were steeped overnight using tap water inside a
clean plastic container. The steeped grains were drained to
remove water using a sieve placed on a plastic container,
thereafter, the grains were spread on a clean flat surface for
malting process at room temperature (25-37 °C). The
steeped grains were sprayed with tap water thrice a day for 3
days to aid proper grain wetting and germination.
2. Drying
The malted grains were dried in hot air oven for 10 h to
halt germination.
3. Milling
The sundried malted sorghum grains were milled into
flour.
4. Mashing
Three kilograms (3 Kg) of the malted sorghum was
weighed and mixed with adjunct (garri) and warm water in
the ratio of 1:2:6, respectively. The mixture was stirred and
allowed to settle for 30 min. Afterward, 2 L of a clear
supernatant was decanted from the mixture, the remaining
mash was boiled for 1 h and allowed to cool for 40 min. The
supernatant was added to the cooled mash and allowed to
stand for 12 h. The mixture was filtered using a sieve; the
resulting wort was further boiled for 1 h and allowed to cool
(40-60 min.) before it was pitched with a pure culture of
Saccharomyces cerevisiae isolated from commercial
burukutu to initiate fermentation process for a period of
12 h.
5. Preparation of starter culture of yeast for pitching
A loopful of the yeast was taken and serial dilution of the
culture was carried out. One millilitre (1 ml) of the dilution
of Saccharomyces cerevisiae was taken using a sterile
automatic pipette and added to 10 ml of the prepared
sorghum wort followed by 3 teaspoons of glucose and left to
activate for 6 h.
6. Fermentation of sorghum wort
The method described by [7] with slight modification was
adopted. The activated yeast was used to inoculate the
sorghum wort. The setup was allowed to ferment for 48 h at
room temperature inside an improvised 5 L fermentation
bucket which has a plastic tap. Samples of the wort was
collected before boiling, after boiling, before fermentation
with the pure culture of yeast, first 24 h of fermentation and
final day of fermentation. A sample of the final product
(burukutu) was aseptically collected for further analyses.
D. Microbiological analyses
1. Homogenization and serial dilution
Ten grams (10 g) of burukutu was added to 90 ml sterile
Salt peptone solution (SPS) containing 0.1% peptone and
0.85% NaCl, with pH adjusted to 7.2 and homogenized for
30 s. This was followed by a ten-fold serial dilution using
the homogenate (1:10). Aliquots (1 ml) of dilution10-3 and
10-4 were directly inoculated into Petri dishes containing
appropriate isolation media. All analyses were done in
duplicate. This procedure was used for analyzing both the
laboratory brewed and the commercialized burukutu from
the three markets. Other samples analysed include the
ground sorghum grain before mashing, after mashing, the
supernatant of the mash, the boiled wort, the fermenting
wort at intervals of 12 h for the 2 days’ fermentation period.
2. Enumeration and confirmation of total coliforms
Total coliforms were enumerated by the pour plate
method using MacConkey agar and incubated at 37 °C for
24 h. Discrete colonies were subcultured after 24 h on
Nutrient agar. Identification of the isolates were confirmed
based on colony morphology, Gram staining and
biochemical reactions using the [20] as a guide.
3. Enumeration of aerobic mesophiles
Aerobic mesophiles were enumerated by the pour plate
method using Plate count agar. The culture plates were
incubated at 30 °C for 24 h. The colonies were subcultured
on Nutrient agar for 24 h at 30 °C. The isolates were
subjected to Gram staining and biochemical tests.
4. Enumeration and confirmation of Escherichia coli
Escherichia coli were enumerated by the pour plate
method using Eosin methylene blue agar and incubated at
44 °C for 24 h. The colonies were confirmed based on
morphological features and biochemical tests [21].
5. Enumeration of yeasts and moulds
Yeasts and moulds were enumerated by the pour plate
method using Potato dextrose agar and incubated at 25 °C
for 3 days. The colonies were enumerated and subcultured
into freshly prepared PDA plates. The identification of the
yeast isolates from burukutu was based on microscopic and
macroscopic observations. Also, lactophenol cotton blue
staining of the isolates were carried out.
6. Enumeration and isolation of lactic acid bacteria
Lactic acid bacteria were enumerated by pour plate
method using de Man, Rogosa and Sharpe (MRS, Oxoid
CM361) agar. The plates were incubated in an anaerobic jar
at 30 °C for 24 h. Aliquot portion of lactic acid bacteria
colonies from the MRS culture plate was picked using a
sterile wire loop and subcultured repeatedly on freshly
prepared MRS plates until pure colonies were obtained [22].
7. Gram reaction
Gram reaction was performed on the bacterial isolates. A
smear of each isolate was prepared on a grease-free slide,
then flooded with the primary stain, crystal violet for 60 s.
Afterward, the slide was rinsed off under running water,
then flooded with the mordant (Lugol's Iodine) for 60 s. and
rinsed. Thereafter, it was decolourized with ethanol, for 30
s., and rinsed. Then, the slides were flooded with the
secondary stain, Safranin for 30 s. For drying of the slides,
they were kept in a slanting position. The slides were
viewed under the oil immersion objective lens of the
microscope.
8. Catalase reaction
A drop of 3% freshly prepared hydrogen peroxide was
placed on a clean glass slide and aliquot portion of the pure
culture was picked and emulsified using a sterilized wire
loop. The appearance of bubbles or effervescence resulting
from the liberation of free oxygen as gas bubbles indicate
the presence of catalase in the culture. Lack of bubbles
indicates a negative reaction.
Page 4
ORIGINAL ARTICLE
European Journal of Biology and Biotechnology www.ejbio.org
DOI: http://dx.doi.org/10.24018/ejbio.2020.1.5.85 Vol 1 | Issue 5 | October 2020 4
9. Oxidase test
Oxidase test of the isolates were carried out using
Identification Sticks (Oxoid Ltd., Basingstoke, Hampshire,
UK).
10. Microscopic examination
Cell shape and arrangements were determined using the
Phase contrast microscope and the wet mount technique. A
drop of sterile distilled water was placed on a clean slide
followed by aliquot pure culture, and emulsified. A
coverslip was gently placed on top of the solution on the
slide and examined under the microscope using the x40
magnification and oil immersion using the x100 objective
lens.
11. Growth at different temperatures
Two tubes containing MRS broth (Oxoid CM359) were
inoculated with pure colonies of the test organism and
incubated at 15 °C and 45 °C, respectively for 72-96 h.
Growth in the tubes were determined by visual turbidity
after the incubation period. This procedure was repeated for
all the isolates.
12. Fermentation of glucose
The ability of the isolates to ferment and produce gas
from glucose was determined using MRS sugar basal
medium. The medium was composed of peptone 10 g, yeast
extract 5 g, 80 1ml, dipotassium hydrogen phosphate 2 g,
sodium acetate 5 g, tri-ammonium citrate 2 g, MgSO4.7H2O
0.2 g, MnSO4. 4H2O 0.05 g, 1 litre distilled water, pH 6.5,
thus without glucose and meat extract. The basal medium
was dispensed in 5 ml aliquot into test-tubes containing
inverted Durham tubes and sterilized by autoclaving at
121 °C for 15 min. The glucose was prepared as 10%
solution and sterilized by filtration, then it was added
aseptically to the basal medium to achieve a final
concentration of 2%. The inoculated tubes were examined
for the production of gas after incubation at 30 °C for 72 h.
13. Salt tolerance test
Salt tolerance test was done using MRS broth (Oxoid
CM359) containing 6.5% and 18% (w/v) NaCl with
incubation period of 4 days at 30 °C. The tubes were then
observed for growth of the inoculums.
14. Growth at different pH (4.4 and 9.6)
Growth of the isolates in MRS broth (Oxoid CM359)
with pH adjusted to 4.4 and 9.6 using concentrated HCl and
0.1 M NaOH, respectively was determined by visual
turbidity after 72-96 h of incubation at 30 °C.
15. Identification of lactic acid bacteria (LAB)
The LAB isolates were identified based on their
morphological and microscopic observations as well as
biochemical reactions. The ability of the isolates to grow at
different temperatures and pH, ferment supplied sugars as
described by [20] were also determined.
E. Physicochemical analyses
1. Determination of pH
The solid samples and distilled water were weighed in a
ratio of 1:1, homogenized in a stomacher bag and the pH
determined with a pH meter (Radiometer PHM 92;
Radiometer Analytical A/S, Bagsvaerd, Denmark) after
calibration using standard buffers. The pH of liquid samples
was determined directly.
2. Determination of titratable acidity
For each sample of burukutu, 10 ml of sample was made
up to 200 ml with distilled water and 80 ml titrated against
0.1M NaOH using 1% freshly prepared phenolphthalein as
indicator. One millilitre of 0.1N NaOH was taken as
equivalent to 0.009 g lactic acid.
3. Determination of alcohol content
The percentage of alcohol content of the fermenting
burukutu was determined using [23]. One hundred millilitre
(100 ml) of each sample was diluted with 50 ml of distilled
water. The mixture was then distilled with about 100 ml of
the distillate collected. The specific gravity of the distillate
was determined by a ratio of the weight of 25 ml of the
distillate by the weight of equal volume of water using the
25 ml specific gravity bottle at 20 °C. The value obtained
was then referred to [23] to determine the percentage
alcohol.
4. Determination of soluble solids
Soluble solids were determined by placing a drop of the
sample on the lens of a hand held refractometer and the
reading taken through the eye piece as Brix.
F. Proximate analysis of burukutu samples
The moisture, ash, crude protein, and crude fat content of
samples of the burukutu were determined using the standard
method of [24]. The analyses were conducted in triplicate
and all reagents were of analytical grade.
1. Moisture
Empty moisture dishes were weighed using an electronic
balance. About 2 ml of each sample were poured into the
moisture dishes and also weighed. The sample was placed in
a hot air oven at a temperature of 105 °C. After 90 min., the
dishes inside the oven were removed, allowed to cool inside
a dessicator and then reweighed. The percentage of moisture
content was calculated using the mathematical formulae
below:
% moisture = c−a
b−a x 100
where:
a = empty moisture dish;
b = weight of dish + sample before evaporation;
c = weight of dish + sample after evaporation.
2. Ash
A modified [24] method was used to determine the ash
content of the samples. The weights of empty crucibles were
measured using an electronic balance. Each sample was
poured into it a crucible and the weight taken. The crucibles
containing the samples were put in furnace at a temperature
of 600 °C. After 75 min. the ashes of the samples in the
crucibles were removed from the furnace, kept in the
desiccator for 10-15 min. to cool and reweighed. Ash
content of the sample was calculated using the formula
below.
% ash = c−a
b−a x 100
where:
a = empty crucible
Page 5
ORIGINAL ARTICLE
European Journal of Biology and Biotechnology www.ejbio.org
DOI: http://dx.doi.org/10.24018/ejbio.2020.1.5.85 Vol 1 | Issue 5 | October 2020 5
b = weight of crucible + sample before combustion;
c = weight of crucible + sample after combustion.
3. Crude fat
Burukutu samples were poured into moisture dishes and
placed in a hot air oven at 105 °C for 75 min. for
evaporation to occur. Empty thimble was weighed (a) and 5
ml of the dried samples were measured and weighed (b). A
piece of cotton wool was used to cover the mouth of the
thimble to prevent spillage, and then also weighed (c). The
samples were put in the fat extraction chamber containing
ethanol as a solvent, allowed to boil for 30 min. to extract
oil from the sample. Afterward, the thimbles were removed
from the fat extractor and placed in a desiccator to dry, then
weighed (d). The percentage of fat was calculated using the
formula below.
Crude fat (%) = c−d
b−a x 100
where:
a = weight of empty thimble;
b = weight of Sample and thimble;
c = weight of sample, cotton wool, and thimble;
d = dried sample in the thimble with the cotton.
4. Crude protein
The method described by [23] was adopted. Ten
millilitres (10 ml) of the sample was added to 0.05 ml of
0.5% phenolphthalein indicator. Then, it was mixed and
allowed to stand for about 5 minutes and neutralized with
0.1 M NaOH to the standard pink colour. Two millilitres
(2 ml) of formalin was then added, mixed and allowed to
stand for about five minutes. The new achieved acidity was
titrated with 0.1 M NaOH until the same pink colour was
obtained. Then, 2 ml of the formalin and 10 ml of H2O were
titrated separately with 0.1 M NaOH as blank.
5. Carbohydrate
The carbohydrate content of the samples was determined
by the difference method by subtracting the crude protein,
crude fat, moisture and ash contents from 100.
Carbohydrate = 100 - (crude protein + crude fat + moisture
+ ash)
G. Analysis of minerals in burukutu samples
Five grams (5 g) of the sample was weighed into a
conical flask containing 5 ml of concentrated H2SO4
(tetraoxosulphate VI), 10 ml of trioxonitrate (V) acid and 10
ml of HCl (hydrochloric acid) and boiled on a hot plate until
the solution was clear. The digest was allowed to cool, then
filtered into a standard flask and made up to the mark with
distilled water. Minerals such as potassium, calcium and
sodium were determined using flame photometer. Other
minerals such as iron, zinc, phosphorus and magnesium
were determined using atomic absorption spectrophotometer
(ASS-BUCK 210 VGP model).
H. Statistical analysis
Variance analysis (ANOVA) and Tukey (at 5%
probability) statistical tool was employed to analyse the data
(triplicate) using the IBM SPPS package version 22
Computer program. Data were presented as the means
±standard errors of the means (SEM) of at least three
independent experiments except otherwise stated.
III. RESULTS
The mean microbial count of the laboratory brewed
burukutu monitored at the early stages of the brewing
process and the final product (burukutu) are presented in
Table 1. The result obtained shows that mashed sorghum
grains before boiling (BB) were 6.62 Log10CFU/ml for
aerobic mesophiles, 5.73 Log10CFU/g for total coliforms,
5.23 Log10CFU/ml for faecal coliform, 3.36 Log10CFU/ml
for fungi and 1.376 Log10CFU/ml for Lactic acid bacteria
(LAB). The supernatant (SU) and sediment (SE) samples
recorded a further increase in the mean microbial numbers
(CFU/ml) which were 8.88 and 9.7 Log10CFU/ml for
aerobic mesophiles; 7.50 and 7.8 Log10CFU/ml for total
coliform count; 7.52 and 7.52 Log10CFU/ml for faecal
count; 6.9 and 6.34 Log10CFU/ml for total fungal count;
9.11 and 8.34 Log10CFU/ml for lactic acid bacteria,
respectively. However, there was no culturable
microorganism in the boiled (BB) wort. Similarly, aerobic
mesophiles, total coliforms, faecal coliforms and fungi were
not detected during the period of fermentation of burukutu.
On the contrary, there was a slight increase in LAB count
from 3.61-3.7 Log10CFU/ml in the laboratory brewed
burukutu within 48 h fermentation period. All the
microbiological parameters monitored during the early
stages of the brewing process and period of fermentation of
burukutu brewed in the laboratory were significantly
different (p<0.05) except faecal coliform count of the
supernatant and sediment.
TABLE 1: MICROBIAL COUNT (LOG10CFU/ML) OF LABORATORY-BREWED
BURUKUTU MONITORED AT DIFFERENT STAGES OF PREPARATION AND
FERMENTATION OF THE FINAL PRODUCT
Sample AMC TCC FC TFC LAB
BB 6.62 5.73 5.23 3.36 1.37 SU 8.8 7.5 7.52 6.9 9.11
SE 9.7 7.8 7.52 6.34 8.34
BW 0 0 0 0 0 F-24 h 0 0 0 0 3.61
F-48 h 0 0 0 0 3.7
Key: AMC- Aerobic mesophiles; TCC- Total coliform count; FC-
Faecal coliform; TFC-Total fungal count; LAB-Lactic acid bacteria. BB-
Sorghum mash before boiling, SU-Supernatant before boiling; SE-
Sediment before boiling; BW- boiled wort, F-fermentation time.
The mean microbial count of burukutu sampled from
Elele, Rumuokoro and Choba markets and laboratory
brewed burukutu are presented in Fig. 1. The total bacterial
count (TBC), total fungal count (TFC), total coliform count
(TCC), faecal count (FC) and lactic acid bacteria count
(LCC) of commercialized burukutu obtained from
Rumuokoro markets were 6.99, 6.92, 7.96, 7.08 and 7.11
Log10CFU/ml, respectively. As for the samples obtained
from Elele market, the TBC, TFC, TCC, FC and LBCC
were 7.01, 7.96, 7.0, 7.08 and 7.14 Log10CFU/ml,
respectively. The TBC, TFC, TCC, FC and LBCC of
burukutu samples from Choba market were 7.95, 7.9, 7.94,
7.04 and 7.13 Log10CFU/ml, respectively. The LAB count
in the laboratory brewed burukutu was 3.66 Log10CFU/ml.
Page 6
ORIGINAL ARTICLE
European Journal of Biology and Biotechnology www.ejbio.org
DOI: http://dx.doi.org/10.24018/ejbio.2020.1.5.85 Vol 1 | Issue 5 | October 2020 6
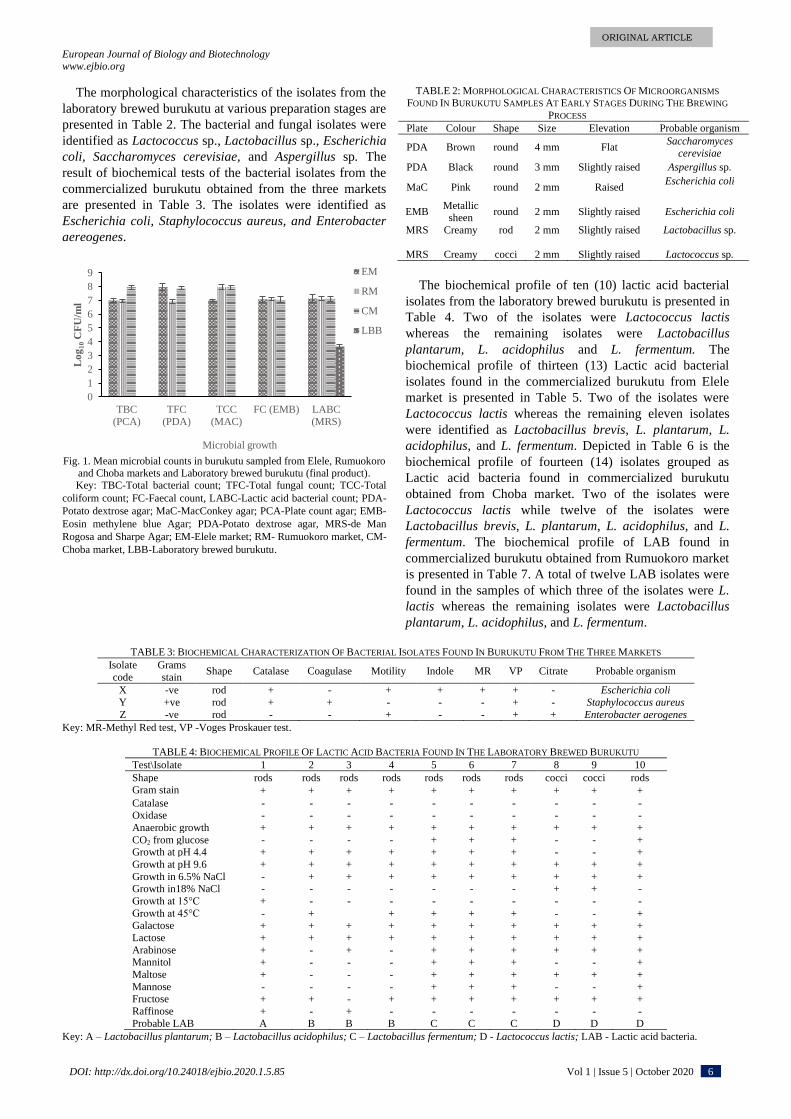
The morphological characteristics of the isolates from the
laboratory brewed burukutu at various preparation stages are
presented in Table 2. The bacterial and fungal isolates were
identified as Lactococcus sp., Lactobacillus sp., Escherichia
coli, Saccharomyces cerevisiae, and Aspergillus sp. The
result of biochemical tests of the bacterial isolates from the
commercialized burukutu obtained from the three markets
are presented in Table 3. The isolates were identified as
Escherichia coli, Staphylococcus aureus, and Enterobacter
aereogenes.
Fig. 1. Mean microbial counts in burukutu sampled from Elele, Rumuokoro
and Choba markets and Laboratory brewed burukutu (final product). Key: TBC-Total bacterial count; TFC-Total fungal count; TCC-Total
coliform count; FC-Faecal count, LABC-Lactic acid bacterial count; PDA-
Potato dextrose agar; MaC-MacConkey agar; PCA-Plate count agar; EMB-
Eosin methylene blue Agar; PDA-Potato dextrose agar, MRS-de Man
Rogosa and Sharpe Agar; EM-Elele market; RM- Rumuokoro market, CM-
Choba market, LBB-Laboratory brewed burukutu.
TABLE 2: MORPHOLOGICAL CHARACTERISTICS OF MICROORGANISMS
FOUND IN BURUKUTU SAMPLES AT EARLY STAGES DURING THE BREWING
PROCESS
Plate Colour Shape Size Elevation Probable organism
PDA Brown round 4 mm Flat Saccharomyces
cerevisiae
PDA Black round 3 mm Slightly raised Aspergillus sp.
MaC Pink round 2 mm Raised Escherichia coli
EMB Metallic
sheen round 2 mm Slightly raised Escherichia coli
MRS
MRS
Creamy
Creamy
rod
cocci
2 mm
2 mm
Slightly raised
Slightly raised
Lactobacillus sp.
Lactococcus sp.
The biochemical profile of ten (10) lactic acid bacterial
isolates from the laboratory brewed burukutu is presented in
Table 4. Two of the isolates were Lactococcus lactis
whereas the remaining isolates were Lactobacillus
plantarum, L. acidophilus and L. fermentum. The
biochemical profile of thirteen (13) Lactic acid bacterial
isolates found in the commercialized burukutu from Elele
market is presented in Table 5. Two of the isolates were
Lactococcus lactis whereas the remaining eleven isolates
were identified as Lactobacillus brevis, L. plantarum, L.
acidophilus, and L. fermentum. Depicted in Table 6 is the
biochemical profile of fourteen (14) isolates grouped as
Lactic acid bacteria found in commercialized burukutu
obtained from Choba market. Two of the isolates were
Lactococcus lactis while twelve of the isolates were
Lactobacillus brevis, L. plantarum, L. acidophilus, and L.
fermentum. The biochemical profile of LAB found in
commercialized burukutu obtained from Rumuokoro market
is presented in Table 7. A total of twelve LAB isolates were
found in the samples of which three of the isolates were L.
lactis whereas the remaining isolates were Lactobacillus
plantarum, L. acidophilus, and L. fermentum.
TABLE 3: BIOCHEMICAL CHARACTERIZATION OF BACTERIAL ISOLATES FOUND IN BURUKUTU FROM THE THREE MARKETS
Isolate
code
Grams
stain Shape Catalase Coagulase Motility Indole MR VP Citrate Probable organism
X -ve rod + - + + + + - Escherichia coli
Y +ve rod + + - - - + - Staphylococcus aureus
Z -ve rod - - + - - + + Enterobacter aerogenes
Key: MR-Methyl Red test, VP -Voges Proskauer test.
TABLE 4: BIOCHEMICAL PROFILE OF LACTIC ACID BACTERIA FOUND IN THE LABORATORY BREWED BURUKUTU
Test\Isolate 1 2 3 4 5 6 7 8 9 10
Shape rods rods rods rods rods rods rods cocci cocci rods Gram stain + + + + + + + + + +
Catalase - - - - - - - - - - Oxidase - - - - - - - - - -
Anaerobic growth + + + + + + + + + +
CO2 from glucose - - - - + + + - - + Growth at pH 4.4 + + + + + + + - - +
Growth at pH 9.6 + + + + + + + + + +
Growth in 6.5% NaCl - + + + + + + + + + Growth in18% NaCl - - - - - - - + + -
Growth at 15°C + - - - - - - - - -
Growth at 45°C Galactose
Lactose
Arabinose Mannitol
Maltose
Mannose Fructose
Raffinose
Probable LAB
- +
+
+ +
+
- +
+ A
+ +
+
- -
-
- +
- B
+
+
+ -
-
- -
+ B
+ +
+
- -
-
- +
- B
+ +
+
+ +
+
+ +
- C
+ +
+
+ +
+
+ +
- C
+ +
+
+ +
+
+ +
- C
- +
+
+ -
+
- +
- D
- +
+
+ -
+
- +
- D
+ +
+
+ +
+
+ +
- D
Key: A – Lactobacillus plantarum; B – Lactobacillus acidophilus; C – Lactobacillus fermentum; D - Lactococcus lactis; LAB - Lactic acid bacteria.
0
1
2
3
4
5
6
7
8
9
TBC
(PCA)
TFC
(PDA)
TCC
(MAC)
FC (EMB) LABC
(MRS)
Lo
g1
0C
FU
/ml
Microbial growth
EM
RM
CM
LBB
Page 7
ORIGINAL ARTICLE
European Journal of Biology and Biotechnology www.ejbio.org
DOI: http://dx.doi.org/10.24018/ejbio.2020.1.5.85 Vol 1 | Issue 5 | October 2020 7
TABLE 5: BIOCHEMICAL PROFILE OF LACTIC ACID BACTERIA FOUND IN BURUKUTU OBTAINED FROM ELELE MARKET
Test\ Isolate 1 2 3 4 5 6 7 8 9 10 11 12 13
Shape of isolate rods rods rods rods rods rods rods rods rods rods cocci cocci rods
Tetrad formulation - - - - - - - - - - - - -
Gram stain + + + + + + + + + + + + + Catalase - - - - - - - - - - - - -
Oxidase - - - - - - - - - - - - -
Anaerobic growth + + + + + + + + + + + + +
CO2 from glucose + - - - - + - + + + - - +
Nutrient broth, pH 4.4 + + + + + + + + + + - - + Nutrient broth, pH 9.6 + + + + + + + + + + + + +
Growth in 6.5% NaCl + - + - + + + + + + + + +
Growth in 18% NaCl - - - - - - - - - - + + -
Growth at 15°C + + - + - - - - - - - - - Growth at 45°C - - + - + + + + + + - - +
Probable LAB E F G F G H G H H H I I H
Key: E - Lactobacillus brevis; F - Lactobacillus plantarum; G - Lactobacillus acidophilus; H - Lactobacillus fermentum; I - Lactococcus lactis; LAB -
Lactic acid bacteria.
TABLE 6: BIOCHEMICAL PROFILE OF LACTIC ACID BACTERIA FOUND IN BURUKUTU OBTAINED FROM CHOBA MARKET
Test\Isolate 1 2 3 4 5 6 7 8 9 10 11 12 13 14
Shape cocci cocci rods rods rods rods rods rods rods rods rods cocci cocci rods Gram stain + + + + + + + + + + + + + +
Catalase - - - - - - - - - - - - - -
Oxidase - - - - - - - - - - - - - - Anaerobic growth + + + + + + + + + + + + + +
Glucose - - - - - - + - + + + - - +
Growth pH 4.4 - - + + + + + + + + + - - +
Nutrient broth, pH 9.6 + + + + + + + + + + + + + +
Growth in 6.5% NaCl + + - + - + + + + + + + + +
Growth in 18% NaCl + + - - - - - - - - - + + -
Growth at 15°C - - + - + - - - - - - - - -
Gowth at 45°C Galactos
Lactose
Arabinos Mannitol
Maltose
Mannose
Fructose
Raffinos
Probable LAB
- +
+
+ +
+
-
+
+
E
- +
+
+ +
+
-
+
+
F
- +
+
- -
-
-
+
+
G
+ +
+
+ +
+
-
+
+
F
- +
+
- -
-
-
+
-
G
+ +
+
+ +
+
+
+
-
H
+ +
+
- -
-
-
+
-
G
+ +
+
+ +
+
+
+
-
H
+ +
+
+ +
+
+
+
-
H
+ +
+
+ +
+
+
+
-
H
+ +
+
+ -
+
-
+
-
I
- +
+
+ -
+
-
+
-
I
- +
+
+ +
+
+
+
-
H
+ +
+
+ +
+
-
+
+
E
Key: E - Lactobacillus brevis; F - Lactobacillus plantarum; G - Lactobacillus acidophilus; H - Lactobacillus fermentum; I - Lactococcus lactis; LAB - Lactic acid bacteria.
TABLE 7: BIOCHEMICAL PROFILE OF LACTIC ACID BACTERIA FOUND IN BURUKUTU OBTAINED FROM RUMUOKORO MARKET
Test\ Isolate 1 2 3 4 5 6 7 8 9 10 11 12
Shape cocci cocci rods rods rods rods rods rods rods rods rods cocci
Gram stain + + + + + + + + + + + +
Catalase - - - - - - - - - - - - Oxidase - - - - - - - - - - - -
Anaerobic growth + + + + + + + + + + + + CO2 from glucose - - - - - - + - + + + -
Growth pH 4.4 - - + + + + + + + + + -
Growth pH 9.6 + + + + + + + + + + + + Growth 6.5 NaCl + + - + - + + + + + + +
Growth in 18% NaCl + + - - - - - - - - - +
Growth at 15 °C - - + - + - - - - - - -
Growth at 45°C - - - + - + + + + + + -
Probable LAB I I F G F G H G H H H I
Key: E - Lactobacillus brevis; F -Lactobacillus plantarum; G - Lactobacillus acidophilus; H - Lactobacillus fermentum; I - Lactococcus lactis; LAB - Lactic acid bacteria.
Presented in Fig. 2 is the percentage frequency of
occurrence of lactic acid bacteria (LAB) isolated from
commercialized burukutu obtained from the three markets
and the laboratory brewed burukutu. The LAB in
commercialized burukutu obtained from Elele market which
had the highest and least frequency of occurrence was
Lactobacillus fermentum (38.46%) and L. brevis (7.69%),
respectively. The percentage frequency of occurrence of
LAB found in commercialized burukutu obtained from
Rumuokoro market shows that Lactobacillus fermentum
(33.33%) and L. plantarum (16.67%) were the highest and
least occurring specie of LAB, respectively. As for the
commercialized burukutu obtained from Choba market, the
LAB isolate which had the highest and least percentage
frequency of occurrence is Lactobacillus fermentum
(35.71%) and 14.29% each for Lactobacillus brevis and L.
plantarum, respectively. Lactococcus lactis (20%),
Lactobacillus plantarum (10%), L. fermentum (40%) and L.
acidophilus (30%) were the LAB isolates obtained from the
Page 8
ORIGINAL ARTICLE
European Journal of Biology and Biotechnology
www.ejbio.org
DOI: http://dx.doi.org/10.24018/ejbio.2020.1.5.85 Vol 1 | Issue 5 | October 2020 8
laboratory brewed burukutu and their respective percentage
frequency of occurrence.
Fig. 2. Frequency of occurrence of lactic acid bacteria isolated from
burukutu obtained from the three markets and the laboratory brewed
burukutu (LBB).
Presented in Table 8 is the microscopic and macroscopic
characteristics of yeast and moulds isolated from the
laboratory brewed burukutu as well as a similar product
obtained from the three markets. The result obtained showed
that Saccharomyces cerevisiae, Aspergillus sp. and Mucor
sp. were present in burukutu obtained from the markets.
With the exception of Mucor sp., the other two fungal
genera found in the commercialized burukutu were also
present in the laboratory brewed burukutu.
TABLE 8: FUNGAL ISOLATES FROM BURUKUTU SAMPLED FROM THE
THREE MARKETS AND LABORATORY BREWED BURUKUTU
Sample Macroscopy Microscopy Probable organism
EM Creamy round
colonies Large cell globes
with budding Saccharomyces
cerevisiae
Black colonies Septate hyphae with
budding Aspergillus sp.
CM Black colonies Septate hyphae with
budding Aspergillus sp.
Creamy round
colonies Large cell globes
with budding Saccharomyces
cerevisiae
Black colonies Spongy-like growth Mucor sp.
RM Creamy round
colonies Large cell globes
with budding Saccharomyces
cerevisiae
Black colonies Septate hyphae with
Budding Aspergillus sp.
LBB Creamy round
colonies
Large cell globes
with budding
Saccharomyces
cerevisiae
Black colonies Septate hyphae with
Budding Aspergillus sp.
Key: EM - Elele market; CM - Choba market; RM - Rumuokoro; LBB -
Laboratory brewed burukutu.
The pH, titratable acidity, alcohol content, and soluble
solids of laboratory brewed burukutu at different stages of
the brewing process and the fermenting burukutu (finished
product) is presented in Table 9. At the various stages of
brewing burukutu, pH of the mash was as high as 7.0, that of
supernatant (4.0) and sediment (3.9) were almost the same,
but that of boiled wort was 3.7. It is interesting to note that
pH of the fermenting burukutu ranging from 3.6-3.0 was
steadily decreasing with increase in fermentation time. The
titratable acidity at the various stages of brewing burukutu
range from 0.00-0.10%. The values decreased from 0.90-
0.70% in the course of fermentation but increased to 0.97%
at the 48 h. At the various brewing stages of burukutu,
alcohol was not detected. The presence of alcohol was
detected after 6 h of fermentation and increased to 4.7%
after 48 h of fermentation. Table 9 shows that total soluble
solids at the various stages of fermentation starting from the
mash to the boiled wort increased from 0.65 to 0.90%.
During the 48 h fermentation period, the total soluble solids
of the fermenting burukutu steadily increased from 0.90 to
0.99%.
TABLE 9: PHYSICOCHEMICAL PARAMETERS OF LABORATORY BREWED
BURUKUTU SAMPLED AT VARIOUS BREWING STAGES AND THE
FERMENTING BURUKUTU (FINISHED PRODUCT)
Parameter Mash SU SED BW 6 h 12 h 18 h 24 h 48 h
pH 7.0 4.0 3.9 3.7 3.6 3.5 3.4 3.2 3.0
Titratable
acidity (%) 0.00 0.02 0.10 0.1 0.9 0.8 0.6 0.7 0.97
Alcohol
Content(%) 0 0 0 0 0.14 1.3 3.0 3.8 4.7
Soluble solids (%)
0.65 0.66 0.82 0.9 0.91 0.91 0.92 0.98 0.99
Key: SU – Supernatant; SED- Sediment; BW-Boiled wort; h =
Fermentation time.
Depicted in Fig. 3 is the physicochemical parameters of
commercialized burukutu obtained from the three markets
and laboratory brewed burukutu (LBB) undergoing 48 h
fermentation. The pH of burukutu obtained from Elele (EM)
and Choba markets (CM) was 3.0 whereas a slightly higher
pH 3.1 was encountered in burukutu obtained from
Rumuokoro market (RM). However, Analysis of variance
indicated that there is no significant difference (P>0.05)
between the pH of the commercial burukutu from the three
markets. At 48 h during the fermentation period of the LBB,
the pH of the final product was the same with the sample
obtained from EM and CM after the value steadily
decreased from 3.6 - 3.0. The titratable acidity (TA) of
burukutu obtained from CM and RM was 0.02 and 0.1%,
respectively whereas TA was not detected in the
commercialized burukutu obtained from EM. Data obtained
indicated that there is significant difference (P<0.05)
between the TA of the commercial burukutu from the three
markets. Meanwhile, during the fermentation period of
LBB, the TA ranged between 0.6-0.97%. The alcohol
content of burukutu obtained from EM, CM and RM
markets were 2.1, 3.2, and 4.0%, respectively whereas the
alcohol content of LBB undergoing 48 h fermentation
steadily increased from 0.14-4.7%. This result shows that
alcohol content of the LBB (final product) at 48 h was
higher than the values obtained from commercialized
burukutu obtained from the three markets. There is
significant difference (P<0.05) between the alcohol contents
of the commercial burukutu from the three markets as well
as LBB. Our result also shows that soluble solids present in
the commercialized burukutu obtained from EM, CM, and
RM were 0.65, 0.66 and 0.82%, respectively. A slightly
higher soluble solid within the range 0.90-0.99% was
encountered in LBB undergoing 48 h fermentation.
0
10
20
30
40
%
Microorganism
LBB Elele Mkt Choba Mkt Rumokoro Mkt
Page 9
ORIGINAL ARTICLE
European Journal of Biology and Biotechnology
www.ejbio.org
DOI: http://dx.doi.org/10.24018/ejbio.2020.1.5.85 Vol 1 | Issue 5 | October 2020 9
Fig. 3. Physicochemical properties of burukutu sampled from the three
markets and laboratory-brewed burukutu (LBB).
Analysis of variance showed that there is no significant
difference (P>0.05) between the soluble solids present in the
commercial burukutu from EM and CM, but the values were
significantly different from burukutu obtained from RM.
The proximate composition of the laboratory brewed and the
commercialized burukutu obtained from the three markets is
presented in Fig. 4. The results show that the laboratory
brewed burukutu had higher moisture (52.1%), crude fat
(15.7%), crude protein (7.6%) and ash content (9.8%)
compared with the commercialized burukutu obtained from
the three markets. However, the laboratory brewed burukutu
had the least carbohydrate content (15.4%).
Fig. 4. Proximate composition of laboratory brewed and commercialized
burukutu sampled from three markets.
Key: LBB = Laboratory brewed burukutu; EM- Elele market; CM- Choba market; RM - Rumuokoro market.
The level of mineral element (ppm) in the laboratory
brewed and the commercialized burukutu obtained from the
three markets is presented in Table 10. The results obtained
showed that potassium (1.2 ppm), calcium (4.5 ppm),
sodium (3.1 ppm), zinc (4.32 ppm) and magnesium
(4.5 ppm) content in the laboratory brewed burukutu is
higher than the values obtained for each of the minerals
present in the commercialized burukutu obtained from the
three markets. However, the level of phosphorus (3.2 ppm)
in the laboratory brewed burukutu and similar samples
obtained from the markets were the same except burukutu
obtained from Elele market which was 3.1 ppm. Meanwhile,
the iron content (3.1 ppm) of burukutu from Elele market is
higher than the values detected in the products obtained
from Choba and Rumuokoro markets including the
laboratory brewed burukutu. The analysis of variance
conducted revealed that all the minerals with the exception
of phosphorus in the LBB reported in this study were
significantly different (p<0.05) from the values obtained in
burukutu from the three markets. However, the calcium,
potassium, and iron content of burukutu from Rumuokoro
and Choba markets are not significantly significant
(p>0.05).
TABLE 10: MINERALS CONTENT OF THE LABORATORY BREWED AND
COMMERCIALIZED BURUKUTU OBTAINED FROM THE THREE MARKETS
Sample Minerals (ppm)
K Ca Na Fe Zn Mg P
LBB 1.2 4.5 3.1 2.22 4.32 4.5 3.2
RM 1.1 4.0 3.0 2.1 3.5 3.5 3.1
CM 1.1 3.9 2.9 2.0 2.5 3.1 3.2 EM 1.0 2.5 2.5 3.1 3.2 3.2 3.2
Key: LBB - Laboratory brewed burukutu; RM - Rumuokoro market; CM -
Choba market; EM- Elele market; ppm - parts per million.
IV. DISCUSSION
This study showed that the increase in microbial count
occurred at the early stages of the brewing process during
the production of burukutu. According to [3], this trend
could be as a result of favourable growth condition and
availability of nutrients for the microorganisms. In a related
study, [25] reported high microbial count for aerobic
mesophiles, yeasts, lactic acid bacteria, coliforms and
Escherichia coli in sorghum grains, malted grains,
supernatant, sediment, sourced wort, concentrated wort and
old brew used for backslopping during processing of
sorghum for the production of burukutu. According to their
findings, coliforms such as E. coli disappeared when wort
was boiled and this is consistent with the findings from this
present study. The sorghum used in brewing the alcoholic
beverage in the laboratory could be a source of various
microorganisms encountered during the earlier processing
stages of burukutu. In a related study, [26] reported total
aerobic plate count (7.11-8.76 Log10CFU/ml), LAB count
(6.80-8.76 Log10CFU/ml), fungal count (4.43-6.85
Log10CFU/ml), and coliform count (4.20-5.95
Log10CFU/ml) in malted sorghum prepared using a
standardized procedure which were higher than 5.5
Log10CFU/ml, 4.67 Log10CFU/ml, 4.43 Log10CFU/ml and
3.26 Log10CFU/ml, respectively in the unmalted sorghum.
In order to reduce the population of coliforms and moulds
present in the malted sorghum, [27] researched on the effect
of using bacterial (Lactobacillus plantarum, Pedioccocus
pentosaceus) and yeast starter (Saccharomyces sp.) culture
instead of chemical treatments. Findings from the study
revealed that population of coliforms, and moulds reduced
during malting of sorghum incorporated with the bacterial
and yeast starter culture.
A comparison between the microbial count of the
fermenting burukutu and the samples collected earlier at
various stages of the brewing process is an indication that
the accumulation of organic acid and increase in alcohol
content during the fermentation process created an
0
0,5
1
1,5
2
2,5
3
3,5
4
4,5
5
pH Titratableacidity
Alcoholcontent
Solublesolids
Val
ue
s (%
, exc
ep
t p
H)
Physiocochemical Parameters
Elele Mkt Choba Mkt Rumuokoro Mkt LBB
0
10
20
30
40
50
60
Pro
xim
ate
com
po
siit
ion
(%
)
Proximate parameters
LBB EM CM RM
Page 10
ORIGINAL ARTICLE
European Journal of Biology and Biotechnology
www.ejbio.org
DOI: http://dx.doi.org/10.24018/ejbio.2020.1.5.85 Vol 1 | Issue 5 | October 2020 10
unfavourable environment for the microorganisms to thrive.
This condition may also have contributed significantly in
reducing the population of lactic acid bacteria (LAB) from
9.11-3.61 Log10 Cfu/ml, faecal coliforms from 7.52
Log10Cfu/ml to a safe level (absence of faecal coliforms) in
the fermenting burukutu. Meanwhile, aerobic mesophiles,
total coliforms and fungi were not detected in the product.
Microbiological analysis of boiled wort compared with
sorghum mash before boiling, supernatant before boiling
and sediment before boiling suggests that boiling of the wort
eliminated microorganisms which could contaminate the
final product (burukutu). In a related study, [3] noted that
Escherichia coli and Staphylococcus aureus detected during
early stages of the fermentation process of burukutu
disappeared during the final preparation stages of burukutu
which they suggested could be as a result of low pH
(approximately 3.5) and increased acidity in the malted
grains. At that stage, the release of hydrogen peroxide and
other antimicrobial agents by Lactobacillus sp. which is the
dominant bacterial genera could either kill or inhibit the
growth of other microorganisms.
The overall result of the microbial analysis of burukutu
sampled from three markets namely, Elele (EM), Choba
(CM) and Rumuokoro (RM) revealed that the alcoholic
beverage purchased from CM had a slightly higher
microbial count compared with samples of burukutu
obtained from EM and RM. Interestingly, microbiological
analysis of the laboratory brewed burukutu (LBB) showed
that LAB count 3.61 and 3.70 Log10 Cfu/ml was present in
the alcoholic beverage at 24 and 48 h fermentation period
whereas aerobic mesophilic bacteria, coliforms and fungi
were not detected in the product. This is possibly as a result
of aseptic techniques involved in the brewing process in a
laboratory-controlled environment. According to [4], LAB
isolated from burukutu possess antimicrobial properties
against Staphylococcus aureus and Escherichia coli.
The limit for mesophilic aerobic count for fermented
foods and beverages considered safe for consumption as
recommended by the National Agency for Food and Drug
Administration and Control (NAFDAC) is 5 Log10CFU/ml
[28]. Therefore, all the samples of commercialized burukutu
from the three markets which range from 6.92-7.96
Log10CFU/ml are not safe for human consumption since
they did not meet the NAFDAC requirement. Generally,
aerobic mesophilic counts serve as a good indicator to
evaluate the overall quality of a production process. In a
related study, Falegan and Akoja [29], reported that
burukutu sold in some locations in Ekiti state is not safe for
human consumption due to presence of Listeria sp.,
Acetobacter spp., and Corynebacterium spp. Interestingly,
the sample of burukutu brewed in our laboratory met the
NAFDAC requirement in terms of mesophilic aerobic count
which certifies the product safe for human consumption.
According to World Health Organization (WHO), in any
100 ml sample of water for drinking, there must be absence
of Escherichia coli and thermotolerant coliform bacteria
[30]. Poor personal hygiene, unsanitary environment, the
use of contaminated raw materials, utensils, storage cans
and water could be responsible for high microbial count of
commercialized burukutu sampled from CM, EM and RM
unlike a similar alcoholic beverage brewed in a laboratory
using aseptic techniques in a hygienic environment.
Enterobacter aerogenes, Escherichia coli and
Staphylococcus aureus were identified from samples of
burukutu obtained from the markets. This result partially
agrees with a similar study carried out by [14], [10] which
reported the presence of E. coli and S. aureus in burukutu.
In a related study, [15] found Enterobacter aerogenes in
burukutu sold in Abakpa market. This bacterium is
associated with urinary tract infections and hospital-
acquired infections. It is widely distributed in animals and
humans. Enterobacter aerogenes can also be found in
sewage, soil, and water. In beer brewing process, this
bacterium is known to contaminate the fermented wort [31].
The presence of E. coli which is a common faecal coliform
in burukutu obtained from the three markets suggests that
the product was exposed to unsanitary conditions during the
brewing process and handling of the final product. The
major raw material (sorghum) for brewing burukutu could
also be a source of contamination. Exposure of burukutu to
flies, the use of contaminated water and unsterilized utensils
could also be a source of microbial contamination of the
product [15]. Escherichia coli forms part of the normal flora
of the intestine of humans and other vertebrates. The
presence of E. coli in burukutu poses a threat to public
health [14]. Diarrhea in children and infants, gastroenteritis
and urinary tract infection are caused by certain strains of
Escherichia coli [15]. Brewing burukutu in a hygienic
environment, decontamination of the raw materials
involved, and the use of potable water could prevent
contamination of the product with E. coli. Result from this
study shows that S. aureus was present in burukutu obtained
from the three markets but it was not detected in the
laboratory brewed burukutu. Isolation of S. aureus from
samples of burukutu sold in the three markets could be as a
result of poor personal hygiene of the processors. Since S.
aureus is part of a normal flora of human skin, the
possibility of contaminating burukutu is high unless aseptic
technique is adopted during the production process [14]. S.
aureus is a leading cause of staphylococcal food poisoning
which manifest symptoms such as vomiting and diarrhea.
Majority of those that produce burukutu at the cottage level
use unwashed bare hands and wooden paddles. Sometimes,
when the product is allowed to stand in the course of
brewing burukutu, it is left uncovered and dusty air could
contaminate the product with pathogenic microorganisms
[32].
Fungi isolated at the various brewing stages of burukutu
were Saccharomyces cerevisiae and Aspergillus sp. A
related study carried out by [15] also reported the presence
of S. cerevisiae and Aspergillus sp. in burukutu sold in
mammy market, Abakpa, Enugu State, Nigeria. Both fungal
genera were also found in samples of burukutu obtained
from the three markets namely Elele (EM), Rumuokoro
(RM) and Choba (CM). In addition, Mucor sp. was also
identified in the samples obtained from CM. This is in
agreement with [32] which reported the presence of Mucor
sp. in a commercially brewed burukutu. The result obtained
from this study showed that Saccharomyces cerevisiae was
the dominant yeast in the samples of commercialized
Page 11
ORIGINAL ARTICLE
European Journal of Biology and Biotechnology
www.ejbio.org
DOI: http://dx.doi.org/10.24018/ejbio.2020.1.5.85 Vol 1 | Issue 5 | October 2020 11
burukutu analysed. This observation collaborates the
findings of [25] in a related study.
Lactic acid bacteria (LAB) were found in all samples of
burukutu, both laboratory brewed burukutu and
commercialized burukutu obtained from the three markets.
The LAB comprises of Lactococcus lactis, Lactobacillus
fermentum, L. acidophilus, L. plantarum and L. brevis. All
the LAB isolates from burukutu were also reported by [25]
from a related study. This confirms that brewing African
traditional beer involves lactic acid fermentation. A close
association between yeast and lactic acid bacteria in many
cereal foods has been previously reported. Yeast is known to
provide soluble nitrogen compounds as well as other growth
factors which stimulate the growth of LAB. In the
production of kefir, carbon (IV) oxide, propionate, pyruvate,
succinate and acetate which are yeast metabolites stimulate
activities of lactobacilli [3], [15]. The dominance of
Lactobacillus fermentum among the lactic acid bacteria
(LAB) isolated from commercialized burukutu sampled
from Elele, Choba and Rumuokoro markets collaborates the
report from a related study carried out by [25] which also
reported the presence of L. acidophilus, L. brevis,
Lactococcus lactis subsp. lactis in burukutu. Different
researchers have also reported the presence of these LAB in
various traditional beers.
The pH of the laboratory brewed burukutu ranged from
3.0-3.4 whereas that of commercialized burukutu obtained
from the three markets ranged from 3.0-3.1. According to
[33], the pH of burukutu based on its basic characteristics
should be within the range of 3.3-3.5. The result obtained
from this study implied that this requirement was met by the
laboratory brewed burukutu whereas the commercialized
samples from the three markets did not meet the
requirement. In a related study, [32] reported that pH of
laboratory brewed burukutu (LBB) and commercially
brewed burukutu was 3.9 and 3.8, respectively which is
higher than the values reported in this study. According to
[1], the variations in alcohol content of LBB (0.14-4.7%)
undergoing 48 h fermentation and commercialized burukutu
(2.1-4.0%) from the three markets could be as a result of
influence from the environment and variations in the
processing methods. Several studies have identified
Saccharomyces cerevisiae as the yeast that brings about
alcoholic fermentation in burukutu [25]. The alcohol content
of the laboratory brewed burukutu (4.7%) at 48 h is higher
when compared with the commercialized samples obtained
from the three markets. According to [12], the alcohol
content of burukutu is usually within the range of 3-6%. The
alcohol content of both LBB and commercialized burukutu
falls within that range. The level of some alcoholic
beverages including burukutu in the urine after consumption
was investigated by [34]. Findings from the study revealed
that concentration of alcohol in burukutu was 3.2 (%v/v)
whereas the level of alcohol in the urine of the subjects that
consumed the alcoholic beverage was 120 mg/dL while 89
mg/dL was the estimated blood concentration. Since the
subjects consumed burukutu on empty stomach, 4.69% of
the administered dose was excreted in the urine. It was
envisaged that the consumers will experience mild influence
on stereoscopic vision and lack of adaptation. Notably, the
subjects that consumed burukutu were not legally drunk
based on blood alcohol level not exceeding 100 mg/dL
approved by most countries. After investigating the effect of
burukutu on redox status of the liver of male rats, [12] in
their report warned against indiscriminate consumption of
burukutu which could affect their health and wellbeing.
Atter et al. [25] in another related study which involves
the production of burukutu reported that the pH, titratable
acidity (TA), soluble solids and alcohol content of the
product were within the ranges of 2.88-3.36, 0.54-0.82%,
3.33-7.50%, and 0.99-4.47%, respectively. These values are
in agreement with the result obtained from this study with
the exception of soluble solids which is higher than the
values reported in Table 9 and Fig. 3. The increase in
titratable acidity and reduction in pH of burukutu as
fermentation time increased shows that souring/acidification
is a crucial activity that occurs during production of
burukutu [25]. Our results revealed that TA of laboratory
brewed burukutu within the fermentation period range from
0.6-0.97% is higher than TA of the commercialized product
(0-0.1%) obtained from the three markets. Higher TA in the
laboratory brewed burukutu could be as a result of acetic
acid formed when carbon (IV) oxide was oxidized due to
duration of fermentation [35].
The protein content of laboratory brewed burukutu was
7.6%. This value is higher than protein content of
commercialized burukutu obtained from the three markets
which ranged between 2.9-5.7%. The variation in protein
content could be as a result of varieties of sorghum used for
preparing burukutu. The protein content of commercialized
burukutu reported in this study is a thing of concern
considering high level reliance of the alcoholic beverage by
millions of impoverished individuals as a meal. Our study
has shown that protein content in all the samples of
burukutu sampled from the three markets as well as the
laboratory-brewed burukutu is below the lower limit of the
recommended dietary reference intake’s (DRI) acceptable
macronutrient distribution range (AMDR) of 10-35%
protein for adults. In a related study, [2] reported higher
protein content of 15.14% in burukutu, hence, not in
agreement with our observation. High protein content of
burukutu reported by [2] could be as a result of adding
maize to sorghum to serve as a raw material for the
production of the alcoholic beverage which was not the case
in our study.
All body activities such as proper functioning of kidneys,
brain, muscles and nervous systems require energy from
carbohydrate. Result from this study indicated that the
carbohydrate content of commercialized burukutu sampled
from the three markets range from 44.7-51.7% which is
within the DRI’s AMDR range (45-65%) of energy derived
from carbohydrate for adults. However, a lower
carbohydrate content (15.4%) reported in the laboratory
brewed burukutu did not meet the criteria. Surprisingly, [4]
reported a lower carbohydrate content of 3.52 g/100 g and
8.38 g/100 g in fermented and unfermented burukutu,
respectively. According to [36], consuming diets any of the
macronutrients (protein, fat, and carbohydrate) falls outside
the AMDR is considered unhealthy. Since alcohol
consumption contribute to dietary energy, consuming the
LBB as a regular meal might not provide adults adequate
quantity of calories needed for proper functioning of the
Page 12
ORIGINAL ARTICLE
European Journal of Biology and Biotechnology
www.ejbio.org
DOI: http://dx.doi.org/10.24018/ejbio.2020.1.5.85 Vol 1 | Issue 5 | October 2020 12
human body [37]. Interestingly, several studies have
suggested that consumption of low carbohydrate diets will
help diabetic patients to manage their body weight, improve
glycemic control and reduce fluctuations in insulin level
[38]. Meanwhile, [39], reported a carbohydrate content of
82.85% and 76.22% in fresh and stored burukutu,
respectively which exceeded the DRI’s AMDR range.
Fat helps in the maintenance of cell membrane, functions
as an insulator for the body, useful for growth and
development. It serves as a source of energy to the human
body as well as a solvent for vitamin A, D, E and K. Fat also
provide taste and consistency in foods. Based on the DRI’s
AMDR recommendation for total fats in adults which ranges
from 25-35%, our result showed that fat content of the
laboratory brewed burukutu which was 15.7% and
commercialized burukutu sampled from the three markets
ranging from 10.8-14.2% did not meet the requirement.
In humans, moisture is required for good health and
enhances physiological processes such as digestion of food
materials, absorption of the nutrients in food, and oxygen
supply to the cells. Moisture also helps in the removal of
waste from the human body [2]. The moisture content of
laboratory brewed burukutu which was 52.1% partially
agree with the result reported by [2] which involved the
production of sorghum based burukutu, millet based
burukutu, maize based burukutu and composite of sorghum,
millet and maize which had 55.50%, 55.69%, 55.06% and
55.64%, respectively as their moisture contents. The
commercialized samples of burukutu obtained from Elele,
Rumuokoro and Choba markets had lower moisture content
which ranged from 29.9 -31.2%. The variations in moisture
content could be as a result of the different procedures
adopted by the local processors in brewing burukutu.
The mineral content of burukutu sampled from the three
markets range from 3.8-4.85%. Higher ash content (9.8%) in
the laboratory brewed burukutu suggests that the alcoholic
beverage contains higher levels of minerals compared with a
similar product sampled from the three markets. The
variations in proximate composition of the commercially
brewed burukutu and laboratory brewed burukutu could be
as a result of the quality of sorghum used and processing
methods adopted. Environmental factors which includes soil
moisture, soil fertility and cultural practices as well as
genetic factors could also influence the nutrient composition
of sorghum [32]. In food analysis, ash content is an index of
mineral element composition of food samples.
Intake of minerals is important to the human body
because it helps in regulating and building the living cells as
well as help fight depression [15]. Iron constitute a major
functional component of the haemoglobin of red blood cells
and myoglobin in the muscles responsible for distributing
oxygen throughout the body. Healthier cardiovascular
system and maintenance of water homeostasis essential for
life processes is aided by magnesium. Calcium plays an
important role in the formation of bones and teeth as well as
help maintain normal blood pressure and impulse
transmission [1]. Mineral analysis of laboratory brewed
burukutu reported by [32] showed that magnesium, calcium
and iron content were 116 ppm, 1.58 ppm and 11.90 ppm,
respectively whereas figures from commercially brewed
burukutu were 114 ppm, 1.58 ppm, and 21.10 ppm,
respectively. Eze et al. [15] in a related study reported that
the mean calcium, iron, magnesium, phosphorus, potassium
and sodium content of burukutu sold in Abakpa, Enugu
State, Nigeria were 1.47%, 12%, 32%, 0.61%, 1.08% and
1.41%, respectively. According to [4], zinc, phosphorus and
iron content of burukutu fermented for 120 h was 4.00
mg/L, 40.75 mg/100 g and 2.23 mg/100 g, respectively.
According to World Health Organization (WHO), safe limit
of zinc in potable water is 3 mg/L. In alcohol, the
permissible limit of zinc is 5.0 mg/L [35]. This requirement
was met by all the samples of burukutu analysed in this
study. According to [4], the level of iron and zinc in grains
is improved as a result of malting. It is also suggested that
solubilisation of minerals in the container by the fermenting
product could bring about increase in mineral content of the
product. Considering the amount of minerals present in the
samples of burukutu, it is interesting to note that potassium
content is higher than sodium content which makes it a
suitable diuretic diet for the prevention of hypertension [2].
The Standard Organization of Nigeria (SON) stipulate that
permissible limit of Fe in drinking water is 0.3 mg/L. The
dietary allowance for Fe which is recommended for every
individual is 10-18 mg/day. For healthy adult males and
females, the recommended dietary allowance (RDA) for Mg
is 400-420 and 310-320 mg/day, respectively. The RDA for
Ca is 1 000 mg Ca/day [5]. According to [1], individuals
that consume burukutu brewed using sorghum grains as the
only cereal are likely to derive more health benefits
associated with the intake of minerals compared with
burukutu brewed using sorghum combined with corn and
millet.
V. CONCLUSION
At the early stages of the brewing process of burukutu in
the laboratory before boiling the wort, increase in the mean
microbial count of aerobic mesophiles (6.62-9.7
Log10CFU/ml), total coliforms (5.73-7.8 Log10CFU/ml),
faecal coliforms (5.23-7.52 Log10CFU/ml), fungi (3.36-6.34
Log10CFU/ml) and Lactic acid bacteria (LAB) [(1.37-9.11
Log10CFU/ml)] were observed. The bacterial isolates
identified were Lactobacillus sp., Lactococcus sp.,
Escherichia coli, whereas the fungal isolates were
Saccharomyces cerevisiae and Aspergillus sp. However,
during laboratory fermentation of the finished product
(burukutu), only LAB within the range of 3.61-3.70
Log10CFU/ml) were encountered. The total bacterial count
(TBC), total fungal count (TFC), total coliform count
(TCC), faecal coliform (FC) and LAB count of the
commercialized burukutu obtained from Elele market (EM)
were 7.01, 7.96, 7.0, 7.08 and 7.14 Log10CFU/ml; from
Rumuokoro market (RM) were 6.99, 6.92, 7.96, 7.08 and
7.11 Log10CFU/ml; from Choba market (CM) were 7.95,
7.90, 7.94, 7.04 and 7.13 Log10CFU/ml, respectively.
Staphylococcus aureus, Escherichia coli, Saccharomyces
cerevisiae, and Aspergillus sp. were found in both
laboratory- brewed burukutu (LBB) and commercialized
burukutu obtained from the three markets. Also,
Enterobacter aerogenes and Mucor sp. were encountered in
the commercialized burukutu. The LAB identified from the
alcoholic beverage were Lactococcus lactis, Lactobacillus
Page 13
ORIGINAL ARTICLE
European Journal of Biology and Biotechnology
www.ejbio.org
DOI: http://dx.doi.org/10.24018/ejbio.2020.1.5.85 Vol 1 | Issue 5 | October 2020 13
brevis, L. plantarum, L. fermentum and L. acidophilus.
Among the LAB identified from both LBB and
commercialized burukutu, Lactobacillus fermentum and L.
brevis had the highest (33.33-40%) and least (0-14.29%)
frequency of occurrence, respectively. The range of alcohol
content (2.10-4.00%) and pH (3.0-3.1) in the
commercialized burukutu falls within the range of 0.4-4.7%
and 3.0-3.6, respectively encountered in the fermenting
LBB. However, titratable acidity and soluble solids of both
LBB and commercialized burukutu did not follow the trend.
The proximate composition of LBB falls outside the ranges
encountered in the commercialized burukutu obtained from
the three markets. The level of mineral elements in the LBB
were higher than what was obtainable in the commercialized
samples with the exception of iron (Fe) content. The overall
results from this study revealed that the LBB had less
alcohol content, higher level of minerals, better microbial
quality and nutritional composition compared with the
commercialized burukutu sampled from Elele, Rumuokoro
and Choba markets. Also, the laboratory brewed burukutu is
considered safe for human consumption unlike the
commercialized burukutu which is not safe based on the
microbiological qualities. Although pasteurization of
indigenous sorghum beer (burukutu) seem to be less
attractive, it should be encouraged alongside other good
manufacturing practices (GMP) and good hygienic practices
(GHP) to guarantee microbial safety of the commercialized
products.
REFERENCES
[1] E. C. Stephen, C. D. U. Nwokwu, and K. Bashir. (June 2017).
Comparative physico-chemical analysis of locally brewed beer (burukutu) from corn, millet and sorghum. Am. J Sci. Tech. [Online].
4(3). pp. 43-48. Available: http://www.aascit.org/journal/ajst.
[2] A. C. Ogbonna, C. I. Abuajah, and I. A. Umanah. (July 2016). Burukutu: healthy and superior indigenous African traditional opaque
beverage. Am. J Adv. Food Sci. Tech. [Online]. 4(1). pp. 29-37.
doi:10.7726/ajafst.2016.1004. [3] A. B. Yusuf, B. H. Gulumbe, Z. M. Kalgo, B. Aliyu, and M. Haruna.
(May 2020). Microorganisms associated with the production of
burukutu (an alcoholic beverage) in Kebbi State, Nigeria. Equity J Sci. Tech. [Online]. 7(1). pp. 67-73. Available: www.equijost.com.
[4] A. Atter, K. Obiri-Danso, G. A. Anyebuno, and W. K. Amoa-Awua.
(July 2017). Effect of fermentation on the chemical quality of burukutu a traditional beer in Ghana. Annals, Food Sci. Tech.
[Online].18(3). pp. 349-354. Available: www.afst.valahia.ro.
[5] C. M. A. Iwegbue, A. L. Ojelum, and F. I. Bassey. (June 2014). A survey of metal profiles in some traditional alcoholic beverages in
Nigeria. Food Sci. Nutri. [Online]. 2(6). pp. 724-733.
doi:10.1002/fsn3. 163.
[6] E. Evera, A. Abdallah, S. He, Z. Shuang, W. Sainan, and H. Yu.
(2019). Shelf life and nutritional quality of sorghum beer: potentials
of phytogenic-based extracts. J Agric. Food Tech. [Online]. 9(2). pp. 1-14. Available: www.textroad.com.
[7] C. K. Egemba, and V. E. Etuk. (2007). A Kinetic Study of Burukutu
Fermentation. J Engineer. App. Sci. [Online]. 2(7). pp. 1193-1198. [8] S. T. Ogunbanwo, A. O. Adewara, and P. T. Fowoyo. (2013). Effect
of fermentation by pure cultures of Lactobacillus fermentum 1 and
Saccharomyces cerevisiae as starter cultures in the production of burukutu. New York Sci. J. [Online]. 6(1). pp. 73-81. Available:
http://www.sciencepub.net/newyork.
[9] M. N. Alo, U. A. Eze, and N. E. Eda. (2012). Microbiological qualities of burukutu produced from a mixture of sorghum and millet.
Am. J Food Nutri. [Online]. 2(4). pp. 96-102.
doi:10.5251/ajfn.2012.2.4.96.102. Available: http://www.scihub.org/AJFN.
[10] O. O. Oladipo, A. B. Saanu, A. B. Juliet, and I. O. Adebola. (2018).
Microbiological evaluation and antibiotic susceptibility pattern of
bacteria associated with burukutu, a non-alcoholic beverage. J Food
Res. Sci. [Online]. 7(1). pp. 1-7. doi: 10.3923/jfrs.2018.1.7. [11] I. J. Sunday, and I. I. Aondover. (2013). Development of equations for
estimating energy requirements in processing local alcoholic beverage
(burukutu) in Nigeria. Int. J Engineer. Resear. Appli. [Online]. 3(4). pp. 648-654. Available: www.ijera.com.
[12] T. O. Ajiboye, G. A. Iliasu, O. B. Ojewuyi, A. T. Abdulazeez, A. O.
Muhammed, and F. L. Kolawole. (May 2014). Sorghum-based alcoholic beverage, burukutu, perturbs the redox status of the liver of
male rats. Food Sci. Nutri. [Online]. 2(5). pp. 591-596. doi:
10.1002/fsn3.139. [13] O. O. Olaniyi, and J. B. Akinyele. (July 2019). Isolation of toxigenic
Aspergillus flavus and evaluation of aflatoxins in burukutu, sorghum
fermented beverage sold in Akure, Nigeria. J Food Safe Hyg. [Online]. 5(1). pp. 30-38. Available: http://jfsh.tums.ac.ir.
[14] C. G. Anaukwu, F. C. Nwangwu, O. I. Okafor, C. C. Ezemba, C. C.
Orji, K. C. Agu, and E. J. Archibong. (2015). Microbiological analysis of burukutu beverage produced in southern part of Nigeria.
Eur. J Exp. Biol. [Online]. 5(8). pp. 18-22. Available:
www.pelagiaresearchlibrary.com. [15] V. C. Eze, O. I. Eleke, and Y. S. Omeh. (2011). Microbiological and
nutritional qualities of burukutu sold in mammy market Abakpa,
Enugu State, Nigeria. Am. J Food Nutri. [Online]. 1(3). pp. 141-146.
doi:10.5251/ajfn.2011.1.3.141.146, Available:
http://www.scihub.org/AJFN.
[16] D. H. Larone. Medically important fungi, a guide to identification. Hagerston, Maryland, USA, London, Harper and Row. 1976, Vol. 2.
[17] D. Frey, R. J. Old-Field, and R. C. Bridjer. A colour atlas of
pathogenic fungi. Wolf Medical Public Ltd. London. 1979. [18] R. A. Samson, E. S. Hockstra, J. C. Frisvad, and D. Filtenburg D.
Introduction to food borne fungi. Central bureau. Voor schimnel
culture, Baarn Delft. Printed by Ponsen and Looyen. Wagening, the Netherlands. 1995, 4th edition.
[19] J. Dvorak, and M. Atanasek. Mycological diagnosis of animal
dermatophytosis. Academic press 1969, pp. 213. [20] Bergey’s Manual of Determinative Bacteriology. Holt, J.D. (Ed.),
Williams Wilkins CO. Baltimore, 1994, 9th edition.
[21] M. Cheesbrough. District Laboratory Practice in Tropical Countries. Cambridge University Press, United Kingdom, 2005, 2nd edtion.
[22] J. C. de Man, M. Rogosa, M. E. Sharpe. (1960). A medium for the cultivation of lactobacilli. J Appli. Bacteriology. 23. pp. 130-135.
[23] AOAC (1990). Methods of Analysis of the Association of Official
Analytical Chemists. Arlington: Association of Official Analytical Chemists, Incorporated. 15th edition. Vol. 2. pp. 739-750.
[24] AOAC (2005). Official Methods of Analysis. Association of Official
Analytical, Chemists International, Maryland, USA. 18th edition. [25] A. Atter, K. Obiri-Danso, and W. K. Amoa-Awua. (April 2014).
Microbiological and chemical processes associated with the
production of burukutu a traditional beer in Ghana. Int. Food Resear. J. [Online]. 21(5). pp. 1769-1776. Available:
http://www.ifrj.upm.edu.my.
[26] M. L. Lefyedi, G. J. Marias, M. F. Dutton, and J. R. N. Taylor. (2005). The microbial contamination, toxicity and quality of turned
and unturned outdoor floor malted sorghum. J. Institute Brewing.
[Online]. 111(2). pp. 190-196. [27] M. L. Lefyedi, and J. R. N. Taylor. (2007). Control of the growth of
coliforms and moulds in sorghum malting by bacterial and yeast
cultures. The Institute Brewing Distilling. [Online]. 113(2). pp. 123-129.
[28] M. Umar, I. B. Mohammed, I. M. Abdulkarim, G. Yusuf, A. A. Yaya,
and G. Leo. (March 2016). Comparative studies on the prevalence of
Salmonella species in two homemade fermented beverages (zobo and
kunu-zaki) sold at Samaru, Zaria, Kaduna, Nigeria. Int. J Sci. Resear.
Pub. [Online]. 6(3). pp. 428-435. Available: www.ijsrp.org. [29] C. R. Falegan, and S. O. Akoja. (2014). Microbiological and
physicochemical studies of two Nigerian fermented alcoholic drinks
(palm wine and burukutu) in Ekiti state, Nigeria. Eur. J Food Sci. Tech. [Online]. 2(2). pp. 13-22. Available: www.eajournals.org.
[30] I. E. Mbaeyi-Nwaoha, and N. I. Egbuche. (August 2012).
Microbiological evaluation of sachet water and street-vended yoghurt and zobo drinks sold in Nsukka metropolis. Int. J Bio. Chem. Sci.
[Online]. 6(4). pp. 1703-1717. Doi:
http://dx.doi.org/10.4314/ijbcs.v6i4.27. Available: http://ajol.info/index.php/ijbcs.
[31] D. Matoulková, E. Vontrobová, M. Brožová, and P. Kubizniaková.
(2018). Microbiology of brewery production-bacteria of the order Enterobacterales. Kvasny Prum. [Online]. 64(4). pp. 161-166.
DOI:10.18832/kp201824.
[32] O. M. Kolawole, R. M. O. Kayode, and B. Akinduyo. (March 2007). Proximate and microbial analyses of burukutu and pito produced in
Page 14
ORIGINAL ARTICLE
European Journal of Biology and Biotechnology
www.ejbio.org
DOI: http://dx.doi.org/10.24018/ejbio.2020.1.5.85 Vol 1 | Issue 5 | October 2020 14
Ilorin Nigeria. Afri. J Biotech. [Online]. 6(5). pp. 587-590. Available:
http://www.academicjournals.org/AJB. [33] A. O. Adewara, and S. T. Ogunbanwo. (2013). Effects of processing
variables on the production of burukutu, a Nigerian fermented
beverage. Nature Sci. [Online]. 11(1). pp. 16-28. Available: http://www.sciencepub.net/nature.
[34] F. O. Oladeinde, E. I. Nwankwo, O. A. Moronkola, M. A. Amosu,
and B. Farayola. (2002). Determination of indigenous and foreign alcoholic beverages’ levels in urine by quantitative spectroscopy. Afri.
J Biomed. Resear. [Online]. 5. pp. 73-76.
[35] I. S. Eneji, A. A. Asan, and A. U. Itodo. (April 2017). Physicochemical and microbial analysis of locally fermented drinks
(burukutu and pito) from cereals in north central Nigeria. FUW
Trends Sci. Tech. J. [Online]. 2(1B). pp. 433-438. Available: www.ftstjournal.com.
[36] R. J. de Souza, J. F. Swain, L. J. Appel, and F. M. Sacks. (2008).
Alternatives for macronutrient intake and chronic disease: a comparison of the OmniHeart diets with popular diets and with
dietary recommendations. Am. J Clin. Nutr. [Online]. 88(1). pp. 1-11.
Available: https://academic.oup.com/ajcn/article/88/1/1/4648889. [37] J. Slavin, and J. Carlson. (2014). Carbohydrates. Adv. Nutri. [Online].
5. pp. 760-761. doi:10.3945/an.114.006163. Available:
https://academic.oup.com/advances/article/5/6/760/4616690.
[38] J. Wylie-Rosett, K. Aebersold, B. Conlon, C. R. Isasi, and N. W.
Ostrovsky. (April 2013). Health effects of low-carbohydrate diets:
where should new research go? Curr. Diabetes Reports. [Online]. 13(2). pp. 271-278. doi:10.1007/s11892-012-0357-5.
[39] I. F. Fadahunsi, S. T. Ogunbanwo, and A. O. Fawole. (2013).
Microbiological and nutritional assessment of burukutu and pito (indigenously fermented alcoholic beverages in West Africa) during
storage. Nature Sci. [Online]. 11(4). pp. 98-103. Available:
http://www.sciencepub.net/nature.