Comparative cytotoxicity induced by bulk and nanoparticulated ZnO inthe fish and human hepatoma cell lines PLHC-1 and Hep G2
Maria Luisa Fernández-Cruz1, Tobias Lammel1, Mona Connolly1, Estefania Conde2, Ana Isabel Barrado2,Sylvain Derick3, Yolanda Perez4, Marta Fernandez2, Christophe Furger3 & Jose Maria Navas1
1Instituto Nacional de Investigación y Tecnología Agraria y Alimentaria (INIA), Departamento de Medio Ambiente, Carretera dela Coruña Km 7 Madrid, Spain, 2CIEMAT Avda. Complutense 40, Madrid, Spain, 3NOVALEADS, 10 avenue de l’Europe,Ramonville, France and 4Departamento de Química Inorgánica y Analítica (E.S.C.E.T.), Universidad Rey Juan Carlos, Móstoles,Madrid, Spain
AbstractThe increasing presence of ZnO nanoparticles (NPs) in consumerproducts may be having a dramatic impact in aquaticenvironments. The evaluation of ZnO NP toxicity represents agreat challenge. This study aimed at evaluating the cytotoxiceffect of micro- and nanosized ZnO in a fish and a mammalianhepatoma cell line. A detailed characterisation of the particles inexposure media showed that ZnO NPs formed large aggregates.ZnO cytotoxicity was evaluated with a battery of in vitro assaysincluding LUCS, a new approach based on DNA alterationmeasurements. In fish cells, ZnO NP aggregates contributedsubstantially to the cytotoxic effects whereas toxicity in thehuman cells appeared to be mainly produced by the dissolvedfraction. ROS production did not contribute to the observedcytotoxicity. This work also showed that measuringconcentrations of NPs is essential to understand the mechanismsunderlying their toxicity.
Keywords: in vitro, nanoparticles, oxidative stress, ICP-MS, LUCS
Introduction
Metal oxide nanoparticles (NPs) are receiving increasingattention in material sciences and nanotechnology-based industries for a large variety of applications leadingto the increasing presence of NPs in commercial products.Among NPs, ZnO is frequently used in personal care pro-ducts such as sunscreens, ceramics, rubber processing,waste water treatment and even as a fungicide(Wong et al. 2010). Due to the increasing volumes of con-sumer products containing ZnO NPs, the probability thatthey will enter the environment and particularly the aquaticecosystems is heightened. It has been suggested that the useof TiO2, ZnO and Fe2O3 in sunscreens represents, by itself, apotential discharge of 250 tonnes/year into the marine
environment (Wong et al. 2010). Moreover, the potentialrisks towards occupational workers and consumers are notclearly established. Thus, it is urgent to assess NPs realecotoxicological impacts. While there has been an increasingnumber of research articles focused on the impact of theseNPs on human health, there is less knowledge on theirpotential toxicity to wildlife and aquatic biota.
The biological activity of NPs is dependent on manyfactors, some of which include size, shape and surfaceproperties that are different from their larger sized counter-parts. These physico-chemical properties will influence theNPs tendency to agglomerate or aggregate, as well as theirability to adsorb onto surfaces. NPs behaviour will not onlybe a function of the surface chemistry of the NPs, but willalso be affected by the composition of NPs, the presence ofany coatings, the dissolution of material from the particlesurface into solution and the presence of any soluble sub-stances in the preparation. A particular concern for metal-based NPs, regarding their small size and large surface area,is the dissolution of metal ions from the surface of theparticle. This process may eventually lead to the completedissolution of the particle leaving only metal ions remainingin solution (Handy et al. 2008a; Dhawan & Sharma 2010). Forall these reasons, NPs require much more extensive particlecharacterisation than other chemical compounds. Incom-plete characterisation will hinder attempts to find a corre-lation between various biological effects and particleproperties, leading to the misinterpretation of results(Handy et al. 2008a). These properties have to be consideredcarefully, thus appropriate analytical techniques must beapplied to measure size, shape and state of aggregation oragglomeration and to quantify the real NP concentration.
In vitro assays based on cell lines are employed as one of thefirst steps for understanding the toxicity and mechanism ofaction of a compound. ZnO NPs have been shown to producein vitro cytotoxic, genotoxic, inflammatory and oxidative stress
Correspondence: María Luisa Fernández Cruz, Instituto Nacional de Investigación y Tecnología Agraria y Alimentaria (INIA), Departamento de MedioAmbiente, Carretera de la Coruña Km 7.5, E-28040 Madrid, Spain. Tel: +34 91 3478788. Fax: +34 91 3474008. E-mail: [email protected]
(Received 13 December 2011; accepted 10 March 2012)
Nan
otox
icol
ogy
Dow
nloa
ded
from
info
rmah
ealth
care
.com
by
Rye
rson
Uni
vers
ity o
n 04
/28/
13. F
or p
erso
nal u
se o
nly.
responses in different mammalian cells (Xia et al. 2008; Yanget al. 2009; Huang et al. 2010; Song et al. 2010; De Berardis et al.2010; Yuan et al. 2010; Hsiao &Huang 2011; Pujalté et al. 2011).Studies in mammalian cell lines also attributed the toxicity ofZnO NPs, at least in part, to their solubility, the latter leading toZn ion formations (Xia et al. 2008; De Berardis et al. 2010;Song et al. 2010). It was also proposed that the production ofreactive oxygen species (ROS) is themain factor responsible forthe observed cytotoxicity (Xia et al. 2008; Sharma et al. 2009;De Berardis et al. 2010; Huang et al. 2010; Song et al. 2010). Thecontribution of the size and shape to the mammalian cytotox-icity of different ZnO NPs has also been reported, but differentconclusionshavebeen reached (Lin et al. 2009;Denget al. 2009;Hsiao & Huang 2011).
A limited amount of studies have been carried out in aquaticorganisms and fish cell lines. It has been reported that ZnONPsare toxic to isolated trout hepatocytes (Scown et al. 2010),Daphnia magna (Adams et al. 2006, Heinlaan et al. 2008) aswell as zebrafish embryos and larvae (Zhu et al. 2008, 2009).Acute toxicity studies of ZnO NPs and bulk ZnO in differentmarine organisms such as algae, crustaceans andmedaka fish,concluded that the toxicity of ZnO NPs could be mainly attrib-uted todissolvedZn ions (Franklin et al. 2007;Wonget al. 2010).However, other authors ascribed the toxicity also to ZnO NPsand the bulk ZnO themselves. This was the case in adultzebrafish (Xiong et al. 2011), Daphnia magna (Wiench et al.2009), the bacterium Vibrio fischeri, the branchipod Thamno-cephalus platyurus (Heinlaan et al. 2008) and the microalgaPseudokirchneriella subcapitata (Aruoja et al. 2009).
The main objective of this work was to determine if ZnONPs exhibit differences in their mechanisms of toxic action ina fish and in amammalian hepatoma cell line. These cell lineshave been selected because the liver plays an essential role indetoxification processes and because this organ has beenidentified as one of the major target organs of NPs, partic-ularly in fish (Handy et al. 2008a, b; Kashiwada 2006). For fish,the PLHC-1 cell line has been chosen because culture con-ditions (30�C, 5% CO2 atmosphere) are closer to those of mostof the mammalian hepatoma cell lines used up until now incytotoxicity studies. A battery of cytotoxicity assays coveringdifferent mechanisms of toxicity has been employed. In orderto better characterise thesemechanisms, the observed toxicitywas related to the size and the shape of the NPs and with thepossible effect of the fraction corresponding to the dissolvedNPs. In addition to the usual cytotoxicity assays, LUCS (light-up cell signal), a new fluorescent method addressing DNAalteration status has been used. This method relies on thelight-induced fluorescence intensity enhancement of a DNAbinding dye. It has been recently applied with success incytotoxicity studies using Hep G2 cells (Derick et al. 2009).This assay was utilised in this work in order to acquire newcytotoxicity information at the DNA level, as well as toevaluate its sensitivity and possible application in fish cells.
Methods
ParticlesThree commercial ZnO NPs differing in size were tested andcompared with the bulk material. The ZnO fine powder <5 mm
(99.9% purity), ZnO nanopowder <100 nm and ZnO nano-powder 6% aluminium-doped <50 nm (BET) (97% purity)(referred to in this work as ZnO, nZnO-1 and nZnO-2, respec-tively) were purchased from Sigma-Aldrich (Madrid, Spain).The ZnO nanopowder 20–30 nm (BET) (referred to as nZnO-3)was from Tecnan (Madrid, Spain).
ChemicalsUltraglutamine 1 (200 mM), L-glutamine (200 mM), fetalbovine serum (FBS), penicillin and streptomycin (P/S)(10 000 U/ml/10 mg/ml), non-essential amino acids 100X(NEAA), cell culture EMEM (Eagle’s Minimum EssentialMedium) and a-MEM (Alpha-Minimum Essential Medium)media were purchased from Lonza (Barcelona, Spain).4,5-Dimethylthiazoyl-(2-yl)-2,5-diphenyltetrazolium bromide(MTT), neutral red (NR) solution (0.33%), 6-carboxy-2¢7¢-dichlorofluorescein diacetate (DCFH-DA), chloramine-T trihydrate, 2-propanol and glacial acetic acid were fromSigma-Aldrich (Madrid, Spain). Ethanol was from Panreac(Barcelona, Spain). EvaTOX kit (Evakit; 5 mM solution inDMSO) for LUCS assay was from Novaleads (Ramonville,France). Trace analysis grade nitric acid 65% (Scharlau,Madrid, Spain) was purified by sub-boiling distillation ina Milestone Duopur (Milestone Srl., Italy).
Cell cultureThe fish and the human hepatocellular carcinoma cell lines,PLHC-1 (derived from topminnow fish (Poeciliopsis lucida)and Hep G2 were obtained from the American Type CultureCollection (ATTC) (Manassas, VA, USA). The PLHC-1 cellline was cultured in a-MEM supplemented with 5% FBS, 1%P/S and 1% L-glutamine. Hep G2 cells were cultured inEMEM supplemented with 10% FBS, 1% P/S, 1% ultraglu-tamine and 1% NEAA. PLHC-1 and Hep G2 cells were grownin a 5% CO2 atmosphere at 30 and 37�C, respectively.
Exposure to NPsPLHC-1 and Hep G2 cells were seeded in 96-well plates(Costar, VWR, Spain) at an initial cell number of 5 � 104 and7.5 � 104 cells/well, respectively. After 24 h, the cells wereexposed to serial dilutions (0.78–100 mg/ml) of the fourdifferent ZnO particles. Particle suspensions of 100 mg/mlwere prepared in serum-free medium and vortexed for 1 minjust before applying them to the cells. In order to investigateto which extent the dissolved ZnO fraction, in which Zn ionsreleased from the particle surface may be present, contri-butes to the cytotoxicity, both cell lines were exposed to thesupernatants of centrifuged ZnO particle suspensions. Thesesupernatants were prepared with a 100 mg/ml particle sus-pension in serum-free medium and incubated for 24 h at30 or 37�C to reproduce the time of exposure to the NPs.Subsequently, these suspensions were centrifuged for 10minat 1000 g (Orto Alresa, Lince R). After the 24-h exposureperiod, the treated cells were analysed for cytotoxic effects bymeans of different assays.
Particle characterisationParticle characterisation was performed on all the particlesuspensions obtained after serial half dilutions of the initial
M. L. Fernández-Cruz et al.
Nan
otox
icol
ogy
Dow
nloa
ded
from
info
rmah
ealth
care
.com
by
Rye
rson
Uni
vers
ity o
n 04
/28/
13. F
or p
erso
nal u
se o
nly.
one (100 mg/ml) in serum-free culture medium. This particlecharacterisation was also performed in the supernatantsobtained after centrifugation of the 100 mg/ml particle sus-pensions. To select the speed of centrifugation, initially100 mg/ml particle suspensions were centrifuged at 1000 gfor 10 min or at 180 000 g for 1 h, after a 24-h incubationperiod at 30 or 37�C (to imitate exposure conditions). Aftercentrifugation Zn concentration was measured in superna-tants by means of inductively coupled plasma mass spec-trometry (ICP-MS). Since differences in the Zn concentrationbetween both supernatants were negligible, in order tofacilitate the experimental work, cell exposure and furtherdetailed characterisation were performed only in thesupernatant obtained after centrifugation at 1000 g.
Transmission electron microscopyTransmission electron microscopy (TEM) was performed tomorphologically characterise the particle suspensions. Bothpristine particles as well as particles incubated in serum-free culture media for 24 h at 30 or 37�C were analysed. Thesamples were prepared by dropping aliquots of the particlesuspensions onto carbon-coated copper grids and leavingthe solvent to evaporate. Subsequently, the samples wereanalysed using a JEOL 2100 HT (JEOL Ltd., Japan) operatedat an accelerating voltage of 200 kV with integrated energydispersive X-ray (EDX) spectroscopy (Oxford Inca). The sizeof the particles (ferret diameter) in the TEMmicrographs wasmeasured using the image processing and analysis softwareImageJ (National Institutes of Health, USA).
Dynamic light scatteringDynamic light scattering (DLS) was used as a method todetermine the hydrodynamic size of the particles in solution,using a Zetasizer Nano-ZS (Malvern Instruments Ltd., UK).Measurements were performed in the suspensions and inthe supernatants at different concentrations directly afterpreparation and after 24 h incubation at 30 or 37�C. Mediumwithout particles was used as a control and to record anybackground signals that may arise from medium compo-nents. Before preparing the samples the instrument temper-ature was set to 37�C for EMEM preparations and to 30�C fora-MEM preparations. Four independent measurementswere taken with each measurement consisting of six runs,each of 20 s duration.
Inductively coupled plasma mass spectrometryThe Zn concentration in each well of the treated plates, theoriginal particle suspension (100 mg/ml) and the superna-tants obtained after centrifugation of the original particlesuspension at 1000 g for 10 min or after ultracentrifugation at180 000 g for 2 h was determined by means of an ICP-MS Thermo X-Series II (Thermo Scientific, Bremen,Germany) equipped with a quadrupole mass analyser andan electron multiplier detector. A Meinhard nebuliser withScott (Ryton) spray chamber (Elemental Scientific Inc.,Omaha, NE, USA) and a peristaltic pump were used forsample introduction. The optimisation of plasma-operatingparameters and mass calibration were performed with acertified multi-element solution Tune A (As, Ba, Be, Bi,
Ce, Co, In, Li, Ni, Pb and U) supplied by Analytika Ltd.(Czech Republic). The sample solutions were quantified byexternal calibration; three isotopes of Zn (64Zn, 66Zn and68Zn) were used for measurements to discard the presence ofisobaric interferences. An internal standard (Ga) was used inorder to check instrumental stability and to correct potentialeffects of the matrix on the signal. Calibration standardsolutions of Zn and internal standard solution of Ga wereprepared daily with the appropriate dilution of 1000 mg/l Znin 2% (v/v) and 1000 mg/l Ga in 2% (v/v) stock standardsolutions (Alfa Aesar, Ward Hill, MA, USA), respectively.High purity water (>18 MW cm-1) obtained from a Milli-Q Element A10 Century (Millipore Ibérica, Spain) was used.For the analysis of Zn concentrations in the exposed cells, themedium from each well was transferred into polypropyleneflasks. The wells were washed twice with nitric acid 2% (v/v)for the digestion of the cells and for collecting the remainingZnO NPs present in the wells. The rinses were added to therespective sample media, and the latter filled up with nitricacid 2% (v/v) to a final volume of 10 ml. Just before ICP-MS analysis, samples were ultrasonicated for 5 min. Limits ofdetection (LOD) and limits of quantification (LOQ) werecalculated as being 3 and 10 times the standard deviation ofthe blank, respectively, considering as such the Hep G2 andPLHC-1 media, prepared as the samples. The LOD for thethree isotopes ranged from 0.21 to 0.32 mg/l and the LOQfrom 0.71 to 1.1 mg/l. The instrumental response was linearover the calibration range used for the measurements from0.1 to 100 mg/l, with a relative standard deviation (RSD) <2%.
Cytotoxicity assaysMTT and NRU assayThe MTT assay evaluates the mitochondrial activity and wasperformed according to the method of Mosmann (1983)based on the enzymatic conversion of the MTT tetrazoliumsalts to formazan crystals. The neutral red uptake (NRU) assaywas used to determine the lysosomal membrane integrityfollowing Borenfreund and Puerner (1985). After exposure,themediumwas replacedwith 100 ml of phenol red-freeMEMcontaining MTT (0.5 mg/ml) or NR (0.1 mg/ml). The plateswere incubated for 2 or 4 h, respectively. The formazancrystals were dissolved by adding isopropanol whereas theretained NR dye was extracted with 1% glacial acetic acid in50% ethanol. The absorbance was measured at 570 or550 nm (MTT or NRU, respectively) using a microplatereader (Genios, TECAN, Männedorf, CH). Results wereexpressed as percentage of the control.
Lactate dehydrogenase leakageThe leakage of the cytoplasm enzyme lactate dehydrogenase(LDH) is commonly used as an indicator of xenobiotic-related damage of the cellular membrane. After the 24-hexposure period, the LDH activity in the medium and thecells was measured following the method of Liu et al. (2010).Culture medium was removed and stored at 4�C for imme-diate analysis. Cells were washed with phosphate bufferedsaline (PBS) and the plates frozen by immersion in liquidnitrogen and stored at -20�C for 1 h to obtain a cell lysate.LDH enzymatic activity was measured in both the culture
Cytotoxicity of ZnO nanoparticles
Nan
otox
icol
ogy
Dow
nloa
ded
from
info
rmah
ealth
care
.com
by
Rye
rson
Uni
vers
ity o
n 04
/28/
13. F
or p
erso
nal u
se o
nly.
medium and the cell lysate. In this method, LDH catalysesthe reduction of pyruvate to lactate with simultaneous oxi-dation of NADH to NAD+. The rate of NADH decrease, whichis directly proportional to LDH activity, was measured at340 nm in a temperature-controlled microplate reader set to30 or 37�C for PLHC-1 or Hep G2, respectively. The quantityof LDH leaked from the cells into the culture medium wasexpressed as percentage of the total amount of LDHdetermined in the medium and cell samples.
LUCS assayNucleic acid alterations were measured by means of theNovaleads LUCS assay, according to Derick et al. (2009).EvaTOX quantifies alterations in DNA organisation. Thisassay is based on the LUCS process patented method(PCT/EP2009/050235). Briefly, cells are exposed to a propri-etary fluorescent DNA dye solution (EvaKit). Under normal(untreated) conditions, the combined effect of LED-based light (10 s) on a DNA-bound fluorescent dye leadsto a fluorescent intensity enhancement, an effect that is lostafter DNA damage response. For this assay, the cells wereseeded into black 96-well plates (Greiner, Dismalab, Madrid,Spain). After 24 h of exposure, the mediumwas removed andreplaced by 100 ml of a 4 mM EvaKit stain solution (preparedin serum-free culture medium). Subsequently, thePLHC-1 and Hep G2 cells were incubated at the correspond-ing temperature for 20 or 30 min, respectively. A first readingof the fluorescence (R1) was done at 485 nm excitation and535 nm emissions in a microplate reader. The cells wereilluminated for 10 s at 470 nm with a LED-based device(LED-based aDAPter, Novaleads, Ramonville, Fr). The fluo-rescence was then read over 20 min at 1 min intervals. Fordata analysis, the values obtained at the time at which nofurther increase in fluorescence occurred (usually after 10–15min; R2) were divided by the respective values obtained inR1. In order to compare data, R2/R1 ratios were normalisedbetween 0 and 100% considering the control R2/R1 value as100% andR2/R1 = 1 as 0%.
ROS assayIntracellular ROS production was determined by using thedichlorofluorescein (DCF) assay (Wang & Joseph 1999).DCFH-DA (100 mM) in phenol red and serum-free EMEMmedium was added after the incubation period and main-tained during 30 min at 37�C in the dark. Chloramine-T, aneffective inducer of oxidative stress, was used as a positivecontrol, with cells being exposed to concentrations in therange of 0.3–10 mM for 24 h. Fluorescence was measured at485 nm excitation and 535 nm emission at 37�C using amicroplate reader. Fluorescence readings were taken every15 min for 60 min with the plates being incubated at 37�Cwith 5% CO2 between measurements. Oxidative stress wasexpressed as the percentage increase in fluorescence over a60-min period.
Statistical analysesData are represented as mean ± standard error of the mean(SEM) of three to five independent experiments (in each
experiment, each concentration was applied by triplicatein the culture plates). Significant differences among treat-ments were determined by one-way repeated measuresanalysis of variance (RMANOVA, p < 0.05). Previously,normality of the distribution was checked by means ofthe Shapiro-Wilk test and homoscedasticity by means ofBartlett’s test. Means of treatments were contrasted withrespect to the control group using Dunnett’s test. Forpairwise comparisons, a Student’s t-test was used. Thestatistics were performed with the GraphPad Prism version4.00 program for Windows (GraphPad Software, SanDiego, CA, USA). The effective concentration for 50%maximal response (EC50) was calculated using SigmaPlot version 8.0 (Jandel Scientific, San Rafael, CA, USA).The estimation of the concentration–response functionand the calculation of the IC50 (concentration causing a50% of inhibition with respect to the controls) were doneby fitting the assay results to a regression model equationfor a sigmoid curve:
y = +max e-[(x-IC50 )/b]
) + min/(1
Where max is the maximal response observed, b is the slopeof the curve and min the minimal response.
Results
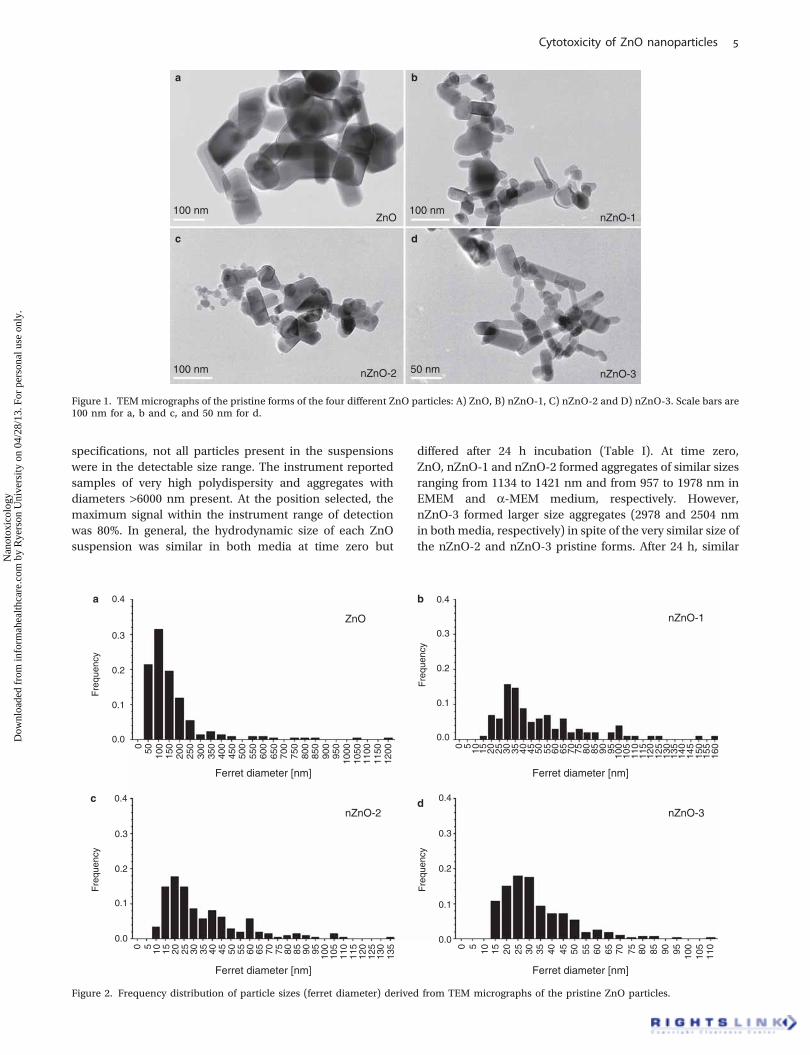
Characterisation of ZnO particlesTEM analysisTEManalysiswas performed to determine themorphology andthe size distribution of ZnO particles. TEM micrographs ofpristineZnOparticles are shown inFigure 1.Differentmorphol-ogies were observed in the four different ZnO particle powdersused. Three types: polyhedral, rod-like and near-spherical-shaped particles, all showing clear edges and corners coexistedin each sample. Figure 2 shows the size distribution calculatedfrom TEM images. The average length of the ZnO particles was165, 51, 35 and 33 nm, for ZnO, nZnO-1, nZnO-2 and nZnO-3,respectively, with amedian of 120, 40, 27 and 29 nm and a 75%percentile of 181, 66, 44 and 41 nm. ZnO particles incubated inEMEM and a-MEM media were also analysed by TEM(Figure 3). The TEM images were acquired after 24 h of incu-bation of the 100 mg/ml suspensions in media at 37 or 30�C(Figure3). Somedifferenceswith respect to thepristineparticles(Figure 1) were observed. In general, the particles in the culturemediapresentedconsiderablymoreaggregationandweremoreirregular in shape with corners less defined than the primarypowder.TheEDXspectrumof theZnOparticlesuspendedintheEMEM medium clearly indicated the presence of calciumtogether with zinc (Figure 4).
Dynamic light scatteringDLS was used to measure the hydrodynamic sizes of theparticles in the culture media used for exposures. Measure-ments could only be obtained for concentrations ‡25 mg/ml. Inaddition, size distribution profiles were similar at each con-centration. Therefore, only the hydrodynamic sizes and sizedistribution widths of the highest concentration (100 mg/ml)are presented in Table I. According to the instrument
M. L. Fernández-Cruz et al.
Nan
otox
icol
ogy
Dow
nloa
ded
from
info
rmah
ealth
care
.com
by
Rye
rson
Uni
vers
ity o
n 04
/28/
13. F
or p
erso
nal u
se o
nly.
specifications, not all particles present in the suspensionswere in the detectable size range. The instrument reportedsamples of very high polydispersity and aggregates withdiameters >6000 nm present. At the position selected, themaximum signal within the instrument range of detectionwas 80%. In general, the hydrodynamic size of each ZnOsuspension was similar in both media at time zero but
differed after 24 h incubation (Table I). At time zero,ZnO, nZnO-1 and nZnO-2 formed aggregates of similar sizesranging from 1134 to 1421 nm and from 957 to 1978 nm inEMEM and a-MEM medium, respectively. However,nZnO-3 formed larger size aggregates (2978 and 2504 nmin bothmedia, respectively) in spite of the very similar size ofthe nZnO-2 and nZnO-3 pristine forms. After 24 h, similar
a b
c d
100 nm
100 nm 50 nm
100 nmnZnO-1
nZnO-3nZnO-2
ZnO
Figure 1. TEM micrographs of the pristine forms of the four different ZnO particles: A) ZnO, B) nZnO-1, C) nZnO-2 and D) nZnO-3. Scale bars are100 nm for a, b and c, and 50 nm for d.
Figure 2. Frequency distribution of particle sizes (ferret diameter) derived from TEM micrographs of the pristine ZnO particles.
Cytotoxicity of ZnO nanoparticles
Nan
otox
icol
ogy
Dow
nloa
ded
from
info
rmah
ealth
care
.com
by
Rye
rson
Uni
vers
ity o
n 04
/28/
13. F
or p
erso
nal u
se o
nly.
sizes as in time zero could be observed for ZnO andnZnO-1 particles in both media. The nZnO-2 NPs werefound to form aggregates of similar size than nZnO-3 NPsin the EMEM medium (2166 and 2481 nm, respectively).However, these later NPs behaved very differently in thea-MEM after 24 h. The nZnO-2 NPs seemed tode-agglomerate (from 1978 to 1091 nm), whereas thenZnO-3 increased considerably its size (from 2504 to3753 nm). Since the apparatus indicated a very high degreeof polydispersity, smaller particles could be present but theirsignal may be overshadowed by these bigger ones.
DLS measurements were also taken from the superna-tants of the particle suspensions following centrifugation at1000 g for 10 min. After centrifugation, a pellet of particles
was evident on visual inspection. Control media were alsoincubated for 24 h and centrifuged as described. Accordingto the DLS profiles of the control media (Figure 5), somemedium components could be detected at very low intensity.These profiles could be used as background controls todistinguish medium components from possible ZnO parti-cles remaining in solution after centrifugation. Both mediumcontrols presented different distribution profiles that differedfrom the particle profiles in the supernatants indicating thepresence of NPs. In a-MEM medium, a particle populationfrom approximately 30–100 nm could be measured for thefour NPs that didn’t appear in the medium control. In theEMEM, this clear difference could not be observed, exceptfor the nZnO-3 NPs that exhibited a population between
a
200 nm
200 nm
100 nm 100 nm
50 nm 50 nm
200 nm
100 nmZnO/α-MEM
ZnO-1/α-MEM
nZnO-2/α-MEM
nZnO-3/α-MEM
ZnO/EMEM
nZnO-1/EMEM
nZnO-2/EMEM
nZnO-3/EMEM
e
b f
c g
d h
Figure 3. TEM images of ZnO particles after incubation in different cell culture media: A, B, C and D) ZnO, nZnO-1, nZnO-2 and nZnO-3 incubatedfor 24 h in a-MEM, respectively; E, F, G and H) ZnO, nZnO-1, nZnO-2 and nZnO-3 incubated for 24 h in EMEM, respectively. The white circle in E)marks the particle, which was exemplarily analysed by EDX spectroscopy (cf. Figure 4). The scale bars are 200 nm for a, b and f, 100 nm for c, e and gand 50 nm for d and h.
M. L. Fernández-Cruz et al.
Nan
otox
icol
ogy
Dow
nloa
ded
from
info
rmah
ealth
care
.com
by
Rye
rson
Uni
vers
ity o
n 04
/28/
13. F
or p
erso
nal u
se o
nly.
50 and 200 nm and for the bulk ZnO with a population downaround 20–50 nm, albeit, at relatively low intensity (Figure 5).
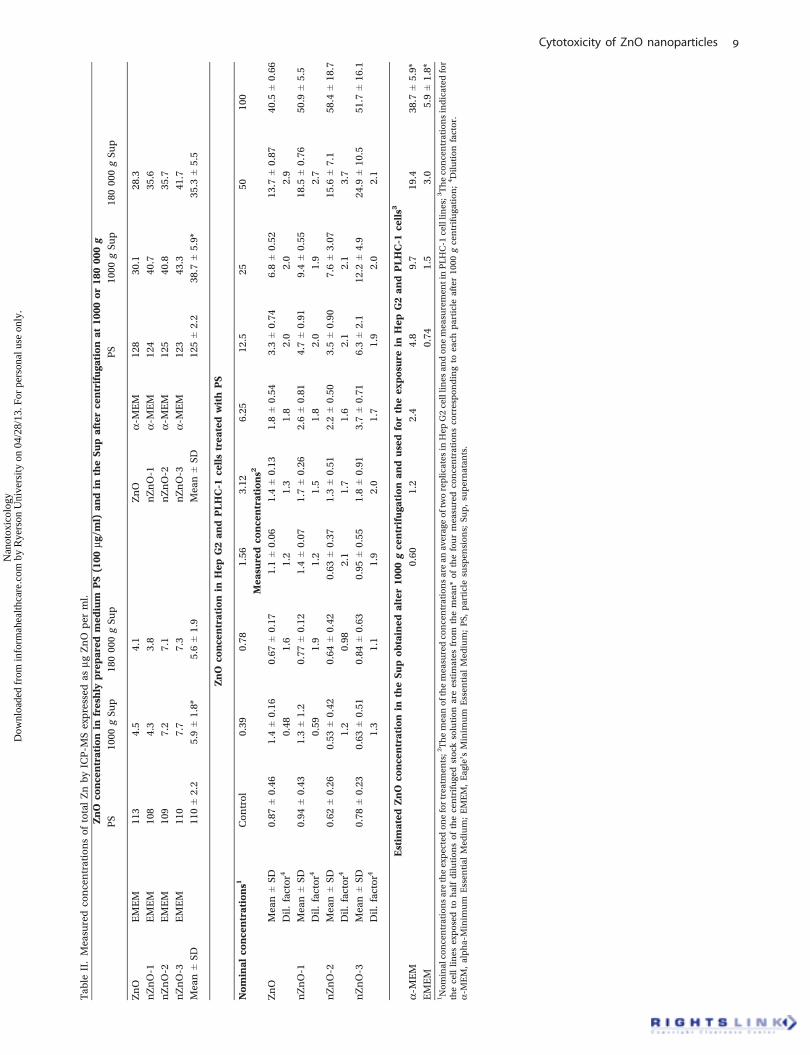
ICP-MS analysisTotal concentration of ZnO in the 100 mg/ml particle stocksuspensions ranged between 108 and 128 mg/ml (Table II).The different 100 mg/ml suspensions were maintained for24 h at 30 or 37�C to reproduce the conditions of exposureand then centrifuged at 1000 g or ultracentrifuged at 180 000g. Total ZnO concentrations were measured in both super-natants and were found to be similar, indicating that evenultracentrifugation is not able to remove the dissolved frac-tion further. The concentration of Znmeasured by ICP-MS inthe supernatants and expressed as ZnO ranged from 3.8 to7.7 mg/ml in the Hep G2 medium (EMEM) and from 28.3 to43.3 mg/ml in the PLHC-1 medium (a-MEM) (Table II). Tocompare the toxic effects produced by the dissolved NPsand/or Zn ions, cells were exposed to serial half dilutions ofonly the centrifuged (1000 g) stock solutions. The concen-trations of ZnO, as prepared by serial dilutions of the stocksuspensions and subsequently used to treat the cells, arepresented in Table II. These concentrations were obtained bymeasuring the level of Zn present in each well after the assaywas performed in both cell lines (Hep G2 (two repetitions)and in PLHC-1). The concentrations in both assays weresimilar and reproducible data were obtained between repli-cates. The mean and standard deviation of these measure-ments are presented in Table II. The most limiting step isachieving a concentration of 100 mg/ml in the highest expo-sure concentration well. Wemeasured a loss of 50–60% of theconcentration probably due to the rapid sedimentation ofthe non-dissolved NPs and aggregates during the 100 mlaliquot collection from the stock suspension for cell expo-sure. Just after shaking the stock suspensions, we couldobserve a deposition of non-dissolved NPs beginning after20 s and a clear precipitate in less than 60 s. Despite a twofoldserial dilution, the real concentrations were 1.7–3.7 times
lower than expected. The lower nominal doses (0.39,0.78 and 1.56 mg/ml) exhibited a similar measured concen-tration as those from the controls. Zn is an importantelement required by many cellular enzymes and it is presentin relatively high background levels in cells and tissues. SinceICP-MS cannot distinguish between ZnO and any other formof Zn present in the cells, therefore, lower ZnO particle dosesmay be hidden by background levels of Zn in cells. Theconcentrations indicated in Table II for the cell lines exposedto half dilutions of the centrifuged stock solutions are esti-mates from those measured in the supernatants of the stocksolution. The results indicate that PLHC-1 cells have beenexposed to very similar concentrations before and aftercentrifugation, contrary to Hep G2 cell line, which havebeen exposed to lower concentrations after centrifugation.
Cytotoxicity of ZnO particles to PLHC-1 and Hep G2 celllinesMTT reductionThe cytotoxicity of the suspensions of the four ZnO particlesas well as of the supernatants obtained after centrifugation isshown in Figure 6. Real concentrations are indicated inbrackets together with nominal concentrations in the textand in the figures. In the PLHC-1 cell line, the bulk materialsand the three NP suspensions provoked a significant reduc-tion of cell viability (Figure 6A) with non-observed effectconcentrations (NOECs) values of 25 (7), 12.5 (5), 6.25 (2)and 12.5 (6) mg/ml for ZnO, nZnO-1, nZnO-2 and nZnO-3,respectively. In the case of the Hep G2 cells (Figure 6B),NOEC values of 25 (7), 25 (9), 25 (7) and 12.5 (6) mg/ml wereobtained after exposure to the suspensions for ZnO, nZnO-1,nZnO-2 and nZnO-3, respectively. Thus, differences betweenPLHC-1 and Hep G2 cells in NOEC values appeared only fornZnO-1 and nZnO-2. In addition, no significant differencesin cytotoxicity between both cells lines were observed exceptat the highest concentration (Figure 6A and 6B). At thisconcentration, loss in cell viability detected in Hep G2 was
ZnZn
Zn
o
CCuCu
CuCu
Cu ZnCu
CaCa
Zn
ZnCu
Ca
Figure 4. EDX spectrum of the surface of a ZnO particle incubated for 24 h in cell culture medium (cf. Figure 3E, white circle).
Cytotoxicity of ZnO nanoparticles
Nan
otox
icol
ogy
Dow
nloa
ded
from
info
rmah
ealth
care
.com
by
Rye
rson
Uni
vers
ity o
n 04
/28/
13. F
or p
erso
nal u
se o
nly.
much stronger than in PLHC-1 cells, with significantly lowervalues in the bulk material, nZnO-1 and nZnO-3.PLHC-1 cells exposed to the supernatants also exhibitedsignificant decreases in cell viability resulting in NOECvalues of 25 (10), 12.5 (5), 25 (10), and 25 (10) mg/ml forZnO, nZnO-1, nZnO-2 and nZnO-3, respectively (Figure 6C).In the case of Hep G2 cells treated with the supernatants, the
NOEC values detected were 50 (3), 50(3), 100 (6) and 100 (6)mg/ml for ZnO, nZnO-1, nZnO-2 and nZnO-3, respec-tively (Figure 6D). Taking into account the NOECvalues obtained for measured concentrations (Table III),PLHC-1 cells were similarly sensitive to the suspensionsand the dissolved fraction, except for nZnO-2 where thenon-dissolved fraction (aggregates and suspended NPs)
Table I. Particle sizes (nm) measured by DLS in EMEM and a-MEM media immediately after preparation and 24 h after incubation under therespective culture conditions.
EMEM medium (Hep G2 cells) a-MEM medium (PLHC-1 cells)
Figure 5. DLS size distribution profile of the supernatants obtained by centrifugation (1000 rpm for 10 min) of the ZnO particle suspensionsprepared in EMEM and a-MEM medium (100 mg/ml) incubated for 24 h at 37 and 30�C, respectively.
M. L. Fernández-Cruz et al.
Nan
otox
icol
ogy
Dow
nloa
ded
from
info
rmah
ealth
care
.com
by
Rye
rson
Uni
vers
ity o
n 04
/28/
13. F
or p
erso
nal u
se o
nly.
Tab
leII.Measuredco
ncentrationsof
totalZnbyICP-M
Sexpressed
asmg
ZnO
per
ml.
ZnO
concentrationin
freshly
prepared
med
ium
PS(100
mg/m
l)an
din
theSu
paftercentrifuga
tion
at10
00or
18000
0g
PS
1000
gSu
p18
000
0gSu
pPS
1000
gSu
p18
000
0gSu
p
ZnO
EMEM
113
4.5
4.1
ZnO
a-MEM
128
30.1
28.3
nZnO-1
EMEM
108
4.3
3.8
nZnO-1
a-MEM
124
40.7
35.6
nZnO-2
EMEM
109
7.2
7.1
nZnO-2
a-MEM
125
40.8
35.7
nZnO-3
EMEM
110
7.7
7.3
nZnO-3
a-MEM
123
43.3
41.7
Mean±SD
110±2.2
5.9±1.8*
5.6±1.9
Mean±SD
125±2.2
38.7
±5.9*
35.3
±5.5
ZnO
concentrationin
Hep
G2an
dPLHC-1
cellstrea
tedwithPS
Nom
inal
concentrations1
Con
trol
0.39
0.78
1.56
3.12
6.25
12.5
2550
100
Mea
suredco
ncentrations2
ZnO
Mean±SD
0.87
±0.46
1.4±0.16
0.67
±0.17
1.1±0.06
1.4±0.13
1.8±0.54
3.3±0.74
6.8±0.52
13.7
±0.87
40.5
±0.66
Dil.factor
40.48
1.6
1.2
1.3
1.8
2.0
2.0
2.9
nZnO-1
Mean±SD
0.94
±0.43
1.3±1.2
0.77
±0.12
1.4±0.07
1.7±0.26
2.6±0.81
4.7±0.91
9.4±0.55
18.5
±0.76
50.9
±5.5
Dil.factor
40.59
1.9
1.2
1.5
1.8
2.0
1.9
2.7
nZnO-2
Mean±SD
0.62
±0.26
0.53
±0.42
0.64
±0.42
0.63
±0.37
1.3±0.51
2.2±0.50
3.5±0.90
7.6±3.07
15.6
±7.1
58.4
±18
.7
Dil.factor
41.2
0.98
2.1
1.7
1.6
2.1
2.1
3.7
nZnO-3
Mean±SD
0.78
±0.23
0.63
±0.51
0.84
±0.63
0.95
±0.55
1.8±0.91
3.7±0.71
6.3±2.1
12.2
±4.9
24.9
±10
.551
.7±16
.1
Dil.factor
41.3
1.1
1.9
2.0
1.7
1.9
2.0
2.1
Estim
ated
ZnO
concentrationin
theSu
pob
tained
alter10
00gcentrifuga
tion
andusedfortheex
posure
inHep
G2an
dPLHC-1
cells3
a-MEM
0.60
1.2
2.4
4.8
9.7
19.4
38.7
±5.9*
EMEM
0.74
1.5
3.0
5.9±1.8*
1Nom
inalco
ncentrationsaretheexpectedon
efortreatm
ents;2Themeanof
themeasuredco
ncentrationsarean
averageof
tworeplicatesin
Hep
G2celllines
andon
emeasuremen
tinPLH
C-1
celllines;3Theco
ncentrationsindicated
for
thecelllines
exposed
tohalfdilution
sof
thecentrifugedstoc
ksolution
areestimates
from
themean*of
thefourmeasuredco
ncentrationsco
rrespon
dingto
each
particleafter10
00gcentrifugation
;4Dilution
factor.
a-MEM,alpha-Minim
um
Essen
tial
Med
ium;EMEM,Eagle’s
Minim
um
Essen
tial
Med
ium;PS,
particlesuspen
sion
s;Su
p,supernatan
ts.
Cytotoxicity of ZnO nanoparticles
Nan
otox
icol
ogy
Dow
nloa
ded
from
info
rmah
ealth
care
.com
by
Rye
rson
Uni
vers
ity o
n 04
/28/
13. F
or p
erso
nal u
se o
nly.
150 ZnO nZnO-1
Particle exposure - PLHC-1 - MTT
nZnO-2 nZnO-3
ZnO nZnO-1
Particle exposure - Hep G2 - MTT
nZnO-2 nZnO-3
ZnO nZnO-1
Supernatant exposure - Hep G2 - MTT
nZnO-2 nZnO-3
ZnO nZnO-1
Supernatant exposure - Hep G2 - MTT
ZnO concentration [mg/ml)
nZnO-2 nZnO-3
125
100
75
50C
ell v
iab
ility
(%
)
250.
78 (0
)1.
56 (0
)3.
13 (1
)6.
25 (2
)12
.5 (3
)25
(7)
50 (1
4)10
0 (4
0)
100
(51)
50 (1
8)
25 (9
)
12.5
(5)
6.25
(3)
3.13
(2)
1.56
(0)
0.78
(0)
100
(58)
50 (1
6)
25 (7
)
12.5
(3)
6.25
(2)
3.13
(1)
1.56
(0)
0.78
(0)
100
(52)
50 (2
5)
25 (1
2)
12.5
(6)
6.25
(4)
3.13
(2)
1.56
(0)
0.78
(0)
0.78
(0)
1.56
(0)
3.13
(1)
6.25
(2)
12.5
(3)
25 (7
)50
(14)
100
(40)
100
(51)
50 (1
8)
25 (9
)
12.5
(5)
6.25
(3)
3.13
(2)
1.56
(0)
0.78
(0)
100
(58)
50 (1
6)
25 (7
)
12.5
(3)
6.25
(2)
3.13
(1)
1.56
(0)
0.78
(0)
100
(52)
50 (2
5)
25 (1
2)
12.5
(6)
6.25
(4)
3.13
(2)
1.56
(0)
0.78
(0)
0.78
(0)
1.56
(0)
3.13
(1.2
)6.
25 (2
.5)
12.5
(5)
25 (1
0)50
(20)
100
(40)
100
(40)
50 (2
0)
25 (1
0)
12.5
(5)
6.25
(2.5
)
3.13
(2)
1.56
(0)
0.78
(0)
100
(40)
50 (2
0)
25 (1
0)
12.5
(5)
6.25
(2.5
)
3.13
(1.2
)
1.56
(0)
0.78
(0)
100
(40)
50 (2
0)
25 (1
0)
12.5
(5)
6.25
(2.5
)
3.13
(1.2
)
1.56
(0)
0.78
(0)
0.78
(0)
1.56
(0)
3.13
(0)
6.25
(0)
12.5
(0)
25 (1
.5)
50 (3
)10
0 (6
)
100
(6)
50 (3
)
25 (1
.5)
12.5
(0)
6.25
(0)
3.13
(0)
1.56
(0)
0.78
(0)
100
(6)
50 (3
)
25 (1
.5)
12.5
(0)
6.25
(0)
3.13
(0)
1.56
(0)
0.78
(0)
100
(6)
50 (3
)
25 (1
.5)
12.5
(0)
6.25
(0)
3.13
(0)
1.56
(0)
0.78
(0)
0
150
125
100
75
50
Cel
l via
bili
ty (
%)
25
0
150
125
100
75
50
Cel
l via
bili
ty (
%)
25
0
150
125
100
75
50
Cel
l via
bili
ty (
%)
25
0
a
b
C
d
α
αααα
ααα
αα
Figure 6. Cytotoxicity of ZnO particles suspensions and supernatants in PLHC-1 and Hep G2 cells after 24 h exposure as determined with the MTTassay. Results are expressed as percentage of viability compared with the control. The measured concentration that corresponds to each nominalconcentration is shown in brackets. A value of zero indicates that the measured concentrations were similar to those measured in control mediawithout ZnO. Data are represented as the mean ± SEM of at least three independent experiments. Different symbols are used to indicate statisticalsignificant differences (simple, double and triple superscripts correspond to p < 0.05, p < 0.01 and p < 0.001, respectively), asterisks (*) are used toindicate differences with respect to the controls, a is used to indicate differences between both cell lines.
M. L. Fernández-Cruz et al.
Nan
otox
icol
ogy
Dow
nloa
ded
from
info
rmah
ealth
care
.com
by
Rye
rson
Uni
vers
ity o
n 04
/28/
13. F
or p
erso
nal u
se o
nly.
produced a higher toxicity. By contrast, Hep G2 cells weremore responsive to the dissolved ions and NPs (Table III).The relatively weak toxic effect that the studied ZnO particlesprovoked in the PLHC-1 cells did not allow a full dose–response curve to be established and the calculation ofrespective IC50 values (Table IV). Thus, the different-sized ZnO particles could not be ranked in terms of theirabsolute toxicity towards PLHC-1. This analysis could beperformed with the results following exposures in the HepG2 cell line. The IC50 calculated with the nominal concen-trations for ZnO, nZnO-1, nZnO-2 and nZnO-3 were 53.6,48.9, 65.2 and 34.0 mg/ml, respectively, showing thenZnO-3 as the most toxic (Table IV). However, the IC50
for real concentrations were 16.3, 18.6, 26.6 and 16.7 mg/ml, showing a similar toxicity for the NPs and the bulkmaterial (Table IV).
NR uptakeThe cytotoxicity after exposure of the fish and the humanhepatoma cell lines to the suspended and centrifuged ZnOsuspensions measured by the NR assay is shown in Figure 7.The NOECs for the PLHC-1 cells exposed to the particlesuspensions were 25 (7), 50 (18), 25(7) and 25(12) mg/ml forZnO, nZnO-1, nZnO-2 and nZnO-3, respectively (Figure 7A).For Hep G2, the NOECs were 50 (14), 50 (18), 25 (7) and25 (12) mg/ml for ZnO, nZnO-1, nZnO-2 and nZnO-3,respectively (Figure 7B). When the NOECs obtained withthe real concentrations were compared (Table III), thePLHC-1 cells appeared to be more sensitive to the bulkmaterial (7 mg/ml) than the Hep G2 cell line (14 mg/ml)but the NOECs in both cell lines were identical for the threeNPs (18, 7 and 12 mg/ml for nZnO-1, nZnO-2 and nZnO-3,respectively). However, the toxic responses caused bynZnO-2 and nZnO-3 were significantly stronger in HepG2 than in PLHC-1 cells at the highest doses (Figure 7A,
7B). The exposure to the supernatants didn’t produce anycytotoxicity in the PLHC-1 cell line (Figure 7C). The NOECsafter exposure of Hep G2 cells to the supernatants were50 (3) mg/ml for the four particles (Figure 7D). Taking intoaccount the NOEC values obtained for measured concentra-tions (Table III), PLHC-1 cells were more sensitive to thesuspensions than to the dissolved fraction whereas the HepG2 cells were more sensitive to the dissolved fraction. NoIC50 values could be calculated (Table IV).
LDH leakageThe membrane cytotoxic effects of the particle suspensionsand supernatants are shown in Figure 8. The NOECs ofPLHC-1 cells after NP suspension exposure were 25 (7),25 (9), 25 (7) and 25 (12) mg/ml and with the supernatantsexposure, 50 (20), 50 (20), 25 (10) and 25 (10) mg/ml for ZnO,nZnO-1, nZnO-2 and nZnO-3, respectively (Figure 8A, 8C). Forthe Hep G2 cell line, the NOECs after NP suspension exposurewere 12.5 (3), 25 (9), 50 (16) and 25 (12) mg/ml for ZnO,nZnO-1, nZnO-2 and nZnO-3, respectively and with the super-natants 50 (3) mg/ml for the four particles (Figure 8B, 8D).Taking into account the NOECs from real concentrations,the fish cell line was more sensitive to the ZnO andnZnO-1 suspensions than to the corresponding superna-tants. However, these cells responded similarly to the sus-pensions and supernatants of the nZnO-2 and nZnO-3 NPs(Table III). By contrast, the human cell line was moresensitive to the supernatants of the NPs, but showed similarsensitivity to the bulk material suspension and to the corre-sponding supernatant (Table III). As shown in Figure 8,treatment of PLHC-1 and Hep G2 cells with the differentZnO particles resulted in a dose-dependent LDH leakage.Table IV summarises the respective IC50 calculated from thefull dose–response curve obtained. Using nominal concen-trations, the values for PLHC-1 were 43.3, 39.5, 50.5 and
Table III. NOECs obtained for PS and Sup exposures of fish and mammalian cell lines by means of the different cytotoxicity assays taking intoaccount measured concentrations.
MTT NR LDH LUCS
PLHC-1 Hep G2 PLHC-1 Hep G2 PLHC-1 Hep G2 PLHC-1 HEP G2
LDH, lactate dehydrogenase leakage assay; LUCS, light-up cell signal assay; MTT, 4,5-dimethylthiazoyl-(2-yl)-2,5-diphenyltetrazolium bromide reduction assay; nd,IC50 could not be calculated; NR, neutral red uptake assay; PS, particle suspension.
Cytotoxicity of ZnO nanoparticles
Nan
otox
icol
ogy
Dow
nloa
ded
from
info
rmah
ealth
care
.com
by
Rye
rson
Uni
vers
ity o
n 04
/28/
13. F
or p
erso
nal u
se o
nly.
150 ZnO nZnO-1
Particle exposure - PLHC-1 - NR
nZnO-2 nZnO-3
ZnO nZnO-1
Particle exposure - Hep G2 - NR
nZnO-2 nZnO-3
ZnO nZnO-1
Supernatant exposure - PLHC-1- NR
nZnO-2 nZnO-3
ZnO nZnO-1
Supernatant exposure - Hep G2 - NR
ZnO concentration [mg/ml)
nZnO-2 nZnO-3
125
100
75
50C
ell v
iab
ility
(%
)
250.
78 (0
)1.
56 (0
)3.
13 (1
)6.
25 (2
)12
.5 (3
)25
(7)
50 (1
4)10
0 (4
0)
100
(51)
50 (1
8)
25 (9
)
12.5
(5)
6.25
(3)
3.13
(2)
1.56
(0)
0.78
(0)
100
(58)
50 (1
6)
25 (7
)
12.5
(3)
6.25
(2)
3.13
(1)
1.56
(0)
0.78
(0)
100
(52)
50 (2
5)
25 (1
2)
12.5
(6)
6.25
(4)
3.13
(2)
1.56
(0)
0.78
(0)
0.78
(0)
1.56
(0)
3.13
(1)
6.25
(2)
12.5
(3)
25 (7
)50
(14)
100
(40)
100
(51)
50 (1
8)
25 (9
)
12.5
(5)
6.25
(3)
3.13
(2)
1.56
(0)
0.78
(0)
100
(58)
50 (1
6)
25 (7
)
12.5
(3)
6.25
(2)
3.13
(1)
1.56
(0)
0.78
(0)
100
(52)
50 (2
5)
25 (1
2)
12.5
(6)
6.25
(4)
3.13
(2)
1.56
(0)
0.78
(0)
0.78
(0)
1.56
(0)
3.13
(1.2
)6.
25 (2
.5)
12.5
(5)
25 (1
0)50
(20)
100
(40)
100
(40)
50 (2
0)
25 (1
0)
12.5
(5)
6.25
(2.5
)
3.13
(2)
1.56
(0)
0.78
(0)
100
(40)
50 (2
0)
25 (1
0)
12.5
(5)
6.25
(2.5
)
3.13
(1.2
)
1.56
(0)
0.78
(0)
100
(40)
50 (2
0)
25 (1
0)
12.5
(5)
6.25
(2.5
)
3.13
(1.2
)
1.56
(0)
0.78
(0)
0.78
(0)
1.56
(0)
3.13
(0)
6.25
(0)
12.5
(0)
25 (1
.5)
50 (3
)10
0 (6
)
100
(6)
50 (3
)
25 (1
.5)
12.5
(0)
6.25
(0)
3.13
(0)
1.56
(0)
0.78
(0)
100
(6)
50 (3
)
25 (1
.5)
12.5
(0)
6.25
(0)
3.13
(0)
1.56
(0)
0.78
(0)
100
(6)
50 (3
)
25 (1
.5)
12.5
(0)
6.25
(0)
3.13
(0)
1.56
(0)
0.78
(0)
0
150
125
100
75
50
Cel
l via
bili
ty (
%)
25
0
150
125
100
75
50
Cel
l via
bili
ty (
%)
25
0
150
125
100
75
50
Cel
l via
bili
ty (
%)
25
0
a
b
C
d
ααα
α
αα
αα
ααα
α αα
Figure 7. Effects of ZnO particles suspensions and supernatants on PLHC-1 and Hep G2 cell viability after 24 h exposure as determined with theNR assay. Results are expressed as the percentage of viability compared with the control. The measured concentrations corresponding to thenominal concentrations are shown in brackets. A value of zero indicates that the measured concentration was similar to the one measured incontrol media without ZnO. Data are represented as mean ± SEM of at least three independent experiments. Different symbols are used toindicate statistical significant differences (simple, double and triple superscripts correspond to p < 0.05, p < 0.01 and p < 0.001, respectively),asterisks (*) are used to indicate differences with respect to the controls, a for differences between particle suspension exposures for eachconcentration in both cell lines.
M. L. Fernández-Cruz et al.
Nan
otox
icol
ogy
Dow
nloa
ded
from
info
rmah
ealth
care
.com
by
Rye
rson
Uni
vers
ity o
n 04
/28/
13. F
or p
erso
nal u
se o
nly.
ZnO nZnO-1
Particle exposure - PLHC-1 - LDH
nZnO-2 nZnO-3
ZnO nZnO-1
Particle exposure - Hep G2 - LDH
nZnO-2 nZnO-3
ZnO nZnO-1
Supernatant exposure - PLHC-1 - LDH
nZnO-2 nZnO-3
ZnO nZnO-1
Supernatant exposure - Hep G2 - LDH
ZnO concentration [mg/ml)
nZnO-2 nZnO-3
125
100
75
50
250.
78 (0
)1.
56 (0
)3.
13 (1
)6.
25 (2
)12
.5 (3
)25
(7)
50 (1
4)10
0 (4
0)
100
(51)
50 (1
8)
25 (9
)
12.5
(5)
6.25
(3)
3.13
(2)
1.56
(0)
0.78
(0)
100
(58)
50 (1
6)
25 (7
)
12.5
(3)
6.25
(2)
3.13
(1)
1.56
(0)
0.78
(0)
100
(52)
50 (2
5)
25 (1
2)
12.5
(6)
6.25
(4)
3.13
(2)
1.56
(0)
0.78
(0)
0.78
(0)
1.56
(0)
3.13
(1)
6.25
(2)
12.5
(3)
25 (7
)50
(14)
100
(40)
100
(51)
50 (1
8)
25 (9
)
12.5
(5)
6.25
(3)
3.13
(2)
1.56
(0)
0.78
(0)
100
(58)
50 (1
6)
25 (7
)
12.5
(3)
6.25
(2)
3.13
(1)
1.56
(0)
0.78
(0)
100
(52)
50 (2
5)
25 (1
2)
12.5
(6)
6.25
(4)
3.13
(2)
1.56
(0)
0.78
(0)
0.78
(0)
1.56
(0)
3.13
(1.2
)6.
25 (2
.5)
12.5
(5)
25 (1
0)50
(20)
100
(40)
100
(40)
50 (2
0)
25 (1
0)
12.5
(5)
6.25
(2.5
)
3.13
(1.2
)
1.56
(0)
0.78
(0)
100
(40)
50 (2
0)
25 (1
0)
12.5
(5)
6.25
(2.5
)
3.13
(1.2
)
1.56
(0)
0.78
(0)
100
(40)
50 (2
0)
25 (1
0)
12.5
(5)
6.25
(2.5
)
3.13
(1.2
)
1.56
(0)
0.78
(0)
0.78
(0)
1.56
(0)
3.13
(0)
6.25
(0)
12.5
(0)
25 (1
.5)
50 (3
)10
0 (6
)
100
(6)
50 (3
)
25 (1
.5)
12.5
(0)
6.25
(0)
3.13
(0)
1.56
(0)
0.78
(0)
100
(6)
50 (3
)
25 (1
.5)
12.5
(0)
6.25
(0)
3.13
(0)
1.56
(0)
0.78
(0)
100
(6)
50 (3
)
25 (1
.5)
12.5
(0)
6.25
(0)
3.13
(0)
1.56
(0)
0.78
(0)
Cnt
rlC
ntrl
Cnt
rl
Cnt
rl
Cnt
rl
Cnt
rl
Cnt
rl
Cnt
rl0
125
100
75
50
25
0
125
100
75
50
25
0
125
100
75
50
LD
H le
akag
e (%
)L
DH
leak
age
(%)
LD
H le
akag
e (%
)L
DH
leak
age
(%)
25
0
a
b
C
d
Cnt
rl
Cnt
rl
Cnt
rl
Cnt
rl
Cnt
rl
Cnt
rl
Cnt
rl
Cnt
rl
α
αα
αα
α
αα
α
αα
α
Figure 8. LDH leakage expressed as percent of control after exposure to serial dilutions of ZnO particle suspensions or supernatants inPLHC-1 and Hep G2 cells. The measured concentration that corresponds to each nominal concentration is represented in brackets.A value of zero indicates that the measured concentration was similar to the one measured in control media without ZnO. Columnsrepresent the mean ± SEM of at least three independent experiments. Different symbols are used to indicate statistical significantdifferences (simple and double superscripts correspond to p < 0.05 and p < 0.01, respectively). Asterisks (*) were used to indicatedifferences with respect to the controls, a for differences between particle suspension exposures for each concentration in both cell lines.
Cytotoxicity of ZnO nanoparticles
Nan
otox
icol
ogy
Dow
nloa
ded
from
info
rmah
ealth
care
.com
by
Rye
rson
Uni
vers
ity o
n 04
/28/
13. F
or p
erso
nal u
se o
nly.
43.7 mg/ml for ZnO, nZnO-1, nZnO-2 and nZnO-3, respec-tively, whereas the values were 12.2, 14.1, 16.2 and 21.7mg/ml when calculated using real concentrations. The IC50
values corresponding to the Hep G2 cell line were 26.4, 42.0,60.1 and 48.8 mg/ml with nominal concentrations and 7.6,15.2, 18.4 and 24.3 mg/ml with real concentrations. Whenconsidering the measured concentrations to which cellshave been exposed, both cell lines showed similar sensitivityto the four NPs.
LUCS assayZnO, nZnO-1, nZnO-2 and nZnO-3 showed no cytotoxicityover a wide range of nominal concentrations (0.78–50 mg/ml)in PLHC-1 cells (Figure 9A). However, at the highest nominalconcentration (100 mg/ml) a sharp drop, to values lower than
20%, could be observed for all particles. The ZnO particleswere more toxic to the Hep G2 cell line (Figure 9B) withNOEC nominal values of 25 mg/ml for ZnO, nZnO-1 andnZnO-2 and lower for nZnO-3, and NOEC real values of 7, 9,7 and 6 mg/ml, respectively. The IC50 values of the particles inthese cell lines are shown in Table IV. For the fish cells, IC50
values were of 93.0 (36.3), 52.9 (18.9), 94.9 (55.8) and93.7 (48.5) mg/ml for ZnO, nZnO-1, nZnO-2 and nZnO-3,respectively. The IC50 for the mammalian cells were44.1 (12.1), 27.7 (9.8), 33.7 (9.7) and 17.4 (8.3) mg/ml forZnO, nZnO-1, nZnO-2 and nZnO-3, respectively (Table IV).With respect to the signal dynamics of the LUCS assay, theincrease in fluorescence induced by photo-bleaching of thesample was found to be lower in the PLHC-1 cells than in theHep G2 cells. While in Hep G2 cells R2/R1 ratios of
100
(52)
50 (2
5)
25 (1
2)
12.5
(6)
6.25
(4)
3.13
(2)
1.56
(0)
0.78
(0)
100
(58)
50 (1
6)
25 (7
)
12.5
(3)
6.25
(2)
3.13
(1)
1.56
(0)
0.78
(0)
100
(51)
50 (1
8)
25 (9
)
12.5
(5)
6.25
(3)
3.13
(2)
1.56
(0)
0.78
(0)
0.78
(0)
1.56
(0)
3.13
(1)
6.25
(2)
12.5
(3)
25 (7
)50
(14)
100
(40)
ZnO nZnO-1
Particle exposure - PLHC - LUCS
nZnO-2 nZnO-3
100
(52)
50 (2
5)
25 (1
2)
12.5
(6)
6.25
(4)
3.13
(2)
1.56
(0)
0.78
(0)
100
(58)
50 (1
6)
25 (7
)
12.5
(3)
6.25
(2)
3.13
(1)
1.56
(0)
0.78
(0)
100
(51)
50 (1
8)
25 (9
)
12.5
(5)
6.25
(3)
3.13
(2)
1.56
(0)
0.78
(0)
0.78
(0)
1.56
(0)
3.13
(1)
6.25
(2)
12.5
(3)
25 (7
)50
(14)
100
(40)
ZnO nZnO-1
Particle exposure - HepG2 - LUCS
nZnO-2 nZnO-3
150a
b
Rel
ativ
e in
crea
sein
flu
ore
scen
ce (
%)
Rel
ativ
e in
crea
sein
flu
ore
scen
ce (
%)
125
100
75
50
25
0
150
175
125
100
75
50
25
0
Figure 9. Effects of ZnO particles suspensions on PLHC-1 and Hep G2 cells after a 24 h exposure as determined with the new LUCS assay, measuringDNA alteration level. The data are presented as the mean ± SEM of at least three independent experiments. Significant differences with respect tothe controls are indicated with asterisks (*p < 0.05 or **p < 0.01).
Table V. Sensitivity of the LUCS assay with respect to other cytotoxicity assays as calculated from the IC50 ratios.PLHC-1 Hep G2 Hep G2
LDH/LUCS MTT/LUCS LDH/LUCS
IC50 ratios (mg/ml) Nominal Real Nominal Real Nominal Real
1.7–2.0 were reached, ratios in the assays carried out withPLHC-1 cells were usually between 1.4 and 1.7. Taking intoaccount that if the R2/R1 ratios range from 1.0 (maximalintoxication) to 2.0 (control), a deviation of 0.1 in theR2/R1 ratio corresponds to a change of 10% in the resultingcytotoxicity values, whereas in the R2/R1 ratios only rangefrom 1.0 to 1.7, this deviation corresponds to a change of 14%in the resulting cytotoxicity values. The sensitivity of thedifferent assays with respect to the LUCS was evaluated bycalculating the IC50 ratios (Table V). In the Hep G2 cell line,the LUCS assay was found to bemore sensitive than theMTTand LDH assays to the effects of the three NPs. However, inthe fish cell line it was less sensitive than the LDH assay. Ifconsidering the concentrations not producing any effect inthe fish cell lines, NOECs were higher with the LUCS assaythan with the MTT, NR and LDH assays (Table III). However,the LUCS assay was found to be as sensitive as theMTT assayand together more sensitive than NR and LDH assays in thehuman cell line.
ROS productionThe NPs nZnO-1 and nZnO-3 and the bulk materialincreased the production of ROS at the highest concentrationused, 100 mg/ml, in the PLHC-1 cell line (Figure 10). How-ever, these particles were not able to induce ROS productionin the Hep G2 cell line (data not shown).
Discussion
One of the most critical steps in in vitro as well as in in vivotoxicity studies is the preparation of the NPs suspensions inthe media or vehicles used. Previous studies describeddifferent methods to prepare NP suspension, either directlyin the medium by simple agitation (Yang et al. 2009;Yuan et al. 2010), by using bath sonication (Huang et al.2010; Pujalté et al. 2011; Song et al. 2010; Xiong et al. 2011) orby probe sonication (De Berardis et al. 2010; Hsiao & Huang2011). Other authors used filtration (De Berardis et al. 2010)
or stabilisers such as bovine serum albumin (Tantra et al.2010; Yang et al. 2009) to eliminate possible aggregates.However, it was recently recommended to not discard theseaggregates since their implication in the toxicity of ZnO NPsin embryo and adult zebrafish (Bai et al. 2010; Xiong et al.2011) and human cells (Yuan et al. 2010) was demonstrated.Moreover, it has been described that ZnO NPs rapidly formvery large aggregates in deionised water (2990, 6820 and11,400 nm for concentrations of 1, 10 and 100 mg/ml) that arenot easy to disperse after stirring, sonication, using pHvariations or even following ultrasonic disruption(Tso et al. 2010). Degen and Kosec (2000) found that ZnOsuspensions could not be electrostatically stabilised becausethe colloidal ZnO particles were transformed into Zn ions.Because of these previously reported results, and to have amore realistic scenario of exposure conditions in an aquaticenvironment, in this work the cells were exposed to freshlyprepared NPs suspensions dispersed by vortex for 1 min inculture medium without FBS.
To understand the mechanisms underlying the toxicity ofNPs, it is essential to perform a thorough characterisation oftheir physico-chemical properties (Handy et al. 2008a). Inthis study, the size and shape of the pristine forms wereobserved by means of TEM. Since polyhedral, rod-like andnear-spherical shapes were found to coexist in all testedparticle forms, no definite conclusion could be made con-cerning the implication of the shape on toxicity. The averagedimensions in length of the pristine NPs measured by TEMwere 165, 51, 35 and 33 nm, for ZnO, nZnO-1, nZnO-2 andnZnO-3, respectively. Thus, the expected microsized particlewas very close to the nanometre range and the NPsnZnO-2 and nZnO-3 presented similar average diameters.TEM images of ZnO particles suspended in medium showedaggregated particles with irregular shapes and corners lessdefined. Such changes in morphology have been explainedby other authors as being attributed to the adsorbance of theions present in the medium on the surface of ZnO particles(Fang et al. 2010; Yin 2010). Particle size was also studied by
100
(52)
50 (2
5)+
Con
trol
25 (1
2)
12.5
(6)
6.2(
4)
3.1
(2)
1.6
(0)
0.78
(0)0
100
(58)
50 (1
6)+
Con
trol
25 (7
)
12.5
(3)
6.2
(2)
3.1
(1)
1.6
(0)
0.78
(0)0
100
(51)
50 (1
8)+
Con
trol
25 (9
)
12.5
(5)
6.2
(3)
3.1
(2)
1.6
(0)
0.78
(0)0
100
(40)
50 (1
4)+
Con
trol
25 (7
)
12.5
(3)
6.2
(2)
3.1
(1)
1.6
(0)
0.78
(0)0
ZnO nZnO-1
(μg/ml)
nZnO-2 nZnO-3400
RO
S %
incr
ease
in f
luo
resc
ence
300
200
100
0
Figure 10. Effects of ZnO particles suspensions on ROS generation by PLHC-1 after a 24 h exposure period. The data are represented as themean ± SEM of at least three independent experiments. Asterisks (*) represent significant differences (*p < 0.05;**p < 0.01) with respect to thecontrols. Chloramine-T (567.5 mg/ml) was used as positive control (+ control).
Cytotoxicity of ZnO nanoparticles
Nan
otox
icol
ogy
Dow
nloa
ded
from
info
rmah
ealth
care
.com
by
Rye
rson
Uni
vers
ity o
n 04
/28/
13. F
or p
erso
nal u
se o
nly.
DLS in the medium suspensions freshly prepared and after24 h incubation. Large sizes (>1 mm) could be measured byDLS at time 0 and 24 h. It was observed that the two smallestparticles nZnO-2 and nZnO-3 tend to form the largestaggregates in suspension and have a wider size distributionprofile (>2000 nm). The size of the aggregates of the bulkmaterial was lower (859–1564 nm). Our results are in closeagreement with those of Wong et al. (2010) who found thatZnO NPs tended to form aggregates in the micrometre range(2.3 ± 1.6 mm) in seawater, and these aggregates were biggerthan those formed by its bulk counterpart (1.7 ± 1.2 mm). Bycontrast, in the study of Hsiao and Huang (2011) using ZnONPs prepared by a precipitation or a solvothermal method,the smaller-sized ZnO particles aggregated to smaller sec-ondary sizes than the larger NPs. These differences may beattributed to the regular shapes of the NPs used in this laststudy. Others authors also found that ZnO NPs formed largeaggregates in algal media (Franklin et al. 2007) or in serum-free RPMI 1640 culture medium (Pujalté et al. 2011).
As ZnO particles are not soluble in aqueous solutions andform large aggregates on preparation, homogenous disper-sions with reproducible concentrations are probably difficultto obtain. It is, therefore, essential to have an accurateestimation of the real concentrations used in the experi-ments. This has been achieved successfully in this work bymeans of ICP-MS. To our knowledge, this is the first time thatthis measurement has been carried out in cytotoxicity stud-ies. From our findings the real concentrations for ZnO NPswere between 1.7 and 3.8 times lower than the nominal ones.Such findings must be kept in mind when interpretingtoxicity results.
It has also been described that ZnO NPs can dissolve intoZn ions. The solubility of ZnO in aqueous media can showimportant variations ranging from 3.7 mg/ml in seawater(Wong et al. 2010) to 5.8–7.2 mg/ml in serum-free DMEMmedium (Hsiao et al. 2011) and up to 15 mg/ml in completeDMEM medium (Xia et al. 2008). Since some Zn ions can bereleased into solution from the particles, a controversysurrounding the role played by these ions on toxicityremains. In the present study this was investigated. ZnOsuspensions with the highest concentration used in theexposure experiments (100 mg/ml) were incubated for24 h at the corresponding temperatures allowing the disso-lution of Zn in media. Thereafter, suspensions were centri-fuged at two different speeds and the concentration of Zn inthe supernatants was measured by ICP-MS. Concentrationsobtained in both supernatants were similar, indicating thatthe lowest speed was enough to remove any particle insuspension, and therefore this speed was selected for furtherexperiments. After centrifugation, ZnO concentrations exhib-ited important differences depending on the medium used.Values measured were ~6 mg/ml in EMEM and reached40 mg/ml in a-MEM. This could be explained by a greateraggregation of the NPs at a higher temperature in the EMEMor by the presence of other medium substances that canstabilise the suspension in the a-MEM. In addition, the DLSmeasurements of the supernatants showed the presence of aNP population in the a-MEM medium (20–100 nm) thatcouldn’t be clearly observed in the EMEM medium except
for the ZnO-3 NP (50–200 nm). These NPs, together with theions, could also be responsible for the toxicity caused by thesupernatants. Other authors have also suggested that thetoxicity observed in zebrafish (Bai et al. 2010; Xiong et al.2011), Daphnia magna (Wiench et al. 2009), bacteria andbranchipods (Heinlaan et al. 2008), microalgae (Aruoja et al.2009) and in a human cell line (Yuan et al. 2010) could notonly be attributed to the Zn ions but also to the presence ofNPs in the exposure media.
In this work, different cytotoxicity assays have been per-formed to look into different end points. Results obtainedwiththeMTT assay have shown that the PLHC-1 cell line wasmoresensitive than the Hep G2 cell line, but only with nZnO-1 andnZnO-2 freshly prepared suspensions. Nevertheless, for thehighest concentrations used in the bulk material and in theNPs the effect observed in Hep G2 was significantly strongerthan in PLHC-1. No differences in sensitivity between bothcell lines could be observed with the NR or LDH assays.However, the LUCS assay indicated a higher sensitivity of thehuman cell line to ZnO particles than that of the fish one.Results also gave indications concerning the contribution ofsuspended and dissolved NPs and ions to the toxicity. Treat-ment of PLHC-1 with ZnO suspensions before and aftercentrifugation have shown, in the MTT, NR and LDH assays,that these cells were generally more sensitive to the particlesuspensions than to the dissolved NPs and ions present in thesupernatants. This result points to the involvement of aggre-gates in the toxicity of ZnO NPs to PLHC-1 cells. Bai et al.(2010) attributed the toxicity in zebrafish embryos in part tothe large nZnO aggregates that might block the pore canals ofthe chorion, resulting in hypoxia to the developing embryos.By contrast, the measured concentrations indicated that HepG2 cells are more responsive to supernatants than suspendedNPs. It could be easier for dissolved NPs or ions to enter theHep G2 cells when aggregates are not present. In addition,cells treated with supernatants are exposed to the dissolvedions and colloidal NPs longer, than those treated with thesuspensions. Song et al. (2010), after exposing mouse mac-rophage cell lines to ZnO particle suspensions and to super-natants, concluded that the toxic effect at dosages under10 mg/ml was mainly due to dissolved zinc ions whereaswhen the concentration of ZnO particles exceeded 40 mg/ml,the enhancement of cytotoxicity was mainly caused by ZnOparticles. Similarly, De Berardis et al. (2010) also found inhuman colon carcinoma cells that cytotoxicity induced by Znions was only slightly lower than that induced by ZnO NPs.
Differences in cytotoxicity between nominal and mea-sured concentrations clearly indicate that the estimation ofreal concentrations is essential to avoid misinterpretationsand erroneous conclusions.
One of the aims of this study was to test the applicability ofthe LUCS test in a fish cell line. Positive results were obtainedin PLHC-1 cells, showing that ZnO particles are able totrigger DNA alteration in fish cells. Results obtained withLUCS in the Hep G2 cell line suggested that the three NPs areable to disrupt the DNA helicoidal conformation with ahigher intensity than the bulk material. In the case ofPLHC-1 cells, when all assays were compared, only LDHand LUCS allowed for IC50 evaluation with a better sensitivity
M. L. Fernández-Cruz et al.
Nan
otox
icol
ogy
Dow
nloa
ded
from
info
rmah
ealth
care
.com
by
Rye
rson
Uni
vers
ity o
n 04
/28/
13. F
or p
erso
nal u
se o
nly.
seen using the LDH assay. However, in the case of Hep G2,IC50 were evaluated with MTT, LDH and LUCS assays with abetter sensitivity of the latter assay as shown by ratio calcu-lations. If we consider NOEC values, the MTT assay was themost sensitive for the fish cell line whereas the LUCS andMTT assays were most sensitive in the human cell line.
The NPs nZnO-1, nZnO-3 and the bulk material provokeda significant increase in ROS production in the PLHC-1 cellline. However, none of the particles were able to induce ROSproduction in the Hep G2 cell line in contrast with otherstudies in mouse or human cell lines where ZnO NPs wereable to generate ROS at concentrations ranging from 5 to100 mg/ml (Yang et al. 2009; Huang et al. 2010; Song et al.2010). This difference could be explained by the low con-centration of ZnO (6 mg/ml) detected in the EMEM super-natants that probably correspond to Zn ions that need to bepresent and the need of NPs and Zn ions to enter into the cellto generate ROS as previously suggested (Song et al. 2010;Yuan et al. 2010; Yang et al. 2009). Nevertheless, a mainimplication of zinc ions in the oxidative stress response hasbeen discarded by these authors as well as by Gojova et al.(2007) and Pujalté et al. (2011). It has been reported thatalthough ROS plays an important role in the toxicity of NPs, itis not necessarily the main factor of cytotoxicity of ZnOparticles, but the cytotoxic response (Xia et al. 2008;Song et al. 2010; Wong et al. 2010). This might also be thecase in this work. The observed cytotoxicity appeared not tobe dependent on the induction of oxidative stress.
The relevance of these experimental data to ZnO NPsexposures in vivo remains to be elucidated. The acutetoxicity of metal NPs is not always explained, or only partlyexplained, by the presence of free metal ions. The results ofthe present work indicate a different sensitivity of both celllines to the aggregates versus the dissolved fraction. In fish,the dissolution of metal ions from the surface of the particleas well as the presence of dissolved ZnO NPs and largeaggregates will determine and influence absorption (die-tary versus respiratory or dermal exposure) as well as theirpresence in different organs. Some studies indicate that themost probable uptake mechanism of NPs is by endocytosis(Handy et al. 2008c; Shaw & Handy 2011). In this regard,fish may be more vulnerable than mammals, since fish gutsare able to take up much larger materials by endocytosisacross the gut (Handy et al. 2008c). Additionally, theirpresence in the surface of gills can produce pathologiesand toxicity in the internal organs without their directpresence in those tissues (Shaw & Handy 2011). Thebody distribution, metabolism and excretion of metalNPs is poorly documented in fish, but hepatic excretioninto the bile seems a more likely mechanism, rather thanmainly by renal or branchial excretion (Handy et al. 2008c).Evidence suggests that metal NPs can be found in a rangeof organs including the gill, liver, intestine and brain(Handy et al. 2008a, b) and all of them could be targetsfor NPs and explain or help to explain NP toxicity in vivo.Further studies on the possible absorption of the aggre-gates and the dissolved fraction in fish will allow a betterunderstanding of the risk of these ZnO NPs to the aquaticenvironment.
Conclusions
In the present study, the toxic effects of ZnO NPs were notclearly related either with the size or the shape of the usedNPs, this latter due to the heterogeneity of the commercialZnO particles used. However, it is important to take intoaccount that different sizes and shapes of ZnO NPs cancoexist in the aquatic environment and contribute collec-tively to specific toxic effects. ZnO NPs formed large aggre-gates in culture medium that highly contribute to the toxicityobserved in the fish cell line. The effects observed in thehuman cell line seem to be mainly due to the dissolved ZnOfraction. These results support the idea that, in order to haverealistic conditions which consider all possible mechanismsof action, experiments involving exposure to ZnO NPs inaqueous suspensions should be performed without homo-geneous dispersion of the NPs. It has been also shown that itis essential to measure real concentrations to avoid makingerroneous conclusions when only nominal concentrationsare considered.
A battery of end points should be measured to study thecytotoxicity of NPs. In this work, we have introduced theLUCS test, a test to measure toxicity based on DNA alter-ation. It provides us with extra information regardingcellular events. From the classical cytotoxicity assaysused, the MTT gave the highest sensitivity in both celllines. However, the newly developed LUCS assay appearedto be even more sensitive in the Hep G2 cell line. From bothcell lines, the human one appeared to be more sensitivethan the piscine one. Of particular interest is the fact thatthe LUCS has been shown to be applicable to other celllines than the mammalian ones in which it was originallyestablished. The results from this study also indicated thatROS production is not the main factor causing cytotoxicityof ZnO particles, but cellular damage at the mitochondrialand DNA levels.
Further studies in fish in vivo to address the conse-quences of environmental exposures to these NPs areneeded.
Acknowledgements
This work was supported by the SpanishMinisterio deMedioAmbiente y Medio Rural y Marino (grant numberAEG07-060). T Lammel was funded by FP7-PEOPLE-ITN2008 ECO (Environmental ChemOinformatics) (Project ref.238701).
Declaration of interest
The authors report no conflicts of interest. The authorsalone are responsible for the content and writing of thepaper.
ReferencesAdams LK, Lyon DY, Alvarez PJJ. 2006. Comparative eco-toxicity of
nanoscale TiO2, SiO2, and ZnO water suspensions. Water Res40:3527–3532.
Aruoja V, Dubourguier H, Kasemets K, Kahru A. 2009. Toxicity ofnanoparticles of CuO, ZnO and TiO2 to microalgae Pseudokirch-neriella subcapitata. Sci Total Environ 407:1461–1468.
Cytotoxicity of ZnO nanoparticles
Nan
otox
icol
ogy
Dow
nloa
ded
from
info
rmah
ealth
care
.com
by
Rye
rson
Uni
vers
ity o
n 04
/28/
13. F
or p
erso
nal u
se o
nly.
Bai W, Zhang ZY, Tian WJ, He X, Ma YH, Zhao YL, et al. 2010.Toxicity of zinc oxide nanoparticles to zebrafish embryo:a physicochemical study of toxicity mechanism. J NanopartRes 12:1645–1654.
Borenfreund E, Puerner JA. 1985. Toxicity determined in vitro bymorphological alterations and neutral red absorption. ToxicolLett 24:119–124.
De Berardis B, Civitelli G, Condello M, Lista P, Pozzi R, Arancia G, et al.2010. Exposure to ZnO nanoparticles induces oxidative stress andcytotoxicity in human colon carcinoma cells. Toxicol Appl Pharma-col 246:116–127.
Degen A, Kosec M. 2000. Effect of pH and impurities on the surfacecharge of zinc oxide in aqueous solution. J Eur Ceram Soc 20:667–673.
Deng XY, Luan QX, Chen WT, Wang YL, Jiao Z. 2009. Nanosized zincoxide particles induce neural stem cell apoptosis. Nanotechnology20:115101.
Derick S, Tocanne JF, Morin B, Narbonne JF, Furger C. 2009. DAP, anew fluorescent cell-based assay which predicts human acutetoxicity to 82% [Abstract 501]. In 7th World Congress onAlternatives to Animal Experimentation, vol. 26, 130 Rome (Italy);30 August-3 September, 2009.
Dhawan A, Sharma V. 2010. Toxicity assessment of nanomaterials:methods and challenges. Anal Bioanal Chem 398:589–605.
Fang X, Yu R, Li B, Somasundaran P, Chandran K. 2010. Stressesexerted by ZnO, Ce O(2) and anatase TiO(2) nanoparticles on theNitrosomas europaea. J Colloid Interface Sci 348:329–334.
Franklin NM, Rogers NJ, Apte SC, Batley GE, Gadd GE, Casey PS. 2007.Comparative toxicity of nanoparticulate ZnO, bulk ZnO, andZnCl2 to a freshwater microalga (Pseudokirchneriella subcapitata):the importance of particle solubility. Environ Sci Technol 41:8484–8490.
Gojova A, Guo B, Kota RS, Rutledge JC, Kennedy IM, Barakat AL. 2007.Induction of inflammation in vascular endothelial cells by metaloxide nanoparticles: effect of particle composition. Environ HealthPerspect 115:403–409.
Handy RD, Owen R, Valsami-Jones E. 2008a. The ecotoxicology ofnanoparticles and nanomaterials: current status, knowledge gaps,challenges, and future needs. Ecotoxicology 17:315–325.
Handy RD, Kammer FVD, Lead JR, Hassellöv M, Owen R,Crane M. 2008b. The ecotoxicology and chemistry of manufacturednanoparticles. Ecotoxicology 17:287–314.
Handy RD, Henry TB, Scown TM, Johnston BD, Tyler CR. 2008c.Manufactured nanoparticles: their uptake and effects on fish-amechanistic analysis. Ecotoxicology 17:396–409.
Heinlaan M, Ivask A, Blinova I, Dubourguier HC, Kahru A. 2008.Toxicity of nanosized and bulk ZnO, CuO and TiO2 to bacteriaVibrio fischeri and crustaceans Daphnia magna and Thammnoce-phalus platyurus. Chemosphere 71:1308–1316.
Hsiao IL, Huang YJ. 2011. Effects of various physicochemical char-acteristics on the toxicities of ZnO and TiO2 nanoparticles towardhuman lung epithelial cells. Sci Total Environ 409:1219–1228.
Huang CC, Aronstam RS, Chen D, Huang Y. 2010. Oxidative stress,calcium homeostasis, and altered gene expression in human lungepithelial cells exposed to ZnO nanoparticles. Toxicol In Vitro 24:45–55.
Kashiwada S. 2006. Distribution of nanoparticles in the see-throughMedaka (Oryzias latipes). Environ Health Perspect 114:1697–1702.
Lin WS, Xu Y, Huang CC, Ma YF, Shannon KB, Chen DR, et al. 2009.Toxicity of nano- and micro-sized ZnO particles in human lungepithelial cells. J Nanopart Res 11:25–39.
Liu J, Zhang W, Jing H, Popovich DG. 2010. Bog Bilberry (Vacciniumuliginosum L.) extract reduces cultured Hep-G2, Caco-2, and
3T3-L1 cell viability, affects cell cycle progression, and has variableeffects on membrane permeability. J Food Sci 75:103–107.
Mosmann T. 1983. Rapid colorimetric assay for cellular growth andsurvival: application to proliferation and cytotoxicity assays.J Immunol Methods 65:55–63.
Pujalté I, Passagne I, Brouillaud B, Tréguer M, Durand E,Ohayon-Courtès C. 2011. Cytotoxicity and oxidative stress inducedby different metallic nanoparticles on human kidney cells. Part FibreToxicol 8:1–16.
Scown TM, Goodhead RM, Johnston BD, Moger J, Baalousha M,Lead JR, et al. 2010. Assessment of cultured fish hepatocytes forstudying cellular uptake and (eco)toxicity of nanoparticles. EnvironChem 7:36–49.
Sharma V, Shukla RK, Saxena N, Paramar D, Das M, Dhawan A. 2009.DNA damaging potential of zinc oxide nanoparticles in humanepidermal cells. Toxicol Lett 185:211–218.
Shaw BJ, Handy RD. 2011. Physiological effects of nanoparticles onfish: a comparison of nanometals versus metal ions. Environ Int37:1083–1097.
Song W, Zhang J, Guo J, Zhang J, Ding F, Li L, et al. 2010. Role of thedissolved zinc ion and reactive oxygen species in cytotoxicity of ZnOnanoparticles. Toxicol Lett 199:389–397.
Tantra R, Tompkins J, Quincey P. 2010. Characterisation of the de-ag-glomeration effects of bovine serum albumin on nanoparticles inaqueous suspension. Colloids Surf B 75:275–281.
Tso CP, Zhung CM, Shih YH, Tseng YM, Wu SC, Doong RA. 2010.Stability of metal oxide nanoparticles in aqueous solutions. WaterSci Technol 61:127–133.
Wang H, Joseph JA. 1999. Quantifying cellular oxidative stress bydichlorofluorescein assay using microplate reader. Free Radic BiolMed 27:612–616.
Wiench K, Wohlleben W, Hisgen V, Radke K, Salinas E, Zok S, et al.2009. Acute and chronic effects of nano- and non-nano-scaleTiO2 and ZnO particles on mobility and reproduction of the fresh-water invertebrate Daphnia magna. Chemosphere 76:1356–1365.
Wong SWY, Leung PTY, Djurisic AB, Leung KMY. 2010. Toxicities ofnano zinc oxide to five marine organisms: influences of aggregatesize and ion solubility. Anal Bioanal Chem 396:609–618.
Xia T, Kovochich M, Liong M, Madler L, Gilbert B, Shi H, et al. 2008.Comparison of the mechanism of toxicity of zinc oxide and ceriumoxide nanoparticles based on dissolution and oxidative stress prop-erties. ACS NANO 2:2121–2134.
Xiong D, Fang T, Yu L, Sima X, ZhuW. 2011. Effects of nano-scale TiO2,ZnO and their bulk counterparts on zebrafish: Acute toxicity, oxi-dative stress and oxidative damage. Sci Total Environ 409:1444–1452.
Yang H, Liu C, Yang D, Zhang H, Xi Z. 2009. Comparative study ofcytotoxicity, oxidative stress and genotoxicity induced by four typicalnanomaterials: the role of particle size, shape and composition.J Appl Toxicol 29:69–78.
Yin H, Casey PS, McCall MJ, Fenech M. 2010. Effects of surfacechemistry on cytotoxicity, genotoxicity, and the generation of reac-tive oxygen species induced by ZnO nanoparticles. Langmuir26:15399–15408.
Yuan JH, Chen Y, Zha HX, Song LJ, Li CY, Li JQ, et al. 2010. Deter-mination, characterization and cytotoxicity on HELF cells of ZnOnanoparticles. Colloids Surf B 76:145–150.
Zhu XS, Zhu L, Duan ZH, Qi RQ, Li Y, Lang YP. 2008. Comparativetoxicity of several metal oxide nanoparticle aqueous suspensions toZebrafish (Danio rerio) early developmental stage. J Environ SciHealth A 43:278–284.
Zhu X, Wang J, Zhang X, Chang Y, Chen Y. 2009. The impact of ZnOnanoparticle aggregates on the embryonic development of zebrafish(Danio rerio). Nanotechnology 20:195103.