66 TRANSPORTATION RESEARCH RECORD 1360 Comparative Evaluation of Alternative Traffic Control Strategies NATHAN H. GARTNER AND DENNIS L. Hou A growing variety of computer models are being developed for the design of various traffic control strategies. Appropriate tools are needed to compare the performance of new strategies with old ones, as well as to determine which alternative design options work best for any given strategy. In most cases, simulation ex- periments are used for this purpose; in some cases field tests are also performed. The application of the Gafarian-Halati statistical estimation method for the comparative evaluation of alternative traffic control strategies is described. The method is based on the use of ratio estimation techniques. Such techniques are needed for the analysis of typical simulation model output parameters as well as for the analysis of field test data results. Application of the methodology is illustrated in a special case by comparing alternative arterial traffic signal control strategies. A growing variety of computer models are being developed for the design of advanced traffic control strategies. Appro- priate tools are needed to evaluate the performance of such strategies and to refine them before their implementation. Most important is the need to assess the potential benefits that they offer in comparison with existing strategies. In most cases, simulation models are used for this purpose, since they are the most economical method for evaluation. However, in some cases, it may be desirable to conduct field experimen- tations, which are the ultimate proof of performance. To analyze the output from simulation trials as well as field tests, suitable statistical tools are needed. The application of a statistical methodology that is useful in comparing alter- native traffic control strategies is described. As an example, two methods for arterial traffic signal optimization are eval- uated. The methodology, of course, has general applicability and can be used to compare any alternative strategies. SIMULATION OUTPUT ANALYSIS Simulation methods are widely used to analyze the perfor- mance of urban traffic networks. Typically, they are applied to evaluate proposed operational changes, such as a new con- trol or management strategy. The most widely used traffic simulation model in the United States is NETSIM. NETSIM is a microscopic, stochastic simulation model that enables the engineer to analyze and evaluate a wide range of traffic con- trol and surveillance concepts for complex signalized street networks. The basic input requirements for this model are the network geometry, signalization information, and flow data, which consist of input rates and turning movements. Department of Civil Engineering, University of Massachusetts, Low- ell, Mass. 01854. The simulation procedure consists of a warm-up period and the actual simulation period during which statistical data are accumulated. During the warm-up time, traffic generators feed vehicles into the empty simulated network until equilib- rium conditions are reached, that is, the rate at which vehicles are fed into the network equals the rate at which vehicles are discharged from it. Only then are the simulated data valid. The NETSIM model also requires a random seed number for the random number generator that governs the flow of ve- hicles into the network. The simulation results depend on the choice of the seed number, so multiple replications of NETSIM runs with different seed numbers are necessary. The standard output of the NETSIM model includes esti- mates of many important traffic parameters, such as •Total vehicle minutes of travel time, • Number of vehicles discharged, •Total vehicle miles of travel distance, •Total delay time, •Average travel time per vehicle, •Average number of stops per vehicle, • Average speed, and •Average delay time per vehicle. The estimates of the traffic parameters are provided both on a link-by-link basis (links represent a one-way direction of flow on a street between two adjacent signals) and on a net- workwide basis. To calculate the parameters involving aver- age values per vehicle, NETSIM uses the ratio of sample means of observations that are, in fact, autocorrelated and cross-correlated. This may produce erroneous results. To make valid statistical statements about these parameters, one must apply statistical techniques to the model outputs that are based on ratio estimators. In this paper, we use a technique of Gafarian and Halati that provides a measure of the accuracy of the estimates in terms of confidence intervals (1). The technique is then applied, as an example, to compare the performance of two optimization schemes for arterial traffic signal control. RATIO ESTIMATORS Each of the last four measures of effectiveness (MOE) gen- erated by NETSIM (and described earlier) is actually the ratio of the means of two random variables X and Y. For example, the average delay per vehicle is obtained by dividing the total delay time accumulated on each link by the total number of vehicles discharged from the link. The average speed is cal- culated by dividing the number of vehicle miles traveled on
Transcript
66 TRANSPORTATION RESEARCH RECORD 1360
Comparative Evaluation of Alternative Traffic Control Strategies
NATHAN H. GARTNER AND DENNIS L. Hou
A growing variety of computer models are being developed for the design of various traffic control strategies. Appropriate tools are needed to compare the performance of new strategies with old ones, as well as to determine which alternative design options work best for any given strategy. In most cases, simulation experiments are used for this purpose; in some cases field tests are also performed. The application of the Gafarian-Halati statistical estimation method for the comparative evaluation of alternative traffic control strategies is described. The method is based on the use of ratio estimation techniques. Such techniques are needed for the analysis of typical simulation model output parameters as well as for the analysis of field test data results. Application of the methodology is illustrated in a special case by comparing alternative arterial traffic signal control strategies.
A growing variety of computer models are being developed for the design of advanced traffic control strategies. Appropriate tools are needed to evaluate the performance of such strategies and to refine them before their implementation. Most important is the need to assess the potential benefits that they offer in comparison with existing strategies. In most cases, simulation models are used for this purpose, since they are the most economical method for evaluation. However, in some cases, it may be desirable to conduct field experimentations, which are the ultimate proof of performance.
To analyze the output from simulation trials as well as field tests, suitable statistical tools are needed. The application of a statistical methodology that is useful in comparing alternative traffic control strategies is described. As an example, two methods for arterial traffic signal optimization are evaluated. The methodology, of course, has general applicability and can be used to compare any alternative strategies.
SIMULATION OUTPUT ANALYSIS
Simulation methods are widely used to analyze the performance of urban traffic networks. Typically, they are applied to evaluate proposed operational changes, such as a new control or management strategy. The most widely used traffic simulation model in the United States is NETSIM. NETSIM is a microscopic, stochastic simulation model that enables the engineer to analyze and evaluate a wide range of traffic control and surveillance concepts for complex signalized street networks. The basic input requirements for this model are the network geometry, signalization information, and flow data, which consist of input rates and turning movements.
Department of Civil Engineering, University of Massachusetts, Lowell, Mass. 01854.
The simulation procedure consists of a warm-up period and the actual simulation period during which statistical data are accumulated. During the warm-up time, traffic generators feed vehicles into the empty simulated network until equilibrium conditions are reached, that is, the rate at which vehicles are fed into the network equals the rate at which vehicles are discharged from it. Only then are the simulated data valid. The NETSIM model also requires a random seed number for the random number generator that governs the flow of vehicles into the network. The simulation results depend on the choice of the seed number, so multiple replications of NETSIM runs with different seed numbers are necessary.
The standard output of the NETSIM model includes estimates of many important traffic parameters, such as
•Total vehicle minutes of travel time, • Number of vehicles discharged, •Total vehicle miles of travel distance, •Total delay time, •Average travel time per vehicle, •Average number of stops per vehicle, • Average speed, and •Average delay time per vehicle.
The estimates of the traffic parameters are provided both on a link-by-link basis (links represent a one-way direction of flow on a street between two adjacent signals) and on a networkwide basis. To calculate the parameters involving average values per vehicle, NETSIM uses the ratio of sample means of observations that are, in fact, autocorrelated and cross-correlated. This may produce erroneous results. To make valid statistical statements about these parameters, one must apply statistical techniques to the model outputs that are based on ratio estimators. In this paper, we use a technique of Gafarian and Halati that provides a measure of the accuracy of the estimates in terms of confidence intervals (1). The technique is then applied, as an example, to compare the performance of two optimization schemes for arterial traffic signal control.
RATIO ESTIMATORS
Each of the last four measures of effectiveness (MOE) generated by NETSIM (and described earlier) is actually the ratio of the means of two random variables X and Y. For example, the average delay per vehicle is obtained by dividing the total delay time accumulated on each link by the total number of vehicles discharged from the link. The average speed is calculated by dividing the number of vehicle miles traveled on
Gartner and Hou
each link (equal to link length times number of exits) by the vehicle minutes on the link (the amount of time spent by all vehicles traversing the link). Similar ratios are obtained for the other measures. Consequently, the MOE itself is the ratio mxlmy, that is, the actual mean of X divided by the actual mean of Y. However, the NETSIM output provides only the ratio of the sample means of X andY random variables, and it is well known that in general E[XIY] -:/= mxlmy.
Gafarian and Halati (J) developed a statistically valid method for using the ratio XIY as a point estimate for the ratio mxl my that provides, with a confidence interval, a measure of its accuracy. They assessed the efficacy of the method through a Monte Carlo experiment and an Ml Mil queueing system analysis, and they discuss its applicability in the analysis of NETSIM output variables. They show in a simple example how the coverage probability of the desired results is degraded when observations from independent replications are not treated as a ratio of random variables. The coverage probability is defined as the probability that the confidence interval produced by a certain sample size will cover the true value of the ratio of the means. For the sake of completeness, the essence of the Gafarian-Halati estimation method is demonstrated. The ratio estimation techniques are also described in the general statistics literature (2).
The development of a confidence interval for the estimate R = mxlmy is based on the observations {(X;IY,), i = 1, ... , n} of all the independent replications of the simulation model. We define a variable Z; as follows:
Z; = X; - RY;
Taking means we obtain
Z=X-RY
Assuming that X; and Y; are normally distributed, then Z; and Z are also normally distributed. Because E(Z,) =
E(Z) = 0, then the expression
" Zl{(lln)[ll(n - 1)] L (Z; - Z)2} 1
'2
i=I
has a Student t-distribution with (n -1) degrees of freedom . It can be shown that
" Si = [1/(n 1)] L (X; - X)2 sample variance of X;s,
1= I
n
S} = [1/(n 1)] L (Y; YJ2 sample variance of Y;s, i=l
and
" SXY = [1/(n - 1)] L (X; X)(Y; Y)
1= l
sample variance of (X;, Y,)s.
67
For the (1 - a) level,
Pr{JX - R YJl[(l/n)(S} + R2S} - 2RSXY)]1'2}
,,; ti -(a/2) .n-1 = 1 - a
When both sides of the argument in the probability statement are squared, the result is a quadratic inequality in the unknown R = mxlmy, the known estimates X, Y, S}, S}, Sxn and t 1 _ cai2>.n _ 1• The roots of this quadratic function are
[[xY - g(a)SXY] ± ([xY - g(a)SXY]2 - {[P
- g(a)St][X2 - g(a)S}]} } 12 }[P -g(a)S}]
where g(a) equals (ti-(aiz).n _ 1)ln. The (1 - a) 100 percent confidence interval is then (r1, r2 ),
where r 1 is the smaller root and r 2 is the larger root. Further details are given elsewhere (J ,2).
PILOT STUDY
The validity of this method depends on how well the assumptions made in its derivation are met by the NETSIM model, namely, system in steady state, normality of numerator and denominator observations, and independent replications. Steady state in NETSIM is achieved by the warm-up procedure. To obtain independent replications, each run is started with a different seed number. The only assumption that is approximately met is that of normality, and it can be claimed that the method is not sensitive to this requirement.
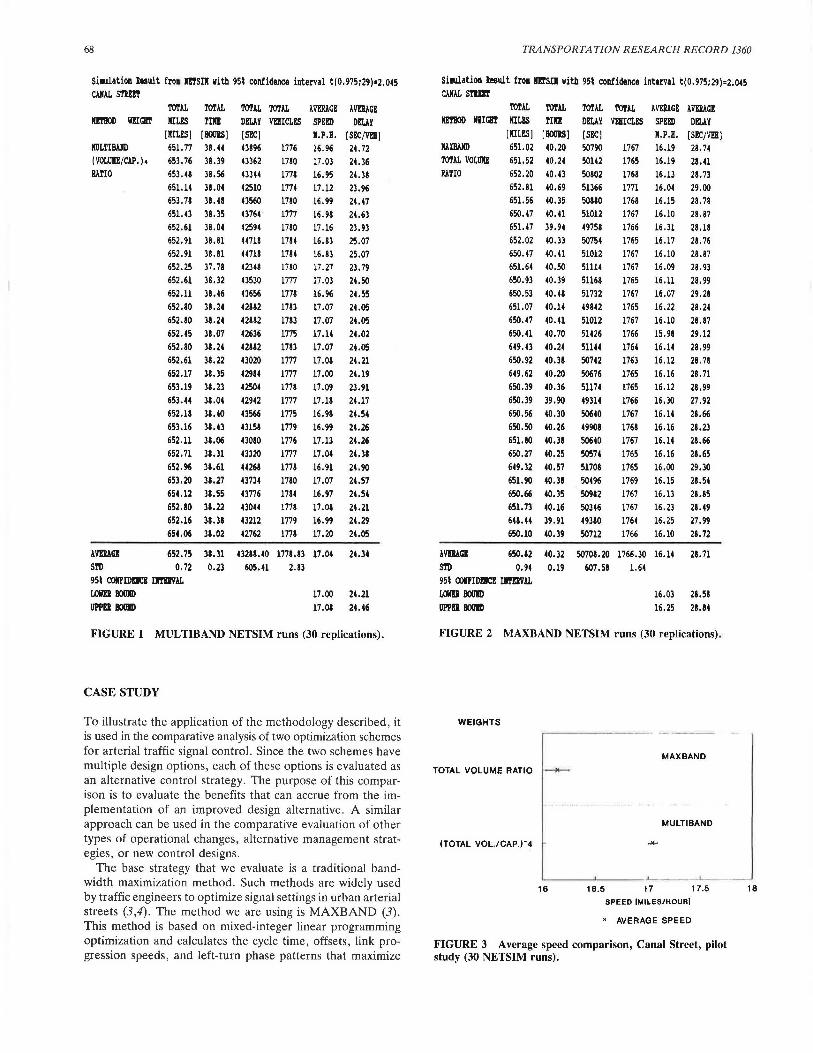
We illustrate the implementation of this procedure in a pilot study of NETSIM simulation runs for a nine-signal arterial street. We performed 30 replications with a different seed number for each of two different signal control strategies, MAXBAND and MUL TIBAND (which will be described further). The purpose of the pilot study was to check the normality of the random variables, the stability of the simulation results, and the sample-size requirements. The numerical results for all the replications are presented in Figures 1 and 2. Two ratio parameters were calculated: average speed (mph) and average delay per vehicle (sec). The bounds of the 95 percent confidence intervals were obtained by the procedure outline. We observe that the intervals are rather narrow; this may indicate that the number of replications can be significantly reduced and still produce meaningful outputs. The results can also be compared graphically, as shown in Figures 3 and 4. They indicate the superior performance of the particular MULTIBAND option that was chosen in this case: an increase of 5.6 percent in average speed and a reduction of 15.2 percent in average delay per vehicle, compared with MAXBAND. We also plotted the frequency histogram for both travel distance and travel time. If a sequence of observations is normally distributed, then the frequency histogram is bell-shaped. Figure 5 illustrates that this assumption is approximately true in this case. In the next section we show that we can obtain meaningful results with a much smaller sample size. This is particularly helpful when we need to compare a large number of alternative strategies.
To illustrate the application of the methodology described, it is used in the comparative analysis of two optimization schemes for arterial traffic signal control. Since the two schemes have multiple design options, each of these options is evaluated as an alternative control strategy. The purpose of this comparison is to evaluate the benefits that can accrue from the implementation of an improved design alternative. A similar approach can be used in the comparative evaluation of other types of operational changes, alternative management strategies, or new control designs.
The base strategy that we evaluate is a traditional bandwidth maximization method. Such methods are widely used by traffic engineers to optimize signal settings in urban arterial streets (3,4). The method we are using is MAXBAND (3). This method is based on mixed-integer linear programming optimization and calculates the cycle time, offsets, link progression speeds, and left-turn phase patterns that maximize
FIGURE 3 Average speed comparison, Canal Street, pilot study (30 NETSIM runs).
16
Gartner and Hou
WEIGHTS
MAX BAND
TOTAL VOLUME RATIO
MULTIBAND
(TOTAL VOL./CAP.)"4 ....
- I - _J __
22 24 26 28
DELAY (SECONDS/ VEHICLE)
x AVERAGE DELAY
FIGURE 4 Average delay comparison, Canal Street, pilot study (30 NETSIM runs).
Frequency Histogram
1 0
8
6
4
2
0 651 652 653 654
Frequency Histogram 12
1 0
>. 8 0 c: Q) ::> CT 6 ~
4
2
0
2260 2280 2300 2320
FIGURE 5 Normality check via histogram plot: top, total travel distance (miles); bottom, total travel time.
655
2340
3 0
a weighted combination of the bandwidths b, b in the two directions of travel along the artery . Continuous bands of equal width are produced by this method. The MAXBAND optimization program is summarized in Figure 6. Similar designs can be produced by the PASS ER II optimization program (4).
A basic limitation of existing bandwidth-based programs is that the progression design criterion does not depend on the
MAXBANO Given:
Find:
spl its, queue clearances, target ratio of arterial bandwidths, and for each section limits on : cycle time, link speeds, and changes in speeds. cycle time, interferences, bandwidths b and
offsets, arterial b, link
progression speeds and leftturn phase patterns
To: maximize b + k b
Subject to: cycle ti me constraint.bandwidth ratio constraints, interference constraints , loop integer constraints, andspeed and speed-change constraints
FIGURE 6 MAXBAND optimization program (3).
69
actual traffic flows on the arterial links and, therefore, is insensitive to variations in such flows. The total bandwidth obtained for the arterial can be allocated in any desired ratio among the two directions of travel. A common practice is to apportion it according to the directional volume ratio k, taken as the ratio between the average (or total) link volumes in each direction.
However, because of turn-in and turn-out traffic we generally do not have constant volumes along each direction of the arterial. Consequently, the idea of a uniform platoon moving through all the signals in one direction, which forms the conceptual basis for the bandwidth approach, does not always hold. Moreover, the ratio of volumes on opposing road sections between each pair of adjacent signals is also varying. It is, therefore, inconceivable that a single parameter for the entire arterial (k) can adequately reflect this diversity and guarantee the best progression (in terms of delays and stops) for different traffic flow patterns.
This has led to the development of a new optimization approach named MULTIBAND (5), which is designed to remedy such deficiencies. The approach places the arterial bandwidth optimization concept on a more solid foundation by incorporating into the calculation procedure a systematic traffic-dependent criterion. The volume on each link of the artery, along with other traffic parameters (such as capacity and speed), will have an effect on the optimization outcome through suitably chosen link-specific weighting factors , as contrasted with a single weight for all links in existing programs. Thus, the objective of providing volume-weighted progression while reducing delay (or travel time) and stops can be achieved.
The MUL TIBAND model is derived from the MAXBAND model and also uses mixed-integer linear programming optimization. In MULTIBAND, we define a different bandwidth for each directional road section of the arterial:
b;(b;) = outbound (inbound) bandwidth between signals S; and S;+z ; there is now a specific band for each directional road section or link.
This band can be individually weighted with respect to its contribution to the overall objective function. (The band is continuous; only the width can vary). The method is sensitive
70
to varying traffic conditions, and the progression scheme can be tailored to different traffic flow patterns. Users can still choose uniform bandwidth progressions if they so desire, but this is now only one of many user options.
The most important change with respect to MAXBAND or PASSER II occurs in the objective function. The bands are link-specific, so they can be weighted disaggregately to achieve desirable traffic objectives for each link. The MULTIBAND objective function has the following form:
where a;(ii;) are the link-specific weights in the two directions. A multitude of options are available for determining the weighting coefficients. To illustrate the comparative evaluation methodology in this paper, we investigate the following options:
a, = (~;)"
where
V;(V;) directional volume on section i, outbound (inbound); either total volume or through (platoon) volume can be used;
S/S;) saturation flow on section i, outbound (inbound); this is the capacity volume (vphg);
p = exponential power; the values used were p = 0 (unit coefficients), p = 1 (volume/capacity ratio), p =2 [(vol/cap)2], p = 4 [(vol/cap)•].
The MUL TIBAND program is summarized in Figure 7. Since we have four options for p and two options for V, we have 2( 4) - 1 = 7 different options (p = 0 produces the same coefficients for the two volume options). Furthermore, we can choose centered or noncentered bands for a total of 14 MUL TIBAND alternatives.
MULTIBAND Given:
Find:
To:
splits, queue clearances, target ratios of bandwidths, and for each section limits on : cycle time, link speeds, changes in speeds, and allowed leftturn phase patterns. cycle time, offsets, interferences; link-specific bandwidths bi, bi;link progression speeds; and left-turn phase patterns
1 n-1 __
MAX B·(n-1)L(aibi+.ai bi) i.1
S b" t t . cycle time constraint bandwidth ratio u iec 0 · constraints interference constraints
loop integer constraints speed and speed-change constraints
FIGURE 7 MUL TIBAND optimization program (5).
TRANSPORTATION RESEARCH RECORD 1360
NUMERICAL RES UL TS
We compare the performance of the two methods with respect to Canal Street, an arterial street in New Orleans, Louisiana. The NETSIM input for this street is illustrated in Figure 8. The default distance from starting node to intersection node is 394 ft. Distances between intersections are shown to the right of the right starting nodes; volume ratios are to the left of the left starting nodes. The inbound direction is that from Intersection 1 to Intersection 9, and outbound is the reverse. The parameter k; represents the inbound/outbound ratio of
volumes on opposing links between adjacent signals. There is a wide variation in the volume ratios along the arterial. However, the aggregate volume ratio for the entire arterial is 1: 1.2. Clearly, conventional progression methods such as PASSER-II or MAXBAND cannot capture the full extent of information offered by this data set. MULTIBAND, on the other hand, is specifically designed to handle such a case. Sample designs produced by the MAXBAND and MULTIBAND programs are shown in Figures 9 and 10. Whereas MAXBAND generates uniform bandwidth progressions, MUL TIBAND produces variable-bandwidth designs that are adapted to the variable volume ratios.
Our study compared the two possible options of MAXBAND with seven design options of MUL TIBAND (only the centered options are shown). If we were to take 30 replications for each case, we would need to perform 270 different NETSIM runs of 30 min each (540 runs if noncentered options were also included). This is a formidable undertaking that may not be necessary in order to draw appropriate conclusions. Gafarian and Halati have shown that in the worst nonnormal case, five replications still provide more than 80 percent coverage probability by 95 percent confidence intervals . This coverage probability was deemed satisfactory for our purposes, therefore we limited our comparisons to five replications each . A more detailed discussion of the sample size
d z _J <I: z l'.l ...... (/)
TIME: CYCLES
2000
1000
FIGURE 9 MULTIBAND time-space diagram for Canal Street: band weights = (total volume/ratio) ** 4; cycle time = 68 sec.
I-w w u._
w u z <I: I-(/) H
i'.=l
d z _J <I: z l'.l ...... Cl)
TIME: CYCLES
2000
1000
FIGURE 10 MAXBAND time-space diagram for Canal Street: band weights = total volume ratio (k = 1:1.2); cycle time = 60 sec.
71
I-w w u._
w u z <I: I-Cl) H
i'.=l
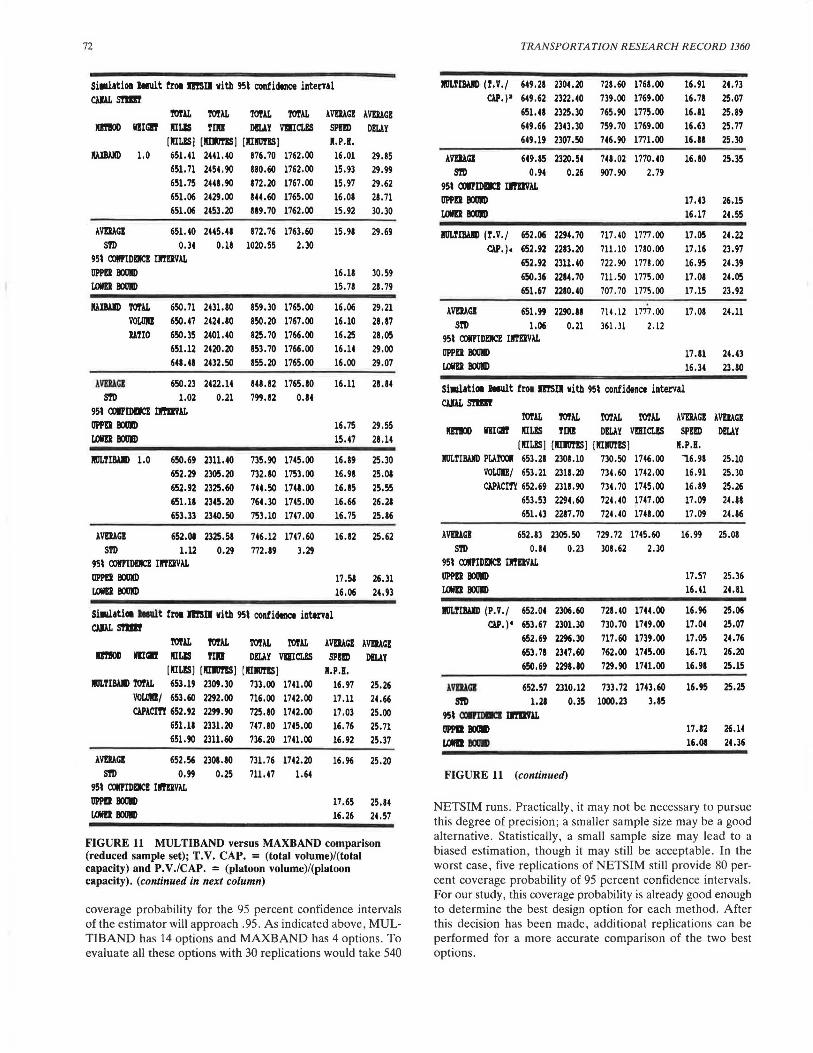
requirements is given in the next section. The results of the comparisons are given in Figure 11 and illustrated in Figures 12 (average speed) and 13 (average delay). It can be easily seen that had we not used this method of analysis, there was a definite chance that we would have drawn incorrect conclusions-that is, that the advantages of the MULTIBAND options with respect to MAXBAND would not be identified. Only by identifying the appropriate confidence intervals of the different options can we make valid statistical statements on the alternatives that we compare.
Additional statistical analysis techniques can be applied for the comparison of ratio values using hypothesis testing (2) . However , from a traffic engineering standpoint the results obtained so far indicate a clear advantage of all the MULTIBAND options relative to the MAXBAND strategies. This is particularly evident when comparing average delays, because the signal controls directly affect the delay time on the arterial. On the other hand, the overall travel time (or the speed) also includes that portion of travel time on the link that is unaffected by the signal settings.
SAMPLE SIZE REQUIREMENTS
According to the Gafarian-Halati study, when normality is reached and the number of replications exceeds 40, then the
72
Sislatioa lelu.lt fro1 ll!SII with 951 confidence interval CWLSTlll!
FIGURE 11 MUL TIBAND versus MAXBAND comparison (reduced sample set); T.V. CAP. = (total volume)/(total capacity) and P.V./CAP. = (platoon volume)/(platoon capacity). (continued in next column)
coverage probability for the 95 percent confidence intervals of the estimator will approach .95 . As indicated above , MULTIBAND has 14 options and MAXBAND has 4 options. To evaluate all these options with 30 replications would take 540
NETSIM runs. Practically, it may not be necessary to pursue this degree of precision; a smaller sample size may be a good alternative. Statistically, a small sample size may lead to a biased estimation , though it may still be acceptable . In the worst case, five replications of NETSIM still provide 80 percent coverage probability of 95 percent confidence intervals. For our study, this coverage probability is already good enough to determine the best design option for each method. After this decision has been made , additional replications can be performed for a more accurate comparison of the two best options.
FIGURE 12 Average speed comparison, Canal Street, MUL TIBAND versus MAXBAND.
WEIGHTS
1.0
Total Volume Ratio
1.0
Total Volume/Cap.
Platoon Vol./Cap.
(T. V./Cap.)"2
(T. V./Cap.)"4
(P. V ./Cap.)" 4
MAXB .. NO - -- · MULTIBANO
,________.. ,__,..__.
. ...... ~....,.___.,
HH
,____.....
22 24 26 28
DELAY (SECONDS/VEHJ
• AVERAGE DELAY
30
FIGURE 13 Average delay comparison, Canal Street, MUL TIBAND versus MAXBAND.
18
32
In our comparison study, we took five replications for each option of both methods (shown in Figures 11-13). It shows clearly that the best option for MUL TIBAND in terms of average delay is when the weights equal to the total volume/ capacity ratio with the fourth power; for MAXBAND, it is when the weight equals to the total volume ratio. In both cases, the band's location option is centered.
Comparing Figures 3 and 4 with Figures 12 and 13, it is clear that the 95 percent confidence intervals shown in Figures 12 and 13 are larger. The reason is that a larger sample size reduces the variation caused by the different random seeds or, in case of a field test, the unknown factor of variation. It is, therefore, very important to decide what is the desired sample size, because a proper sample size not only saves time and money but also provides a good conclusion for the comparison study. A logical way to decide on the sample size is to use as input the desired variation and the results of a small pilot study.
Sometimes, according to varying requirements, the engineer may specify the desired variation and then choose the
73
number of replications on the basis of the specified variance . For example, if the desired result is for the variance of the number of vehicle-trips to be smaller than desired variance (DYAR), the required number of replications according to a sample size of n, in a pilot study is n = sf (1 + 2/n1)/DV AR where sf is the variance of the pilot sample.
Assume a pilot study is conducted with a sample variance of total vehicle trips of sf = 64 and n 1 = 5. The sample variance of the final study could be reduced to 4, yielding a total sample size for the final study of n = 64(1 + 2/5)/4 = 22.4 = 23, that is, an additional 18 replications can reduce the variance of the vehicle trips to 4. Thus, a small pilot study can be used as a guide in obtaining the final desired accuracy.
CONCLUSIONS
Many important traffic MOEs are calculated as the ratio of two random variables. This is also so when simulation models are used for traffic system evaluation. To obtain a valid statistical analysis, ratio estimation techniques must be used . In this paper we have shown how such techniques can be applied to compare the effectiveness of alternative traffic control strategies. Guidelines are provided for determining the number of simulation samples that should be produced to achieve a desirable accuracy.
The methodology described in this paper can be used to evaluate any control or management strategy using simulation data. The analysis techniques have wider applications: they may also be applied to the estimation of parameters, the assessment of the accuracy of estimates from field data, and the comparison of field data with simulated data for validation studies.
REFERENCES
1. A. V. Gafarian and A. Halati. Statistical Analysis of Output Ratios in Traffic Simulation. In Transportation Research Record 1091, TRB, National Research Council, Washington, D.C., 1986, pp. 29-36.
2. W. G. Cochran. Sampling Techniques, 3rd ed. John Wiley & Sons, New York, N.Y., 1977.
3. J . D . C. Little, M. D. Kelson , and N. H . Gartner. MAXBAND: A program for Setting Signals on Arteries and Triangular Networks . In Transportation Research Record 795, TRB, National Research Council, Washington, D.C., 1981, pp. 40-46.
4. E. C. P. Chang, C. J. Messer, and R. U. Garza. Arterial Signal Timing Optimization Using PASSERII-87. JTE Journal, Nov. 1988, pp. 27-31.
5. N. H. Gartner, S. F. Assmann , F. Lasaga, and D. Hou. MULTIBAND: A Variable Bandwidth Arterial Progression Scheme. In Transportation Research Records 1287, TRB, National Research Council, Washington, D .C., 1990, pp. 212-222.
Publication of this paper sponsored by Commitlee on Traffic Signal Systems.