Comparative Evaluation of Roundabouts with other Intersection Control Methods in the Island of Jamaica Janine M. Dawkins, Daniel ten Ham, Winston Farquharson Abstract Roundabouts have been in use/operation in Jamaica for many years. Some of these were inherited from the British prior to Independence in 1962. Many of these were installed along rural highways, as space constraints limited their use in urban areas. Since 1990, only two new roundabouts have been installed, and many more than this have been removed and replaced with traffic signals. Many persons have been convinced that roundabouts are outdated devices that are no longer appropriate for use in a modern society. This perception, however, has not been supported by any empirical evidence, as most of these installations are not fully evaluated to allow a true comparison of the quality/level of service provided by the various devices. This research paper compares the operational characteristics of roundabouts with other methods of intersection control used at four (4) locations in Jamaica, with similar traffic and in the same geographical area. The specific operational characteristics that are compared are: traffic volume and distribution, delay per vehicle, accident rate/conflicts, maintenance costs, land and infrastructure requirements, and driver compliance. While roundabouts generally require more land and higher initial capital outlay, the ongoing maintenance costs are significantly lower, and accident rates are generally less. However, the efficiency of roundabouts tends to decrease with increasing traffic volume, and driver compliance becomes more critical to effective operation. The findings of this study will be used to influence policy decisions and standard-setting in the selection of intersection control methods for future road improvement projects. Background Roundabouts have been in use/operation in Jamaica for many years. Some were inherited from the British prior to Independence in 1962. Many of these were installed along rural highways, as space constraints limited their use in urban areas. There are about fifty (50) roundabouts in Jamaica, not including those installed fairly recently in residential schemes. Since 1990, only two new roundabouts have been installed along major public roads, and many more than this have been removed and replaced with traffic signals. Many persons have been convinced that roundabouts are outdated devices that are no longer appropriate for use in a modern society. This perception, however, has not been supported by any empirical evidence, as most of these installations are not fully evaluated to allow a true comparison of the quality/level of service provided by the various devices. New road corridors are being constructed with priority or traffic-signal controlled junctions where roundabouts could potentially be more suitable solutions. Policy directives for the use of more grade-separated junctions further complicate the issue, as there are no clear standards or guidelines to govern intersection installations, and these are needed to establish the role and suitability of different types of intersection control to be used as the circumstances dictate. National Roundabout Conference 2008 1 Transportation Research Board
Transcript
Comparative Evaluation of Roundabouts with other Intersection Control Methods in the Island of Jamaica
Janine M. Dawkins, Daniel ten Ham, Winston Farquharson
Abstract Roundabouts have been in use/operation in Jamaica for many years. Some of these were inherited from the British prior to Independence in 1962. Many of these were installed along rural highways, as space constraints limited their use in urban areas. Since 1990, only two new roundabouts have been installed, and many more than this have been removed and replaced with traffic signals. Many persons have been convinced that roundabouts are outdated devices that are no longer appropriate for use in a modern society. This perception, however, has not been supported by any empirical evidence, as most of these installations are not fully evaluated to allow a true comparison of the quality/level of service provided by the various devices. This research paper compares the operational characteristics of roundabouts with other methods of intersection control used at four (4) locations in Jamaica, with similar traffic and in the same geographical area. The specific operational characteristics that are compared are: traffic volume and distribution, delay per vehicle, accident rate/conflicts, maintenance costs, land and infrastructure requirements, and driver compliance. While roundabouts generally require more land and higher initial capital outlay, the ongoing maintenance costs are significantly lower, and accident rates are generally less. However, the efficiency of roundabouts tends to decrease with increasing traffic volume, and driver compliance becomes more critical to effective operation. The findings of this study will be used to influence policy decisions and standard-setting in the selection of intersection control methods for future road improvement projects. Background Roundabouts have been in use/operation in Jamaica for many years. Some were inherited from the British prior to Independence in 1962. Many of these were installed along rural highways, as space constraints limited their use in urban areas. There are about fifty (50) roundabouts in Jamaica, not including those installed fairly recently in residential schemes. Since 1990, only two new roundabouts have been installed along major public roads, and many more than this have been removed and replaced with traffic signals. Many persons have been convinced that roundabouts are outdated devices that are no longer appropriate for use in a modern society. This perception, however, has not been supported by any empirical evidence, as most of these installations are not fully evaluated to allow a true comparison of the quality/level of service provided by the various devices. New road corridors are being constructed with priority or traffic-signal controlled junctions where roundabouts could potentially be more suitable solutions. Policy directives for the use of more grade-separated junctions further complicate the issue, as there are no clear standards or guidelines to govern intersection installations, and these are needed to establish the role and suitability of different types of intersection control to be used as the circumstances dictate.
National Roundabout Conference 2008 1 Transportation Research Board
Page 2 of 2
While roundabouts generally require more land and higher initial capital outlay, the ongoing maintenance costs can be significantly lower, and accident rates are generally less. However, the efficiency of roundabouts tends to decrease with increasing traffic volume, and driver compliance becomes more critical to effective operation. Careful analysis of each potential location is therefore necessary to determine whether a roundabout would be a suitable installation for the prevailing and projected conditions. The apparent lack of or scarcity of empirical evidence to support the view that roundabouts are inappropriate for modern day society necessitates a study that seeks to provide data that is reliable, valid and relevant, the analysis of which can/will provide a basis for an informed decision on the issue. Hence, this research will compare the operational characteristics of roundabouts with other methods of intersection control used at four (4) locations in Jamaica, with similar traffic and in the same geographical area. The findings of this study will be used to influence policy decisions and standard-setting in the selection of intersection control methods for future road improvement projects. Literature Review Baranowski1 states that roundabouts are being increasingly considered in the United States to improve vehicle safety, increase roadway capacity and efficiency, reduce vehicular delay and emissions and to identify community gateways. He defines a typical roundabout as an unsignalised intersection with a circular central island and a circulatory roadway around the island, at which vehicles entering the roundabout yield to vehicles already on the circulatory roadway. In relation to the future of roundabouts, he states:
“The roundabout community anticipates that roundabouts will be built in the United States annually by the hundreds in the coming years and by the thousands annually, duplicating the trends first in Britain and Australia during the 1970s and 1980s and now being repeated throughout western Europe. For example, France went from 12,000 roundabouts in 1990 to over 23,000 roundabouts today. Most have been built since the mid-1970s. In 2001, there were 23,000 roundabouts in France resulting in 1,329 injury accidents, but only 86 involving pedestrians”.
Despite this, roundabouts are still controversial in the United States. The design of the Yelm Highway project2 in Thurston, Washington, included roundabouts, which have the advantage of requiring less property for a centre turn lane than some signalised locations, but citizens had concerns about pedestrian safety, driver inexperience with roundabouts and resulting backups. Some arguments used by design engineers include: roundabouts will reduce speed, reduce the number and severity of collisions, keep traffic moving and require less maintenance than signalized intersections. The arguments given for roundabouts are relevant in the Jamaican context given the high level of accidents on our roadways, particularly fatal accidents. Also, since Jamaica is a small island nation, any intersection control mechanism that supposedly uses less property should/would likely be viewed favourably.
Comparative Evaluation of Roundabouts with other types of Intersection Control in Jamaica Technical Services Unit, Ministry of Transport and Works, Kingston, Jamaica
May 2008
National Roundabout Conference 2008 2 Transportation Research Board
Page 3 of 3
One textbook on the subject states that space requirements for roundabouts have reduced over the years (see below). However, one must consider that this question of less land needed for roundabouts is relative to other factors than just the availability of land. For example, Jamaica, being a small island nation would necessarily have smaller capacity road networks and, roundabouts would have to be built to fit into that network. Van Zuylen3 makes the following statement about roundabouts:
“If the capacity of a priority intersection is insufficient, a roundabout can be an alternative. By separating conflict areas, the performance of a roundabout is higher than the performance of most regular uncontrolled priority intersections; delays are often less and the acceptance by road users higher. The geometry and the priority rules determine the capacity of the roundabout. Due to its strong reduction of severe accidents and its high capacity in comparison with original uncontrolled intersections, roundabouts have become rather popular in the past decades. The number of roundabouts is growing fast: each year about 50 to 60 new roundabouts are built in the Netherlands.”
This certainly makes a strong argument for the use of roundabouts for intersection control. The author states that roundabouts were rarely used by Dutch road designers until the mid 1980’s. Roundabouts gradually became widely accepted, as the priority rules and the design standards were changed. The distinction between traditional and modern roundabouts is primarily the fact that the circulating traffic has priority. As a consequence, traffic can leave the roundabout unhindered and buffer space on the roundabout is hardly needed. So, the size of the roundabout decreased. Another major advantage of the “new” roundabout concerns the achieved safety. Interestingly, the crucial priority rule for the “modern” roundabout concerning its characteristic of giving the circulating traffic the priority – which is the critical element to the improved safety achieved – has been in effect in Jamaica from the very early days of the implementation and use of roundabouts in Jamaica. The operation, and resulting capacity, of most of these roundabouts are governed by the principles of gap-acceptance at low to medium speeds rather than weaving at higher speeds. Nambisan and Parimi4 conducted a comparative study in Las Vegas, Nevada, with specific emphasis on the safety performance, and concluded that:
“The findings of the study reported here indicate that roundabout control is safer than STOP/signal control at the minor- and medium-level intersections evaluated. Although the findings for the major roundabout intersections are not similar, it is believed that improved road design and public awareness would increase intersection safety at such roundabouts.”
The authors noted the difficulty in choosing “comparable” intersections based on ADT, but a letter published in a subsequent ITE Journal 5 presented several comments about the methodology, including the fact that the intersections being compared were in locations that did not share similar traffic, land use, or socio-economic characteristics, and that recent modifications had been made to some of the mentioned locations to improve safety.
Comparative Evaluation of Roundabouts with other types of Intersection Control in Jamaica Technical Services Unit, Ministry of Transport and Works, Kingston, Jamaica
May 2008
National Roundabout Conference 2008 3 Transportation Research Board
Page 4 of 4
Study Methodology This research involved empirical data collection and field measurement of specific operational characteristics of roundabouts, to be compared with similar measurements made at intersections with other methods of intersection control. The specific characteristics that for comparison are:
a) Traffic volume and distribution b) Delay per vehicle c) Accident rate / conflicts d) Maintenance costs e) Land / infrastructure requirements f) Driver compliance
Given the nature of the characteristics to be studied, various methodologies were used. These include, but are not necessarily limited to the following:
1. Traffic counts – using count forms/counters and/or electronic counting devices. 2. Use of chronometers – for determining time delays re vehicles using the intersection. 3. Database searches of available accident records – to ascertain the number of accidents
and their cause(s) at each intersection that is being studied. 4. Appropriate economic/costing procedures – to determine the monetary cost of
constructing and maintaining the intersections being studied. 5. Use of appropriate distance and area measuring and imaging device(s) - GPS / GIS,
etc. – to determine the quantity of land and infrastructure required for the different types of intersections being studied.
6. Field observation of driver behaviour and compliance Data Collection • Traffic counts and queue delay studies were conducted simultaneously at the locations under
comparison. • Accident data was gathered from the accident database, validated by physical checks of
records during field visits to the relevant police divisions. • The intersection geometry was determined through a combination of on-site observation and
the use of satellite imagery and aerial photography. Data Analysis The traffic data and queue delay results were entered and analysed using Microsoft Excel, and charts comparing the average delay per vehicle with the total intersection volume were generated. A more detailed analysis of the delay experienced on major versus minor roads was also conducted. Projections of the economic value of potential time savings (based on measured delay at the different intersections) were made using national estimates of the value of commuter time. Estimated construction costs (at current industry rates) for the different intersection configurations were determined for each study location, and the life cycle costs (capital and recurrent/maintenance costs) were determined for a 15-year period.
Comparative Evaluation of Roundabouts with other types of Intersection Control in Jamaica Technical Services Unit, Ministry of Transport and Works, Kingston, Jamaica
May 2008
National Roundabout Conference 2008 4 Transportation Research Board
Page 5 of 5
Accident history, including the frequency, severity and nature of accidents occurring at the study locations was assessed and analysed to make comparisons between the safety record of the roundabouts and the other methods of control. Study locations The locations at which to execute the study were selected based on in-depth knowledge of the roundabouts throughout Jamaica. Several roundabouts could not be included in this study because of difficulty in identifying an appropriate intersection for comparison. The criteria used for selection are as follows:
1. Both intersections (roundabout and comparative intersection) should have similar traffic volume and directional distribution of traffic movements.
2. All approaches to both intersections to be two-lane roadways.
3. Intersections should be in close proximity (within one kilometre of each other) and in
areas of similar land use.
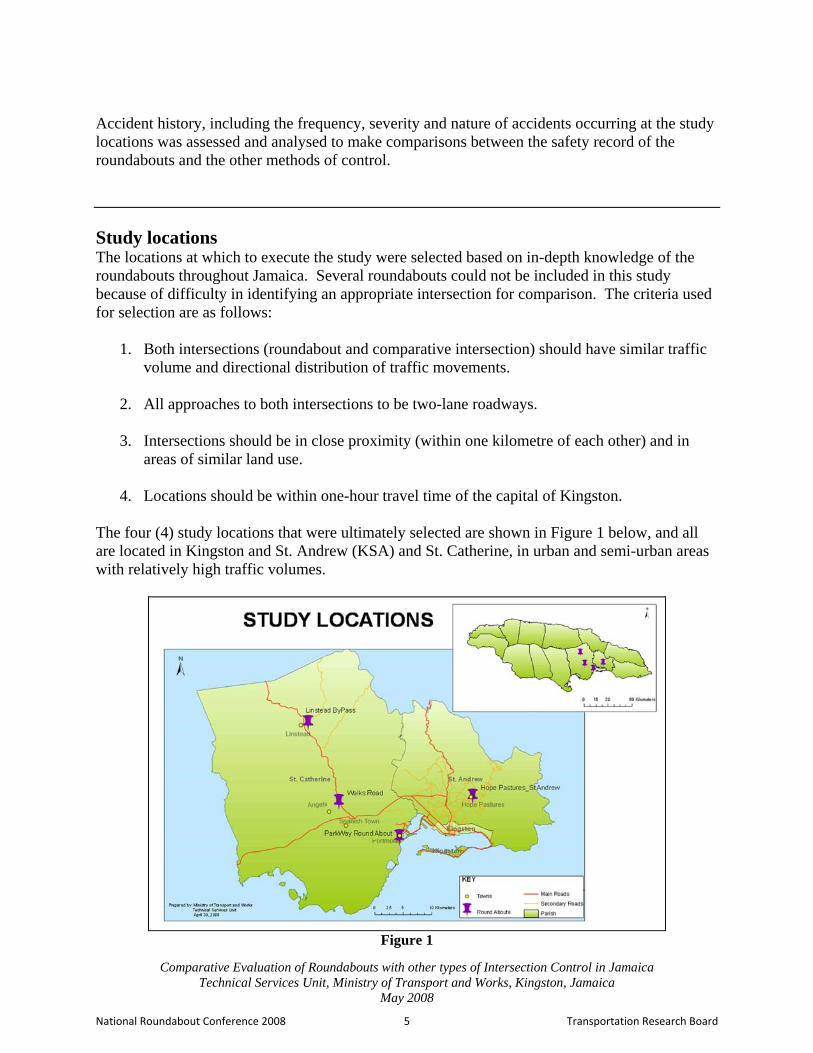
4. Locations should be within one-hour travel time of the capital of Kingston. The four (4) study locations that were ultimately selected are shown in Figure 1 below, and all are located in Kingston and St. Andrew (KSA) and St. Catherine, in urban and semi-urban areas with relatively high traffic volumes.
Figure 1
Comparative Evaluation of Roundabouts with other types of Intersection Control in Jamaica Technical Services Unit, Ministry of Transport and Works, Kingston, Jamaica
May 2008
National Roundabout Conference 2008 5 Transportation Research Board
Page 6 of 6
Details of the study locations are set out below.
Location 1 (Hope Pastures): Urban residential area – roundabout vs. 2-way stop control at 4-leg intersection
a. The roundabout at the Hope Boulevard / Monterey Drive Intersection b. The Charlemont Drive/Monterey Drive intersection, approximately 100 metres
northwest of the roundabout. Both intersections are indicated in Figure 2.
Figure 2
Location 2 (Linstead Bypass): Rural two-lane highway – roundabout vs traffic signal at 4-leg intersection
a. Roundabout at Rosemount intersection along Linstead Bypass b. The intersection of the main road to Guys Hill with Linstead Bypass at Vanity Fair
These intersections are shown in Figure 3.
Figure 3
Comparative Evaluation of Roundabouts with other types of Intersection Control in Jamaica Technical Services Unit, Ministry of Transport and Works, Kingston, Jamaica
May 2008
National Roundabout Conference 2008 6 Transportation Research Board
Page 7 of 7
Location 3 (Walks Road):
Suburban two-lane highway – roundabout vs minor street stop control at T-junction a. Roundabout at Walks Road/entrance to Angels Phase II b. Intersection at entrance to G.C. Foster College
Figure 4 shows the intersections that were studied.
Figure 4
Location 4 (Portmore Parkway):
Urban residential area – roundabout vs 2-way stop at 4-leg intersection a. Roundabout at Portmore Parkway/Edgewater b. Intersection along Portmore Parkway at HEART Academy
These intersections are shown in Figure 5.
Figure 5
Comparative Evaluation of Roundabouts with other types of Intersection Control in Jamaica Technical Services Unit, Ministry of Transport and Works, Kingston, Jamaica
May 2008
National Roundabout Conference 2008 7 Transportation Research Board
Page 8 of 8
Research Findings A number of setbacks were experienced that affected the results of the research exercise, and it ishoped that these can be overcome in follow-u
p studies, which should be conducted to assess the
erformance of roundabouts in more detail.
ich
at, s
in place at some of the roundabouts and intersections, and this could have had an pact.
types
tions could not be compared because no information was available at the required level f detail.
the was
out or a traffic signal could be used improve the safety record of an unsignalised intersection.
ection ions
Fatal Serious injury Minor injury y
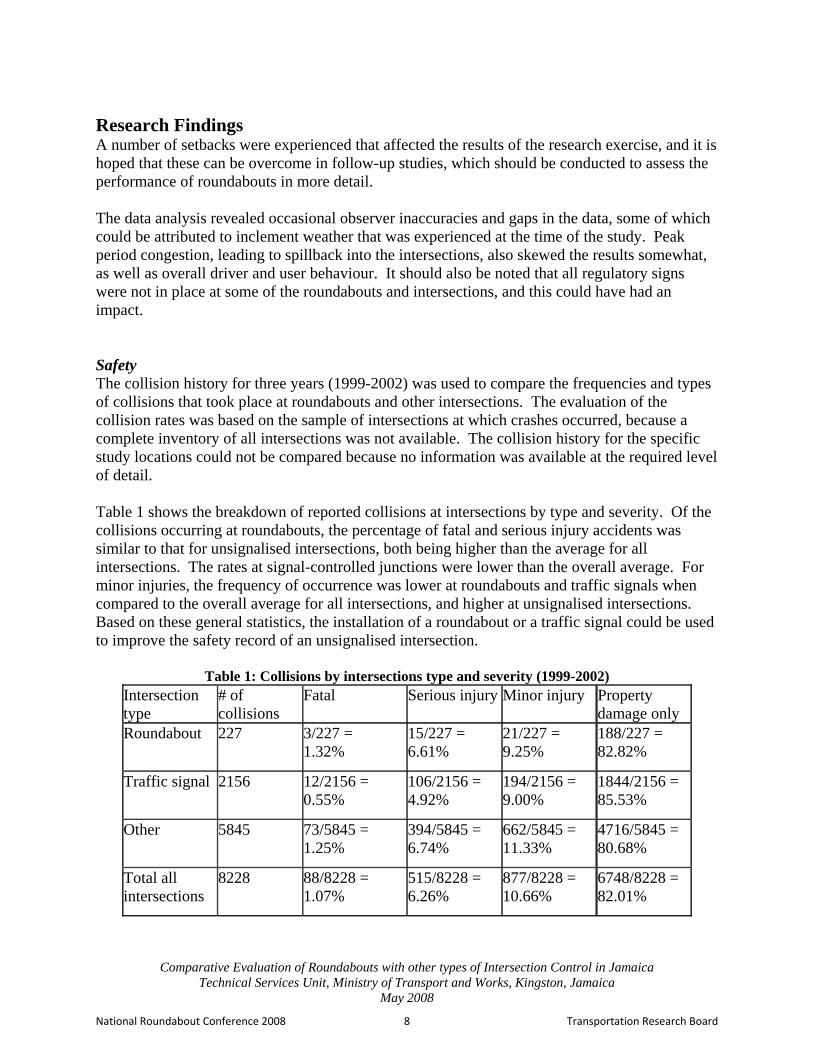
p The data analysis revealed occasional observer inaccuracies and gaps in the data, some of whcould be attributed to inclement weather that was experienced at the time of the study. Peak period congestion, leading to spillback into the intersections, also skewed the results somewhas well as overall driver and user behaviour. It should also be noted that all regulatory signwere notim Safety The collision history for three years (1999-2002) was used to compare the frequencies andof collisions that took place at roundabouts and other intersections. The evaluation of the collision rates was based on the sample of intersections at which crashes occurred, because a complete inventory of all intersections was not available. The collision history for the specific study locao Table 1 shows the breakdown of reported collisions at intersections by type and severity. Ofcollisions occurring at roundabouts, the percentage of fatal and serious injury accidents similar to that for unsignalised intersections, both being higher than the average for all intersections. The rates at signal-controlled junctions were lower than the overall average. Forminor injuries, the frequency of occurrence was lower at roundabouts and traffic signals when compared to the overall average for all intersections, and higher at unsignalised intersections. Based on these general statistics, the installation of a roundabto
Table 1: Collisions by intersectioInters
ns type and severity (1999-2002) Property
type # of collis damage onl
Roundabout 227 = = = 3/227 =1.32%
15/227 6.61%
21/227 9.25%
188/227 82.82%
Traffic signal 2156 = 6 = 6 = 6 = 12/21560.55%
106/2154.92%
194/2159.00%
1844/21585.53%
Other 5845 = 5 = = 5 = 73/58451.25%
394/5846.74%
662/584511.33%
4716/58480.68%
Total all intersections
8228 88/8228 = 1.07%
8 = 6.26%
= 10.66%
8 = 82.01%
515/822 877/8228 6748/822
Comparative Evaluation of Roundabouts with other types of Intersection Control in Jamaica Technical Services Unit, Ministry of Transport and Works, Kingston, Jamaica
May 2008
National Roundabout Conference 2008 8 Transportation Research Board
Page 9 of 9
Table 2 compares the collision rate for roundabouts and traffic signals in relation to the numof intersections of each type. As there are far fewer roundabouts than traffic signals, the number of collisions per intersections and the injury/fatality rate is higher at traffic signals than at roundabouts. This would indicate that roundabouts have better safety characteristics than traffic signals. However, average daily traffic information for each intersection type was not availablso no analysis in relation to the e
ber
e, xposure of motorists could be carried out. This is an important
ctor which should be evaluated to provide a complete assessment of the safety record at the different
Table 2: Comparison of collisions at r d als (1Intersection # of
ections # of
ions Collisions per
ection Injury and fatal
isions Injury/fatality
fatypes of intersections.
oundabouts an traffic sign 999-2002)
type inters collis inters coll per intersection
Roundabout ~ 50 227 4.54 39 0.78
Traffic signal ~ 200 2156 10.78 312 1.56
At roundabouts, rear-end collisions were predominant (41%), followed by other accidents (including switching lanes, failing to keep in lane, and improper swerving), and crossing collisions (15%). In contrast, at other intersections (signalised and unsignalised), crossing crashes accounted for 31% of the oc
34%,
currences, with 22% being rear-end collisions, 16% other ccidents, and 14% turning crashes. For this comparison, traffic signals are included in the
Table 3 shows the com
Table crash nt type ROUNDA TS HER INTE TIONS
acategory of “other intersections”.
parison of traffic crashes by accident type.
3: Traffic es by accide (1999-2002)Accident type BOU OT RSEC Number total mber total % of Nu % ofBicycle accident 6 2.64 190 2.37 Crossing accident 34 14.98 2494 31.17Head-on accident 1 6.60 319 3.99 Overtaking accident 4 1.76 550 6.87 Pedestrian accident 3 1.32 233 2.91 Rear-end accident .97 93 40 1750 21.87 Single accident 8 3.52 131 1.64 Turning accident 0 0 1078 13.47Other accident 78 34.36 1256 15.70 Total 227 100 8001 100 While general conclusions may be drawn from the information presented in the tables above,
ore detail is required for these results to be conclusive, and more research is needed in this rea.
ma
Comparative Evaluation of Roundabouts with other types of Intersection Control in Jamaica Technical Services Unit, Ministry of Transport and Works, Kingston, Jamaica
May 2008
National Roundabout Conference 2008 9 Transportation Research Board
Page 10 of 10
Driver compliance During the data collection, the behaviour of drivers was observed to have a large influperformance of es
ence on the pecially the roundabouts. The factors that had a major effect on the
erformance are:
ut - obscurity of traffic rules regarding right-of-way
ed, but his through improved
aintenance could be a way to improve the level of compliance.
duce their
eed or caused unsafe situations when passing vehicles did not reduce their speed.
duced speed. As a result, traffic on the minor flows approached the roundabout more carefully.
rity in the ourly traffic to allow reasonable comparisons of the average delay per vehicle.
ange o ic Location tion
c/hr c/hr e
p
- the (pseudo) conflict at entrances of the roundabout - vehicles stopping along the kerb on the roundabo
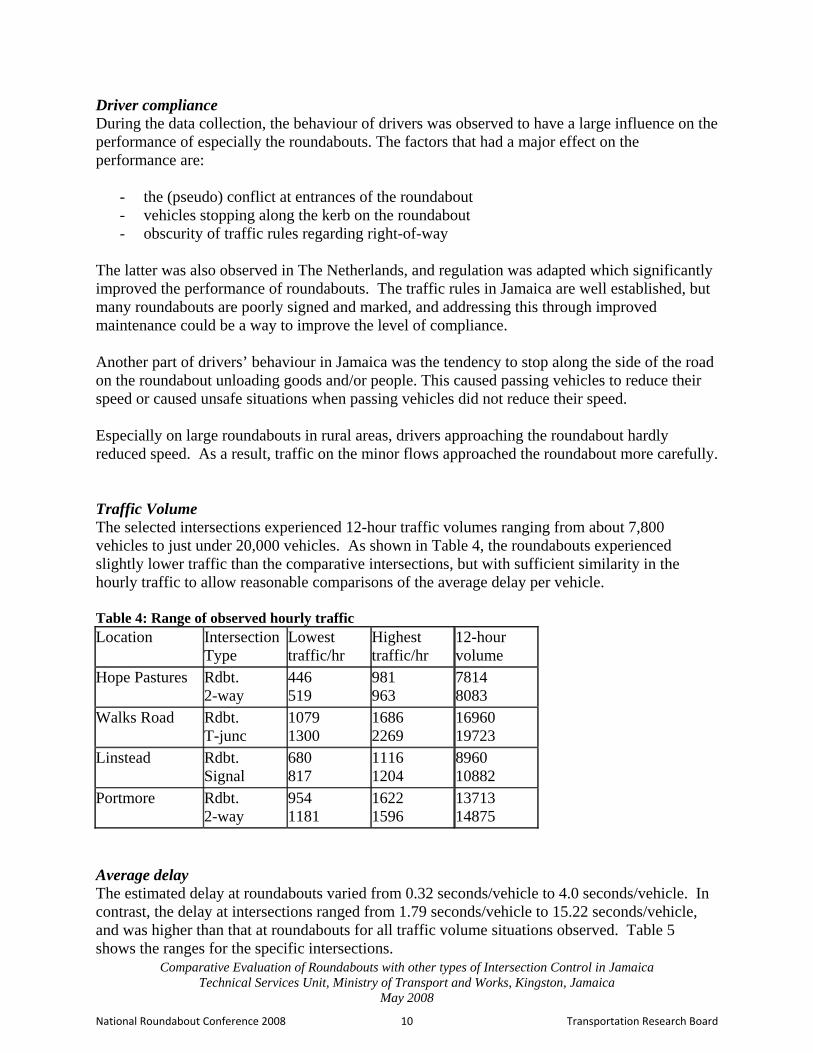
The latter was also observed in The Netherlands, and regulation was adapted which significantly improved the performance of roundabouts. The traffic rules in Jamaica are well establishmany roundabouts are poorly signed and marked, and addressing tm Another part of drivers’ behaviour in Jamaica was the tendency to stop along the side of the roadon the roundabout unloading goods and/or people. This caused passing vehicles to resp Especially on large roundabouts in rural areas, drivers approaching the roundabout hardly re Traffic Volume The selected intersections experienced 12-hour traffic volumes ranging from about 7,800 vehicles to just under 20,000 vehicles. As shown in Table 4, the roundabouts experienced slightly lower traffic than the comparative intersections, but with sufficient similah Table 4: R f observed hourly traff
Lowest IntersecType traffi
Highest traffi
12-hour volum
Hope Pastures Rdbt. 2-way
446 519
981 963
7814 8083
Walks Road
Rdbt. T-junc
1079 1300
1686 2269
16960 19723
Linstead
Rdbt. Signal
680 817
1116 1204
8960 10882
Portmore Rdbt. 2-way 1181 1596 14875
954 1622 13713
Average delay The estimated delay at roundabouts varied from 0.32 seconds/vehicle to 4.0 seconds/vehicle. Incontrast, the delay at intersections ranged from 1.79 seconds/vehicle to 15.22 seconds/vehicand was higher than that at roundabouts for all t
le,
raffic volume situations observed. Table 5 ows the ranges for the specific intersections. sh
Comparative Evaluation of Roundabouts with other types of Intersection Control in Jamaica Technical Services Unit, Ministry of Transport and Works, Kingston, Jamaica
May 2008
National Roundabout Conference 2008 10 Transportation Research Board
Page 11 of 11
Table 5: Range o erved a elaLocation t
t
f obs verage dLowes
y HighesInt.
Type delay delayHope Pastures
Rdbt. 2-way
0.32 4.94
2.76 12.53
Walks Road
Rdbt. T-junc
0.36 1.79
4.00 11.92
Linstead
Rdbt. Signal
0.85 12.08
3.72 15.22
Portmore 2-way 2.33 5.89 Rdbt. 0.53 3.32
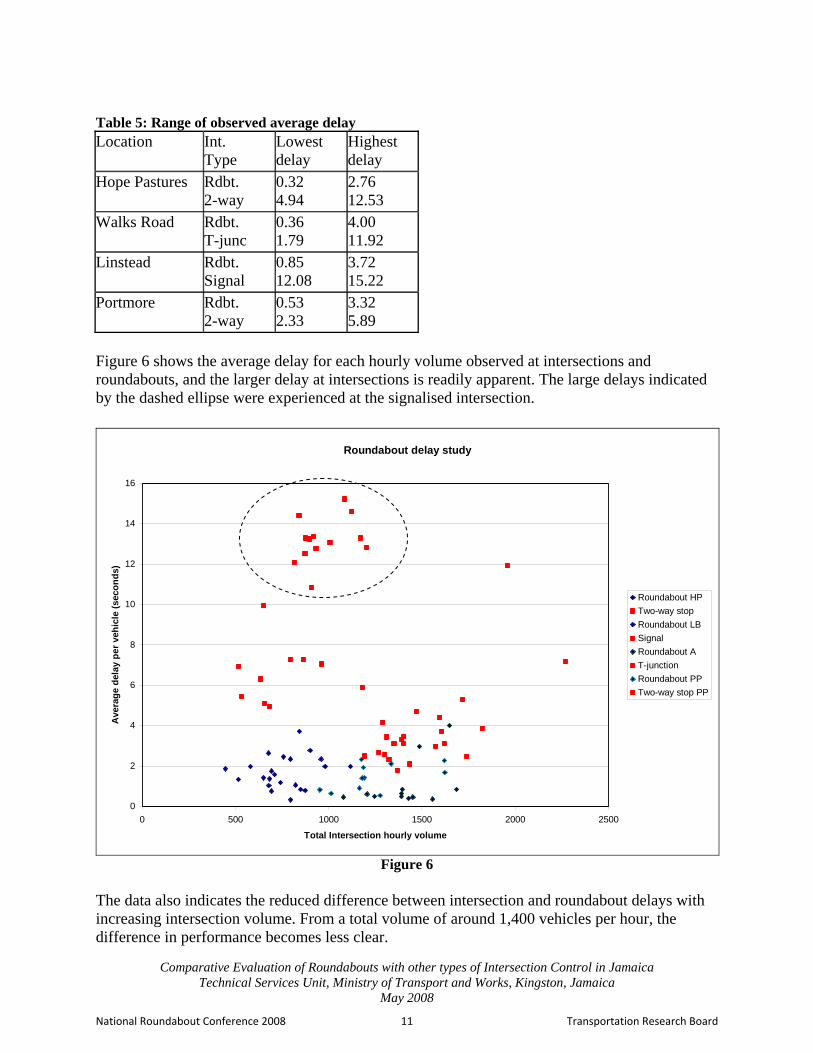
Figure 6 shows the average delay for each hourly volume observed at intersections and roundabouts, and the larger delay at intersections is readily apparent. The large delays indicated y the dashed ellipse were experienced at the signalised intersection.
The data also indicates the reduced difference between intersection and roundabout delays wincreasing intersection volume. From a total vod
Comparative Evaluation of Roundabouts with other types of Intersection Control in Jamaica Technical Services Unit, Ministry of Transport and Works, Kingston, Jamaica
May 2008
National Roundabout Conference 2008 11 Transportation Research Board
Page 12 of 12
At higher traffic volumes, downstream congestion affected the study intersections in some locations, reducing the throughput and increasing the measured delay for reasons not related to
e intersection geometry or operation.
vely s, the performance of
undabouts is significantly better than that of priority intersections.
oundabout volume and average elay since correlation coefficients vary between -0.10 and 0.55.
d le whereas intersections delay values are concentrated more around 3.0
conds per vehicle.
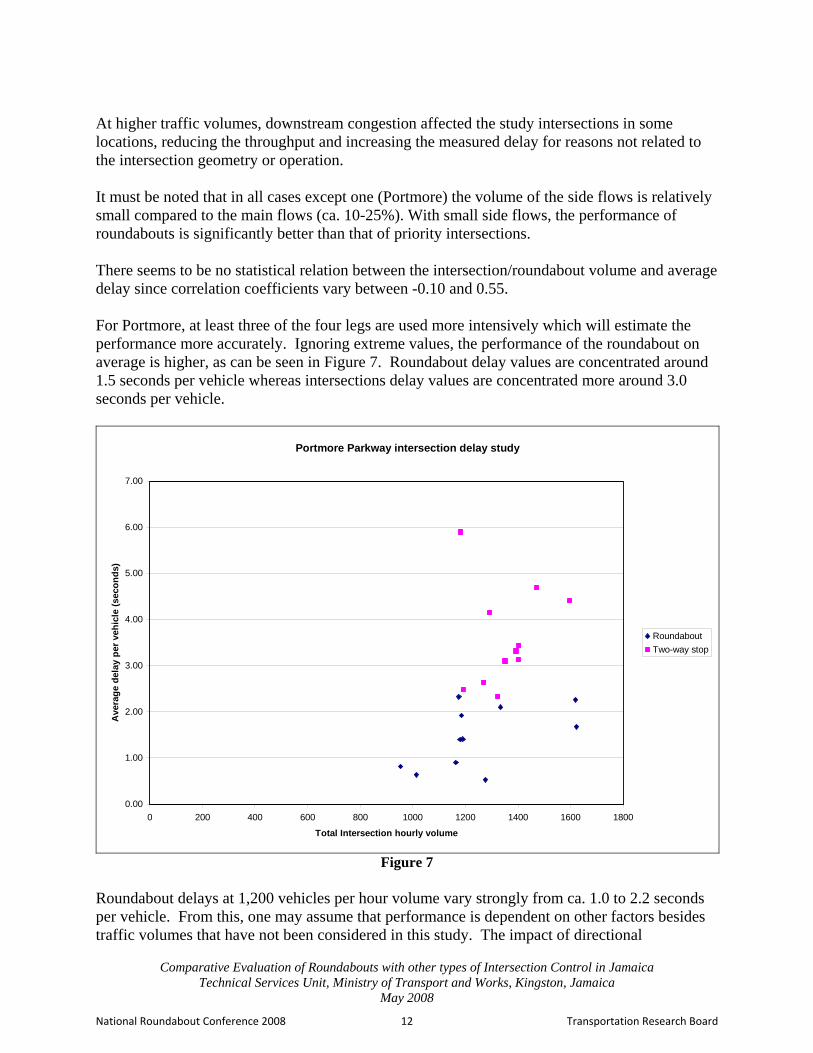
th It must be noted that in all cases except one (Portmore) the volume of the side flows is relatismall compared to the main flows (ca. 10-25%). With small side flowro There seems to be no statistical relation between the intersection/rd For Portmore, at least three of the four legs are used more intensively which will estimate the performance more accurately. Ignoring extreme values, the performance of the roundabout on average is higher, as can be seen in Figure 7. Roundabout delay values are concentrated aroun1.5 seconds per vehicse
Portmore Parkway intersection delay study
0.00
1.00
2.00
3.00
4.00
5.00
6.00
7.00
0 200 400 600 800 1000 1200 1400 1600 1800
Total Intersection hourly volume
Ave
rage
del
ay p
er v
ehic
le (s
econ
ds)
RoundaboutTwo-way stop
Figure 7
s besides traffic volumes that have not been considered in this study. The impact of directional
Roundabout delays at 1,200 vehicles per hour volume vary strongly from ca. 1.0 to 2.2 seconds per vehicle. From this, one may assume that performance is dependent on other factor
Comparative Evaluation of Roundabouts with other types of Intersection Control in Jamaica Technical Services Unit, Ministry of Transport and Works, Kingston, Jamaica
May 2008
National Roundabout Conference 2008 12 Transportation Research Board
Page 13 of 13
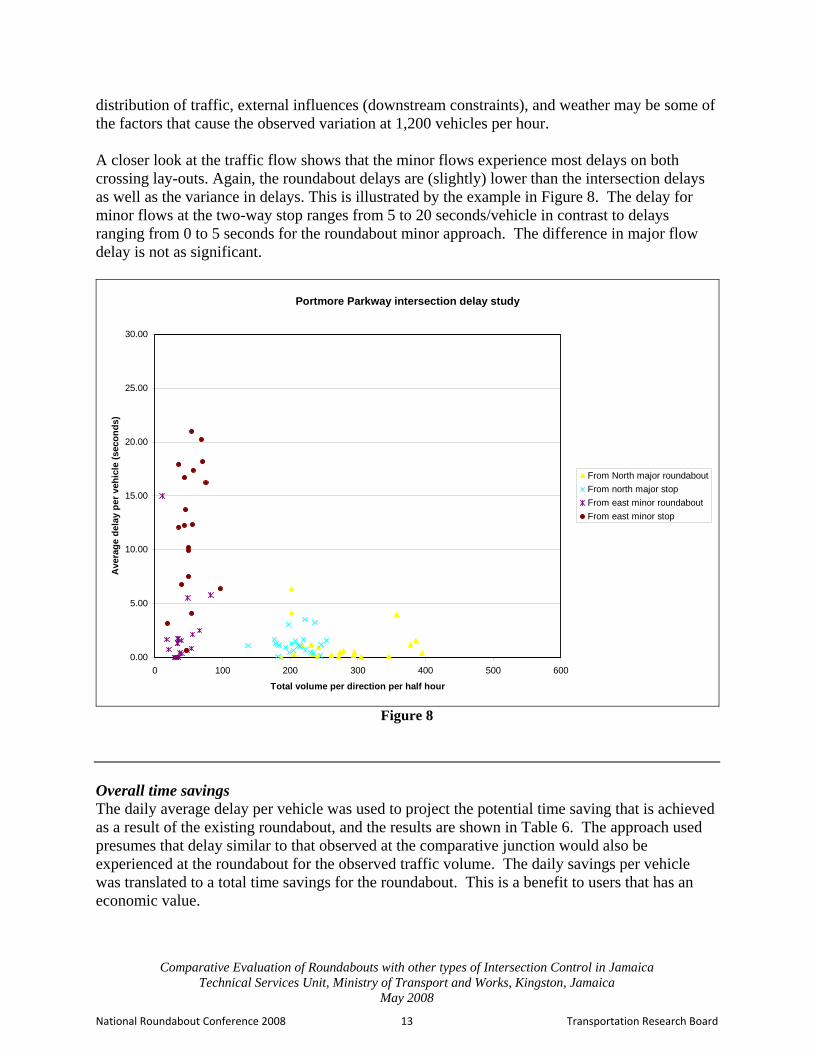
distribution of traffic, external influences (downstream constraints), and weather may be some of the factors that cause the observed variation at 1,200 vehicles per hour. A closer look at the traffic flow shows that the minor flows experience most delays on both crossing lay-outs. Again, the roundabout delays are (slightly) lower than the intersection delays as well as the variance in delays. This is illustrated by the example in Figure 8. The delay for minor flows at the two-way stop ranges from 5 to 20 seconds/vehicle in contrast to delays ranging from 0 to 5 seconds for the roundabout minor approach. The difference in major flow delay is not as significant.
Portmore Parkway intersection delay study
0.00
5.00
10.00
15.00
20.00
25.00
30.00
0 100 200 300 400 500 600
Total volume per direction per half hour
Ave
rage
del
ay p
er v
ehic
le (s
econ
ds)
From North major roundaboutFrom north major stopFrom east minor roundaboutFrom east minor stop
Figure 8
Overall time savings The daily average delay per vehicle was used to project the potential time saving that is achieved as a result of the existing roundabout, and the results are shown in Table 6. The approach used presumes that delay similar to that observed at the comparative junction would also be experienced at the roundabout for the observed traffic volume. The daily savings per vehicle was translated to a total time savings for the roundabout. This is a benefit to users that has an economic value.
Comparative Evaluation of Roundabouts with other types of Intersection Control in Jamaica Technical Services Unit, Ministry of Transport and Works, Kingston, Jamaica
May 2008
National Roundabout Conference 2008 13 Transportation Research Board
Page 14 of 14
Table 6: Time savings at roundabouts Location Intersection
Type Total Daily Volume
Total Delay (sec)
Daily Average (sec/veh)
Saving per vehicle per day (sec)
Total daily saving (hr)
Hope Pastures
Rdbt. 2-way
7814 8083
12465 63315
1.60 7.83
6.23 13.52
Walks Road Rdbt. T-junc
16960 19723
18750 88995
1.11 4.51
3.40 16.02
Linstead Rdbt. Signal
8960 10882
16500 146835
1.84 13.49
11.65 29.00
Portmore Rdbt. 2-way
13713 14875
20670 53670
1.51 3.61
2.10 8.00
Construction and Maintenance Costs Tables 7 and 8 show the surface area, construction costs and estimated annual maintenance costs for the investigated roundabouts and priority intersections respectively. For the roundabout, the total surface, including middle section and safety isles, is given between brackets. The costs for laying asphalt is estimated at J$2,500 per m2 (inclusive ground preparatory works). The estimated costs for land acquisition varies between J$2,000 and J$3,000, depending on location. In addition to this infrastructure the intersection at Linstead requires a traffic signal installation (approximately J$2.8 million1). Additional costs include supporting infrastructure and signs. Maintenance is limited to patching of the road surface. It is assumed that after 7 years the total surface of the road has been patched. For the signalised intersection, energy consumption of traffic lights is included. Table 7: Construction and maintenance costs for roundabouts Costs Roundabouts Hope Pastures Portmore Angels Linstead Surface area (m2) 604 (831) 2,112 (5,497) 1,794 (3,231) 1,458 (4,505)Land acquisition (J$) 2,077,500 8,742,500 6,843,125 8,357,523Asphalt surface (J$) 1,812,000 5,280,000 4,485,625 2,916,018Additional (25%) 972,375 3,505,625 2,832,188 2,818,385Total construction (MJ$) 4.86 17.53 14.16 14.09Annual O&M costs (MJ$) 0.1208 0.4224 0.3589 0.2916
Comparative Evaluation of Roundabouts with other types of Intersection Control in Jamaica Technical Services Unit, Ministry of Transport and Works, Kingston, Jamaica
May 2008
1 The currency exchange rate at the time of the study was J$70:US$1.
National Roundabout Conference 2008 14 Transportation Research Board
Page 15 of 15
Table 8: Construction costs for intersections Costs Intersections (J$) Hope Pastures Portmore Angels Linstead Surface area 49 993 178 1,680*Land acquisition 147,000 2,482,500 443,750 3,360,000Road surface 122,500 2,482,500 443,750 4,200,000Additional (25%) 67,375 1,241,250 221,875 1,890,000Traffic signals 0 0 0 2,800,000Total (MJ$) 0.34 6.21 1.11 12.25Annual O&M costs (MJ$) 0.0098 0.1986 0.0355 0.4560* This intersection has two right-turn lanes located on the main road, increasing the asphalt surface. For small, not signalized intersections (Hope Pastures, Angels) the maintenance is only about 10% of that for the investigated roundabout. For large intersections and large roundabouts the difference is much smaller (about 50% for Portmore) and with increasing size of the intersection requiring extra lanes, a roundabout may even become more attractive regarding maintenance costs. Life cycle cost comparison A fifteen (15) year life was used to determine the life cycle costs of the intersection, including initial construction and annual maintenance as set out above. Roundabouts, with larger surface areas, have higher costs as shown in Table 9. Table 9: 15-year construction and maintenance Location Type Construction
(J$’000) Maintenance (J$’000/year)
15-year C&M (J$’000)
Hope Pastures Rdbt. 2-way
4,860340
120.89.8
6,672.0487.0
Walks Road Rdbt. T-junc
14,1601,110
358.935.5
19,543.51,642.5
Linstead Rdbt. Signal
14,09012,250
291.6456.0
18,464.019,090.0
Portmore Rdbt. 2-way
17,5306,210
422.4198.6
23,866.09,189.0
The savings in time for users of roundabouts was taken into consideration in the life cycle analysis. An hourly value of J$120 was used to place a value on the savings to be achieved, but only applied for weekdays with no savings attributed to weekend traffic. As there was no specific collision data for these intersections, the economic impact from a safety perspective could not be included. Table 10 summarises the results, showing that the roundabouts at two of the locations had a lower net cost than the comparative intersection. At the higher traffic locations with smaller intersections, the savings achieved at roundabouts did not offset the higher costs of maintaining the infrastructure.
Comparative Evaluation of Roundabouts with other types of Intersection Control in Jamaica Technical Services Unit, Ministry of Transport and Works, Kingston, Jamaica
May 2008
National Roundabout Conference 2008 15 Transportation Research Board
Page 16 of 16
Table 10: Net Cost of Intersections for 15-year period Location Type 15-year C&M
cost (J$’000) 15-year time savings (hrs)
Value of savings (J$’000)
Net Cost (J$’000)
Hope Pastures Rdbt. 2-way
6,672.0487.0
52,728 6,327 345.0487.0
Walks Road Rdbt. T-junc
19,543.51,642.5
62,478 7,497 12,046.51642.5
Linstead Rdbt. Signal
18,464.019,090.0
113,100 13,572 4,892.019,090.0
Portmore Rdbt. 2-way
23,866.09,189.0
31,200 3,744 20,122.09,189.0
Conclusions Although not a statistically representative sample, the collected data on estimated delays at intersections and roundabouts indicates that at lower intersection volumes the performance of roundabouts is higher than that of priority intersections. With increasing intersection capacity, the performance of roundabouts reduces and similar delays are found at total intersection volumes of about 1,400 vehicles per hour. It must be noted that in three out of the four cases studied, the minor flows represent only 10 to 25% of the total volume. Delays are primarily experienced on the minor flows with high major flows; probably a result of small gaps on congested major flows. Roundabouts are more expensive to construct and maintain than priority intersections, but can result in significant savings for users through reductions in delay for traffic flows up to 1500 vehicles/hour and where minor flows are less than 25% of the total volume. In the long term, large intersections controlled by traffic signals can be more costly than well-designed roundabouts, especially if they are not programmed and maintained with optimal signal timing. Recommendations Further research should be conducted to look more closely at the safety elements of roundabouts in comparison with other types of intersection control. This could be achieved through conflict studies where specific collision information is not available. A further study of factors affecting delay at roundabouts should be carried out, given the variation observed at volumes of about 1200 vehicles per hour.
Comparative Evaluation of Roundabouts with other types of Intersection Control in Jamaica Technical Services Unit, Ministry of Transport and Works, Kingston, Jamaica
May 2008
National Roundabout Conference 2008 16 Transportation Research Board
Page 17 of 17
Comparative Evaluation of Roundabouts with other types of Intersection Control in Jamaica Technical Services Unit, Ministry of Transport and Works, Kingston, Jamaica
May 2008
In order to determine whether the observed operational characteristics are consistent for this type of control in different locations and situations, a follow-up study looking at roundabouts only should be conducted. This would allow for extrapolation of these results to be applied in various scenarios. Using this comparative evaluation, roundabouts could be implemented in Jamaica up to intersection volumes of about 1,400 vehicles per hour in the peak period. With relatively small minor flows, roundabouts could significantly reduce delays on both the major flow as the minor flows, especially when compared to signalised intersections. Locations that meet these characteristics are likely to be along major corridors in rural areas, in the vicinity of major towns and communities. Operational thresholds and guidelines should be developed that will inform decisions about the selection of intersection control measures. This would allow roundabouts to be assessed alongside other types of control in a professional and replicable manner. In designs for sub-urban and rural corridors, at locations where priority control is insufficient for safety or capacity reasons, roundabouts should be given due consideration as a viable and realistic alternative to traffic signals. References 1 Bill Baranowski, P.E., Roundabouts USA, Pedestrian Crosswalk Signals at Roundabouts: Where are they Applicable?, TRB Roundabout Conference, May 2005 2 Yelm Highway Project, March 2004 - http://www.co.thurston.wa.us/roads/design/yelmhwynewsletter.pdf. 3 Van Zuylen, Prof. H. (2007), Dynamic Traffic Management: Traffic Control, Chapter 3, Page 5. 4 Shashi S. Nambisan, Ph.D., P.E. and Venu Parimi, E.I.T., A Comparative Evaluation of the Safety Performance of Roundabouts and Traditional Intersection Controls, ITE Journal, March 2007 5 Raadt, Jacob D., P.E., Letter to the Editor, ITE Journal, June 2007, Page 14
National Roundabout Conference 2008 17 Transportation Research Board


![Why Roundabouts? [Infographic]](https://static.documents.pub/doc/80x56/5479635fb479599f098b4744/why-roundabouts-infographic.jpg)


