184
Comparative Functional Genomics of Amino Acid Metabolism of Lactic Acid Bacteria Marieke Pastink

Comparative Functional Genomics of Amino Acid Metabolism of
Lactic Acid Bacteria
Marieke Pastink

Thesis committee
Thesis supervisors Prof. Dr. W. M. de Vos
Professor of Microbiology
Wageningen University
Prof. Dr. J. Hugenholtz
Professor of Industrial Molecular Microbiology
University of Amsterdam
Other members Prof. Dr. T. Abee, Wageningen University
Prof. Dr. P. Hols, Université Catholique de Louvain
Dr. J. E. T. van Hylckama Vlieg, Danone, Palaiseau, France
Prof. Dr. R. J. Siezen, Radboud University Nijmegen
This research was conducted under the auspices of the graduate school VLAG

Comparative Functional Genomics of Amino Acid Metabolism of
Lactic Acid Bacteria
Marieke Pastink
Thesis
submitted in partial fulfilment of the requirements for the degree of doctor
at Wageningen University
by the authority of the Rector Magnificus,
Prof. dr. M. J. Kropff,
in the presence of
Thesis Committee appointed by the Doctorate Board
to be defended in public
on Friday 16 October 2009
at 4 PM in the Aula.

Marieke Pastink
Comparative Functional Genomics of Amino Acid Metabolism of Lactic Acid Bacteria
PhD thesis Wageningen University, Wageningen, the Netherlands (2009)
With references, with summaries in Dutch and English
ISBN 978-90-8585-461-6

Opgedragen aan mijn opa


Table of contents
Abstract 9
Chapter 1 Introduction and outline of this thesis 11
Chapter 2 Genomics and high-throughput screening approaches for 35
optimal flavor production in dairy fermentation.
Chapter 3 Genome-scale model of Streptococcus thermophilus LMG18311 55
for metabolic comparison of lactic acid bacteria.
Chapter 4 Effect of amino acid quantity on the metabolism of 81
three lactic acid bacteria: a comparative study
Chapter 5 The role of glutamate dehydrogenase in 115
Streptococcus thermophilus
Chapter 6 General discussion and future perspectives 143
Nederlandse samenvatting 163
List of publications 169
Training and Supervision Plan (VLAG) 171
About the author 173
Acknowledgements 175


Abstract
9
Abstract
The amino acid metabolism of lactic acid bacteria used as starters in industrial
fermentations has profound effects on the quality of the fermented foods. The work described
in this PhD thesis was initiated to use genomics technologies and a comparative approach to
link the gene content of some well-known lactic acid bacteria to flavor formation and to
increase our general knowledge in the area of amino acid metabolism. The three well-known
lactic acid bacteria that were used in these studies were Streptococcus thermophilus,
Lactococcus lactis and Lactobacillus plantarum. The complete genomes of all these model
bacteria have been sequenced and annotated in detail.
Comparative experimental and in silico studies of Streptococcus thermophilus with the
other two lactic acid bacteria, revealed the low degree of amino acid auxotrophies of this
species; it only needs two amino acids for (minimal) growth and this strain is able to produce
a varied amount of flavors. Lactococcus lactis and Lactobacillus plantarum require more
amino acids and produce fewer flavors than S. thermophilus. Furthermore, S. thermophilus
has a simple primary metabolism; homolactic growth is the only possible route under
anaerobic conditions and, remarkably, it does not have a complete pentose phosphate pathway
in contrast to the other two studied bacteria. This latter property has important consequences
for the redox metabolism of S. thermophilus and particularly its ability to produce NADPH.
A genome-scale metabolic model was developed and predicted that amino acid metabolism,
and especially glutamate degradation, and citrate metabolism are the most obvious
alternatives for NADPH generation. Several of these predictions were confirmed by
constructing a glutamate dehydrogenase mutant of S. thermophilus. This mutant revealed the
importance of the citrate pathway (and other amino acid degradation pathways) in NADPH
generation.
A comparative and functional genomics study of the three lactic acid bacteria showed
that amino acid depletion not only affects amino acid metabolism, but also flavor formation
and overall growth. The comparative genomics approach presented in this thesis can be used
to understand the amino acid metabolism of different lactic acid bacteria and their potential to
produce flavors under different conditions. Finally, it can be applied for optimization of
industrial fermentations.

10

Chapter 1
Introduction and outline of this thesis

Chapter 1
12
Introduction
This chapter will provide an overview of lactic acid bacteria, general concepts of
amino acid metabolism and the potential of a comparative genomics approach.
First, characteristics and applications of lactic acid bacteria will be described. Then amino
acid metabolism in general is explained and the last part will focus on functional genomics
techniques that can be used to study and compare different organisms. Finally, an outline of
this thesis will be provided.
Lactic acid bacteria
Lactic acid bacteria (LAB) belong to the order of Lactobacillales, a related group of
Gram-positive bacteria that are descended form a common ancestor. LAB are catalase-
negative, acid-tolerant, non-spore forming and are rod- or cocci shaped (55). The group of
LAB include genera such as Lactococcus, Lactobacillus, Oenococcus, Enterococcus,
Streptococcus, Leuconostoc and Weissella (Figure 1) (36, 55).
Oenococcus
Weissella
Lactobacillus
Dolosigranulum
Alloiococcus
StreptococcusLactoococcus
Enterococcus,Melissoococcus,Tetragenococcus
VagococcusCarnobacterium
Lactosphaera
Aeroococcus
Bifidobacterium
Propionibacterium
Leuconostoc
10%
Oenococcus
Weissella
Lactobacillus
Dolosigranulum
Alloiococcus
StreptococcusLactoococcus
Enterococcus,Melissoococcus,Tetragenococcus
VagococcusCarnobacterium
Lactosphaera
Aeroococcus
Bifidobacterium
Propionibacterium
Leuconostoc
10%10%
Figure 1. Major phylogenetic groups of LAB and related gram-positive bacteria with low (upper part) and high
(lower part) GC% in the DNA (modified according to Stiles and Holzapfel (55))

Introduction and outline of this thesis
13
LAB generally produce lactic acid as their major end product and are strictly fermentative.
Ecological niches of LAB are milk (5, 64), the gastro-intestinal tract of humans and other
animals and decaying plant material (66).
The LAB members can be divided in two groups based on their carbohydrate
metabolism. The homofermentative group, including Lactococcus, Enterococcus,
Streptococcus and some lactobacilli use the Embden-Meyerhof pathway in which glucose is
completely converted into lactate (48). The heterofermentative LAB, composed of
Leuconostoc, Weissella and some lactobacilli, produce lactate, acetate, CO2 and ethanol using
the hexose monophosphate pathway (48). Some homolactic LAB can also use the mixed acid
fermentation for growth, resulting in the formation of mainly acetate, formate and ethanol (20,
59).
The economic and industrial value of LAB is demonstrated by the wide variety of
applications (Table 1). Some LAB are also used as adjunct culture for flavor formation (21,
22, 56).
Table 1. Examples of some foods that are fermented with LAB, taken from Leroy and De Vuyst (34)
Type of fermented product Lactic acid bacteriaa
Dairy products
- Hard cheese without eyes L. lactis subsp. lactis, L. lactis subsp. cremoris
- Cheeses with small eyes L. lactis subsp. lactis, L. lactis var. subsp. diacetylactis,
L. lactis subsp. cremoris, Lc. mesenteroides subsp. cremoris
- Swiss- and Italian- type cheeses Lb. delbrueckii subsp. lactis, Lb. helveticus, Lb. casei,
Lb. delbrueckii subsp. bulgaricus, S. thermophilus
- Butter and buttermilk L. lactis subsp. lactis, L. lactis var. subsp. diacetylactis, L. lactis
subsp. cremoris, Lc. mesenteroides subsp. cremoris
- Yoghurt Lb. delbrueckii subsp. bulgaricus, S. thermophilus
- Fermented, probiotic milk Lb. casei, Lb. acidophilus, Lb. rhamnosus, Lb. johnsonii
- Kefir Lb. kefir, Lb. kefiranofacies, Lb. brevis
Fermented meats
- Fermented sausage (Europe) Lb. sakei, Lb. curvatus
Fermented fish products Lb. alimentarius, C. piscicola
Fermented vegetables
- Sauerkraut Lc. mesenteroides, Lb. plantarum,

Chapter 1
14
- Pickles Lc. mesenteroides, Lb. brevis, Lb. plantarum
- Olives Lc. mesenteroides, Lb. pentosus, Lb. plantarum
Soy sauce T. halophilus
Fermented cereals
- Sourdough Lb. sanfransiscensis, Lb. farciminis, Lb. fermentum, Lb. brevis,
Lb. plantarum, Lb. amylovorus, Lb. reuteri, Lb. pontis,
Lb. panis, Lb. alimentarius, W. cibaria
Alcoholic beverages
- Wine (malolactic fermentation) O. oeni
- Rice wine Lb. sakei a C.= Carnobacterium, L.=Lactococcus, Lb.=Lactobacillus, Lc.=Leuconostoc, O.= Oenococcus,
S.=Streptococcus, T.=Tetragenococcus, W.=Weissella.
Fermentation enhances the shelf-life of a product and LAB influence the sensory properties of
a product including the flavor development (3, 65). Fermented foods also have increased
levels of nutrients and are sometimes easier to digest than the raw product (34). Some LAB
produce bacteriocins, of which nisin is probably the best known member. Combined with the
process of acidification, this inhibits the growth of other (spoilage) bacteria (39).
A few representatives of the LAB group are marketed as probiotics, defined as ‘Live
microorganisms which when administered in adequate amounts confer a health benefit on the
host’ (17). Most probiotic products contain one or more strains of LAB. Some health-
promoting effects of probiotics are: establishing immune tolerance (61), shortening the course
of rotavirus infection (13), and preventing the development of atopic diseases and allergies
(15, 16, 46). The mechanisms by which these probiotic strains exploit their beneficial effects
and the specific interaction between probiotic bacteria and the human intestinal tract are
currently the topic of many research projects (49, 61).

Introduction and outline of this thesis
15
Because of their economic and industrial value, many genomes of different species of
LAB have been sequenced and annotated and have become publicly available. A summary of
sequenced and annotated LAB genomes that are important for the food industry and some of
their features is shown below (Table 2).
Table 2. Features of some sequenced LAB genomes important for the food industry, adapted from (45)
Speciesa Genome size Proteins Refs
Lb. acidophilus NCFM 1.9 Mb 1864 (1)
Lb. brevis ATCC 367 2.3 Mb 2221 (36)
Lb. casei ATCC 334 2.9 Mb 2776 (36)
Lb. delbrueckii subsp. bulgaricus ATCC 11842 1.9 Mb 1562 (62)
Lb. delbrueckii subsp. bulgaricus ATCC BAA-365 1.9 Mb 1725 (36)
Lb. gasseri ATCC 33323 1.9 Mb 1763 (37)
Lb. johnsonii NCC 533 1.9 Mb 1821 (47)
Lb. plantarum WCFS1 3.3 Mb 3009 (30)
Lb.reuteri F275 2.0 Mb 1900 (54)
Lb. sakei subsp. sakei 23k 1.9 Mb 1879 (8)
Lb. salivarius subsp. salivarius UCC118 1.8 Mb 1717 (11)
L. lactis subsp. cremoris MG1363 2.5 Mb 2434 (67)
L. lactis subsp. cremoris SK11 2.4 Mb 2509 (36)
L. lactis subsp. lactis IL1403 2.3 Mb 2321 (6)
Lc. mesenteroides subsp. mesenteroides ATCC8293 2.0 Mb 2009 (36)
O. oeni PSU-1 1.8 Mb 1701 (36)
S. thermophilus CNRZ1066 1.8 Mb 1915 (6)
S. thermophilus LMD-9 1.8 Mb 1710 (36)
S. thermophilus LMG18311 1.8 Mb 1889 (6) a, L.=Lactococcus, Lb.=Lactobacillus, Lc.=Leuconostoc, O.= Oenococcus, S.=Streptococcus
All LAB have relatively small genomes and the number of predicted protein-coding
genes in the sequenced genomes differs from ~1700 to ~3000. Even though the LAB are
closely related, this difference in gene number suggests a substantial gene loss and/or gain in
evolution. The last common ancestor of Lactobacillales is predicted to have lost circa 600-
1200 genes and gained <100 compared to the Bacilli ancestor (50). Evidence of the recent and

Chapter 1
16
ongoing genome reduction of LAB is the presence of pseudogenes (genes that are not
functional due to frameshift, nonsense, mutation, deletion or truncation (5)), often in
relatively high numbers compared to other groups of bacteria (50). All LAB contain
pseudogenes, although their number differs from < 20 in Leuconostoc mesenteroides to ~200
in Streptococcus thermophilus and Lactobacillus delbrueckii. Another example of gene-loss
in LAB is the coding capacity for the electron transport chain which can be used for aerobic
respiration and is present in only few LAB species (7). Most striking is the loss of most
biosynthetic capacities. This is exemplified by the requirement of a variety of amino acids
during cultivation of LAB on chemically defined medium requires supplementation (5, 26,
36).
Amino acid metabolism
Milk, one of the natural habitats of LAB, is a protein-rich environment. The protein
fraction consists mainly of casein, whey proteins and free amino acids; the most abundant
amino acid in milkprotein is glutamic acid (1.7 g/l) (38). In LAB, amino acid metabolism can
play an essential role in maintaining the redox balance or serve as a NADPH source.
Glutamate dehydrogenase plays an important role in some LAB, as it catalyzes the
reversible deamination of glutamate in α-ketoglutarate and free NH4+, using NAD+ or NADP+
as co-factor (2). It is also the major pathway for the formation of α-amino groups directly
from ammonia (56). The amino acid glutamate can serve as carbon backbone for many other
amino acids (4). Therefore, glutamate dehydrogenase forms a bridge between the carbon and
nitrogen metabolism and thus plays a key role in the metabolism of many organisms.
Amino acid catabolism has important effects on the quality of fermented foods. For
fermenting microbes, the amino acid catabolism can be important for obtaining energy in a
nutrient-limited environment (10). LAB need essential amino acids for growth, the number
and type of essential amino acids is strain and even species dependent (19, 40, 65).
Lactococcus lactis is probably the best studied LAB concerning amino acid metabolism (65).
Non-dairy (plant-associated) strains of Lactococcus lactis are not associated with a nutrient-
rich environment such as milk and they need fewer amino acids than milk-adapted strains.
Some non-dairy Lactococcus lactis subsp. cremoris and subsp. lactis strains only require 1-3
amino acids (65). To obtain all essential amino acids, Lactococcus lactis is able to degrade

Introduction and outline of this thesis
17
proteins into small peptides and amino acids which can be taken up from the environment by
transporters (Figure 2) (10). The proteolytic system has been studied in much detail and is
initiated by a single cell envelope-bound serine protease (Prt). Especially the proteases and
peptidases of Lactococcus lactis and Lactobacillus helveticus are intensively studied.
Although there are homologous enzymes between the two species, significant differences
exist (10, 33). Peptidase mutants showed reduced growth rates in milk compared to the wild-
type (10). Peptides are intracellular degraded by peptidases in amino acids (10). Amino acids
are then converted by aminotransferases into the corresponding α-keto acids (53).
Decarboxylases can convert α-keto acids into aldehydes and aldehydes can be
dehydrogenated or hydrogenated to their corresponding alcohols and carboxylic acids, which
are the substrates for (thio) esters. The hydrogenation of α-keto acids may act as a sink for
excessive redox potential (NADH). A second conversion route for amino acids is initiated by
lyases and aldolases (53), such as threonine aldolase which converts threonine into
acetaldehyde (9). A third conversion route for amino acids is the deimination/decarboxylation
to amines. These amines are studied extensively because of the health risk of biogenic amines
(53).
Figure 2. Summary of general protein conversion pathways by LAB, adapted from Smit (53)

Chapter 1
18
The major flavor compounds produced during amino acid metabolism are aldehydes,
alcohols, carboxylic acids and esters. Especially those derived from methionine, aromatic
amino acids and branched chain amino acids are important for the final product flavor (Table
3).
Table 3. Examples and descriptions of important amino acid derived flavours, adapted from Smit (53).
Flavour Description Metabolism 2-methylpropanal banana, malty, chocolate-
like valine
2-methylbutanal malty, chocolate isoleucine 3-methylbutanal malty, powerful, cheese leucine 3-methylbutanol fresh cheese, breathtaking,
alcoholic veucine
Acetaldehyde yoghurt, green, nutty, pungent
threonine
Phenylacetaldehyde rose, floral phenylalanine Phenol medicinal tyrosine Methional cooked potato, meat like,
sulphur methionine
Methanethiol ‘rotting’ cabbage, cheese, vegetative, sulphur
methionine
Benzaldehyde bitter almond oil, character, sweet cherry
phenylalanine
Pentose Phophate Pathway
The pentose phosphate pathway meets the need of all organisms for a source of
NADPH to use in reductive biosynthesis. This pathway contains two parts: an oxidative part
and a non-oxidative part that interconverts phosphorylated sugars, as is shown in Figure 3 (4).
In the oxidative part, NADPH is generated when glucose 6-phosphate is oxidized to ribulose
5-phosphate. NADPH is used for reductive biosynthesis and ribose 5-phosphate for the
synthesis of nucleotides. The dehydrogenation of glucose 6-phosphate is controlled by the
level of NADP+ as the electron acceptor.
The second stage is the non-oxidative, reversible reaction of five-carbon
phosphosugars into phosphorylated three-carbon and six-carbon intermediates of the
glycolytic pathway. The non-oxidative branch can introduce riboses into glycolysis for
catabolism of generate riboses from glycolytic intermediates (4). Most LAB, including
Lactococcus lactis, Lactobacillus plantarum and Lactobacillus delbrueckii subsp. bulgaricus

Introduction and outline of this thesis
19
possess a complete pentose phosphate pathway. However, Streptococcus thermophilus
LMG18311 (6, 24) is predicted, based on the genome, to lack a complete pentose phosphate
pathway. Likely, it needs alternative pathways for NADPH generation, and the available
genome-scale model was applied to find these alternatives.
Figure 3. A schematic design of the Pentose Phosphate Pathway, adapted from (4). Only NADP(H) as reaction
by-product is indicated

Chapter 1
20
Functional genomics
The Netherlands Genomics Initiative (NGI) defines genomics as ‘the mapping of the
genes of humans, animals, plants and micro-organisms, by means of DNA sequencing, and
wide-scale research into the function of genes and the manner in which hereditary
characteristics contained in cells are translated into the function of a cell and ultimately into
the function of the entire organism. This also includes high-throughput technologies, such as
proteomics and metabolomics and the bioinformatics that enable the data processing and
analysis of colossal amounts of data. Genomics is as set of technologies that has become an
indispensable tool in the current field of life science research’ (41). Comparative genomics is
the relationship of genome structure and function across different species or strains (23).
Comparative genomics is useful for two reasons: (i) the availability of complete genomes
enables us to identify sets of orthologs (orthologs are genes in different species that are
similar to each other because they originated from a common ancestor (18)), and (ii) the
comparison of complete genomes not only shows which genes are present, but also which
ones are absent (32). The three major functional genomics approaches address global mRNA
(transcriptomics), proteins (proteomics) and metabolites (metabolomics) (63). Comparative
genomics can be performed with all these approaches and include strain and species level
comparison (Figure 4).
The available sequenced and annotated LAB genomes (Table 2) facilitate the use of
these functional genomics techniques to study the response of LAB cells under certain
conditions (37). The total set of messenger RNA (mRNA), under a certain condition is studied
during transcriptional analysis, for these kind of studies, microarrays can be applied. Gene-
based microarrays contain spots representing DNA fragments of the (sequenced) organism(s)
of interest (51).

Introduction and outline of this thesis
21
Figure 4. Overview of the different ~omics techniques
Comparative genomics of the available sequenced LAB genomes (Table 2) (28)
showed a wide conservation of the essential housekeeping genes (genes that are transcribed at
relatively constant levels under many or all conditions). Moreover, these studies established a
high frequency of horizontal gene transfer (any process in which an organism incorporates
genetic material from another organism, without being the offspring of that organism (25))
Comparative studies can give increased insight in their evolution, adaptation and potential for
industrial applications (28). Computational models can be applied for a comparative genomics
approach. Different kinds of computational models for data analysis exist (52, 57). Kinetic
models contain kinetics of enzymes and mathematical descriptions. Since these models
require detailed (and labor-intensive) information, they often study specific metabolic
pathways, such as glycolysis. Black box models contain known inputs, outputs and functional
performance, but the internal implementation is unknown or irrelevant. In a white box model,
all necessary mechanistic information is implemented to compute functional performance on
the basis of system parameters that represent properties of real objects or processes.
Stoichiometric models are summarized in a stoichiometry matrix that depicts the participation
of the metabolites in each reaction. One successful type of a stoichiometric model is the
genome-scale model. These knowledge-based models not only contain stoichiometry of an

Chapter 1
22
organism’s metabolic network, but also contain information on the relationship between
genes, proteins and reactions (Figure 5) (52, 57).
(A) (B)
Figure 5. The structure of genome-scale models. Relations between genes, proteins and reactions are
reconstructed based on genomic information. The examples are taken from the S. thermophilus LMG18311
model, where STU means S. thermophilus. Part A shows how one gene is connected to one enzyme; glutamate
dehydrogenase (GDH). Part B shows how two genes code for one functional enzyme; serine deaminase.
Adapted from (52) and based on the Simpheny software environment (Genomatica Inc. San Diego, CA).
Genome-scale metabolic models are often applied to study cells on genome level. Such
models are based on sequenced genomes and experimental data. These models can be used for
biological interpretation and -the ultimate goal- prediction (58). Complete genome-scale
models are available for an increasing number of micro-organisms (43), including different
LAB; Lactococcus lactis (42) , Lactobacillus plantarum (59) and Streptococcus thermophilus
(44).
Comparative approach
In this thesis, a comparative genomics approach is described for LAB. Not only
different organisms, but also different genomics level approaches are compared. A
comparative approach of complete genomes not only shows which genes are present, but also
which ones are absent (32). For comparison of two or three similar genomes, sequence
alignment is a standard procedure and this alignment can be graphical represented. Another
method is to compare the number of tRNA’s, rRNA’s and protein-coding genes between

Introduction and outline of this thesis
23
different strains. Also, much can be learned from a comparison of the same proteins across
different organisms (60).
An example of comparative genomics is the development of an integrated database
and bioinformatics platform called OGeR (Open Genome Resource). This platform was
developed with 21 pathogenic streptococcal genomes (from the Strepto-DB platform). It was
used for the prediction of the core-genome (fraction of genes that is shared among strains) and
the pan-genome (core genome plus all distributed genes) (31). Claesson et al (12), performed
a comparative phylogenomics study with 12 Lactobacillus strains. They suggested that GroEL
(a molecular chaperone) is more suitable as a phylogenetic single-gene marker for large-scale
analysis than the 16S rRNA gene (12). Klaenhammer et al (29) described a functional
comparative genomics study of probiotic Lactobacilli. Differential Blast Analysis highlighted
strain-specific genes and group-specific genes. Lactobacillus-specific genes include mucus-
binding proteins involved in cell-adhesion and several transport systems for carbohydrates
and amino acids (29).
Liu et al described the use of comparative genomics approaches to improve the functional
annotation of the key enzymes in the formation of flavor compounds from amino acids.
Comparative analysis of the various sequenced LAB resulted in an overview of differences in
their capacities to form flavors (35). De Vos et al (14) used genome sequences and post-
genomics techniques to compare different food-grade LAB and to investigate their function in
the gut. Comparative genomics revealed some parallels between the different phylogenetic
strains, that probably reflects the harsh and competitive environment in the human gut (14).
All these different examples show the strong potential of comparative genomics. It
may reveal similarities or differences between different LAB. It can also provide insight in the
(ongoing) evolution of the LAB. The available genome-scale models can play a role as
powerful tool as part of comparative genomics. The ultimate goal of the comparative
genomics will be a better understanding of the metabolism of these important industrial food
starters and why they are so well-equipped for their respective food fermentations.

Chapter 1
24
Goal and outline of this thesis
The work described in this PhD thesis was initiated to use genomics technologies and
a comparative approach to link the gene content of some well-known LAB to flavor formation
and to increase our general knowledge in the area of amino acid metabolism. The three well-
known LAB that were used in these studies were Streptococcus thermophilus LMG18311 (5,
24), a yoghurt strain, Lactococcus lactis MG1363 (67), a cheese strain, and Lactobacillus
plantarum WCFS1 (30), originally isolated from human saliva and used for vegetable
fermentations. The complete genomes of all these model bacteria have been sequenced and
annotated in detail (Table 2). Genome-atlas views of these strains are shown below. S.
thermophilus has the smallest genome (1.8 Mb), but of these three LAB, it has the highest
percentage of amino acid related genes (10%) compared to the total number of genes and the
lowest percentage of genes involved in primary and sugar metabolism (7%). For L. lactis
these percentages are 5.5% and 7.4% and for Lb. plantarum 8.5% and 13.4% respectively.
Figure 6. Genome-atlas view of the L. lactis MG1363, Lb. plantarum WCFS 1 and S. thermophilus LMG18311
chromosome. The outer to inner circles show (i) positive strand ORFs (purple); (ii) negative strand ORFs
(green); (iii) GC% (yellow); (iv) genes in the COG group E (amino acid metabolism) (red); (v) genes in the COG
group C and G (sugar and primary metabolism) (blue). Figures were made by Michiel Wels, according to (27)
The comparative genomics approach presented in this thesis can be used to understand
the amino acid metabolism of different lactic acid bacteria and their potential to produce
flavors under different conditions.
Chapter 2 describes different high-throughput screening tools that can be used for the
selection of flavor forming cultures. The headspace of fermentation samples was analyzed
using GC-MS, different mixed and single cultures as well as industrial and defined media

Introduction and outline of this thesis
25
were compared. Genome-scale metabolic models were used to predict the production of
relevant (flavor) components and to expand our knowledge about flavor forming pathways.
In Chapter 3 the amino acid-metabolism and amino acid-dependency of the dairy
bacterium Streptococcus thermophilus LMG18311 is described and compared with that of
Lactococcus lactis MG1363 and Lactobacillus plantarum WCFS1. Through the construction
of a genome-scale metabolic model of Streptococcus thermophilus, the metabolic differences
between the three bacteria were visualized by direct projection on a metabolic map.
In Chapter 4 the growth of three different lactic acid bacteria (Streptococcus
thermophilus, Lactococcus lactis and Lactobacillus plantarum) on a defined medium
containing all amino acids is compared with that on the same with a minimal amount of
amino acids. The cellular response towards a minimal amount of amino acids was studied on
transcriptional level and data were visualized with the use of genome-scale models.
In Chapter 5 the absence of a complete pentose phosphate pathway in Streptococcus
thermophilus is discussed. This pathway is important for the generation of NADPH and
therefore this strain needs alternative pathway(s). One of the alternatives can be glutamate
dehydrogenase (encoded by the gdhA gene), and a knock-out of its gene was made. Growth
on transcriptional level and fermentation behavior of this mutant were compared with the
wild-type.
Chapter 6 summarizes the main results obtained in this study with special attention
towards the differences in amino acid biosynthesis pathways in different LAB and the effect
of the completeness of the amino acid metabolism on the overall metabolism. Finally,
concluding remarks and future perspectives are given in this chapter.
Acknowledgements: We thank Michiel Wels for his excellent design of Figure 6.

Chapter 1
26
References
1. Altermann, E., W. M. Russell, M. A. Azcarate-Peril, R. Barrangou, B. L. Buck,
O. McAuliffe, N. Souther, A. Dobson, T. Duong, M. Callanan, S. Lick, A.
Hamrick, R. Cano, and T. R. Klaenhammer. 2005. Complete genome sequence of
the probiotic lactic acid bacterium Lactobacillus acidophilus NCFM. Proc Natl Acad
Sci U S A 102:3906-3912.
2. Andersson, J. O., and A. J. Roger. 2003. Evolution of glutamate dehydrogenase
genes: evidence for lateral gene transfer within and between prokaryotes and
eukaryotes. BMC Evol Biol 3:14.
3. Ayad, E. H. E., A. Verheul, J. T. M. Wouters, and G. Smit. 2002. Antimicrobial-
producing wild lactococci isolated from artisanal and non-dairy origins. Int Dairy J
12:145-150.
4. Berg, J. M., J. L. Tymoczko, and L. Stryer. 2002. Biochemistry.
5. Bolotin, A., B. Quinquis, P. Renault, A. Sorokin, S. D. Ehrlich, S. Kulakauskas,
A. Lapidus, E. Goltsman, M. Mazur, G. D. Pusch, M. Fonstein, R. Overbeek, N.
Kyprides, B. Purnelle, D. Prozzi, K. Ngui, D. Masuy, F. Hancy, S. Burteau, M.
Boutry, J. Delcour, A. Goffeau, and P. Hols. 2004. Complete sequence and
comparative genome analysis of the dairy bacterium Streptococcus thermophilus. Nat
Biotechnol 22:1554-1558.
6. Bolotin, A., P. Wincker, S. Mauger, O. Jaillon, K. Malarme, J. Weissenbach, S.
D. Ehrlich, and A. Sorokin. 2001. The complete genome sequence of the lactic acid
bacterium Lactococcus lactis ssp. lactis IL1403. Genome Research 11:731-753.
7. Brooijmans, R. J. W. 2008. Electron Transport Chains of Lactic Acid Bacteria. PhD
thesis Wageningen University.
8. Chaillou, S., M. C. Champomier-Verges, M. Cornet, A. M. Crutz-Le Coq, A. M.
Dudez, V. Martin, S. Beaufils, E. Darbon-Rongere, R. Bossy, V. Loux, and M.
Zagorec. 2005. The complete genome sequence of the meat-borne lactic acid
bacterium Lactobacillus sakei 23K. Nat Biotechnol 23:1527-1533.

Introduction and outline of this thesis
27
9. Chaves, A. C., M. Fernandez, A. L. Lerayer, I. Mierau, M. Kleerebezem, and J.
Hugenholtz. 2002. Metabolic engineering of acetaldehyde production by
Streptococcus thermophilus. Appl Environ Microbiol 68:5656-5662.
10. Christensen, J. E., E. G. Dudley, J. A. Pederson, and J. L. Steele. 1999. Peptidases
and amino acid catabolism in lactic acid bacteria. Antonie Van Leeuwenhoek 76:217-
246.
11. Claesson, M. J., Y. Li, S. Leahy, C. Canchaya, J. P. van Pijkeren, A. M. Cerdeno-
Tarraga, J. Parkhill, S. Flynn, G. C. O'Sullivan, J. K. Collins, D. Higgins, F.
Shanahan, G. F. Fitzgerald, D. van Sinderen, and P. W. O'Toole. 2006.
Multireplicon genome architecture of Lactobacillus salivarius. Proc Natl Acad Sci U
S A 103:6718-6723.
12. Claesson, M. J., D. van Sinderen, and P. W. O'Toole. 2008. Lactobacillus
phylogenomics--towards a reclassification of the genus. Int J Syst Evol Microbiol
58:2945-2954.
13. de Roos, N. M., and M. B. Katan. 2000. Effects of probiotic bacteria on diarrhea,
lipid metabolism, and carcinogenesis: a review of papers published between 1988 and
1998. Am J Clin Nutr 71:405-411.
14. de Vos, W. M., P. A. Bron, and M. Kleerebezem. 2004. Post-genomics of lactic acid
bacteria and other food-grade bacteria to discover gut functionality. Curr Opin
Biotechnol 15:86-93.
15. de Vrese, M., and P. R. Marteau. 2007. Probiotics and prebiotics: effects on
diarrhea. J Nutr 137:803S-811S.
16. de Vrese, M., and J. Schrezenmeir. 2008. Probiotics, prebiotics, and synbiotics. Adv
Biochem Eng Biotechnol 111:1-66.
17. FAO/WHO. 2001. Health and nutritional properties of probiotics in food including
powder milk with live lactic acid bacteria. Report of a joint FAO/WHO expert
consultation on evaluation of health and nutritional properties of probiotics in food
including powder milk with live lactic acid bacteria. .
18. Fitch, W. M. 2000. Homology a personal view on some of the problems. Trends
Genet 16:227-231.

Chapter 1
28
19. Garault, P., C. Letort, V. Juillard, and V. Monnet. 2000. Branched-chain amino
acid biosynthesis is essential for optimal growth of Streptococcus thermophilus in
milk. Appl Environ Microbiol 66:5128-5133.
20. Garrigues, C., P. Loubiere, N. D. Lindley, and M. Cocaign-Bousquet. 1997.
Control of the shift from homolactic acid to mixed-acid fermentation in Lactococcus
lactis: predominant role of the NADH/NAD+ ratio. J. Bacteriol. 179:5282-5287.
21. Gomez, M. J., P. Gaya, M. Nunez, and M. Medina. 1996. Effect of Lactobacillus
plantarum as adjunct starter on the flavour and texture of a semi-hard cheese made
from pasteurised cows' milk Lait 76:461-472.
22. Gummalla, S., and J. R. Broadbent. 2001. Tyrosine and phenylalanine catabolism
by Lactobacillus cheese flavor adjuncts. Journal of Dairy Science 84:1011-1019.
23. Hardison, R. C. 2003. Comparative genomics. PLoS Biol 1:E58.
24. Hols, P., F. Hancy, L. Fontaine, B. Grossiord, D. Prozzi, N. Leblond-Bourget, B.
Decaris, A. Bolotin, C. Delorme, S. Dusko Ehrlich, E. Guedon, V. Monnet, P.
Renault, and M. Kleerebezem. 2005. New insights in the molecular biology and
physiology of Streptococcus thermophilus revealed by comparative genomics. FEMS
Microbiol. Rev. 29:435-463.
25. Jain, R., M. C. Rivera, and J. A. Lake. 1999. Horizontal gene transfer among
genomes: the complexity hypothesis. Proc Natl Acad Sci U S A 96:3801-3806.
26. Jensen, P. R., and K. Hammer. 1993. Minimal Requirements for Exponential
Growth of Lactococcus lactis. Appl Environ Microbiol 59:4363-4366.
27. Kerkhoven, R., F. H. van Enckevort, J. Boekhorst, D. Molenaar, and R. J. Siezen.
2004. Visualization for genomics: the Microbial Genome Viewer. Bioinformatics
20:1812-1814.
28. Klaenhammer, T., E. Altermann, F. Arigoni, A. Bolotin, F. Breidt, J. Broadbent,
R. Cano, S. Chaillou, J. Deutscher, M. Gasson, M. van de Guchte, J. Guzzo, A.
Hartke, T. Hawkins, P. Hols, R. Hutkins, M. Kleerebezem, J. Kok, O. Kuipers,
M. Lubbers, E. Maguin, L. McKay, D. Mills, A. Nauta, R. Overbeek, H. Pel, D.
Pridmore, M. Saier, D. van Sinderen, A. Sorokin, J. Steele, D. O'Sullivan, W. de
Vos, B. Weimer, M. Zagorec, and R. Siezen. 2002. Discovering lactic acid bacteria
by genomics. Antonie Van Leeuwenhoek 82:29-58.

Introduction and outline of this thesis
29
29. Klaenhammer, T. R., E. Altermann, E. Pfeiler, B. L. Buck, Y. J. Goh, S.
O'Flaherty, R. Barrangou, and T. Duong. 2008. Functional genomics of probiotic
Lactobacilli. J Clin Gastroenterol 42 Suppl 3 Pt 2:S160-162.
30. Kleerebezem, M., J. Boekhorst, R. van Kranenburg, D. Molenaar, O. P. Kuipers,
R. Leer, R. Tarchini, S. A. Peters, H. M. Sandbrink, M. W. Fiers, W. Stiekema,
R. M. Lankhorst, P. A. Bron, S. M. Hoffer, M. N. Groot, R. Kerkhoven, M. de
Vries, B. Ursing, W. M. de Vos, and R. J. Siezen. 2003. Complete genome sequence
of Lactobacillus plantarum WCFS1. Proc Natl Acad Sci U S A 100:1990-1995.
31. Klein, J., R. Munch, I. Biegler, I. Haddad, I. Retter, and D. Jahn. 2009. Strepto-
DB, a database for comparative genomics of group A (GAS) and B (GBS)
streptococci, implemented with the novel database platform 'Open Genome Resource'
(OGeR). Nucleic Acids Res 37:D494-498.
32. Koonin, E. V., and Y. I. Wolf. 2008. Genomics of bacteria and archaea: the emerging
dynamic view of the prokaryotic world. Nucleic Acids Res 36:6688-6719.
33. Kunji, E. R., I. Mierau, A. Hagting, B. Poolman, and W. N. Konings. 1996. The
proteolytic systems of lactic acid bacteria. Antonie Van Leeuwenhoek 70:187-221.
34. Leroy, F., and L. De Vuyst. 2004. Lactic acid bacteria as functional starter cultures
for the food fermentation industry. Trends Food Sci Technol 15:67-78.
35. Liu, M., A. Nauta, C. Francke, and R. J. Siezen. 2008. Comparative genomics of
enzymes in flavor-forming pathways from amino acids in lactic acid bacteria. Appl
Environ Microbiol 74:4590-4600.
36. Makarova, K., A. Slesarev, Y. Wolf, A. Sorokin, B. Mirkin, E. Koonin, A. Pavlov,
N. Pavlova, V. Karamychev, N. Polouchine, V. Shakhova, I. Grigoriev, Y. Lou, D.
Rohksar, S. Lucas, K. Huang, D. M. Goodstein, T. Hawkins, V. Plengvidhya, D.
Welker, J. Hughes, Y. Goh, A. Benson, K. Baldwin, J. H. Lee, I. Diaz-Muniz, B.
Dosti, V. Smeianov, W. Wechter, R. Barabote, G. Lorca, E. Altermann, R.
Barrangou, B. Ganesan, Y. Xie, H. Rawsthorne, D. Tamir, C. Parker, F. Breidt,
J. Broadbent, R. Hutkins, D. O'Sullivan, J. Steele, G. Unlu, M. Saier, T.
Klaenhammer, P. Richardson, S. Kozyavkin, B. Weimer, and D. Mills. 2006.
Comparative genomics of the lactic acid bacteria. Proc Natl Acad Sci U S A
103:15611-15616.

Chapter 1
30
37. Makarova, K. S., and E. V. Koonin. 2007. Evolutionary genomics of lactic acid
bacteria. J Bacteriol 189:1199-1208.
38. NDC. 2000. National Dairy Council.
39. Nes, I. F., D. B. Diep, L. S. Havarstein, M. B. Brurberg, V. Eijsink, and H. Holo.
1996. Biosynthesis of bacteriocins in lactic acid bacteria. Antonie Van Leeuwenhoek
70:113-128.
40. Neviani, E., G. Giraffa, A. Brizzi, and D. Carminati. 1995. Amino acid
requirements and peptidase activities of Streptococcus salivarius subsp. thermophilus.
J Appl Bacteriol 79:302-307.
41. NGI. 2008. Making the most of genomics.
42. Notebaart, R. A., F. H. van Enckevort, C. Francke, R. J. Siezen, and B. Teusink.
2006. Accelerating the reconstruction of genome-scale metabolic networks. BMC
Bioinformatics 7:296.
43. Oliveira, A. P., J. Nielsen, and J. Forster. 2005. Modeling Lactococcus lactis using
a genome-scale flux model. BMC Microbiol 5:39.
44. Pastink, M. I., B. Teusink, P. Hols, S. Visser, W. M. de Vos, and J. Hugenholtz.
2009. Metabolic comparison of lactic acid bacteria; genome-scale model of
Streptococcus thermophilus LMG18311. Appl Environ Microbiol.
45. Pfeiler, E. A., and T. R. Klaenhammer. 2007. The genomics of lactic acid bacteria.
Trends Microbiol.
46. Pham, M., D. A. Lemberg, and A. S. Day. 2008. Probiotics: sorting the evidence
from the myths. Med J Aust 188:304-308.
47. Pridmore, R. D., B. Berger, F. Desiere, D. Vilanova, C. Barretto, A. C. Pittet, M.
C. Zwahlen, M. Rouvet, E. Altermann, R. Barrangou, B. Mollet, A. Mercenier, T.
Klaenhammer, F. Arigoni, and M. A. Schell. 2004. The genome sequence of the
probiotic intestinal bacterium Lactobacillus johnsonii NCC 533. Proc Natl Acad Sci U
S A 101:2512-2517.
48. Ross, R. P., S. Morgan, and C. Hill. 2002. Preservation and fermentation: past,
present and future. Int J Food Microbiol 79:3-16.

Introduction and outline of this thesis
31
49. Saxelin, M., S. Tynkkynen, T. Mattila-Sandholm, and W. M. de Vos. 2005.
Probiotic and other functional microbes: from markets to mechanisms. Curr Opin
Biotechnol 16:204-211.
50. Schroeter, J., and T. Klaenhammer. 2008. Genomics of lactic acid bacteria. FEMS
Microbiol Lett.
51. Serrano, L. M. 2008. Oxidative Stress Response in Lactobacillus plantarum WCFS1:
A Functional Genomics Approach. PhD thesis Wageningen University.
52. Smid, E. J., F. J. van Enckevort, A. Wegkamp, J. Boekhorst, D. Molenaar, J.
Hugenholtz, R. J. Siezen, and B. Teusink. 2005. Metabolic models for rational
improvement of lactic acid bacteria as cell factories. Journal of Applied Microbiology
98:1326-1331.
53. Smit, B. A. 2004. Formation of Amino Acid Derived Cheese Flavour Compounds.
PhD thesis Wageningen University.
54. Sriramulu, D. D., M. Liang, D. Hernandez-Romero, E. Raux-Deery, H. Lunsdorf,
J. B. Parsons, M. J. Warren, and M. B. Prentice. 2008. Lactobacillus reuteri DSM
20016 produces cobalamin-dependent diol dehydratase in metabolosomes and
metabolizes 1,2-propanediol by disproportionation. J Bacteriol 190:4559-4567.
55. Stiles, M. E., and W. H. Holzapfel. 1997. Lactic acid bacteria of foods and their
current taxonomy. Int J Food Microbiol 36:1-29.
56. Tanous, C., A. Kieronczyk, S. Helinck, E. Chambellon, and M. Yvon. 2002.
Glutamate dehydrogenase activity: a major criterion for the selection of flavour-
producing lactic acid bacteria strains. Antonie Van Leeuwenhoek 82:271-278.
57. Teusink, B., and E. J. Smid. 2006. Modelling strategies for the industrial exploitation
of lactic acid bacteria. Nat Rev Microbiol 4:46-56.
58. Teusink, B., F. H. van Enckevort, C. Francke, A. Wiersma, A. Wegkamp, E. J.
Smid, and R. J. Siezen. 2005. In silico reconstruction of the metabolic pathways of
Lactobacillus plantarum: comparing predictions of nutrient requirements with those
from growth experiments. Appl Environ Microbiol 71:7253-7262.
59. Teusink, B., A. Wiersma, D. Molenaar, C. Francke, W. M. de Vos, R. J. Siezen,
and E. J. Smid. 2006. Analysis of growth of Lactobacillus plantarum WCFS1 on a

Chapter 1
32
complex medium using a genome-scale metabolic model. J Biol Chem 281:40041-
40048.
60. Ussery, D. W., T. M. Wassenaar, and S. Borini. 2008. Computing for Comparative
Microbial Genomics; bioinformatics for microbiologists. Springer.
61. van Baarlen, P., F. J. Troost, S. van Hemert, C. van der Meer, W. M. de Vos, P.
J. de Groot, G. J. Hooiveld, R. J. Brummer, and M. Kleerebezem. 2009.
Differential NF-kappaB pathways induction by Lactobacillus plantarum in the
duodenum of healthy humans correlating with immune tolerance. Proc Natl Acad Sci
U S A 106:2371-2376.
62. van de Guchte, M., S. Penaud, C. Grimaldi, V. Barbe, K. Bryson, P. Nicolas, C.
Robert, S. Oztas, S. Mangenot, A. Couloux, V. Loux, R. Dervyn, R. Bossy, A.
Bolotin, J. M. Batto, T. Walunas, J. F. Gibrat, P. Bessieres, J. Weissenbach, S. D.
Ehrlich, and E. Maguin. 2006. The complete genome sequence of Lactobacillus
bulgaricus reveals extensive and ongoing reductive evolution. Proc. Natl. Acad. Sci. U
S A 103:9274-9279.
63. van der Werf, M. J., R. H. Jellema, and T. Hankemeier. 2005. Microbial
metabolomics: replacing trial-and-error by the unbiased selection and ranking of
targets. J Ind Microbiol Biotechnol 32:234-252.
64. van Hylckama Vlieg, J. E., J. L. Rademaker, H. Bachmann, D. Molenaar, W. J.
Kelly, and R. J. Siezen. 2006. Natural diversity and adaptive responses of
Lactococcus lactis. Curr. Opin. Biotechnol. 17:183-190.
65. Van Kranenburg, R., M. Kleerebezem, J. van Hylckama Vlieg, B. M. Ursing, J.
Boekhorst, B. A. Smit, E. H. A. Ayad, G. Smit, and R. Siezen. 2002. Flavour
formation from amino acids by lactic acid bacteria: predictions from genome sequence
analysis. Int Dairy J 12:111-121.
66. Vaughan, E. E., M. C. de Vries, E. G. Zoetendal, K. Ben-Amor, A. D.
Akkermans, and W. M. de Vos. 2002. The intestinal LABs. Antonie Van
Leeuwenhoek 82:341-352.
67. Wegmann, U., M. O'Connell-Motherway, A. Zomer, G. Buist, C. Shearman, C.
Canchaya, M. Ventura, A. Goesmann, M. J. Gasson, O. P. Kuipers, D. van

Introduction and outline of this thesis
33
Sinderen, and J. Kok. 2007. Complete genome sequence of the prototype lactic acid
bacterium Lactococcus lactis subsp. cremoris MG1363. J Bacteriol 189:3256-3270.

Chapter 1
34

Chapter 2
Genomics and high-throughput screening approaches for optimal flavor
production in dairy fermentation
Margreet I. Pastink*, Sander Sieuwerts*, Frank A. M. de Bok, Patrick W. M. Janssen, Bas
Teusink, Johan E. T. van Hylckama Vlieg, Jeroen Hugenholtz
Published in International Dairy Journal, 2008, 18: 781-789
* these authors contributed equally to this work

Chapter 2
36
Abstract
Most fermented dairy products are manufactured using mixed starter cultures. These
cultures are usually a well-balanced mixture of several different lactic acid bacteria. For the
development of novel or improved dairy products, flavor characteristics are generally a
primary target. In this paper we describe the (GC-MS) analysis of the headspace of cultures of
different lactic acid bacteria and of different growth media. These analyses showed that on
industrial medium, different flavors are formed than on a defined medium. Furthermore, the
flavor formation by mixed cultures is not just the sum of the single cultures due to metabolic
interactions. Finally, genome-scale metabolic models were used to predict the production of
relevant (flavor) components and to expand our knowledge about flavor forming pathways.
The integration of these approaches is anticipated to strengthen culture development programs
enabling the production of well-tasting, fermented dairy products.

Screening approaches for flavor formation
37
Introduction
Lactic acid bacteria (LAB) are important for the dairy industry, since they are used as
(mixed) starter cultures for the production of fermented foods, such as yoghurt and cheese.
During the fermentation process, LAB influence the sensory properties of a product including
the flavor development (3, 47). Most flavor-related research has focused on cheese (46, 51).
Flavor compounds are formed by the conversion of lactose and citrate (glycolysis and
pyruvate metabolism), by lipolysis and by proteolysis and conversion of free amino acids (38,
42, 46, 47). Flavor production is strain dependent and therefore the composition of a starter
culture can greatly influence flavor characteristics of the final product (25). Moreover, flavor
formation in fermented food products largely depends on the substrate. Differences in the
presence of flavor compound precursors as well as regulatory responses may result in
different fluxes through flavor pathways (17, 18).
Most dairy fermentations are performed with mixed cultures and the final product
properties are influenced by their composition. The yoghurt fermentation is probably the most
extensively studied mixed dairy fermentation (52). Typically, mixed starters consisting of
Streptococcus (S) thermophilus and Lactobacillus (Lb.) delbrueckii subsp. bulgaricus are used
to ferment milk yielding the final yoghurt product. The bacteria stimulate each other’s growth
in a process called protocooperation (11, 14). Important functionalities that result from this
are (I) increased acidification of milk by the conversion of lactose into lactic acid, (II) change
in texture by the production of exopolysaccharides and by coagulation due to acidification,
and (III) production of the typical yoghurt flavor (41). This yoghurt flavor is a combination of
lactic acid and various carbonyl compounds like acetaldehyde and diacetyl (10, 52).
The process of finding suitable (combinations of) strains for optimal flavor production
in dairy products can be accelerated by understanding of the metabolic processes leading to
typical flavor compounds, the effects of different strains on flavor production and the ideal
composition of different flavor compounds leading to the desired sensory effect. Combining
these aspects is a major challenge in fermentation optimization.
Recent advances in technologies and approaches can support the development of
improved flavor production in dairy fermentations. Here we show the results of recent
experimental approach (GC-MS, genome-scale models, comparison of strains and different

Chapter 2
38
media) and compare their outcome with examples from literature. It is envisioned that this
knowledge-based selection of LAB will be a useful tool for the improvement of established
(fermented) foods or for the development of novel (fermented) foods, based on their ability to
produce flavor.
Materials and methods
Bacteria and growth conditions. The strains used in this study were S. thermophilus
LMG18311 (7) and Lb.. bulgaricus ATCC BAA-365 (29). Cells were grown anaerobically on
Nilac skim milk (NIZO, the Netherlands) at 42°C. S. thermophilus was also grown
anaerobically in Chemically Defined Medium (CDM) (28) at 42°C.
GC-MS analyses. The headspace of 5 mL batch cultures in milk (Nilac) and chemically
defined medium (CDM) fermented with S. thermophilus LMG18311, Lb. bulgaricus ATCC
BAA-365 (only milk) and the mixed culture (only milk) at 42 °C for 24 h were analyzed on
GC-MS. Headspace volatiles of samples equilibrated at 60°C for 10 min were concentrated by
Solid Phase Dynamic Extraction followed and focussed by cryofixation at -120°C.
Subsequently the compounds were separated on a CP-SIL 5 CB column (60m x 0.32m) and
detected on a mass spectrometer by scanning a mass range of 25-250 in 0.25s in the full scan
EI ionization mode (70 eV). Data acquisition and processing were performed with the
Xcalibur software and volatiles were identified using NIST MS Library.
Model development. Genome-scale models are based on annotated genomes and
experimental data and have become available for an increasing number of organisms,
including various LAB (34, 45). The construction of the genome-scale models is described
elsewhere in much detail (chapter 3 of this thesis) (44, 45).

Screening approaches for flavor formation
39
Results and discussion: Approaches for selecting suitable starters
Flavor profiling of fermentations by GC-MS. It is important to realize that there is a large
variation in flavor forming abilities among food fermenting LAB (1, 2, 37, 38, 48, 51).
This diversity does not only occur at the species level but also within species a large
strain-to-strain diversity exists. Figure 1 (1, 49) shows an example of a GC-MS
chromatogram of the flavors produced by a lactococcal wild strain and an industrial strain.
The two chromatograms clearly show that different strains can produce different flavors.
Differences between flavor profiles in culture fluid of growing cultures and the culture
medium before the start of fermentation are mainly caused by metabolic activities of the
fermenting microbes. Especially the wild strain produces high levels of methyl aldehydes and
methyl alcohols. One of the identified compounds is 3-methylbutanal. This aldehyde is
derived from leucine degradation and has been recognized as a key flavor compound in (semi-
)hard cheeses like Proosdij and Parmesan, because of its malty, chocolate flavor (38).
However, this aldehyde may also have a negative effect on the sensory properties of a cheese.
Apparently, the contribution of 3-methylbutanal to the perception of cheese depends on the
other volatiles present and the matrix composition (49). It is known that there is a large
biodiversity among LAB in the activity of enzymes involved in the pathway leading to 3-
methylbutanal (38) and this knowledge can be used for the selection of starter cultures for the
food industry.

Chapter 2
40
Figure 1. GC-MS aroma profiles of volatile compounds from a cheese model (Ch-easy) inoculated with the
Lactococcus lactis subsp. lactis strains B1152 (wild strain) and SK110 (industrial strain) respectively. Relative
peak areas are expressed in arbitrary units. Adapted from (1, 49).
The development of mixed cultures brings additional challenges. The flavor of a
mixed culture is not necessarily the sum of the flavors produced by the individual pure
cultures. Metabolic interactions may play a crucial role. For example, strains that have
incomplete flavor producing pathways can complement each other. An elegant example for
flavor formation by mixed cultures was provided by the work from Ayad and co-workers.
They described mutual complementation of two Lactococcus lactis strains that have
incomplete 3-methylbutanal-producing pathways. A combination of both strains was reported
to produce this compound, whilst neither strain by itself did. It was shown that the one strain
was highly proteolytic but lacked a decarboxylating enzyme necessary for producing 3-

Screening approaches for flavor formation
41
methylbutanal and the other strain contained the decarboxylating enzyme but lacked
proteolytic activity to provide sufficient amounts of leucine (Figure 2) (2, 4).
Figure 2. The completion of the 3-methylbutanal forming pathway by using a mixture of 2 L. lactis strains.
Strain SK110 is proteolytic but lacks a decarboxylating enzyme necessary for producing 3-methylbutanal and
B1157 contains the decarboxylating enzyme but lacks proteolytic activity. Arrows indicate the relative
enzymatic activities. Adapted from (2).
Another example deals with the addition of mesophilic homofermentative lactobacilli to the
cheese fermentation performed by L. lactis subsp. lactis and L. lactis subsp. lactis var.
diacetylactis (31). Here, some strains of Lactobacillus spp. were reported to enhance
formation of diacetyl and acetoin while other mixtures produced lower amounts. Volatile free
fatty acid production increased in all combinations. For the yoghurt mixed culture, consisting
of S. thermophilus and Lb. bulgaricus, a similar approach can be applied to study the
performance of the mixture. In Table 1, an example is shown how GC-MS analysis can be
used to recognize interactions between the two different yoghurt bacteria.

Chapter 2
42
Table 1. Relative levels of important volatiles identified in the headspace of 5 mL batch cultures in milk (Nilac)
and chemically defined medium (CDM) fermented with S. thermophilus LMG18311, Lb. bulgaricus ATCC
BAA-365 (only milk) and the mixed culture (only milk) at 42 °C for 24 h. Identified+, detectable; ++, present at
about 10 times higher concentration; +++, present at about 100 times higher concentration; -, not detectable.
Milk S. thermophilus
in milk
Lb. bulgaricus
in milk
Mixed culture in milk
CDM S. thermophilus
in CDMAcetaldehyde + ++ ++ ++ ++ +++Diacetyl - ++ - + - ++Methanethiol + + ++ ++ ++ ++Acetone + + + + - ++Ethanol - - + - - -Acetic acid + + + + + ++Dimethylsulfide +++ +++ +++ ++ + +Dimethyldisulfide - - + + +++ ++Dimethyltrisulfide - - + + ++ -2,3-Pentanedione - - - - - +2-Heptanone + - ++ ++ - -
It is clear that for instance diacetyl is present at lower levels in the mixed culture than in the
pure culture of S. thermophilus even though the cell counts of this strain are higher (data not
shown). Ethanol is only detected in the mono culture of Lb. bulgaricus. Most compounds
listed in Table 1 have also been identified in similar studies on yoghurt (16, 21), but never
before have these mono cultures and mixed culture been compared in this way.
Flavor profile screening is an effective tool in acquiring (mixed) fermentations with
the desired flavor. The effectivity of this process is enhanced by knowledge of the molecular
mechanisms of flavor formation allowing rational improvement of existing cultures or
development of new cultures.
Mixed culture screening. An important aspect in optimizing flavors produced in mixed
cultures is the rapid analysis and quantification of the strains involved. As with flavor
formation, the performance of mixed cultures, e.g. cell counts and acidification, is not the
summation of the performances of the individual pure cultures due to molecular interactions
between strains (11). High-throughput (HT) screening can play a major role in acquiring well-
controlled mixed fermentations with desired end products. Various analytic tools are available
for analysis and development of mixed cultures. These include a method for measuring real-

Screening approaches for flavor formation
43
time pH in a 96 wells format (24), an efficient tool for fast and small-scale combinatorial
screening based on acidification curves. Another key challenge relates to the analysis of
population dynamics in mixed cultures. Traditionally, this analysis relies on the quantification
of strains by plating dilutions of cultures onto selective media. Because this is very laborious
and time-consuming, several attempts have been made to develop a HT plating method (20)
and an automated colony counting method (12, 30). Recently, a miniaturized platform for
plating microorganisms was developed (22, 23), which currently allows plating of thousands
of micro colonies on a few squared centimeters. Alternatives for plating rely on the
application of species or strain specific probes or primers as for instance quantitative PCR
(19, 33) and fluorescent in situ hybridization (6) combined with flow cytometry.
These HT screening methods are useful for the analysis of the performances of
(mixed) fermentations, but do not provide information on produced flavors or interacting
pathways. For that, other tools can be used such as ~omics techniques. These include
transcriptome analysis like DNA microarrays (27, 32), proteome analysis (9, 35) and fast
volatile analysis, like GC-MS. Recently, a proteomics approach in mixed cultures was applied
to identify the proteins involved in cheese ripening, amongst which several peptidases (15).
Such an approach may also be useful for identification of proteins involved in flavor-forming
pathways. However, proteomics techniques are still quite laborious. Phelps and co-workers
argue that using bioinformatics to combine data derived from transcriptomics and
metabolomics provides a powerful tool for the identification of gene function and pathways
(36).
Having information on performances of cultures and metabolic pathways, it is possible
to construct complete flavor producing pathways rationally by metabolic engineering,
combining strains with incomplete pathways or addition of flavor precursors. The HT
screening tools allow rapid testing of thousands of combinations for acquiring the desired
fermentation. Additionally, combining different types of experimental data in a mathematical
model may lead to a better understanding of a mixed culture. Kinetic models describing
performances of mixed cultures have been made (5, 39) but these do not include the
production of metabolites, including flavor components. Genome-scale metabolic models, as
discussed later on, could be a very useful tool for describing and predicting the performances
of mixed cultures.

Chapter 2
44
Defined media versus industrial media. Flavor formation is not only strain and population
dependent, but also depends on environmental conditions. Although many flavor components
are produced independently of the growth medium, there are clear differences in flavor
profiles between complex and defined media. An example of how the growth medium can
affect flavor development is presented in Table 1. The headspace volatiles of batch cultures of
the yoghurt bacterium S. thermophilus LMG18311 in skim milk (Nilac) and chemically
defined medium (CDM) (28) are presented and compared. The components that are
interesting for overall flavor are mentioned. Acetaldehyde and diacetyl are formed by S.
thermophilus in both milk and CDM. However, 2,3-pentanedione and acetic acid are only
produced in CDM and not in milk. Another example was recently published dealing with the
optimization of acetoin formation by Bacillus subtilis CICC 10025 (50). Here, it was shown
that acidified molasses and soy bean hydrolysate as culture media lead to higher amounts of
acetoin than culturing in laboratory medium comprising sucrose, yeast extract and peptone.
The increase in acetoin formation is at least partially due to increased growth in molasses and
soy bean hydrolysate compared to laboratory medium. The authors argue that soy bean
hydrolysate is a more optimal nitrogen source for (acetoin production in) Bacillus subtilis.
Several more examples have been published on the effects of specific medium components,
such as citrate, on the formation of C4-compounds such as acetoin and the butter flavor
component, diacetyl. In most LAB, diacetyl is produced from pyruvate, via the intermediate
acetolactate, deriving from several sources (40). In some cases, the production of diacetyl is
clearly dependent on the presence of citrate (13). In summary, it is evident that the production
of flavor components is greatly influenced by the composition of the cultivation medium.
Understanding and improving flavor prediction with genome-scale metabolic models.
Genome-scale models are based on annotated genomes and experimental data and have
become available for an increasing number of organisms, including various LAB (34, 45). An
especially useful tool for the construction of these in silico models is the SimphenyTM
software package (Genomatica Inc., San Diego CA, USA). The in silico models are based on
a thorough metabolic reconstruction of well-annotated genome sequences (44). These models
and other bioinformatics tools can be used to search in genomes for components in amino acid
metabolism that contribute to flavor (43). If these models are combined with experimental

Screening approaches for flavor formation
45
data, such as transcriptome and metabolome data, whole genome analysis can be used to
expand our knowledge of flavor forming pathways and mechanisms in different bacteria,
different mixed cultures and different environments. The volatile analysis of cultures, as
described above, showing several similarities and differences in flavor formation between
different strains, can be visualized on the different metabolic maps in the Simpheny models.
The volatile analyses earlier in the results section for instance showed similarities and
differences in flavor formation between different strains. These can be visualized on the
different metabolic maps in the Simpheny models. An important key flavor in dairy products
is acetaldehyde. It has been reported (10) that different strains use different pathways for
acetaldehyde production. L. lactis produces acetaldehyde during lactose metabolism by
pyruvate decarboxylation (8) (Figure 3). S. thermophilus can convert threonine into
acetaldehyde and glycine by threonine aldolase activity (10) as is shown in Figure 4.
Interestingly, the genome of Lb. plantarum showed no homologue of threonine aldolase, yet
consumed threonine at significantly higher rates than needed for biomass production,
indicating that degradation of threonine, possibly into acetaldehyde, occurs (45).
As mentioned earlier in the results section, kinetic models for mixed cultures are
available to study the interactions during fermentations. An interesting development will be to
combine such models with genome-scale metabolic models to get more insight into the
metabolic changes that occur in mixed cultures.

Chapter 2
46
(a)
(b)
Figure 3. (a) Metabolic map (Simpheny) of primary metabolism in Lactobacillus plantarum WCFS1, the
acetaldehyde pathway is highlighted. pyr = pyruvate, PDH = pyruvate dehydrogenase, accoa = acetyl coenzyme
A, ACALD = acetaldehyde dehydrogenase, acald = acetaldehyde, ACALD2x = alcohol dehydrogenase, etoh =
ethanol. (b) Metabolic map (Simpheny) of amino acid metabolism in Lb. plantarum WCFS1, the acetaldehyde
pathway is highlighted. thr = threonine, THRA = threonine aldolase, acald = acetaldehyde, gly = glycine.

Screening approaches for flavor formation
47
Conclusion and future outlook
This overview discusses the application of different suitable tools such as GC-MS
analysis and genome-scale metabolic modeling to discover differences in the flavor producing
potential of separate strains and mixed cultures, as well as different media. Genome-scale
models are nowadays available for various LAB and kinetic models are available for mixed
cultures. These models can be combined with experimental data (e.g. the volatile analyses)
and can help to increase our knowledge about flavor forming capabilities in different strains,
mixtures and conditions. However, these models contain only the current state of affairs with
respect to flavor pathways. To identify new routes and components, and to fill the knowledge
gaps that become evident when constructing these models, ~omics techniques and HT
methods for analyzing the performances of cultures are essential. In recent years, the genomes
of many different LAB have been sequenced (26, 29). In order to get a better insight in the
regulation of flavor forming pathways under different conditions, DNA microarrays of some
of these sequenced strains have been developed. This provides a powerful tool for the
understanding of interactions occurring in mixed LAB cultures, as well as for the
understanding and control of flavor production by various LAB species. This knowledge will
lead to better selection procedures of LAB and to rational improvement of starter cultures and
(fermented) foods (Fig. 4).

Chapter 2
48
Figure 4. Schedule of knowledge-driven innovations in fermentative flavor formation. CDM = chemically
defined medium.

Screening approaches for flavor formation
49
References
1. Ayad, E. H. E., A. Verheul, C. De Jong, J. T. M. Wouters, and G. Smit. 1999.
Flavour forming abalities and amino acid requirements of Lactococcus lactis strains
isolated from artisanal and non-dairy strains. Int Dairy J 9:725-735.
2. Ayad, E. H. E., A. Verheul, W. J. M. Engels, J. T. M. Wouters, and G. Smit. 2001.
Enhanced flavour formation by combination of selected lactococci from industrial and
artisanal origin with focus on completion of a metabolic pathway. J Appl Microbiol
90:59-67.
3. Ayad, E. H. E., A. Verheul, J. T. M. Wouters, and G. Smit. 2002. Antimicrobial-
producing wild lactococci isolated from artisanal and non-dairy origins. Int Dairy J
12:145-150.
4. Ayad, E. H. E., A. Verheul, J. T. M. Wouters, and G. Smit. 2000. Application of
wild starter cultures for flavour development in pilot plant cheese making. Int Dairy J
10:169-179.
5. Beal, C., and G. Corrieu. 1991. Influence of pH, temperature, and inoculum
composition on mixed cultures of Streptococcus thermophilus 404 and Lactobacillus
bulgaricus 398. Biotechnol Bioeng 38:90-98.
6. Blasco, L., S. Ferrer, and I. Pardo. 2003. Development of specific fluorescent
oligonucleotide probes for in situ identification of wine lactic acid bacteria. FEMS
Microbiol Lett 225:115-123.
7. Bolotin, A., B. Quinquis, P. Renault, A. Sorokin, S. D. Ehrlich, S. Kulakauskas,
A. Lapidus, E. Goltsman, M. Mazur, G. D. Pusch, M. Fonstein, R. Overbeek, N.
Kyprides, B. Purnelle, D. Prozzi, K. Ngui, D. Masuy, F. Hancy, S. Burteau, M.
Boutry, J. Delcour, A. Goffeau, and P. Hols. 2004. Complete sequence and
comparative genome analysis of the dairy bacterium Streptococcus thermophilus. Nat
Biotechnol 22:1554-1558.
8. Bongers, R. S., M. H. Hoefnagel, and M. Kleerebezem. 2005. High-level
acetaldehyde production in Lactococcus lactis by metabolic engineering. Appl
Environ Microbiol 71:1109-1113.

Chapter 2
50
9. Champomier-Verges, M. C., E. Maguin, M. Y. Mistou, P. Anglade, and J. F.
Chich. 2002. Lactic acid bacteria and proteomics: current knowledge and
perspectives. J Chromatogr B Analyt Technol Biomed Life Sci 771:329-342.
10. Chaves, A. C., M. Fernandez, A. L. Lerayer, I. Mierau, M. Kleerebezem, and J.
Hugenholtz. 2002. Metabolic engineering of acetaldehyde production by
Streptococcus thermophilus. Appl Environ Microbiol 68:5656-5662.
11. Courtin, P., and F. Rul. 2004. Interactions between microorganisms in a simple
ecosystem: Yogurt bacteria as a study model. Lait 84:125-134.
12. Dahle, J., M. Kakar, H. B. Steen, and O. Kaalhus. 2004. Automated counting of
mammalian cell colonies by means of a flat bed scanner and image processing.
Cytometry A 60:182-188.
13. Escamilla-Hurtado, M. L., A. Tomasini-Campocosio, S. Valdes-Martinez, and J.
Soriano-Santos. 1996. Diacetyl formation by lactic bacteria. Rev Latinoam Microbiol
38:129-137.
14. Fredrickson, A. G. 1977. Behavior of mixed cultures of microorganisms. Annu Rev
Microbiol 31:63-87.
15. Gagnaire, V., M. Piot, B. Camier, J. P. Vissers, G. Jan, and J. Leonil. 2004.
Survey of bacterial proteins released in cheese: a proteomic approach. Int J Food
Microbiol 94:185-201.
16. Gallardo-Escamilla, F. J., A. L. Kelly, and C. M. Delahunty. 2005. Influence of
starter culture on flavor and headspace volatile profiles of fermented whey and whey
produced from fermented milk. J Dairy Sci 88:3745-3753.
17. Guedon, E., P. Renault, S. D. Ehrlich, and C. Delorme. 2001. Transcriptional
pattern of genes coding for the proteolytic system of Lactococcus lactis and evidence
for coordinated regulation of key enzymes by peptide supply. J Bacteriol 183:3614-
3622.
18. Guedon, E., P. Serror, S. D. Ehrlich, P. Renault, and C. Delorme. 2001.
Pleiotropic transcriptional repressor CodY senses the intracellular pool of branched-
chain amino acids in Lactococcus lactis. Mol Microbiol 40:1227-1239.

Screening approaches for flavor formation
51
19. Haarman, M., and J. Knol. 2006. Quantitative real-time PCR analysis of fecal
Lactobacillus species in infants receiving a prebiotic infant formula. Appl Environ
Microbiol 72:2359-2365.
20. Hamilton, C. M., M. Anderson, J. Lape, E. Creech, and J. Woessner. 2002.
Multichannel plating unit for high-throughput plating of cell cultures. Biotechniques
33:420-423.
21. Imhof, R., H. Glattli, and J. O. Nosset. 1994. Volatile organic compounds produced
by thermophilic and mesophilic single strain dairy starter cultures. Lebensmitteln
Wissenschaft und Technologie 28:78-86.
22. Ingham, C. J., M. van den Ende, D. Pijnenburg, P. C. Wever, and P. M.
Schneeberger. 2005. Growth and multiplexed analysis of microorganisms on a
subdivided, highly porous, inorganic chip manufactured from anopore. Appl Environ
Microbiol 71:8978-8981.
23. Ingham, C. J., M. van den Ende, P. C. Wever, and P. M. Schneeberger. 2006.
Rapid antibiotic sensitivity testing and trimethoprim-mediated filamentation of clinical
isolates of the Enterobacteriaceae assayed on a novel porous culture support. J Med
Microbiol 55:1511-1519.
24. John, G. T., D. Goelling, I. Klimant, H. Schneider, and E. Heinzle. 2003. PH-
sensing 96-well microtitre plates for the characterization of acid production by dairy
starter cultures. J Dairy Res 70:327-333.
25. Kieronczyk, A., S. Skeie, T. Langsrud, and M. Yvon. 2003. Cooperation between
Lactococcus lactis and nonstarter lactobacilli in the formation of cheese aroma from
amino acids. Appl Environ Microbiol 69:734-739.
26. Klaenhammer, T., E. Altermann, F. Arigoni, A. Bolotin, F. Breidt, J. Broadbent,
R. Cano, S. Chaillou, J. Deutscher, M. Gasson, M. van de Guchte, J. Guzzo, A.
Hartke, T. Hawkins, P. Hols, R. Hutkins, M. Kleerebezem, J. Kok, O. Kuipers,
M. Lubbers, E. Maguin, L. McKay, D. Mills, A. Nauta, R. Overbeek, H. Pel, D.
Pridmore, M. Saier, D. van Sinderen, A. Sorokin, J. Steele, D. O'Sullivan, W. de
Vos, B. Weimer, M. Zagorec, and R. Siezen. 2002. Discovering lactic acid bacteria
by genomics. Antonie Van Leeuwenhoek 82:29-58.

Chapter 2
52
27. Lazazzera, B. A. 2005. Lessons from DNA microarray analysis: the gene expression
profile of biofilms. Curr Opin Microbiol 8:222-227.
28. Letort, C., and V. Juillard. 2001. Development of a minimal chemically-defined
medium for the exponential growth of Streptococcus thermophilus. J Appl Microbiol
91:1023-1029.
29. Makarova, K., A. Slesarev, Y. Wolf, A. Sorokin, B. Mirkin, E. Koonin, A. Pavlov,
N. Pavlova, V. Karamychev, N. Polouchine, V. Shakhova, I. Grigoriev, Y. Lou, D.
Rohksar, S. Lucas, K. Huang, D. M. Goodstein, T. Hawkins, V. Plengvidhya, D.
Welker, J. Hughes, Y. Goh, A. Benson, K. Baldwin, J. H. Lee, I. Diaz-Muniz, B.
Dosti, V. Smeianov, W. Wechter, R. Barabote, G. Lorca, E. Altermann, R.
Barrangou, B. Ganesan, Y. Xie, H. Rawsthorne, D. Tamir, C. Parker, F. Breidt,
J. Broadbent, R. Hutkins, D. O'Sullivan, J. Steele, G. Unlu, M. Saier, T.
Klaenhammer, P. Richardson, S. Kozyavkin, B. Weimer, and D. Mills. 2006.
Comparative genomics of the lactic acid bacteria. Proc Natl Acad Sci U S A
103:15611-15616.
30. Marotz, J., C. Lubbert, and W. Eisenbeiss. 2001. Effective object recognition for
automated counting of colonies in Petri dishes (automated colony counting). Comput
Methods Programs Biomed 66:183-198.
31. Menendez, S., J. A. Centeno, R. Godinez, and J. L. Rodriguez-Otero. 2000.
Effects of Lactobacillus strains on the ripening and organoleptic characteristics of
Arzua-Ulloa cheese. Int J Food Microbiol 59:37-46.
32. Molenaar, D., F. Bringel, F. H. Schuren, W. M. de Vos, R. J. Siezen, and M.
Kleerebezem. 2005. Exploring Lactobacillus plantarum genome diversity by using
microarrays. J Bacteriol 187:6119-6127.
33. Neeley, E. T., T. G. Phister, and D. A. Mills. 2005. Differential real-time PCR assay
for enumeration of lactic acid bacteria in wine. Appl Environ Microbiol 71:8954-
8957.
34. Oliveira, A. P., J. Nielsen, and J. Forster. 2005. Modeling Lactococcus lactis using
a genome-scale flux model. BMC Microbiol 5:39.

Screening approaches for flavor formation
53
35. Pessione, E., R. Mazzoli, M. G. Giuffrida, C. Lamberti, E. Garcia-Moruno, C.
Barello, A. Conti, and C. Giunta. 2005. A proteomic approach to studying biogenic
amine producing lactic acid bacteria. Proteomics 5:687-698.
36. Phelps, T. J., A. V. Palumbo, and A. S. Beliaev. 2002. Metabolomics and
microarrays for improved understanding of phenotypic characteristics controlled by
both genomics and environmental constraints. Curr Opin Biotechnol 13:20-24.
37. Rijnen, L., S. Bonneau, and M. Yvon. 1999. Genetic characterization of the major
lactococcal aromatic aminotransferase and its involvement in conversion of amino
acids to aroma compounds. Appl Environ Microbiol 65:4873-4880.
38. Smit, B. A., W. J. Engels, J. T. Wouters, and G. Smit. 2004. Diversity of L-leucine
catabolism in various microorganisms involved in dairy fermentations, and
identification of the rate-controlling step in the formation of the potent flavour
component 3-methylbutanal. Appl Microbiol Biotechnol 64:396-402.
39. Sodini, I., E. Latrille, and G. Corrieu. 2000. Identification of interacting mixed
cultures of lactic acid bacteria by their exclusion from a model predicting the
acidifying activity of non-interacting mixed cultures. Appl Microbiol Biotechnol
54:715-718.
40. Swindell, S. R., K. H. Benson, H. G. Griffin, P. Renault, S. D. Ehrlich, and M. J.
Gasson. 1996. Genetic manipulation of the pathway for diacetyl metabolism in
Lactococcus lactis. Appl Environ Microbiol 62:2641-2643.
41. Tamime, A. Y., and H. C. Deeth. 1980. Yoghurt: technology and biochemistry. J
Food Prot 43:939-977.
42. Tavaria, F. K., S. Dahl, F. J. Carballo, and F. X. Malcata. 2002. Amino acid
catabolism and generation of volatiles by lactic acid bacteria. J Dairy Sci 85:2462-
2470.
43. Teusink, B., and E. J. Smid. 2006. Modelling strategies for the industrial exploitation
of lactic acid bacteria. Nat Rev Microbiol 4:46-56.
44. Teusink, B., F. H. van Enckevort, C. Francke, A. Wiersma, A. Wegkamp, E. J.
Smid, and R. J. Siezen. 2005. In silico reconstruction of the metabolic pathways of
Lactobacillus plantarum: comparing predictions of nutrient requirements with those
from growth experiments. Appl Environ Microbiol 71:7253-7262.

Chapter 2
54
45. Teusink, B., A. Wiersma, D. Molenaar, C. Francke, W. M. de Vos, R. J. Siezen,
and E. J. Smid. 2006. Analysis of growth of Lactobacillus plantarum WCFS1 on a
complex medium using a genome-scale metabolic model. J Biol Chem 281:40041-
40048.
46. Urbach, G. 1995. Contribution of lactic acid bacteria to flavour compound formation
in dairy products. Int Dairy J 5:877-903.
47. Van Kranenburg, R., M. Kleerebezem, J. van Hylckama Vlieg, B. M. Ursing, J.
Boekhorst, B. A. Smit, E. H. A. Ayad, G. Smit, and R. Siezen. 2002. Flavour
formation from amino acids by lactic acid bacteria: predictions from genome sequence
analysis. Int Dairy J 12:111-121.
48. Williams, A. G., S. E. Withers, E. Y. Brechany, and J. M. Banks. 2006. Glutamate
dehydrogenase activity in lactobacilli and the use of glutamate dehydrogenase-
producing adjunct Lactobacillus spp. cultures in the manufacture of cheddar cheese. J
Appl Microbiol 101:1062-1075.
49. Wouters, J. T. M., E. H. E. Ayad, J. Hugenholtz, and G. Smit. 2001. Microbes
from raw milk for fermented dairy products. Int Dairy J 12:91-109.
50. Xiao, Z. J., P. H. Liu, J. Y. Qin, and P. Xu. 2007. Statistical optimization of medium
components for enhanced acetoin production from molasses and soybean meal
hydrolysate. Appl Microbiol Biotechnol 74:61-68.
51. Yvon, M., S. Thirouin, L. Rijnen, D. Fromentier, and J. C. Gripon. 1997. An
aminotransferase from Lactococcus lactis initiates conversion of amino acids to
cheese flavor compounds. Appl Environ Microbiol 63:414-419.
52. Zourari, A., J. P. Accolas, and M. J. Desmazeaud. 1992. Metabolism and
biochemical characteristics of yoghurt bacteria-A review. Lait 72:1-34.

Chapter 3
Genome-scale model of Streptococcus thermophilus LMG18311 for
metabolic comparison of lactic acid bacteria
Margreet I. Pastink, Bas Teusink , Pascal Hols, Sanne Visser, Willem M. de Vos, Jeroen
Hugenholtz
Published in Applied and Environmental Microbiology, 2009, 75: 3627-3633

Chapter 3
56
Abstract
In this report we describe amino acid-metabolism and amino acid-dependency of the
dairy bacterium Streptococcus thermophilus LMG18311 and compare that with two other
characterized lactic acid bacteria, Lactococcus lactis and Lactobacillus plantarum. Through
the construction of a genome-scale metabolic model of S. thermophilus, the metabolic
differences between the three bacteria were visualized by direct projection on a metabolic
map. The comparative analysis revealed the minimal amino acid auxotrophy (only histidine
and methionine or cysteine) of S. thermophilus LMG18311 and the broad variety of volatiles
produced from amino acids compared to the other two bacteria. It also revealed the limited
number of pyruvate branches, forcing this strain to use the homofermentative metabolism for
growth optimization. In addition, some industrially-relevant features could be identified in S.
thermophilus such as the unique pathway for acetaldehyde (yoghurt flavour) production and
the absence of a complete pentose phosphate pathway.

Genome-scale model of S. thermophilus
57
Introduction
Lactic acid bacteria (LAB) are of great importance in the food industry, because their
lactic acid production and their characteristic impact (e.g. texture, flavor) on the final product
(19). LAB, as fastidious organisms, require a complex medium (such as milk) and are
dependent on their proteolytic system for their supply of essential amino acids (34). Amino
acids are not only the building blocks for proteins and peptides, but they also serve as
precursors for many other biomolecules (1). Amino acids are also important for the final
flavor of a product. Most amino acids do not directly influence the product flavor, but they
will contribute indirectly to it because they are precursors of aromatic compounds (36). The
conversion of amino acids to flavor compounds is mainly initiated by amino acid
transamination, which uses an α-ketoacid as an amino group acceptor for the
aminotransferases (27). The presence (or absence) of the α-ketoacid either by endogenous
production or by addition to the medium is an important factor in flavor formation (13). The
α-ketoacids are decarboxylated into aldehydes, which are the precursors of other flavor
compounds such as alcohols, esters and carboxylic acids (27). A large variation in flavor
formation between strains and species is observed. Different studies have reported this
biodiversity (25, 27, 32, 33); van Hylckama Vlieg et al studied for instance the difference
between dairy and non-dairy lactococcal strains since the latter group has some unique flavor
forming activities (33).
Amino acid catabolism and anabolism are complex processes and, thus, metabolic
models will be helpful for their understanding. Genome-scale metabolic models provide an
overview of all metabolic conversions in an organism, based on its genome sequence, and
make it possible to visualize different metabolic pathways, such as amino acid metabolism.
These models can be used to understand the metabolism and can then be applied for a directed
study of functionality. For Lactobacillus (Lb.) plantarum and Lactococcus (L.) lactis, such
genome-scale models have been already developed (18, 29); the construction of such a model
for Streptococcus (S.) thermophilus LMG18311 is described in this paper. The
characterization of the genome sequence of this S. thermophilus strain has revealed the
presence of a large amount of incomplete or truncated genes. These so called pseudogenes
amount to 10% of the total genes and most of them relate to carbohydrate metabolism,

Chapter 3
58
transport and regulation (2, 11). S. thermophilus is an important starter for the dairy industry.
It is used in combination with Lactobacillus delbrueckii subsp. bulgaricus for the production
of yoghurt. It is also used for the manufacture of cheeses in which high cooking temperatures
are applied (11). The objective of this paper is to study the metabolism of S. thermophilus
with the use of genome-scale models and experimental data in a comparative way. This
comparison with other LAB may reveal important differences. This study showed the simple
primary metabolism and the extensive amino acid metabolism in S. thermophilus.
Materials and methods
Construction of the genome-scale model. Genome-scale models are based on annotated
genome sequences and experimental data and have become available for an increasing
number of organisms, including various LAB (20, 30). A useful tool for the construction of
these in silico models is the SimphenyTM software package (Genomatica Inc., San Diego CA,
USA). The in silico models are based on a thorough metabolic reconstruction of well-
annotated genome sequences (29). The reconstruction of the network of S. thermophilus
LMG18311 (2, 11) was initiated by an automatic first reconstruction using the Autograph-
method (AUtomatic Transfer by Orthology of Gene reaction Associations for Pathway
Heuristics) as described in much detail elsewhere (18). The automatic output of Autograph
was subsequently curated extensively to accommodate the available annotation and literature
on metabolic pathways and enzymes, a process described in detail elsewhere (8). Also part of
the curation was the comparison of the gene-reaction associations with the available
annotations in KEGG (http://www.genome.jp/kegg/) and the ERGO bioinformatics suite
(http://ergo.integratedgenomics.com/ERGO/) (26).
Bacterial strains, media and growth conditions. The strains used in this study were S.
thermophilus LMG18311 (2), L. lactis MG1363 (35) and Lb. plantarum WCFS1 (14). Cells
were grown anaerobically in Chemically Defined Medium (CDM, 15, 21, 23), containing the
amino acids as listed in Table S1, at 42°C, 30°C and 37°C respectively.

Genome-scale model of S. thermophilus
59
Amino acid omissions. Cells of S. thermophilus were grown overnight in chemically defined
medium (CDM, 15), containing all 20 amino acids in the concentrations shown in Table S5 of
the Supplementary Materials. The overnight cultures were washed twice at 4°C in a Megafuge
1.0R (Heraeus Instruments, Germany) in Phosphate Buffered Saline (PBS).
CDM without amino acids was prepared freshly for each experiment. To this medium
different combinations of amino acids were added. The amino acids were added in the same
concentrations as used in complete CDM. We started with single omissions of amino acids
followed by multiple omissions until we found the most minimal combination. In Table 2, the
concentrations of the different amino acids supplied are listed for the different experiments.
The different minimal defined media were inoculated 0.5% in triplicate with the washed
overnight culture and growth was followed by measuring the OD600.
Growth on defined medium (chemostat). Fermentations were performed in duplicate as
described by Teusink et al (30). S. thermophilus LMG18311 was grown at 42°C in CDM in a
50-ml tube and used as inoculum of 500 ml pH-controlled (pH 6.5) CDM, the medium was
1% inoculated. Fermentations were performed in a 2-L fermentor (Applikon Biotechnology
BV, The Netherlands). The fermentations were controlled by a Bio Controller ADI 1010 and
by a Bio Console ADI 1025 (Applikon Biotechnology BV, The Netherlands). The headspace
was flushed with nitrogen (10 ml min-1) at a stirring speed of 100 rpm. At OD600 of ~0.5, the
medium pump was switched on to reach a dilution rate of 0.4 h-1. Steady state conditions were
achieved within five volume changes (30). The dilution rate was changed three times, so a
total of 4 dilution rates was achieved (0.1 h-1, 0.2 h-1, 0.3 h-1, 0.4 h-1). At each steady state 4 x
50 ml samples were taken and spun down at 4°C in a Unicen MR (Herolab, The Netherlands).
Supernatant was used for HPLC analysis of organic compounds (28).
GC analyses. For the identification of volatile components in the samples, purge and trap
thermal desorption cold trap gas-chromatography (GC) was used as described before (7, 27).
The headspace samples were concentrated on a Fisons MFA815 cold trap (CE Instruments,
Milan, Italy), followed by separation on a GC-8000 top gas chromatograph (CE Instruments)
equipped with a CIP-SIL 5 CB low-bleed column (Chrompack, Middelburg, The
Netherlands) and detection by a flame ionization detector. The GC data were processed in

Chapter 3
60
MetAlign, a tool (developed by Plant Research International, The Netherlands) to align
spectra and to identify significant differences between the spectra (6, 16).
HPLC analyses. Extracellular metabolites present in the supernatant of fermentation samples
were measured using reversed phase HPLC with a C18-column as described elsewhere (28).
Results
Genome scale model development. A genome-scale metabolic model for S. thermophilus
has been developed, based on the annotated genome of strain LMG18311 (2, 11). The
available models of Lb. plantarum (30) and of L. lactis, which was constructed using the
Autograph method (18), were used for the construction and development of the S.
thermophilus model. Based on these models, many gene-protein relationships and non-gene
associated reactions could be incorporated to our model, resulting in a metabolic map of S.
thermophilus (Figure 1).
Different features of every gene such as correct annotation, function and EC number
were checked manually, before they were included (or excluded) in the model. Examples of
excluded genes are: truncated, hypothetical and non-metabolic genes. Excluded genes are not
deleted and can be included again later when the function of such a gene has been identified.
Genes coding for metabolic enzymes have been included and associated to the corresponding
reactions (30). Also non-gene associated reactions, based on biochemical and experimental
evidences (fermentations, amino acid omissions), were added to close gaps in the biochemical
network, these included: (i) vitamin transport systems such as nicotinic acid uptake; (ii)
specific S. thermophilus protein synthesis based on experimental data; (iii) different uptake
systems such as oxygen diffusion a proton symporter for lactate.

Genome-scale model of S. thermophilus
61
Figure 1. Primary metabolism of Streptococcus thermophilus. Part of the total genome-scale metabolic model
developed for S. thermophilus. Large bold capital italics indicate the enzymes and normal small italics the
metabolites. The complete model can be found in the supplementary material (Figure S1).
The current model consists of 429 genes (23% of the total number of genes) and 522 model
reactions, 79 (15%) of which are non-gene associated. Moreover, the biomass composition of
this strain was determined in this study and compared with two other LAB (Table 1). The
closely related strains L. lactis and S. thermophilus have comparable amounts of protein.
Organic compounds in fermentation samples were measured by HPLC, on the basis of which
fluxes were calculated (30). Both biomass data and fluxes were used for in silico simulations.
The model of S. thermophilus is now at a stage where in silico growth can be simulated under
different conditions.

Chapter 3
62
Table 1. Biomass composition of three different LAB: L. lactis (20), Lb. plantarum (30) and S. thermophilus
LMG18311 (this study; average of 3 fermentations, samples taken at steady-state).
Compound (% w/w) Overall biomass composition L. lactis Lb. plantarum S. thermophilus Proteins 46 29.9 43.4 Lipids 3.4 6.3 6.1 Polysaccharides 12 9.9 24.1 DNA 2.3 1.9 1 RNA 10.7 9 8.2 Other 25.6 43 17.2
Amino acid omissions. Experiments with single amino acid omissions in S. thermophilus
have shown that the number and type of essential amino acids is strain dependent (9, 15, 17).
In general, S. thermophilus has a much lower degree of auxotrophy for amino acids than other
LAB (4), showing no growth only in the absence of histidine and clearly reduced growth in
the absence of cysteine (Table S2).
Multiple omissions of amino acids, performed in our laboratory, showed that S.
thermophilus LMG18311 needs only histidine and one of the sulfur containing amino acids
(cysteine or methionine) in the presence of citrate for (minimal) growth, (Table 2).
Table 2. Growth of S. thermophilus after 24 hours under multiple amino acid omissions. Data shown are the
average of three parallel cultures. Additional data of these amino acid omission experiments are shown in the
Supplementary material (Table S2)
aa composition in CDM (g/l) Medium OD600All AA 1.55No AA 0a
Only his (0.15) and cys (0.39) 0.6b
Only his, cys, glu (0.4) 0.69Only his, cys, glu, phe (0.28) 0.75Only his, cys, glu, ser (0.34) 0.83Only his, cys, glu, ala (0.24) 0.44Only his, cys, glu, val (0.33) 0.72Only his, cys, glu, phe, ser 0.73Only his, cys, glu, phe, ala 0.53Only his, cys, glu, phe, val 0.61Only his, cys, glu, ser, ala 0.69Only his, cys, glu, ala, val 0.82a negative control, should be 0 bgrowth after 48 hours

Genome-scale model of S. thermophilus
63
We have performed the growth experiments on a minimal defined medium with histidine,
cysteine and glutamic acid, since the addition of glutamic acid improved the growth rate
significantly and growth experiments showed that cysteine is preferred over methionine.
In silico predictions of the amino acid biosynthesis pathways of S. thermophilus
LMG18311 were performed (11) and this strain indeed seems to contain all the genes coding
for the enzymes required for the biosynthesis of all amino acids except histidine. This analysis
also showed that yhcE is truncated by a conserved stop codon. The product of yhcE shows
similarity to the vitamin B12-independent 5-methyltetrahydropteroyltriglutamate-
homocysteine S-methyltransferase. Its orthologue in L. lactis is involved in the synthesis of
cysteine from methionine. This gene inactivation may explain the auxotrophy for one of the
two sulfur amino acids. Even though the genome of LMG18311 lacks a glutamate synthase
gene, the strain shows (minimal) growth in the presence of citrate, when both glutamate and
glutamine were depleted from the medium. However, S. thermophilus possesses a pathway
for the synthesis of glutamate from citrate via 2-oxoglutarate involving glutamate
dehydrogenase and glutamine synthetase for interconversion between glutamic acid and
glutamine
Different LAB have different absolute requirements for amino acids; S. thermophilus
only needs 2 amino acids as described above whereas L. lactis and Lb. plantarum need 6 and
11 amino acids for minimal growth respectively (Table 3) (12, 30).
Table 3. Essential amino acids for three different lactic acid bacteria: L. lactis MG1363 (12), Lb. plantarum
WCFS1 (30) and S. thermophilus (this study, table 2)
L. lactis MG1363 Lb. plantarum WCFS1 S. thermophilus LMG18311 Glutamate Arginine Cysteine Histidine Cysteine Histidine Isoleucine Glutamate Leucine Isoleucine Methionine Leucine Valine Methionine Phenylalanine Threonine Tryptophan Tyrosine Valine

Chapter 3
64
GC analyses. In order to get an overview of flavor formation by the three different LAB, we
compared fermentation samples using gas chromatography (GC). The headspace of steady
state samples of S. thermophilus LMG18311, L. lactis MG1363 and Lb. plantarum WCFS1
grown on CDM (containing all amino acids) was compared. The metabolic activities of the
fermenting microbes (22) was investigated through flavor profiles in the fermentation fluids,
corrected for the medium components at the start of the experiments. An overview of the
volatile metabolic products is shown in Figures 2, 3 and 4 and they show multiple differences
in the volatile profiles of different strains.
Figure 2. Major volatiles formed during growth by L. lactis on chemically defined medium. Relative peak areas
are expressed as arbitrary units, the area of three peaks is indicated since they are beyond the scale. Some
important peaks are indicated. Table S3 (Supplemental material) shows all the identified metabolites for L.
lactis.
Figure 3. Major volatiles formed during growth by Lb. plantarum on chemically defined medium. Relative peak
areas are expressed as arbitrary units. Some important peaks are indicated. Table S4 (Supplementary material)
shows all the identified metabolites for Lb. plantarum.

Genome-scale model of S. thermophilus
65
Figure 4. Major volatiles formed during growth by S. thermophilus on chemically defined medium. Relative
peak areas are expressed as arbitrary units, the area of three peaks is indicated since they are beyond the scale.
Some important peaks are indicated. Table S5 (Supplementary material) shows all the identified metabolites for
S. thermophilus.
Many volatiles or flavors are produced during amino acid metabolism. When the results of the
GC analyses of the three LAB are compared, they show that S. thermophilus is able to
produce a broad variety of flavors. In combination with the low requirements of amino acids
(only 2), this reflects a relatively complete set of amino acid biosynthetic and amino acid
converting pathways. When S. thermophilus grows on CDM, all amino acids are consumed in
small amounts (data not shown). L. lactis and Lb. plantarum need more amino acids
(respectively 6 and 11) for minimal growth and especially Lb. plantarum produces less
flavors.
One of the identified compounds produced by all three LAB is acetaldehyde. As
described previously (5), S. thermophilus can convert threonine into acetaldehyde and glycine
by threonine aldolase activity. L. lactis and Lb. plantarum, among others can produce
acetaldehyde during lactose metabolism by pyruvate decarboxylation (3). This difference in
pathways leading to the same compound, can also be visualized in the Simpheny models, as
was shown in our previous paper (22).
Homofermentative metabolism. S. thermophilus was grown under chemostat conditions on
a chemically defined medium containing all amino acids. Steady state fermentation samples

Chapter 3
66
(dilution rate = 0.1 to 0.4 h-1) of S. thermophilus were used for different analyses. The
supernatant of these samples was analyzed on HPLC and was compared with the composition
of the growth medium to determine which compounds are produced and consumed during
growth (Table 4).
Table 4. HPLC analyses of fermentation cell supernatants; S. thermophilus was grown under chemostat
conditions at a dilution rate (D) of 0.1 h-1 to 0.4 h-1 on CDM (5g l-1 glucose) containing all amino acids. The
table shows steady state concentrations of the various metabolites formed or utilized in mM.
a Average of two duplicates. ND, not detected
The HPLC-analysis shows that S. thermophilus consumes all the glucose and some of
the citric acid. S. thermophilus produces mainly lactate and only small amounts of pyruvate,
succinate and formate are formed. The model strongly suggests that homofermentative lactic
acid production is the only primary metabolism operating in S. thermophilus and this is
confirmed by our fermentation data and also by others (11). The mixed acid fermentation
(acetate, formate and ethanol) is metabolically the most efficient route for lactic acid bacteria
whereas the homolactic route is catalytically more efficient (10). Both L. lactis and Lb.
plantarum can grow homolactic (high dilution rates) or via mixed acid fermentation (low
dilution rates) (10, 30). Because S. thermophilus has pseudogenes in the primary metabolism
that prevent the formation of ethanol, acetate formation will cause a redox problem, and
hence, the only possible route is the homolactic fermentation at both high and low dilution
rates.
Flux Balance Analysis (FBA) was carried out within the Simpheny software (30).
FBA is an optimization technique that can be used as a tool to predict the metabolic
possibilities given mass balance and capacity constraints (24). FBA correctly predicted
homolactic fermentation in S. thermophilus, in contrast to what was found for Lb. plantarum
(30) and L. lactis (20). Based on the sequenced genome of strain LMG18311, and visualized
Compound (mM)a
Citric acid Pyruvate Lactic acid Formic acid Acetic acid Glucose
CDM 2.49 ND ND ND 12.11 25.46 supernatant D=0.1 1.41 ND 20.41 ND 9.90 0.09 D=0.2 1.39 ND 30.55 0.84 9.56 0.21 D=0.3 1.70 0.12 33.08 1.28 10.83 ND D=0.4 1.99 0.21 34.70 1.83 12.01 0.36

Genome-scale model of S. thermophilus
67
on the model, it is known that this strain does not have the oxidative part of the pentose
phosphate pathway (PPP). The absence of a complete PPP may have important consequences
for the redox balance and thereby potentially influences primary metabolism.
Discussion
In this paper a comparative analysis of three lactic acid bacteria; S. thermophilus, L.
lactis and Lb. plantarum, is described. Comparative analysis can provide extra insights in
metabolism; such as flavor formation and growth rate and it can also reveal the absence of an
important pathway in one of the strains, because it is present in the other strains and vice
versa. An illustrative example of this is the extensive flavor forming potential of S.
thermophilus. This was only noticed because we analyzed different strains simultaneously.
Useful tools to compare different organisms are genome-scale metabolic models. Complete
models are available for L. lactis and Lb. plantarum and in this paper, we describe the
construction of such a genome-scale model for S. thermophilus LMG18311. These genome-
scale models are of course never complete and can always be expanded with new insights.
Growth can be simulated under different conditions with these models. With some given
constraints such as lactose excess or different pH values, growth can be predicted and can
give insights in optimal growth conditions.
The most obvious difference between the three bacteria and therefore also the models,
is the size of the genome and thus the number of genes. The model of Lb. plantarum contains
3064 genes compared to 2563 genes in the L. lactis model and 1889 genes (or gene
fragments) in the S. thermophilus model. This would suggest a more extensive metabolism for
Lb. plantarum and L. lactis. But the total absolute number of reactions in the three models is
nearly similar: 522 for S. thermophilus, 598 for Lb. plantarum and 598 for L. lactis. Based on
the amino acid requirements and flavor analyses as described in the results section, it seems
that S. thermophilus has a more extensive amino acid metabolism than the other two LAB. S.
thermophilus only needs 2 amino acids, histidine and cysteine, for minimal growth, it can
degrade all amino acids and is able to produce a varied amount of amino acid derived flavors.
The genome-scale model, supported by the overall experimental data, suggests a rather
complete set of amino acid biosynthesis pathways in S. thermophilus. This is unexpected

Chapter 3
68
because S. thermophilus is used for centuries for the production of yoghurt. The LMG18311
strain is also a yoghurt strain (11). The assumption would be that S. thermophilus has evolved
in this protein rich environment (milk) and therefore one may have expected loss of some or
more amino acid biosynthesis pathways, but this is clearly not the case. It would be
interesting to see if all these pathways are operated under all conditions during the different
dairy fermentation processes. These studies in which expression data under different
interesting conditions are involved, are currently under investigation. Intriguingly,
Lactobacillus delbrueckii subsp. bulgaricus, an organism that is most often co-cultivated with
S. thermophilus for yoghurt manufacturing, did follow this expected path and lost most of its
amino acid biosynthetic capacity (31). An explanation for this unexpected behavior of S.
thermophilus can be that amino acid metabolism is not only important for the synthesis of
amino acids but also plays a role in maintaining the redox balance. Another explanation can
be that S. thermophilus strains are selected for quick growth and acidification in milk,
available amino acid are rate-limiting in milk. To support such a quick growth, maintenance
of nearly all amino acid pathways is required.
In the result section, an in silico prediction of the amino acid biosynthesis pathways is
described. This analysis showed that ychE is truncated by a conserved stop codon. It would be
interesting to reconstitute this codon and study the effect of an activated codon. This mutated
strain probably only needs one amino acid (histidine) and complete pathways for the sulfur
amino acid metabolism may have important effects on the flavor formation.
A result from our experimental data, those described in the literature (11) and a
prediction of the genome scale model is that S. thermophilus has a simple primary metabolism
because the number of pyruvate branches is limited. Especially, those which are important for
NAD+ regeneration for glycolysis, there is no real alternative to lactate dehydrogenase for
NAD+ regeneration. Due to this, there is really only one possible route, leading to an
equilibrated redox balance for glucose catabolism when S. thermophilus grows anaerobically,
and that is the homolactic route. Therefore, Flux Balance Analysis does predict the right
growth rate and products formation rates in S thermophilus. In Lb. plantarum and L. lactis,
FBA invariably predicts the use of an alternative pathway with higher ATP yield (mixed acid
fermentation), and homolactic fermentation cannot be predicted by FBA.

Genome-scale model of S. thermophilus
69
Another striking difference between S. thermophilus and L. lactis and Lb. plantarum is
the absence of a complete pentose phosphate pathway. Three genes encoding for the enzymes
glucose-6-Phosphate dehydrogenase, 6-phosphogluconolactonase and phosphogluconate
dehydrogenase are missing, these 3 enzymes form the oxidative part of the pentose phosphate
pathway. This might have important consequences for the NADPH generation, the
ribonucleotides and aromatic amino acids synthesis. There might be a link between the simple
primary metabolism (limited number of pyruvate branches and the absence of a complete
PPP) and the complex amino acid metabolism via redox constraints, a hypothesis that is
currently under investigation.
Acknowledgements: P.H. is research associate at FNRS. The Kluyver Centre for Genomics
of Industrial Fermentation is part of the Netherlands Genomics Initiative (NGI).

Chapter 3
70
References
1. Berg, J. M., J. L. Tymoczko, and L. Stryer. 2002. Biochemistry.
2. Bolotin, A., B. Quinquis, P. Renault, A. Sorokin, S. D. Ehrlich, S. Kulakauskas,
A. Lapidus, E. Goltsman, M. Mazur, G. D. Pusch, M. Fonstein, R. Overbeek, N.
Kyprides, B. Purnelle, D. Prozzi, K. Ngui, D. Masuy, F. Hancy, S. Burteau, M.
Boutry, J. Delcour, A. Goffeau, and P. Hols. 2004. Complete sequence and
comparative genome analysis of the dairy bacterium Streptococcus thermophilus. Nat.
Biotechnol. 22:1554-1558.
3. Bongers, R. S., M. H. Hoefnagel, and M. Kleerebezem. 2005. High-level
acetaldehyde production in Lactococcus lactis by metabolic engineering. Appl.
Environ. Microbiol. 71:1109-1113.
4. Bracquart, P., and D. Lorient. 1979. Effet des acides amines et peptides sur la
croissance de Streptococcus thermophilus III. Peptides comportant Glu, His et met.
Milchwissenschaft 34:676-679.
5. Chaves, A. C., M. Fernandez, A. L. Lerayer, I. Mierau, M. Kleerebezem, and J.
Hugenholtz. 2002. Metabolic engineering of acetaldehyde production by
Streptococcus thermophilus. Appl. Environ. Microbiol. 68:5656-5662.
6. de Vos, R. C. H., S. Moco, A. Lommen, J. Keurentjes, R. J. Bino, and R. D. Hall.
2007. Untargeted large-scale plant metabolomics using liquid chromatography
coupled to mass spectrometry. Nat. Protoc. 2:778-791.
7. Engels, W. J. M., and S. Visser. 1996. Development of cheese flavour from peptides
and amino acids by cell-free extracts of Lactococcus lactis subsp. cremoris B78 in a
model system. Neth. Milk Dairy J. 50:3-17.
8. Francke, C., R. J. Siezen, and B. Teusink. 2005. Reconstructing the metabolic
network of a bacterium from its genome. Trends Microbiol. 13:550-558.
9. Garault, P., C. Letort, V. Juillard, and V. Monnet. 2000. Branched-chain amino
acid biosynthesis is essential for optimal growth of Streptococcus thermophilus in
milk. Appl. Environ. Microbiol. 66:5128-5133.

Genome-scale model of S. thermophilus
71
10. Garrigues, C., P. Loubiere, N. D. Lindley, and M. Cocaign-Bousquet. 1997.
Control of the shift from homolactic acid to mixed-acid fermentation in Lactococcus
lactis: predominant role of the NADH/NAD+ ratio. J. Bacteriol. 179:5282-5287.
11. Hols, P., F. Hancy, L. Fontaine, B. Grossiord, D. Prozzi, N. Leblond-Bourget, B.
Decaris, A. Bolotin, C. Delorme, S. Dusko Ehrlich, E. Guedon, V. Monnet, P.
Renault, and M. Kleerebezem. 2005. New insights in the molecular biology and
physiology of Streptococcus thermophilus revealed by comparative genomics. FEMS
Microbiol. Rev. 29:435-463.
12. Jensen, P. R., and K. Hammer. 1993. Minimal Requirements for Exponential
Growth of Lactococcus lactis. Appl. Environ. Microbiol. 59:4363-4366.
13. Kieronczyk, A., S. Skeie, T. Langsrud, and M. Yvon. 2003. Cooperation between
Lactococcus lactis and nonstarter lactobacilli in the formation of cheese aroma from
amino acids. Appl. Environ. Microbiol. 69:734-739.
14. Kleerebezem, M., J. Boekhorst, R. van Kranenburg, D. Molenaar, O. P. Kuipers,
R. Leer, R. Tarchini, S. A. Peters, H. M. Sandbrink, M. W. Fiers, W. Stiekema,
R. M. Lankhorst, P. A. Bron, S. M. Hoffer, M. N. Groot, R. Kerkhoven, M. de
Vries, B. Ursing, W. M. de Vos, and R. J. Siezen. 2003. Complete genome sequence
of Lactobacillus plantarum WCFS1. Proc. Natl. Acad. Sci. U S A 100:1990-1995.
15. Letort, C., and V. Juillard. 2001. Development of a minimal chemically-defined
medium for the exponential growth of Streptococcus thermophilus. J. Appl. Microbiol.
91:1023-1029.
16. Lommen, A., G. van der Weg, M. C. van Engelen, G. Bor, L. A. Hoogenboom,
and M. W. Nielen. 2007. An untargeted metabolomics approach to contaminant
analysis: pinpointing potential unknown compounds. Anal. Chim. Acta 584:43-49.
17. Neviani, E., G. Giraffa, A. Brizzi, and D. Carminati. 1995. Amino acid
requirements and peptidase activities of Streptococcus salivarius subsp. thermophilus.
J. Appl. Bacteriol. 79:302-307.
18. Notebaart, R. A., F. H. van Enckevort, C. Francke, R. J. Siezen, and B. Teusink.
2006. Accelerating the reconstruction of genome-scale metabolic networks. BMC
Bioinformatics 7:296.

Chapter 3
72
19. Novak, L., M. Cocaign-Bousquet, N. D. Lindley, and P. Loubiere. 1997.
Metabolism and energetics of Lactococcus lactis during growth in complex or
synthetic media. Appl. Environ. Microbiol. 63:2665-2670.
20. Oliveira, A. P., J. Nielsen, and J. Forster. 2005. Modeling Lactococcus lactis using
a genome-scale flux model. BMC Microbiol. 5:39.
21. Otto, R., B. Ten Brink, H. Veldkamp, and W. N. Konings. 1983. The relation
between growth rate and electrochemical proton gradient of Streptococcus cremoris.
FEMS Microbiol. Lett. 16:69-74.
22. Pastink, M. I., S. Sieuwerts, F. A. M. de Bok, P. W. M. Janssen, B. Teusink, J.
Van Hylckama Vlieg, and J. Hugenholtz. 2008. Genomics and high-throughput
screening approaches for optimal flavour production in dairy fermentation. Int. Dairy
J. 18:781-789.
23. Poolman, B., and W. N. Konings. 1988. Relation of growth of Streptococcus lactis
and Streptococcus cremoris to amino acid transport. J. Bacteriol. 170:700-707.
24. Price, N. D., J. L. Reed, and B. Palsson. 2004. Genome-scale models of microbial
cells: evaluating the consequences of constraints. Nat. Rev. Microbiol. 2:886-897.
25. Rademaker, J. L., H. Herbet, M. J. Starrenburg, S. M. Naser, D. Gevers, W. J.
Kelly, J. Hugenholtz, J. Swings, and J. E. van Hylckama Vlieg. 2007. Diversity
analysis of dairy and nondairy Lactococcus lactis isolates, using a novel multilocus
sequence analysis scheme and (GTG)5-PCR fingerprinting. Appl. Environ. Microbiol.
73:7128-7137.
26. Santos, F. 2008. Vitamin B12 synthesis in Lactobacillus reuteri. PhD thesis
Wageningen University.
27. Smit, B. A., W. J. Engels, J. T. Wouters, and G. Smit. 2004. Diversity of L-leucine
catabolism in various microorganisms involved in dairy fermentations, and
identification of the rate-controlling step in the formation of the potent flavour
component 3-methylbutanal. Appl Microbiol Biotechnol 64:396-402.
28. Starrenburg, M. J., and J. Hugenholtz. 1991. Citrate Fermentation by Lactococcus
and Leuconostoc spp. Appl. Environ. Microbiol. 57:3535-3540.
29. Teusink, B., F. H. van Enckevort, C. Francke, A. Wiersma, A. Wegkamp, E. J.
Smid, and R. J. Siezen. 2005. In silico reconstruction of the metabolic pathways of

Genome-scale model of S. thermophilus
73
Lactobacillus plantarum: comparing predictions of nutrient requirements with those
from growth experiments. Appl. Environ. Microbiol. 71:7253-7262.
30. Teusink, B., A. Wiersma, D. Molenaar, C. Francke, W. M. de Vos, R. J. Siezen,
and E. J. Smid. 2006. Analysis of growth of Lactobacillus plantarum WCFS1 on a
complex medium using a genome-scale metabolic model. J. Biol. Chem. 281:40041-
40048.
31. van de Guchte, M., S. Penaud, C. Grimaldi, V. Barbe, K. Bryson, P. Nicolas, C.
Robert, S. Oztas, S. Mangenot, A. Couloux, V. Loux, R. Dervyn, R. Bossy, A.
Bolotin, J. M. Batto, T. Walunas, J. F. Gibrat, P. Bessieres, J. Weissenbach, S. D.
Ehrlich, and E. Maguin. 2006. The complete genome sequence of Lactobacillus
bulgaricus reveals extensive and ongoing reductive evolution. Proc. Natl. Acad. Sci. U
S A 103:9274-9279.
32. Van Hylckama Vlieg, J., and J. Hugenholtz. 2007. Mining natural diversity of lactic
acid bacteria for flavour and health benefits. Int. Dairy J. 17:1290-1297.
33. van Hylckama Vlieg, J. E., J. L. Rademaker, H. Bachmann, D. Molenaar, W. J.
Kelly, and R. J. Siezen. 2006. Natural diversity and adaptive responses of
Lactococcus lactis. Curr. Opin. Biotechnol. 17:183-190.
34. Vesanto, E., K. Peltoniemi, T. Purtsi, J. L. Steele, and A. Palva. 1996. Molecular
characterization, over-expression and purification of a novel dipeptidase from
Lactobacillus helveticus. Appl. Microbiol. Biotechnol. 45:638-645.
35. Wegmann, U., M. O'Connell-Motherway, A. Zomer, G. Buist, C. Shearman, C.
Canchaya, M. Ventura, A. Goesmann, M. J. Gasson, O. P. Kuipers, D. van
Sinderen, and J. Kok. 2007. Complete genome sequence of the prototype lactic acid
bacterium Lactococcus lactis subsp. cremoris MG1363. J. Bacteriol. 189:3256-3270.
36. Yvon, M., S. Thirouin, L. Rijnen, D. Fromentier, and J. C. Gripon. 1997. An
aminotransferase from Lactococcus lactis initiates conversion of amino acids to
cheese flavor compounds. Appl. Environ. Microbiol. 63:414-419.

Chapter 3
74
Supplementary material
Table S1. Amino acid composition (in grams/liter) of the full chemically defined medium
Concentration (g/l) Amino Acid S. thermophilus L. lactis Lb. plantarum Alanine 0.24 0.24 0.24 Arginine 0.13 0.125 0.125 Aspartic acid 0.46 0.42 0.42 Asparagine 0.35 Cysteine 0.25 0.13 0.13 Glutamic acid 0.4 0.5 0.5 Glutamine 0.39 Glycine 0.18 0.175 0.175 Histidine 0.15 0.15 0.15 Isoleucine 0.22 0.21 0.21 Leucine 0.48 0.475 0.475 Lysine 0.44 0.44 0.44 Methionine 0.13 0.125 0.125 Phenylalanine 0.28 0.275 0.275 Proline 0.68 0.675 0.675 Serine 0.34 0.34 0.34 Threonine 0.23 0.225 0.225 Tryptophane 0.5 0.05 0.05 Tyrosine 0.29 0.25 0.25 Valine 0.33 0.325 0.325

Genome-scale model of S. thermophilus
75
Table S2. Growth of S. thermophilus after 24 hours under single amino acid omission in CDM
Single AA omission Without OD600 All AA present 1.64 No AA 0a
Alanine 1.44 Arginine 1.17 Asparagine 1.63 Aspartic acid 1.68 Cysteine 1.00 Glutamine 1.49 Glutamic acid 1.40 Glycine 1.61 Histidine 0 Isoleucine 1.44 Leucine 1.32 Lysine 1.63 Methionine 1.66 Phenylalanine 1.67 Praline 1.63 Serine 1.68 Threonine 1.69 Tryptophan 1.28 Tyrosine 1.48 Valine 1.57 anegative control, should be 0

Chapter 3
76
Table S3. Identified volatile compounds formed by L. lactis MG1363 during growth
RT Area Compound 3.67 5.62 E+04 acetaldehyde 4.32 2.13 E+06 ethanol 4.34 2.07E+07 ethanol 4.85 1.58E+05 2-propanol 4.9 3.12E+04 Nitrous oxide 4.97 1.02E+05 Ethyl ether 5.06 1.04E+05 Formic acid, ethyl ester 5.3 2.66E+04 2-propanol, 2-methyl- 5.71 1.54E+04 2-propen-1-ol 5.96 1.77E+05 1-propanol 6.29 1.31E+05 Silanol, trimethyl 6.45 3.88E+04 2,3-butanedione 6.89 5.43E+04 propanal 7.11 2.40E+04 2-butanol 7.29 2.01E+04 Furan, 2-methyl 7.42 1.40E+05 Acetic acid, ethyl ester 9.84 1.03E+04 4-penten-2-one 11.24 1.18E+05 Methyl thiolacetate 12.15 1.60E+04 Propanoic acid, ethyl ester 12.25 3.91E+04 Furan, 2,5-dimethyl- 13.15 2.10E+04 Pyrazine 13.31 1.93E+04 Thiazole 13.51 5.80E+05 3-penten-2-one 13.87 7.49E+04 1-butanol, 3-methyl- 14.13 1.97E+05 1-butanol, 2-methyl- 14.52 1.98E+04 Ethane, isocyanato 15.18 1.65E+04 Propanoic acid, 2-methyl-, ethyl ester 15.75 8.52E+04 Silane, diethoxydimethyl 17.68 1.34E+04 octane 17.84 5.56E+04 Pyrazine, methyl- 18.4 6.29E+04 Acetyl valeryl 19.23 1.46E+04 Butanoic acid, 3-methyl-,ethyl ester 19.45 3.03E+04 benzenemethanol 20.37 1.19E+04 2-heptanone 20.59 2.56E+04 3-hexen-2-one, 5-methyl 20.67 1.43E+04 Acetic acid ethenyl ester 21.07 5.69E+04 Pyrazine, 2,6-dimethyl- 21.24 4.53E+04 Pyrazine, ethyl 22.88 1.63E+04 2-isopropylpyrazine 23.57 2.23E+04 Pyrazine, 2-ethyl-6-methyl- 23.71 3.71E+04 3-furancarboxylic acid, 2-methyl-, 24.24 3.24E+04 benzoxazole 24.97 2.69E+04 Pyrazine, 2-methyl-5-(1-methylethyl)- 25.69 4.22E+04 2-nonanone

Genome-scale model of S. thermophilus
77
Table S4. Identified volatile compounds formed by Lb. plantarum WCFS1 during growth
RT Area Compound 3.67 1.59E+04 acetaldehyde 4.22 1.29E+05 ethanol 4.24 1.90E+04 ethanol 4.43 2.74E+05 acetonitrile 4.96 2.98E+04 Ethyl ether 5.05 8.00E+04 Formic acid, ethyl ester 5.21 2.07E+04 2-propanol, 2-methyl 5.68 1.17E+04 Carbon disulfide 5.8 2.00E+04 Propanal, 2-methyl 6.89 1.39E+04 2,3-butandedione 7.01 3.13E+04 1-pentene, 2-methyl- 8.03 4.22E+04 Propane, 2-ethoxy-2-methyl 8.52 7.11E+04 2-butanol, 2-methyl 10.42 1.12E+04 2-pentanone 12.19 1.44E+05 2-propenoic acid, 2-methyl-,methyl ester 13.54 3.73E+05 3-buten-1-ol, 3-methyl 13.83 6.09E+04 1-butanol, 3-methyl- 14.08 7.93E+04 1-butanol, 2-methyl- 15.97 2.30E+05 2-buten-1-ol, 3-methyl 18.11 1.79E+04 Ethanol, 2-chloro-acetate 20.36 1.94E+04 2-heptanone 24.79 4.45E+04 2,5-hexanediol, 2,5-dimethyl- 25.67 6.33E+04 2-nonanone 25.93 3.15E+04 Benzaldehyde, 4-methyl 27.32 2.32E+04 1-nonanol 28.29 5.44E+04 Pentanoic acid, 2,4-dimethyl-4-nitro, methyl ester 28.87 2.95E+04 Nerol/cis-geraniol 31.54 6.27E+04 Butanoic acid, 2-ethyl-2,3,3-trimethyl-, methylester
Table S5. Identified volatile compounds formed by S. thermophilus LMG18311 during growth
RT Area Compound 3.67 4.31E+05 acetaldehyde 4.95 1.60E+04 2-propenenitrile 5.05 4.30E+04 1,3-pentadiene 6.05 1.79E+04 2-propenal, 2-methyl- 6.32 8.87E+04 Propane, 2-methoxy-2-methyl- 6.41 9.92E+04 2,3-butanedione 6.99 3.29E+04 1-pentene,2-methyl 7.26 3.17E+04 Furan, 2-methyl- 7.42 3.06E+04 3-buten-2-ol, 2-methyl 8.02 4.61E+05 1-propanol, 2-methyl-

Chapter 3
78
8.52 2.15E+05 2-butanol, 2-methyl 9.12 2.40E+04 2-butanone, 3-methyl 9.8 2.94E+04 3-buten-2-one, 3-methyl- 10.43 1.23E+05 2-pentanone 10.73 1.04E+05 2,3-pentanedione 11.47 4.21E+04 2-pentanol 13.11 2.15E+04 pyrazine 13.46 3.47E+06 3-penten-2-one 13.54 2.84E+05 3-buten-1-ol, 3-methyl- 13.69 9.39E+04 2-pentanol, 2-methyl- 13.83 1.62E+06 1-butanol, 3-methyl- 14.08 3.62E+05 1-butanol, 2-methyl-, 15.72 1.46E+05 Furan, tetrahydro-2,2,5,5-tetramethyl- 15.83 2.64E+04 2-butenal, 3-methyl- 15.97 7.06E+04 2-buten-1-ol, 3-methyl 17.82 4.74E+04 Pyrazine, methyl- 18.55 1.73E+04 1-pentanol, 2-methyl- 19.23 1.05E+04 2-propanone 19.96 1.46E+04 Hexane, 2,3-dimethyl- 20.13 2.88E+04 Benzene, 1,2-dimethyl- 20.64 1.33E+04 2-ethoxyethyl acetate 21.07 1.00E+04 Pyrazine, 2,5-dimethyl- 21.21 3.46E+04 Pyrazine, ethyl- 21.66 1.72E+04 Pyrazine, ethenyl- 21.82 1.65E+04 3-pentanone 21.93 3.31E+05 2-heptanone, 4-methyl- 22.86 1.62E+04 2-isopropylpyrazine 23.39 5.58E+04 2-heptanone, 4,6-dimethyl- 23.55 1.82E+04 Pyrazine, 2-ethyl-6-methyl- 24.02 2.17E+04 Pyrazine, 2-ethenyl-6-methyl- 24.14 1.69E+04 Hexane, 2,3,4-trimethyl- 24.82 3.98E+04 2,5-hexanediol, 2,5-dimethyl- 24.87 4.28E+04 Heptane, 2,3-dimethyl- 25.29 1.22E+04 1-octanol 25.66 5.15E+04 Benzaldehyde, 4-methyl- 25.92 2.42E+04 Benzoic acid, methyl ester 27.49 1.51E+04 2-heptanone, 4-methyl- 28.3 1.32E+04 Benzoic acid, 4-methyl-, methyl ester 31.68 3.21E+04 Diphenyl ether

Figure S1. Metabolic map of S. thermophilus LMG18311, developed with the Simpheny software. For
explanation of the different abbreviations, see Teusink, B., A. Wiersma, D. Molenaar, C. Francke, W. M. de
Vos, R. J. Siezen, and E. J. Smid. 2006. Analysis of growth of Lactobacillus plantarum WCFS1 on a complex
medium using a genome-scale metabolic model. J. Biol. Chem. 281:40041-40048. and Santos, F. 2008. Vitamin
B12 synthesis in Lactobacillus reuteri. PhD thesis Wageningen University.

Chapter 3
80

Chapter 4
Effect of amino acid quantity on the metabolism of three lactic acid
bacteria: a comparative study
Margreet I. Pastink, Bas Teusink , Douwe Molenaar, Willem M. de Vos, Jeroen Hugenholtz
Manuscript in preparation

Chapter 4
82
Abstract
To compare amino acid metabolic pathways of three different lactic acid bacteria,
metabolic and transcriptional analyses were performed. The growth of three well-known
lactic acid bacteria; Streptococcus thermophilus, Lactococcus lactis and Lactobacillus
plantarum, on defined media containing all amino acids was compared with that on media
with a minimum amount of amino acids, that still allowed growth. The global transcriptional
response of each species towards minimal amino acid availability was determined using a
species-specific micro array and data were visualized with the use of genome-scale models.
Metabolic analyses were performed to study the fermentation behavior and the flavor
formation. All three lactic acid bacteria use homolactic fermentation and show a significant
response towards low amounts of amino acids in the medium. This response not only affects
the amino acid metabolism such as flavor formation, tRNA production and amino acid ABC
transporters, but also primary metabolism and overall growth, and stress-related proteins. This
study also showed that the different organisms have different strategies to cope with varying
amounts of amino acids.

Effect of amino acid quantity on metabolism
83
Introduction
A variety of lactic acid bacteria (LAB) are used for industrial dairy fermentations,
such as several species of Lactococcus, Lactobacillus and Streptococcus. The basis for these
fermentations, milk, is a protein-rich environment mainly consisting of caseins, whey proteins
and free amino acids; the most abundant amino acid in milk is glutamic acid (25). Most LAB
have amino acid auxotrophies, therefore the fermenting LAB depend on the available amino
acids in their growth medium. An interesting feature of the amino acid metabolism is the
production of flavor compounds. Most amino acids do not directly influence the product
flavor, but they will contribute indirectly to the typical flavor because they are precursors of
aromatic compounds (39). Flavor formation during fermentation not only depends on the
substrate (15, 16) but also on the species and even strains used. It has been described that S.
thermophilus is less auxotrophic for amino acids than other LAB (7, 29). Strains that require a
few amino acids for growth often have a relatively complete set of amino acid converting
pathways. This also often results in the production of a large variety of amino acid derived
flavors (29).
Several studies have been performed to clear the regulation of the protein metabolism in LAB.
CodY, for instance, is a well-studied transcriptional regulator in gram-positive bacteria (10).
In L. lactis, most of the CodY regulated genes are involved in the proteolytic system,
however, CodY also regulates the transcription of genes involved in the metabolism of amino
acids (11).
In the last years the genomes of many LAB have been sequenced and have become
publicly available (20, 23). These available genomes enable the development of genome-wide
tools such as microarrays (24). Microarrays can be used to study the response of an organism
to a certain condition and the available genome scale metabolic models (27, 37) are used for
visualization of the transcriptional response. Amino acid catabolism and anabolism are
complex processes and, thus, metabolic models will be helpful for their understanding.
Genome-scale metabolic models provide an overview of all metabolic conversions in an
organism, based on its genome sequence, and make it possible to visualize different metabolic
pathways, such as amino acid metabolism (36, 37).

Chapter 4
84
In this study we have compared three different LAB with known genome sequences;
Streptococcus (S.) thermophilus LMG8311 (6), Lactobacillus (Lb.) plantarum WCFS1 (21)
and Lactococcus (L.) lactis MG1363 (38). These strains are all used frequently in the food
industry: as yoghurt starter, as vegetable fermenter and flavor enhancer and as cheese starter
respectively. With this study, we would like to gain more insights in the regulation of amino
acid metabolism. Furthermore, a comparative study can provide extra insights in the
differences and similarities between different strains.
Materials and methods
Bacterial strains, media and growth conditions. The strains used in this study were S.
thermophilus LMG18311 (6), L. lactis MG1363 (38) and Lb. plantarum WCFS1 (21). Cells
were grown in Chemically Defined Medium (CDM) with an excess of amino acids (complete
CDM, Table 1), (22, 28, 30). S. thermophilus was grown at 42°C, L. lactis MG1363 at 30°C
and Lb. plantarum at 37°C. The defined media contain 25 mM glucose. When indicated cells
were grown in CDM with a minimal amount of amino acids (restricted CDM, Table 1) (18,
29, 37)
Batch cultivations. Fermentations were performed in duplicate in 1 L bioreactors (Applikon
Biotechnology BV, The Netherlands). The fermentors were controlled by a Bio Controller
ADI 1010 and by a Bio Console ADI 1025 (Applikon Biotechnology BV, The Netherlands).
Strains were grown overnight in the desired medium and used as an inoculum of 750 ml pH
controlled CDM, the medium was 1% inoculated. During growth, pH was kept constant at
pH=6.0 by the addition of 2.5M NaOH. Cultures were stirred at a constant speed of 100 rpm.
Growth was followed by measuring the cell density at 600 nm. Samples for RNA isolation
were taken at mid-exponential phase, samples for GC-MS analysis (3 ml) were taken at mid-
exponential phase and at stationary phase and samples for HPLC were taken at end-
exponential phase.

Effect of amino acid quantity on metabolism
85
RNA isolation. RNA was isolated, as described elsewhere (34) with a few modifications. At
mid-exponential phase (OD600 of S. thermophilus ~ 0.6, OD600 of L. lactis and Lb. plantarum
~ 1.0) , 25 ml of culture from each fermentor (duplicate samples for both restricted and
complete medium) was immediately pelleted by centrifugation at 14000 rpm for 2 min at
room temperature (Herolab, Unicen MR, Germany). The pellet was frozen rapidly in liquid
nitrogen and stored at -80°C until further use. The frozen pellet was resuspended in 400 μl TE
and transferred to a screw cap tube containing 500 μl phenol-chloroform (5:1), 15 μl 20%
sodium dodecyl sulphate, 30 μl 3M sodium acetate pH 4.8 and 0.6 g zirconium glassbeads.
Cells were disrupted in a Fastprep (Savant, FP120) for 40 sec at 5.0 and the mixture was
centrifuged to remove the beads (13000 rpm, 20 min, 4°C). Subsequently, 500 μl cold
chloroform was added to the supernatant followed by a centrifugation step (13000 rpm, 10
min, 4°C). After centrifugation, 0.5 ml of the aqueous phase was used for RNA extraction
using the High Pure RNA Isolation kit (Roche Diagnostics, Mannheim, Germany), following
the manufacturer’s protocol, except for the DNAse I treatment which we changed to 30 min at
37°C. RNA was eluted in 60 μl of elution buffer (supplied in the kit) and samples were stored
at -80°C.
The concentration of RNA was checked with a ND-1000 spectrophotometer (NanoDrop
Technologies, Inc., USA) and quality was checked using a 2100 Bioanalyzer (Agilent
Technologies, Santa Clara, CA, USA). Only samples with a 23S/16S ratio higher than 1.6
were used for labeling.
cDNA synthesis and labeling. First strand cDNA synthesis from 5 μg RNA was carried out
as described previously (31, 32). Synthesized cDNA was purified and labeled with cyanine 3
and cyanine 5 for all samples. The quality of the labeled cDNA and its concentration were
measured with the ND-1000 spectrophotometer (NanoDrop Technologies, Inc., USA).
Hybridization. Hybridization of the labeled cDNA (0.3 μg per sample) was carried out as
described previously (31, 32) (hybridization scheme in supplementary materials figures S1
and S2). The samples were hybridized on custom designed Agilent Technologies oligo
microarrays, using the Agilent 60-mer oligo microarray processing protocol version 4.1 (31).
The design for the S. thermophilus LMG18311 arrays contains 2 arrays per slide (11K slides)

Chapter 4
86
whereas the design for the arrays of L. lactis MG1363 and Lb. plantarum WCFS1 contain 8
arrays per slide (15K slides).
Scanning and data analysis. Slides were scanned with a ScanArray Express scanner at a
resolution of 10 μm for the S. thermophilus arrays and at 5 μm for the L. lactis and Lb.
plantarum arrays. Data analysis and processing were carried out as described elsewhere (31,
32). Fold change (FC) is defined as 2M where M= 2log (cy5 intensity/cy3 intensity) (32).
Significantly regulated genes were defined as genes whose average p-value is less than 5%
and whose M-value is equal or higher than 1.5.
HPLC and GC-MS analysis. Extracellular metabolites present in the supernatant of
fermentation samples were measured as described elsewhere (35). For the identification of
volatile components in the samples, purge and trap thermal desorption cold trap gas-
chromatography was used as described before (13, 33). The headspace samples were
concentrated on a Fisons MFA815 cold trap (CE Instruments, Milan, Italy), followed by
separation on a GC-8000 top gas chromatograph (CE Instruments) equipped with a CIP-SIL 5
CB low-bleed column (Chrompack, Middelburg, The Netherlands) and detection by a flame
ionization detector.

Effect of amino acid quantity on metabolism
87
Results
Growth and amino acid utilization. The impact of variations in amino acid content of the
growth medium on the gene expression was studied using global transcriptional profiling.
Three different LAB, S. thermophilus, L. lactis and Lb. plantarum were studied and growth
was compared on a complete CDM (surplus of amino acids) with growth on a restricted CDM
(minimal amount of amino acids) (Table 1). These three LAB each have their own
requirements for amino acids and therefore the restricted media are different (Table 1).
Table 1. Composition amino acid mix of CDM for S. thermophilus (22) L. lactis and Lb. plantarum (28, 30). All
amino acids listed in this table are present in the complete CDM whereas only the amino acids presented in bold
are present in the restricted CDM (18, 37) (in the same amounts as in the complete CDM).
Amount (g/l) Amino Acid S. thermophilus L. lactis Lb. plantarum Alanine 0.24 0.24 0.24 Arginine 0.13 0.125 0.125 Aspartic acid 0.46 0.42 0.42 Asparagine 0.35 0.12a Cysteine 0.25 0.13 0.13 Glutamic acid 0.4 0.5 0.5 Glutamine 0.39 0.102a Glycine 0.18 0.175 0.175 Histidine 0.15 0.15 0.15 Isoleucine 0.22 0.21 0.21 Leucine 0.48 0.475 0.475 Lysine 0.44 0.44 0.44 Methionine 0.13 0.125 0.125 Phenylalanine 0.28 0.275 0.275 Proline 0.68 0.675 0.675 Serine 0.34 0.34 0.34 Threonine 0.23 0.225 0.225 Tryptophane 0.5 0.05 0.05 Tyrosine 0.29 0.25 0.25 Valine 0.33 0.325 0.325 aamino acids only present in restricted CDM and not in complete CDM
A summary of growth performance of the three LAB on both restricted and complete medium
is also given (Table 2).

Chapter 4
88
Table 2. Maximum OD600 and growth rate of three LAB - S. thermophilus, L. lactis and Lb. plantarum- during
growth on both complete and restricted medium
Complete medium Restricted medium μmax (h-1) End OD600 μmax (h-1) End OD600 S. thermophilus 0.89 1.2 0.35 0.8 L. lactis 0.78 2.0 0.32 1.1 Lb. plantarum 0.78 2.4 0.42 2.0
S. thermophilus has the highest maximum growth rate, whereas the L. lactis and Lb.
plantarum have a higher final optical density. The growth rate on restricted media is for all
three LAB 50% of the growth rate on complete media. S. thermophilus utilizes all amino
acids partially on complete medium. On restricted medium, all three present amino acids
(histidine, cysteine and glutamic acid) are partially utilized by S. thermophilus.
L. lactis utilizes, partially, all amino acids present on both complete and restricted medium. In
both cases, none of the amino acids is utilized completely. Lb. plantarum utilizes all amino
acids on complete medium in very small amounts. On the restricted defined medium also all
amino acids are utilized (a summary of the data is given in Table 3). On restricted medium, S.
thermophilus and L. lactis utilize twice as low amino acids as on complete medium, whereas
Lb. plantarum does not show this dramatic difference, probably because most amino acids are
present.
Table 3. HPLC analysis the uptake (medium - sample) of most relevant amino acids in the supernatant of
fermentation samples of S. thermophilus, L. lactis and Lb. plantarum grown under batch conditions on complete
and restricted defined medium.
Consumption of Amino acids (μmol/L) Glu Vala Leua Ilea His Cys S. thermophilus complete
medium 94 56 157
restricted medium
629 175 574
L. lactis
complete medium
917 752 903 486
restricted medium
1288 995 1324 651
Lb. plantarum
complete medium
563 239 645 240
restricted medium
1041 513 795 370
a Branched chain amino acids are not present in the restricted medium of S. thermophilus

Effect of amino acid quantity on metabolism
89
Comparative Transcriptome Analysis. The impact of variations in amino acid content of
the growth medium on the gene expression was studied using global transcriptional profiling.
The response on restricted medium was compared with the response on complete medium..
For differential regulation, we selected only those genes that satisfied the following criteria (i)
M ≥ 1.5 in both duplicates (ii) average p-value < 0.05. Within these criteria, we found 61
differentially regulated genes for S. thermophilus (constituting about 3% of the genes), 186
genes for L. lactis (constituting about 7.3% of the genes) and 81 genes for Lb. plantarum
(constituting about 2.6% of the genes)
For S. thermophilus 61 genes are differentially regulated (Table 4) and are visualized (Figure
1) on the recently developed genome-scale model, developed with the SimphenyTM software
package (29, 37). Of these 61 genes, 30 are involved in amino acid metabolism. A striking
observation is that the production of 9 tRNA’s are down-regulated on restricted medium. It
was observed that the biosynthesis of the sulfur amino acids is strongly up-regulated (acetyl
homoserine lyase, 5-methyltetrahydropteroyltriglutamate--homocysteine methyltransferase,
5,10-methylenetetrahydrofolate reductase). Other regulated genes are predicted to encode
proteins involved in growth (e.g. down-regulation of transcriptional regulators), vitamin
metabolism (e.g. up-regulation of molybdopterin and tetrahydrofolate) and hypothetical
proteins.
Table 4. Significant affected genes in S. thermophilus growing on restricted CDM compared to complete CDM.
Average p-value< 0.05 and FC≥1.5 (21.5).
Locus Gene product FC p-value stu_t05 Leu tRNA -2.3 0.0001 stu_t16 Gly tRNA -2.3 0.0000 stu_t06 Thr tRNA -2.2 0.0001 stu_t14 Met tRNA -2.1 0.0001 stu_t02 Val tRNA -2.0 0.0001 stu_t08 Leu tRNA -1.9 0.0005 stu_t09 Arg tRNA -1.9 0.0002 stu1568 rheA ATP-dependent RNA helicase -1.9 0.0000 stu0585 hypothetical protein stu0585 -1.8 0.0001 stu_t15 Phe tRNA -1.7 0.0002 stu_t04 Lys tRNA -1.7 0.0000 stu0838 cspB cold shock protein B -1.7 0.0001
stu1996 Conserved hypothetical, predicted membrane protein (TMS3) -1.6 0.0014
stu0586 hypothetical protein stu0586 -1.6 0.0001

Chapter 4
90
stu1338 xanthine phosphoribosyltransferase -1.5 0.0007 stu0297 ABC transporter substrate binding protein 1.5 0.0001
stu1438 amiF1 oligopeptide ABC uptake transporter ATP-binding protein 1.5 0.0001
stu1268 citB aconitate hydratase 1.6 0.0004 stu1965 amiE acetyltransferase, GNAT family 1.6 0.0001
stu1439 oligopeptide ABC uptake transporter ATP-binding protein 1.6 0.0001
stu0876 polar amino acid ABC uptake transporter ATP-binding protein 1.6 0.0001
stu0291 ABC transporter substrate binding protein 1.7 0.0001 stu0304 hypothetical protein stu0304 1.7 0.0001 stu2018 trpS tryptophanyl-tRNA synthetase 1.7 0.0001 stu1964 hypothetical protein stu1964 1.7 0.0001
stu0296 polar amino acid ABC uptake transporter substrate binding protein 1.7 0.0001
stu0987 cysD O-acetylhomoserine sulfhydrylase 1.7 0.0002 stu1386 hypothetical protein stu1386 1.7 0.0296 stu0452 transcriptional regulator, LysR family 1.8 0.0002
stu1389 resistance to homoserine/threonine (RhtB) family protein 1.8 0.0002
stu1963 nrdD anaerobic ribonucleoside triphosphate reductase 1.8 0.0000
stu0353 aminotransferase (class II) 1.8 0.0001
stu1492 polar amino acid ABC uptake transporter substrate binding protein 2.0 0.0000
stu1838 hipO3 aminoacylase/N-acyl-L-amino acid amidohydrolase/hippurate hydrolase 2.0 0.0001
stu0352 metB1 cystathionine gamma-synthase 2.2 0.0000
stu0605 polar amino acid ABC uptake transporter membrane-spanning protein 2.3 0.0000
stu1388 hypothetical protein stu1388 2.4 0.0000 stu1594 hypothetical protein stu1594 3.0 0.0000 stu1493 hypothetical protein stu1493 3.6 0.0000 stu1593 trpE anthranilate synthase component I 3.6 0.0000 stu1812 argH argininosuccinate lyase 3.9 0.0000 stu0786 metF 5,10-methylenetetrahydrofolate reductase 4.0 0.0000 stu0334 hypothetical protein stu0334 4.5 0.0000 stu0603 argF ornithine carbamoyltransferase 4.5 0.0001
stu0785 metE 5-methyltetrahydropteroyltriglutamate--homocysteine methyltransferase 4.6 0.0000
stu1592 trpG anthranilate synthase component II 4.9 0.0000
stu1495 polar amino acid ABC uptake transporter substrate binding protein 4.9 0.0000
stu1494 polar amino acid ABC uptake transporter substrate binding protein 4.9 0.0001
stu1591 trpD anthranilate phosphoribosyltransferase 5.0 0.0000 stu1590 trpC indole-3-glycerol-phosphate synthase 5.1 0.0000 stu1589 trpF N-(5'-phosphoribosyl)anthranilate isomerase 5.1 0.0000 stu1587 trpA tryptophan synthase subunit alpha 5.3 0.0000 stu1813 argG argininosuccinate synthase 5.4 0.0000 stu1588 trpB tryptophan synthase subunit beta 5.4 0.0000 stu0467 argD acetylornithine aminotransferase 5.5 0.0000

Effect of amino acid quantity on metabolism
91
stu0464 argC N-acetyl-gamma-glutamyl-phosphate reductase 5.7 0.0000
stu0466 argB acetylglutamate kinase 5.9 0.0000
stu0465 argJ bifunctional ornithine acetyltransferase/N-acetylglutamate synthase protein 6.0 0.0000
stu0547 ABC transporter membrane-spanning protein 6.0 0.0000
stu0545 molybdopterin biosynthesis protein (HesA/MoeB/ThiF family protein), putative 6.2 0.0000
stu0546 ABC transporter ATP binding protein 6.2 0.0000
Figure 1. Visualization of amino acid biosynthesis in S. thermophilus obtained by projecting significantly
affected genes (Average p-value< 0.05 and FC≥1.5 (21.5). Red signifies up-regulation (>21.5), green down-
regulation (<21.5) and yellow signifies differently expressed by less than 21.5 on restricted medium. Blank
pathways indicate that those associated genes were not significantly regulated. All abbreviations are explained in
the supplementary material of Teusink et al (37)

Chapter 4
92
In comparison with S. thermophilus, three times more genes (186 versus 61) are
differentially regulated in L. lactis (Figure 2 and Table 5, end of chapter), in spite of a similar
size of their genomes (17, 38) . Some of the regulated genes (20) are predicted to be involved
in the amino acid metabolism, like the up-regulated genes involved in arginine metabolism on
the restricted medium compared to complete medium. On restricted medium, CodZ is up-
regulated, this transcriptional regulator belongs to the CodY family. As mentioned in the
introduction, CodY may regulate the transcription of genes involved in amino acid
metabolism. Closer analysis of the transcriptome data showed a down-regulation of the
transcriptional repressor CodY. This finding was not found with the set criteria and is
therefore not included in table 5. Other affected genes on the restricted medium compared to
complete medium are predicted to encode proteins involved in growth (e.g. down-regulation
of purine and pyrimidine metabolism, up-regulation of transcriptional regulators), primary
metabolism (e.g. down-regulation of pyruvate formate lyase) vitamin metabolism (up-
regulation of riboflavin biosynthesis, down-regulation of tetrahydrofolate), polysaccharide
metabolism (down-regulation of transport of sucrose and mannose) and hypothetical proteins.
Table 5. Significant affected genes in L. lactis growing on restricted CDM compared to complete CDM.
Average p-value< 0.05 and FC≥1.5 (21.5).
Locus Gene Product FC p- value
llmg_0974 purS phosphoribosylformylglycinamidine synthetase PurS -9.4 0.0014
llmg_0975 purQ phosphoribosylformylglycinamidine synthase I -9.3 0.0033
llmg_0976 purL phosphoribosylformylglycinamidine synthase II -8.6 0.0019
llmg_0977 purF amidophosphoribosyltransferase -8.5 0.0067
llmg_0973 purC phosphoribosylaminoimidazole-succinocarboxamide synthase -8.4 0.0021
llmg_0994 purH bifunctional phosphoribosylaminoimidazolecarboxamide formyltransferase/IMP cyclohydrolase -7.6 0.0006
llmg_0997 purD phosphoribosylamine--glycine ligase -7.2 0.0022
llmg - putative hydrolase -6.7 0.0015
llmg_0999 purE phosphoribosylaminoimidazole carboxylase catalytic subunit -6.4 0.0007
llmg_0313 phnC phosphonates import ATP-binding protein phnC -6.3 0.0012
llmg_1000 purK phosphoribosylaminoimidazole carboxylase ATPase subunit -6.2 0.0005
llmg_0312 phnD phosphonate ABC transporter, phosphonate-binding protein phnD -6.0 0.0003
llmg_0315 - Phosphonate ABC transporter permease protein -5.4 0.0038
llmg_0314 phnB phosphonate transport system permease protein phnB -5.4 0.0008
llmg_0988 purN phosphoribosylglycinamide formyltransferase -5.3 0.0019

Effect of amino acid quantity on metabolism
93
llmg_0987 purM phosphoribosylaminoimidazole synthetase -5.1 0.0003
llmg_0316 cpdC 2',3'-cyclic-nucleotide 2'-phosphodiesterase -5.1 0.0010
llmg - hypothetical protein -4.7 0.0002
llmg_0502 - ABC transporter permease protein -4.1 0.0003
llmg_0910 amtB ammonium transporter AmtB -4.0 0.0001
llmg_0501 - ABC transporter ATP-binding protein -3.9 0.0003
llmg - putative secreted protein -3.8 0.0003
llmg_0911 glnB nitrogen regulatory protein P-II -3.7 0.0001
llmg_0643 pacL cation-transporting ATPase, E1-E2 family -3.6 0.0073
llmg_2485 glnR glutamine synthetase repressor -3.6 0.0015
llmg_1913 pbuO Xanthine/uracil/vitamin C permease -3.6 0.0002
llmg - hypothetical protein -3.5 0.0004
llmg_0281 - anaerobic ribonucleoside triphosphate reductase -3.3 0.0001
llmg_2484 glnA GlnA protein -3.1 0.0006
llmg_1106 pyrDB PyrDB protein -3.0 0.0026
llmg_0893 pyrB aspartate carbamoyltransferase catalytic subunit -3.0 0.0009
llmg_0891 pyrP uracil permease (Uracil transporter) -3.0 0.0006
llmg_0335 plpA D-methionine-binding lipoprotein plpA precursor -2.9 0.0004
llmg_1107 pyrF orotidine 5'-phosphate decarboxylase -2.8 0.0002
llmg_0890 pyrR pyrimidine regulatory protein PyrR -2.8 0.0008
llmg_0563 glyA serine hydroxymethyltransferase -2.8 0.0003
llmg_1345 pbuX Xanthine/uracil permease -2.8 0.0008
llmg_0795 ps306 hypothetical protein -2.8 0.0101
llmg_0336 plpB D-methionine-binding lipoprotein plpB precursor -2.8 0.0015
llmg_1346 xpt xanthine phosphoribosyltransferase -2.8 0.0002
llmg - hypothetical protein -2.8 0.0341
llmg - hypothetical protein -2.7 0.0004
llmg_0894 carA carbamoyl phosphate synthase small subunit -2.7 0.0015
llmg_0338 plpC D-methionine-binding lipoprotein plpC precursor -2.7 0.0078
llmg - hypothetical protein -2.6 0.0001
llmg_1105 pyrK dihydroorotate dehydrogenase, electron transfer subunit -2.6 0.0001
llmg_0282 nrdG anaerobic ribonucleoside-triphosphate reductase activating protein -2.5 0.0002
llmg - hypothetical protein -2.5 0.0017
llmg_1089 carB carbamoyl phosphate synthase large subunit -2.4 0.0010
llmg_1692 xseA exodeoxyribonuclease VII large subunit -2.4 0.0002
llmg_0796 ps307 hypothetical protein -2.4 0.0187
llmg_0339 dar acetoin(diacetyl)reductase -2.4 0.0006
llmg_0629 pfl formate acetyltransferase -2.3 0.0004
llmg_1691 xseB exodeoxyribonuclease VII, small subunit -2.2 0.0127
llmg - hypothetical protein -2.2 0.0003
llmg_0630 coaE dephospho-CoA kinase -2.2 0.0011
llmg_1155 - spx-like protein -2.2 0.0008

Chapter 4
94
llmg - hypothetical protein -2.1 0.0100
llmg_0340 plpD D-methionine-binding lipoprotein plpD precursor -2.1 0.0014
llmg - hypothetical protein -2.1 0.0056
llmg_1541 nrdH Glutaredoxin-like protein nrdH -2.1 0.0024
llmg - hypothetical protein -2.0 0.0016
llmg_1115 - XpaC-like protein -2.0 0.0004
llmg - transcriptional regulator, LacI family -2.0 0.0097
llmg_0838 ps344 hypothetical protein -2.0 0.0271
llmg_0995 - hydrolase, haloacid dehalogenase-like family protein -2.0 0.0006
llmg_2201 purA adenylosuccinate synthetase -2.0 0.0013
llmg_1693 folD methylenetetrahydrofolate dehydrogenase (NADP+) / methenyltetrahydrofolate cyclohydrolase -2.0 0.0002
llmg_1412 guaC guanosine 5'-monophosphate oxidoreductase -2.0 0.0023
llmg_0803 ps313 putative transcription regulator -2.0 0.0391
llmg_1543 nrdE ribonucleotide-diphosphate reductase subunit alpha -2.0 0.0031
llmg_0839 ps345 hypothetical protein -1.9 0.0331
llmg_2367 rpsH 30S ribosomal protein S8 -1.9 0.0147
llmg_2310 arcC1 carbamate kinase -1.9 0.0077
llmg_0225 rfbX Putative O-antigen transporter -1.8 0.0009
llmg - putative secreted protein -1.8 0.0132
llmg_1542 nrdI ribonucleotide reductase stimulatory protein -1.7 0.0022
llmg - hypothetical protein -1.7 0.0234
llmg_0447 nifJ NifJ protein -1.7 0.0013
llmg_1508 pyrC dihydroorotase -1.7 0.0021
llmg_0341 - amino acid ABC transporter ATP binding protein -1.6 0.0048
llmg_2390 rpmG 50S ribosomal protein L33 -1.6 0.0036
llmg_0332 - putative biotin synthesis protein -1.6 0.0014
llmg_0127 ptsI phosphoenolpyruvate-protein phosphotransferase -1.6 0.0047
llmg_0607 apt adenine phosphoribosyltransferase -1.6 0.0036
llmg - hypothetical protein -1.6 0.0044
llmg_0222 wefC hypothetical protein -1.6 0.0013
llmg_2277 rplK 50S ribosomal protein L11 -1.6 0.0033
llmg_2366 rplF 50S ribosomal protein L6 -1.6 0.0121
llmg_0783 purB adenylosuccinate lyase -1.5 0.0007
llmg_0456 pgmB beta-phosphoglucomutase 1.5 0.0053
llmg - hypothetical protein 1.5 0.0014
llmg - hypothetical protein 1.5 0.0004
llmg_1331 thrB homoserine kinase 1.5 0.0015
llmg_1297 hisZ HisZ protein 1.5 0.0010
llmg - putative secreted protein 1.5 0.0439
llmg_1298 hisC histidinol-phosphate aminotransferase 1.5 0.0006
llmg - hypothetical protein 1.6 0.0011
llmg - putative secreted protein 1.6 0.0008

Effect of amino acid quantity on metabolism
95
llmg - hypothetical protein 1.6 0.0009
llmg_1662 uspA universal stress protein A 1.6 0.0016
llmg - hypothetical protein 1.6 0.0107
llmg_2143 - putative 20-kDa protein 1.6 0.0002
llmg - putative secreted protein 1.6 0.0003
llmg - putative secreted protein 1.6 0.0003
llmg - hypothetical protein 1.6 0.0017
llmg - hypothetical protein 1.6 0.0005
llmg - hypothetical protein 1.6 0.0002
llmg - putative transcriptional regulator 1.6 0.0192
llmg - hypothetical protein 1.6 0.0006
llmg_1594 - Gamma-glutamyl-diamino acid-endopeptidase 1.6 0.0275
llmg_0200 feoA ferrous iron transport protein A 1.6 0.0003
llmg - putative secreted protein 1.6 0.0022
llmg - putative secreted protein 1.7 0.0497
llmg_0160 - Oxygen-insensitive NAD(P)H nitroreductase 1.7 0.0008
llmg_1531 ribB riboflavin synthase subunit alpha 1.7 0.0034
llmg_1847 cspA cold shock-like protein cspA 1.7 0.0164
llmg_0080 osmC osmotically inducible protein C 1.7 0.0201
llmg_1801 srtC Sortase SrtC 1.7 0.0069
llmg - putative secreted protein 1.8 0.0010
llmg - hypothetical protein 1.8 0.0004
llmg_2025 oppC2 oligopeptide transport system permease protein oppC2 1.8 0.0455
llmg_1767 rdrA transcriptional regulator, DeoR family 1.8 0.0105
llmg - putative secreted protein 1.8 0.0052
llmg_0349 fhuD ferrichrome ABC transporter substrate binding protein 1.8 0.0007
llmg - putative methyltransferase 1.8 0.0006
llmg_1449 srtA Sortase SrtA 1.8 0.0007
llmg - Putative ABC transporter ATP-binding protein 1.8 0.0004
llmg_1449 thrA aspartate kinase 1.8 0.0017
llmg - hypothetical protein 1.8 0.0076
llmg_1983 codZ transcriptional regulator, CodY family 1.9 0.0041
llmg - hypothetical protein 1.9 0.0007
llmg_1490 mntH putative proton-dependent manganese transporter group C beta 1.9 0.0015
llmg_1725 trmU tRNA (5-methylaminomethyl-2-thiouridylate)-methyltransferase 1.9 0.0003
llmg_0346 fhuC ferrichrome ABC transporter fhuC 1.9 0.0015
llmg - putative transcriptional regulator 1.9 0.0013
llmg - hypothetical protein 1.9 0.0252
llmg_1552 - putative ABC type transport system permease protein 1.9 0.0007
llmg - hypothetical protein 2.0 0.0003
llmg_0874 dapA dihydrodipicolinate synthase 2.0 0.0002
llmg - hypothetical protein 2.0 0.0005

Chapter 4
96
llmg - hypothetical protein 2.0 0.0045
llmg - hypothetical protein 2.0 0.0018
llmg - transcriptional regulator 2.0 0.0388
llmg_1724 rpsA 30S ribosomal protein S1 2.1 0.0015
llmg_2477 - lysine specific permease 2.1 0.0005
llmg_1570 fruR transcriptional regulator of the fructose operon 2.1 0.0053
llmg - putative acetyltransferase 2.1 0.0024
llmg - hypothetical protein 2.2 0.0341
llmg_2026 oppB2 peptide transport system permease protein oppB2 2.2 0.0006
llmg_1530 ribA riboflavin biosynthesis protein ribA 2.2 0.0062
llmg_1661 hslB HU-like DNA-binding protein 2.3 0.0011
llmg_1514 rex redox-sensing transcriptional repressor Rex 2.3 0.0008
llmg - hypothetical protein 2.4 0.0005
llmg - hypothetical protein 2.5 0.0016
llmg_1850 qor quinone oxidoreductase 2.5 0.0003
llmg_1979 gltP glutamate ABC transporter permease protein 2.5 0.0002
llmg - cell wall surface anchor family protein 2.5 0.0002
llmg_1031 trpG anthranilate synthase component II 2.6 0.0015
llmg_1019 - oxidoreductase, short-chain dehydrogenase/reductase family protein 2.6 0.0001
llmg_2011 - putative amino acid permease 2.7 0.0009
llmg_1978 gltQ glutamate ABC transporter ATP-binding protein 2.7 0.0008
llmg_2024 oppA2 Oligopeptide-binding protein oppA2 precursor 2.9 0.0008
llmg - hypothetical protein 2.9 0.0002
llmg - Putative Transcriptional regulator 3.0 0.0001
llmg_1045 bglP similar to PTS system, beta-glucosides specific enzyme IIABC 3.0 0.0467
llmg_0530 gapA glyceraldehyde 3-phosphate dehydrogenase 3.1 0.0201
llmg - cell wall surface anchor family protein 3.3 0.0064
llmg_1032 trpD anthranilate phosphoribosyltransferase 3.4 0.0006
llmg_1037 - putative lyase 4.2 0.0004
llmg - hypothetical protein 4.2 0.0005
llmg - hypothetical protein 4.7 0.0002
llmg_1038 trpC indole-3-glycerol-phosphate synthase 4.7 0.0003
llmg - acetyltransferase, GNAT family 4.9 0.0003
llmg_0138 argG ArgG protein 4.9 0.0001
llmg_1039 trpF N-(5'-phosphoribosyl)-anthranilate isomerase 5.1 0.0001
llmg_0139 argH ArgH protein 5.5 0.0001
llmg_0535 gltS Arginine-binding periplasmic protein 1 precursor 5.6 0.0001
llmg_1041 trpB tryptophan synthase subunit beta 5.6 0.0007
llmg_0536 argE acetylornithine deacetylase 5.9 0.0001
llmg_1042 trpA tryptophan synthase subunit alpha 6.8 0.0001
llmg_1755 argB ArgB protein 8.3 0.0002
llmg_1754 argF ArgF protein 8.8 0.0001

Effect of amino acid quantity on metabolism
97
llmg_1757 argJ bifunctional ornithine acetyltransferase/N-acetylglutamate synthase protein 9.0 0.0003
llmg_1756 argD acetylornithine aminotransferase 9.2 0.0002
llmg_1758 argC N-acetyl-gamma-glutamyl-phosphate reductase 9.4 0.0002
Figure 2. Visualization of amino acid biosynthesis in L. lactis obtained by projecting significantly affected genes
(Average p-value< 0.05 and FC≥1.5 (21.5). Red signifies up-regulation (>21.5), green down-regulation (<21.5) and
yellow signifies differently expressed by less than 21.5 on restricted medium. Blank pathways indicate that those
associated genes were not significantly regulated. All abbreviations are explained in the supplementary material
of Teusink et al (37).

Chapter 4
98
The transcriptome analysis of Lb. plantarum shows that 81 genes are differentially
regulated (restricted medium compared to complete medium) of which 10 are predicted to be
involved in amino acid metabolism (Figure 3 and Table 6). Some genes involved in the amino
acid metabolism are both up-regulated, like those involved in the histidine biosynthesis
pathway, and some are down-regulated, like those encoding the glutamate dehydrogenase and
different amino acid transporters. Other affected genes are predicted to encode proteins
involved, primary metabolism (e.g. up-regulation of pyruvate oxidase and NADH oxidase),
vitamin metabolism (down-regulation of tetrahydrofolate metabolism), stress related genes
(up-regulation of transport of betaine, glycine and carnitine, prophage) and hypothetical
proteins. NADH oxidase and pyruvate oxidase may have a role in maintaining the redox
balance (via NADH). In contrast to what was found for S. thermophilus, the sulfur amino
acids (acetyl homoserine lyase, 5-methyltetrahydropteroyltriglutamate--homocysteine
methyltransferase, 5,10-methylenetetrahydrofolate reductase) are not differentially regulated
in either L. lactis or Lb. plantarum.
Table 6. Significant affected genes in Lb. plantarum growing on restricted CDM compared to complete CDM.
Average p-value< 0.05 and FC≥1.5 (21.5).
Locus Gene Product FC P-value
lp_2721 purN phosphoribosylglycinamide formyltransferase -3.7 0.0006
lp_2723 purF amidophosphoribosyltransferase precursor -3.4 0.0007
lp_2720 purH
bifunctional protein: phosphoribosylaminoimidazolecarboxamide formyltransferase; IMP cyclohydrolase -3.4 0.0003
lp_2774 ABC transporter, ATP-binding protein -3.0 0.0013
lp_2773 ABC transporter, permease protein -2.8 0.0010
lp_1118 mleS malolactic enzyme -2.2 0.0049
lp_0226 gnp glucosamine-6-phosphate isomerase -2.2 0.0012
lp_3015 extracellular protein -2.2 0.0022
lp_1169 gdh glutamate dehydrogenase (NAD(P)+) -2.2 0.0010
lp_0872 gph1 phosphoglycolate phosphatase (putative) -2.1 0.0028
lp_0928 unknown -2.0 0.0003
lp_0513 unknown -2.0 0.0005
lp_2375 glyA glycine hydroxymethyltransferase -2.0 0.0010
lp_0929 asp1 alkaline shock protein -1.9 0.0003
lp_1119 mleP2 malate transport protein -1.9 0.0118
lp_0926 integral membrane protein -1.9 0.0007
lp_2475 prophage P2b protein 6 -1.9 0.0433
lp_2696 integral membrane protein -1.8 0.0019

Effect of amino acid quantity on metabolism
99
lp_3128 stress induced DNA binding protein -1.8 0.0005
lp_3548 pts35A galacitol PTS, EIIA -1.8 0.0013
lp_0242 ndk nucleoside-diphosphate kinase -1.7 0.0169
lp_0349 amtB ammonium transport protein -1.7 0.0088
lp_0172 transcription regulator -1.6 0.0188
lp_2374 upp uracil phosphoribosyltransferase -1.6 0.0039
lp_2766 unknown -1.6 0.0007
lp_1261 oppA oligopeptide ABC transporter, substrate binding protein -1.6 0.0008
lp_0737 ribosomal protein S30EA -1.6 0.0008
lp_3396 unknown -1.5 0.0390
lp_0154 unknown -1.5 0.0152
lp_3334 adeC adenine deaminase 1.5 0.0134
lp_3466 brnQ3 branched-chain amino acid transport protein 1.5 0.0009
lp_3338 nha2 Na(+)/H(+) antiporter 1.5 0.0044
lp_3682 thdF thiophene and furan oxidation protein ThdF 1.5 0.0005
lp_2216 rpsN2 ribosomal protein S14-2 1.5 0.0008
lp_1078 rpsI ribosomal protein S9 1.6 0.0027
lp_2240 amino acid transport protein 1.6 0.0003
lp_2893 ABC transporter, ATP-binding and permease protein 1.6 0.0007
lp_3337 unknown 1.6 0.0010
lp_0280 transport protein 1.6 0.0330
lp_0311 acetyltransferase (putative) 1.6 0.0010
lp_2039 rbfA ribosome-binding factor A 1.6 0.0006
lp_2952 unknown 1.6 0.0007
lp_0830 transport protein, N-terminal fragment 1.6 0.0003
lp_2789 transport protein 1.6 0.0004
lp_0132 transport protein 1.6 0.0025
lp_3413 cell surface protein precursor 1.7 0.0028
lp_3512 pbg8 6-phospho-beta-glucosidase 1.7 0.0167
lp_3100 oxidoreductase 1.7 0.0013
lp_3279 kup2 potassium uptake protein 1.7 0.0005
lp_3324 glycine betaine/carnitine/choline transport protein 1.8 0.0013
lp_2550 maa1 maltose O-acetyltransferase 1.8 0.0011
lp_1637 unknown 1.8 0.0002
lp_0783 ABC transporter, substrate binding protein 1.8 0.0010
lp_2953 esterase (putative) 1.8 0.0004
lp_0831 transport protein, C-terminal fragment 1.9 0.0025
lp_3681 gidA cell division protein GidA 1.9 0.0070
lp_0984 unknown 1.9 0.0005
lp_2629 pox3 pyruvate oxidase 2.0 0.0103
lp_3414 extracellular protein 2.0 0.0002
lp_1721 4-aminobutyrate aminotransferase 2.1 0.0003

Chapter 4
100
lp_3666 2-oxo-hept-3-ene-1,7-dioate hydratase; 2-oxo-hept-4-ene-1,7-dioate hydratase 2.1 0.0003
lp_2788 panE2 2-dehydropantoate 2-reductase 2.1 0.0001
lp_1722 amino acid transport protein 2.1 0.0001
lp_0082 oxidoreductase 2.2 0.0005
lp_3449 nox5 NADH oxidase 2.3 0.0004
lp_2768 transport protein 2.3 0.0019
lp_0200 ABC transporter, substrate binding protein 2.4 0.0033
lp_2160 unknown 2.6 0.0016
lp_p1_02 2.6 0.0022
lp_0201 ABC transporter, substrate binding proteins 2.8 0.0001
lp_1521 oxidoreductase 2.9 0.0021
lp_0350 hicD1 L-2-hydroxyisocaproate dehydrogenase 3.0 0.0035
lp_1008 lysP lysine transport protein 4.3 0.0000
lp_2557 hisH imidazole glycerol phosphate synthase, amidotransferase sununit 5.6 0.0000
lp_2558 hisB bifunctional protein: histidinol-phosphatase; imidazoleglycerol-phosphate dehydratase 5.6 0.0001
lp_2559 hisD histidinol dehydrogenase 6.0 0.0000
lp_2313 glnQ4 glutamine ABC transporter, ATP-binding protein 6.5 0.0000
lp_2312 glnH2 glutamine ABC transporter, substrate binding protein 6.5 0.0000
lp_2314 glnP2 glutamine ABC transporter, permease protein 6.6 0.0000
lp_2560 hisG ATP phosphoribosyltransferase 6.7 0.0000
lp_2561 hisX histidine--tRNA ligase (putative) 7.1 0.0001

Effect of amino acid quantity on metabolism
101
Figure 3. Visualization of amino acid biosynthesis in Lb. plantarum obtained by projecting significantly affected
genes (Average p-value< 0.05 and FC≥1.5 (21.5). Red signifies up-regulation (>21.5), green down-regulation
(<21.5) and yellow signifies differently expressed by less than 21.5 on restricted medium. Blank pathways indicate
that those associated genes were not significantly regulated. All abbreviations are explained in the supplementary
material of Teusink et al (37).
The transcriptome analysis showed that in all three LAB amino acid metabolism is
affected during growth on restricted medium. However, in S. thermophilus around 50% of the
significantly affected genes is involved in amino acid metabolism, whereas the other two
bacteria show a more general response towards amino acid depletion. S. thermophilus has a
more extensive amino acid metabolism than the other two LAB. The complex amino acid
metabolism in S. thermophilus faces a simple, non flexible primary metabolism. Therefore it
seems logical that the amino acid metabolism, in S. thermophilus, is more affected by a
different growth environment than the primary metabolism. The metabolism of
tetrahydrofolate is also affected in all three LAB, the formation of tetrahydrofolate can play a
role in producing precursors for the purine metabolism (12).

Chapter 4
102
Metabolic analysis. Supernatant of samples taken at different points during exponential
growth of all three LAB (growth characteristics in Table 2) were analyzed by HPLC. Glucose
and fermentation products such as lactate, acetate, formate, ethanol, pyruvate, acetoin and
succinate were analyzed (Table 7).
Table 7. HPLC analysis of supernatant of fermentation samples of S. thermophilus, L. lactis and Lb. plantarum
grown under batch conditions on complete and restricted defined medium. Samples were taken at the end of
exponential phase.
Metabolite mMa
Cit
rate
Eth
anol
Pyr
uvat
e
Lac
tic
acid
For
mic
aci
d
Ace
tic a
cid
Ace
toin
Succ
inat
e
Glu
cose
S. thermophilus Blanc 2.28 n.d. n.d. n.d. n.d. 13.73 n.d. n.d. 24.64
complete CDM Sample 2.16 n.d. n.d. 31.50 1.67 14.46 0.57 0.17 6.33
S. thermophilus Blanc 2.45 n.d. n.d. n.d. n.d. 13.01 n.d. n.d. 25.53
restricted CDM Sample 1.76 n.d. 0.28 32.39 0.95 11.13 0.47 0.24 n.d.
L. lactis Blanc 2.18 n.d. n.d. n.d. n.d. 13.37 n.d. n.d. 28.66
complete CDM Sample 1.69 0.30 0.15 34.75 1.43 10.81 n.d. 0.50 n.d.
L. lactis Blanc 2.33 n.d. n.d. n.d. n.d. 12.93 n.d. 0.07 25.63
restricted CDM Sample 2.14 n.d. n.d. 32.62 0.42 13.22 n.d. 0.78 0.90
Lb. plantarum Blanc 2.28 n.d. n.d. n.d. n.d. 12.94 n.d. n.d. 19.83
complete CDM Sample 1.39 n.d. 0.82 35.97 0.82 10.16 n.d. 0.25 n.d.
Lb. plantarum Blanc 1.85 n.d. n.d. n.d. n.d. 12.91 n.d. n.d. 21.82
restricted CDM Sample 1.51 n.d. 0.31 34.11 n.d. 9.12 n.d. 0.06 n.d. a Average of 4 duplicates, N.D. not detected.
Under both complete and restricted conditions, homolactic growth is observed for S.
thermophilus and Lb. plantarum. L. lactis also grows using homolactic fermentation, but on
complete medium, more formate is produced than on the restricted medium and this
corresponds with the down-regulation of pyruvate formate lyase on restricted medium. GC-
MS measurements also show the accompanying formation of ethanol and acetaldehyde.
The headspace of the different fermentation samples was analyzed using GC-MS. Samples
were taken at mid-exponential phase and at stationary phase, the identified volatiles (of which
some of them are also flavors) are summarized (Figures 4 -5).

Effect of amino acid quantity on metabolism
103
0.00E+00
2.00E+08
4.00E+08
6.00E+08
8.00E+08
1.00E+09
1.20E+09
1.40E+09
empt
y vial
blanc
STU co
mple
te
mid-
exp
STU com
plete
stat S
TU com
plete
blanc
STU re
strict
ed
mid-
exp
STU restr
icted
stat S
TU restr
icted
blanc
LLA
com
plete
mid-
exp
LLA co
mple
te
stat L
LA co
mple
te
blanc
LLA
restr
icted
mid-
exp
LLA re
strict
ed
stat L
LA re
strict
ed
blanc
LPL
com
plete
mid-
exp
LPL
com
plete
stat L
PL co
mple
te
blanc
LPL
restr
icted
mid-
exp
LPL
restr
icted
stat L
PL re
strict
ed
rela
tive
peak
are
a
acetaldehyde
Figure 4. Identified acetaldehyde profiles in the different fermentation samples. STU means S. thermophilus,
LLA means L. lactis and LPL means Lb. plantarum.
0.00E+00
1.00E+08
2.00E+08
3.00E+08
4.00E+08
5.00E+08
6.00E+08
7.00E+08
8.00E+08
empt
y vial
blanc
STU co
mple
te
mid-
exp
STU com
plete
stat S
TU com
plete
blanc
STU re
strict
ed
mid-
exp
STU restr
icted
stat S
TU restr
icted
blanc
LLA
com
plete
mid-
exp
LLA co
mple
te
stat L
LA co
mple
te
blanc
LLA
restr
icted
mid-
exp
LLA re
strict
ed
stat L
LA re
strict
ed
blanc
LPL
com
plete
mid-
exp
LPL
com
plete
stat L
PL co
mple
te
blanc
LPL
restr
icted
mid-
exp
LPL
restr
icted
stat L
PL re
strict
ed
rela
tive
area
ethanol
diacetyl
2-butanone
Figure 5. Identified volatiles (ethanol, diacetyl, 2-butanone) in the different fermentation samples. STU means S.
thermophilus, LLA means L. lactis and LPL means Lb. plantarum.

Chapter 4
104
Acetaldehyde was identified in all samples; all three LAB can produce this flavor compound
on both restricted and complete CDM. However, the bacteria produce more acetaldehyde on
complete medium than on restricted medium. It was described that S. thermophilus can
produce acetaldehyde during threonine catabolism (9), the large decrease of the threonine
concentration during growth, as measured by HPLC, indeed points to utilization of threonine
for other purposes than protein biosynthesis. The expression of the gene encoding threonine
aldolase does not differ on restricted and complete CDM, indicating that the gene is
constitutively expressed in S. thermophilus. L. lactis and Lb. plantarum probably produce
acetaldehyde from pyruvate in primary metabolism; ethanol dehydrogenase can convert
acetaldehyde into ethanol.
When L. lactis grows on complete medium, large amounts of ethanol are produced. Ethanol is
probably produced during primary metabolism, corresponding with the formation of formate
and increased production of acetaldehyde under these conditions. Butanone is produced by L.
lactis growing on restricted medium.
Diacetyl is identified in all samples. Diacetyl is produced by primary metabolism when
pyruvate is converted to diacetyl via acetolactate. Especially S. thermophilus produces large
amounts of diacetyl on the restricted medium. Closer analysis of the transcriptome data
showed an up-regulation of acetolactate synthase. This finding was not found with the set
criteria and is therefore not included in table 4. But the up-regulation of acetolactate synthase
is certainly interesting and may explain the increased diacetyl formation on restricted
medium. Acetolactate synthase also plays a role in the synthesis of the branched chain amino
acids via feedback inhibition.

Effect of amino acid quantity on metabolism
105
Discussion
In this study we demonstrated the effect of a restriction of amino acids in the growth
medium of different LAB. This amino acid depletion not only influences the growth behavior
of these organisms but also the overall cellular response and flavor formation. To study this
effect of amino acids in the medium, we compared growth of S. thermophilus, L. lactis and
Lb. plantarum on medium with a surplus of amino acids versus growth on medium with a
minimal amount of amino acids. This comparative study provides new insights in amino acid
metabolism of different organisms, such as the different strategies to cope with a depletion of
amino acids.
Microarrays were used to study the cellular response towards a minimal amount of
amino acids. A total of 61 significantly regulated genes were found for S. thermophilus.
Especially the metabolism of the sulfur-containing amino acids was strongly regulated; this
might have important effects on the flavor formation. A striking observation is that the
production of 9 tRNA’s are down-regulated on restricted medium. It has been described for E.
coli that the concentration of tRNA’s decreases in mid-exponential phase, then stays at a
constant level, and decreases as the cell reaches stationary phase. The stagnation of synthesis
of tRNA supports theories about tRNA being the rate-limiting factor in the translation (1).
Cells growing on the restricted medium have a much longer mid-exponential phase and this
can influence the level of tRNA. Furthermore, experimental data showed that the amino acids
that these tRNA’s transfer (Leu, Gly, Thr, Met, Val, Leu, Arg, Phe, Lys) are not necessary for
growth, as was described in our previous paper (29). Also some other groups of genes were
affected by the depletion of amino acids, such as those involved in vitamin metabolism.
HPLC analysis showed that S. thermophilus performs homolactic fermentation on both
restricted and complete media. This was observed and described before (17), and is expected
because S. thermophilus has a simple primary metabolism with no other options than to form
lactate.
S. thermophilus is able to produce a variety of flavors (29). However, these are mainly
produced on complete medium. Most flavors originate from amino acid metabolism (39).
Since only three amino acids are present in the restricted medium, less amino acid degradation
pathways are active under these conditions. The microarray data indicated a strong regulation
of the sulfur amino acids biosynthesis pathways (acetyl homoserine lyase, 5-

Chapter 4
106
methyltetrahydropteroyltriglutamate--homocysteine methyltransferase, 5,10-
methylenetetrahydrofolate reductase). The HPLC data suggest that a large amount of the
present cysteine (methionine is not present in the restricted medium) is consumed by S.
thermophilus.
The global transcriptional analysis of L. lactis showed that 186 genes were
significantly regulated in the restricted medium compared to the complete medium. For L.
lactis, the response to amino acid depletion is more general and also affects other parts of the
metabolism like primary metabolism, purine and pyrimidine pathways and transcriptional
factors. Metabolite analysis showed that on restricted medium as well as on complete medium
all amino acids present are consumed, although the consumption is higher on complete
medium. None of the amino acids is completely consumed. The HPLC measurements showed
that L. lactis performs homolactic fermentation, but on complete medium L. lactis also forms
formate, ethanol and acetaldehyde besides lactate. Alanine, (synthesized in one step from
pyruvate) allosterically inhibits pyruvate kinase, to signal that building blocks are abundant
(5). The restricted medium of L. lactis does not contain alanine. Strikingly is the production of
2-butanone by L. lactis growing on the restricted medium. Pathways leading to butanone are
common among LAB (19), but these pathways are only operated if there is a surplus in the
cell relative to the need for NAD+ regeneration (4). Both L. lactis and S. thermophilus show
an up-regulation of the arginine operon during growth on restricted medium. Arginine
metabolism plays an important role in LAB, not only for supply of the necessary amount of
arginine, but also in energy regeneration and pH regulation (2, 3, 8, 26). In addition, arginine
may stimulate growth and may give protection against stress. The restricted media of L. lactis
and S. thermophilus do not contain arginine, whereas the restricted medium of Lb. plantarum
still contains arginine, so regulation of the arginine genes cannot be expected in this
bacterium.
The microarray studies of Lb. plantarum showed 81 differentially regulated genes.
Most of the affected genes are not involved in amino acid metabolism but in primary
metabolism, stress related genes or related to growth. HPLC analyses showed that on
complete medium as well as on restricted medium, Lb. plantarum performs homolactic
fermentation. Both L. lactis and Lb. plantarum can usually perform homolactic fermentation
at high dilution rates and mixed acid fermentation at low dilution rates (14, 37). The

Effect of amino acid quantity on metabolism
107
homolactic route is catalytically more efficient and seems to be preferred under these
conditions above the energetically more efficient mixed acid fermentation. Of the three LAB
studied in this project, Lb. plantarum has the highest degree of amino acid auxotrophy,
needing at least 11 amino acids. On both complete and restricted medium, all amino acids
present are consumed, and these consumptions are similar. Cysteine is also completely
consumed during growth on the restricted medium.
When the response of the three LAB towards the depletion of amino acids was
compared, we observed that not only the amino acid metabolism is affected but also other
parts of the metabolism, growth and in some cases even stress related genes. Obviously, the
three LAB have different strategies to cope with a depletion of amino acids. S. thermophilus
has a simple primary metabolism and a complex amino acid metabolism. A large part of the
affected genes is involved in amino acid metabolism, in contrast to what was found for the
other two LAB. The primary metabolism is not very flexible due to the presence of
pseudogenes and the amino acid metabolism is quite complete and flexible. The other two
LAB, L. lactis and Lb. plantarum have a more flexible primary metabolism in comparison to
S. thermophilus. They show a more general response than S. thermophilus, since not only
amino acid metabolism, but also other parts of the metabolism are affected by the depletion of
amino acids. Lb. plantarum and especially L. lactis, show a down-regulation of the purine and
pyrimidine metabolism. This response is growth-related and was not found for S.
thermophilus. Apparently, when S. thermophilus grows at a lower growth rate, it responds in
another way by f.i. downregulation of tRNA-genes. On restricted medium, less volatile
compounds (some volatiles are flavors) are formed than on the complete medium by all three
LAB because most flavors are generated during amino acid metabolism. Of the three studied
LAB, L. lactis is probably most adapted to the protein-rich milk environment and this
bacterium also shows the largest response (relatively most differentially regulated genes)
towards amino acid depletion.
Overall these data show that not only amino acid metabolism is affected by a depletion (or
surplus) of amino acids, but also overall metabolism is affected. This study also showed that
different LAB have different strategies to cope with a depletion of amino acids. Even though
these organisms are closely related, they have their own unique requirements and their own
response.

Chapter 4
108
Acknowledgements: We thank Marjo Starrenburg and Bert van de Bunt for their excellent
technical assistance. The authors also would like to thank Roelie Holleman and Jan van Riel
for the HPLC and GC-MS analyses.

Effect of amino acid quantity on metabolism
109
References
1. Arfvidsson, C., and K. G. Wahlund. 2003. Time-minimized determination of
ribosome and tRNA levels in bacterial cells using flow field-flow fractionation. Anal
Biochem 313:76-85.
2. Arioli, S., C. Monnet, S. Guglielmetti, and D. Mora. 2009. Carbamoylphosphate
synthetase activity is essential for the optimal growth of Streptococcus thermophilus
in milk. J Appl Microbiol.
3. Arioli, S., P. Roncada, A. M. Salzano, F. Deriu, S. Corona, S. Guglielmetti, L.
Bonizzi, A. Scaloni, and D. Mora. 2009. The Relevance of Carbon Dioxide
Metabolism in Streptococcus thermophilus. Microbiology.
4. Banks, J. M., M. Yvon, J. C. Gripon, M. A. de la Fuente, E. Y. Brechany, A. G.
Williams, and D. D. Muir. 2001. Enhancement of amino acid metabolism in Cheddar
cheese using a-ketoglutarate: amino acid degradation in relation to volatile compounds
and aroma character. Int Dairy J 11:235-243.
5. Berg, J. M., J. L. Tymoczko, and L. Stryer. 2002. Biochemistry.
6. Bolotin, A., B. Quinquis, P. Renault, A. Sorokin, S. D. Ehrlich, S. Kulakauskas,
A. Lapidus, E. Goltsman, M. Mazur, G. D. Pusch, M. Fonstein, R. Overbeek, N.
Kyprides, B. Purnelle, D. Prozzi, K. Ngui, D. Masuy, F. Hancy, S. Burteau, M.
Boutry, J. Delcour, A. Goffeau, and P. Hols. 2004. Complete sequence and
comparative genome analysis of the dairy bacterium Streptococcus thermophilus. Nat
Biotechnol 22:1554-1558.
7. Bracquart, P., and D. Lorient. 1979. Effet des acides amines et peptides sur la
croissance de Streptococcus thermophilus III. Peptides comportant Glu, His et met.
Milchwissenschaft 34:676-679.
8. Bringel, F., L. Frey, S. Boivin, and J. C. Hubert. 1997. Arginine biosynthesis and
regulation in Lactobacillus plantarum: the carA gene and the argCJBDF cluster are
divergently transcribed. Journal of Bacteriology 179:2697-2706.
9. Chaves, A. C., M. Fernandez, A. L. Lerayer, I. Mierau, M. Kleerebezem, and J.
Hugenholtz. 2002. Metabolic engineering of acetaldehyde production by
Streptococcus thermophilus. Appl Environ Microbiol 68:5656-5662.

Chapter 4
110
10. den Hengst, C. D., P. Curley, R. Larsen, G. Buist, A. Nauta, D. van Sinderen, O.
P. Kuipers, and J. Kok. 2005. Probing direct interactions between CodY and the
oppD promoter of Lactococcus lactis. Journal of Bacteriology 187:512-521.
11. den Hengst, C. D., M. Groeneveld, O. P. Kuipers, and J. Kok. 2006. Identification
and functional characterization of the Lactococcus lactis CodY-regulated branched-
chain amino acid permease BcaP (CtrA). Journal of Bacteriology 188:3280-3289.
12. Derzelle, S., A. Bolotin, M. Y. Mistou, and F. Rul. 2005. Proteome analysis of
Streptococcus thermophilus grown in milk reveals pyruvate formate-lyase as the major
upregulated protein. Appl Environ Microbiol 71:8597-8605.
13. Engels, W. J. M., and S. Visser. 1996. Development of cheese flavour from peptides
and amino acids by cell-free extracts of Lactococcus lactis subsp. cremoris B78 in a
model system. Neth. Milk Dairy J. 50:3-17.
14. Garrigues, C., P. Loubiere, N. D. Lindley, and M. Cocaign-Bousquet. 1997.
Control of the shift from homolactic acid to mixed-acid fermentation in Lactococcus
lactis: predominant role of the NADH/NAD+ ratio. J. Bacteriol. 179:5282-5287.
15. Guedon, E., P. Renault, S. D. Ehrlich, and C. Delorme. 2001. Transcriptional
pattern of genes coding for the proteolytic system of Lactococcus lactis and evidence
for coordinated regulation of key enzymes by peptide supply. J Bacteriol 183:3614-
3622.
16. Guedon, E., P. Serror, S. D. Ehrlich, P. Renault, and C. Delorme. 2001.
Pleiotropic transcriptional repressor CodY senses the intracellular pool of branched-
chain amino acids in Lactococcus lactis. Mol Microbiol 40:1227-1239.
17. Hols, P., F. Hancy, L. Fontaine, B. Grossiord, D. Prozzi, N. Leblond-Bourget, B.
Decaris, A. Bolotin, C. Delorme, S. Dusko Ehrlich, E. Guedon, V. Monnet, P.
Renault, and M. Kleerebezem. 2005. New insights in the molecular biology and
physiology of Streptococcus thermophilus revealed by comparative genomics. FEMS
Microbiol. Rev. 29:435-463.
18. Jensen, P. R., and K. Hammer. 1993. Minimal Requirements for Exponential
Growth of Lactococcus lactis. Appl Environ Microbiol 59:4363-4366.
19. Kandler, O. 1983. Carbohydrate metabolism in lactic acid bacteria. Antonie Van
Leeuwenhoek 49:209-224.

Effect of amino acid quantity on metabolism
111
20. Klaenhammer, T., E. Altermann, F. Arigoni, A. Bolotin, F. Breidt, J. Broadbent,
R. Cano, S. Chaillou, J. Deutscher, M. Gasson, M. van de Guchte, J. Guzzo, A.
Hartke, T. Hawkins, P. Hols, R. Hutkins, M. Kleerebezem, J. Kok, O. Kuipers,
M. Lubbers, E. Maguin, L. McKay, D. Mills, A. Nauta, R. Overbeek, H. Pel, D.
Pridmore, M. Saier, D. van Sinderen, A. Sorokin, J. Steele, D. O'Sullivan, W. de
Vos, B. Weimer, M. Zagorec, and R. Siezen. 2002. Discovering lactic acid bacteria
by genomics. Antonie Van Leeuwenhoek 82:29-58.
21. Kleerebezem, M., J. Boekhorst, R. van Kranenburg, D. Molenaar, O. P. Kuipers,
R. Leer, R. Tarchini, S. A. Peters, H. M. Sandbrink, M. W. Fiers, W. Stiekema,
R. M. Lankhorst, P. A. Bron, S. M. Hoffer, M. N. Groot, R. Kerkhoven, M. de
Vries, B. Ursing, W. M. de Vos, and R. J. Siezen. 2003. Complete genome sequence
of Lactobacillus plantarum WCFS1. Proc Natl Acad Sci U S A 100:1990-1995.
22. Letort, C., and V. Juillard. 2001. Development of a minimal chemically-defined
medium for the exponential growth of Streptococcus thermophilus. J Appl Microbiol
91:1023-1029.
23. Liu, M., F. H. van Enckevort, and R. J. Siezen. 2005. Genome update: lactic acid
bacteria genome sequencing is booming. Microbiology 151:3811-3814.
24. Molenaar, D., F. Bringel, F. H. Schuren, W. M. de Vos, R. J. Siezen, and M.
Kleerebezem. 2005. Exploring Lactobacillus plantarum genome diversity by using
microarrays. J Bacteriol 187:6119-6127.
25. NDC. 2000. National Dairy Council.
26. Nicoloff, H., F. Arsene-Ploetze, C. Malandain, M. Kleerebezem, and F. Bringel.
2004. Two arginine repressors regulate arginine biosynthesis in Lactobacillus
plantarum. Journal of Bacteriology 186:6059-6069.
27. Notebaart, R. A., F. H. van Enckevort, C. Francke, R. J. Siezen, and B. Teusink.
2006. Accelerating the reconstruction of genome-scale metabolic networks. BMC
Bioinformatics 7:296.
28. Otto, R., B. Ten Brink, H. Veldkamp, and W. N. Konings. 1983. The relation
between growth rate and electrochemical proton gradient of Streptococcus cremoris.
FEMS Microbiol Lett 16:69-74.

Chapter 4
112
29. Pastink, M. I., B. Teusink, P. Hols, S. Visser, W. M. de Vos, and J. Hugenholtz.
2009. Metabolic comparison of lactic acid bacteria; genome-scale model of
Streptococcus thermophilus LMG18311. Appl Environ Microbiol 75:3627-3633.
30. Poolman, B., and W. N. Konings. 1988. Relation of growth of Streptococcus lactis
and Streptococcus cremoris to amino acid transport. J Bacteriol 170:700-707.
31. Saulnier, D. M., D. Molenaar, W. M. de Vos, G. R. Gibson, and S. Kolida. 2007.
Identification of prebiotic fructooligosaccharide metabolism in Lactobacillus
plantarum WCFS1 through microarrays. Appl Environ Microbiol 73:1753-1765.
32. Serrano, L. M., D. Molenaar, M. Wels, B. Teusink, P. A. Bron, W. M. de Vos, and
E. J. Smid. 2007. Thioredoxin reductase is a key factor in the oxidative stress
response of Lactobacillus plantarum WCFS1. Microb Cell Fact 6:29.
33. Smit, B. A., W. J. Engels, J. T. Wouters, and G. Smit. 2004. Diversity of L-leucine
catabolism in various microorganisms involved in dairy fermentations, and
identification of the rate-controlling step in the formation of the potent flavour
component 3-methylbutanal. Appl Microbiol Biotechnol 64:396-402.
34. Sperandio, B., P. Polard, D. S. Ehrlich, P. Renault, and E. Guedon. 2005. Sulfur
amino acid metabolism and its control in Lactococcus lactis IL1403. J Bacteriol
187:3762-3778.
35. Starrenburg, M. J., and J. Hugenholtz. 1991. Citrate Fermentation by Lactococcus
and Leuconostoc spp. Appl Environ Microbiol 57:3535-3540.
36. Teusink, B., and E. J. Smid. 2006. Modelling strategies for the industrial exploitation
of lactic acid bacteria. Nat Rev Microbiol 4:46-56.
37. Teusink, B., A. Wiersma, D. Molenaar, C. Francke, W. M. de Vos, R. J. Siezen,
and E. J. Smid. 2006. Analysis of growth of Lactobacillus plantarum WCFS1 on a
complex medium using a genome-scale metabolic model. J Biol Chem 281:40041-
40048.
38. Wegmann, U., M. O'Connell-Motherway, A. Zomer, G. Buist, C. Shearman, C.
Canchaya, M. Ventura, A. Goesmann, M. J. Gasson, O. P. Kuipers, D. van
Sinderen, and J. Kok. 2007. Complete genome sequence of the prototype lactic acid
bacterium Lactococcus lactis subsp. cremoris MG1363. J Bacteriol 189:3256-3270.

Effect of amino acid quantity on metabolism
113
39. Yvon, M., S. Thirouin, L. Rijnen, D. Fromentier, and J. C. Gripon. 1997. An
aminotransferase from Lactococcus lactis initiates conversion of amino acids to
cheese flavor compounds. Appl Environ Microbiol 63:414-419.

Chapter 4
114
Supplementary materials
Figure S1. Schematic design of the hybridization scheme that was used for the micro array experiments of S.
thermophilus in this study. Each arrow represents one hybridization; the arrows point from the samples labeled
with cy3 to samples labeled with cy5. A and B refer to samples from duplicate fermentations.
Figure S2. Schematic design of the hybridization scheme that was used for the micro array experiments of L.
lactis and Lb. plantarum.in this study. Each arrow represents one hybridization; the arrows point from the
samples labeled with cy3 to samples labeled with cy5. A and B refer to samples from duplicate fermentations.

Chapter 5
The role of glutamate dehydrogenase in Streptococcus thermophilus
Margreet I. Pastink, Nicolas A. L. Flahaut, Anne Wiersma, Marjo Starrenburg, Sacha van
Hijum, Bas Teusink, Willem M. de Vos, Jeroen Hugenholtz, Laetitia Fontaine
Manuscript in preparation

Chapter 5
116
Abstract
The lactic acid bacterium Streptococcus thermophilus does not have a complete pentose
phosphate pathway. Since this pathway is generally important in the generation of NADPH,
this bacterium will need to have alternative pathway(s) for the generation of this important
reduced co-factor. Comparative genomics showed that most streptococci do not possess a
complete pentose phosphate pathway. In this report we describe the search for alternative
NADPH producing pathways. One of the alternatives can be glutamate dehydrogenase
(encoded by the gdhA gene), and a knock-out of the corresponding gene was made. Gene
transcription and fermentation behavior of this mutant were compared with the wild-type. The
gdhA knock-out displayed production of acetaldehyde, consumption of citrate and increased
consumption of amino acids. Microarray data showed an up-regulation of the citrate pathway,
some amino acid biosynthesis pathways, and the purine metabolism for the gdhA knock-out
compared to the wild-type. This clear effect was not found for the control organism
Lactobacillus plantarum.

gdhA mutation in S. thermophilus
117
Introduction
Streptococcus thermophilus is one of the most important Lactic Acid Bacteria (LAB) for the
food industry. It is used for the production of Italian and Swiss cheeses, using elevated
cookingtemperatures and in co-cultivation with Lactobacillus delbrueckii subsp. bulgaricus
for the production of yoghurt (11).
As was described in our previous paper, S. thermophilus LMG18311 (6, 11) has a
relatively simple primary metabolism. The number of pyruvate branches is limited; therefore
the only possible route under anaerobic conditions is the homolactic pathway. Another
striking feature of this strain is the low degree of amino acid auxotrophies; it only needs
histidine and cysteine in the presence of citrate or glutamate for (minimal) growth.
Furthermore, S. thermophilus is able to produce a varied amount of flavors. These findings
indicate the presence of most amino acid biosynthesis and converting pathways (19).
However, Streptococcus (S.) thermophilus LMG18311 (6, 11) is predicted, based on the
genome, not to have a complete pentose phosphate pathway. The pentose phosphate pathway
meets the need of all organisms for a source of NADPH to use in reductive biosynthesis. Most
LAB possess a complete pentose phosphate pathway. Since all living organisms need
NADPH, S. thermophilus needs alternative pathways to synthesize NADPH.
The goal of this paper is to find out which pathways are used by S. thermophilus for
NADPH generation. The available genome-scale model of S. thermophilus was used (19) and
the model initially predicts glutamate dehydrogenase as most likely enzyme. We constructed a
knock-out of the gdhA gene (encoding for glutamate dehydrogenase) and analyzed the mutant
by growth experiments, fermentation behavior and on transcriptional level. As a reference, we
used a gdhA mutant of the well-studied homofermentative LAB, Lactobacillus plantarum,
which does contain the pentose phosphate pathway.
Materials and Methods
Bacterial strains, media and growth conditions. The strains used in this study were
Streptococcus (S.) thermophilus LMG18311 (5), Lactococcus (L.) lactis MG1363(25) and
Lactobacillus (Lb.) plantarum WCFS1 (13). Cells were grown anaerobically. L. lactis and S.
thermophilus were grown in M17 broth (Difco, Detroit, MI, USA), supplemented with

Chapter 5
118
glucose (GM17) to a final concentration of 1% (wt/vol) at 30°C and 42°C respectively. S.
thermophilus ΔgdhA was grown in the presence of chloramphenicol (10μg/ml). Lb. plantarum
was grown in Mann Rogosa Sharpe (MRS) broth (Merck, Whitehouse Station, NY, USA)
supplemented with glucose to a final concentration of 1% (wt/vol) at 37°C. Escherichia coli
DH5α (27) was used for one enzymatic assay and was cultivated aerobically at 37°C on TYB
medium (Difco).
For the fermentation experiment, cells were grown on chemically defined medium (CDM)
(16).
Glutamate dehydrogenase (gdhA) activity. Cultures of Lb. plantarum, L. lactis MG1363
(negative control) and S. thermophilus (both wild-type and gdhA knock-out) were grown until
OD600~1. Cultures were centrifuged and washed twice (4°C, 5000 rpm, 15 min) in 50mM β-
glycerophosphate (pH 7). After the second washing step, pellets were concentrated in the
same buffer to OD600~200/ml. Cell disruption by beat-beating (4x30 sec, speed 4.0, Fastprep
FP120) was followed by removal of the cell debris by centrifugation (13000 rpm, 10 min,
4°C, Eppendorf Centrifuge 5417R). Because the gdhA assay is sensitive for background
noise, cell free extracts were purified on a slide-a-lizer (Pierce, Rokcford, IL, USA) and were
dialyzed in 50 mM β-glycerophosphate (pH 7) at 4°C overnight. Cell free extracts were
removed from the slide-a-lizer using a syringe and were immediately used for measurements
of the enzyme activity.
gdhA activity was assayed with the colorimetric glutamate assay (Boehringer, Mannheim,
Germany, Cat. No. 10 139 092 035). Reaction mixtures were incubated at 37°C and contained
50mM potassium phosphate/TEA buffer pH 9 (solution 1, kit), 1.76 U/ml diaphorase+NAD
(solution 2, kit), 2 mM INT (solution 3, kit), 100 mM glutamate, 13.8 mM NADP+ or NAD+
and cell free extract. The formation of NADPH was followed spectrophotometrically by
monitoring the increase of absorbance at 492 nm.
Glucose-6-phosphate dehydrogenase (G6PDH) activity. Cultures of Lb. plantarum
(positive control) and S. thermophilus were grown until OD600~1. Cultures were centrifuged
and washed (5000 rpm, 15 min, 4°C) in a Megafuge 1.0R (Heraeus Instruments, Germany) in
55 mM Tris/HCl buffer (pH 7.8). After the second washing step, pellets were concentrated in

gdhA mutation in S. thermophilus
119
1 ml 55 mM Tris/HCl buffer (pH 7.8) and beat-beated (4x30 sec, speed 4.0, Fastprep FP120)
and centrifuged (13000 rpm, 10 min, 4°C, Eppendorf Centrifuge 5417R). G6PDH activity
was assayed as described by Honjoh (12). Reaction mixtures were incubated at 25°C and
contained 55mM Tris/HCl buffer (pH 7.8), 3.3 mM MgCl2, 0.2 mM NADP+ and 3.3 mM
glucose-6-phosphate and cell free extract. The formation of NADPH or NADH was followed
spectrophotometrically by monitoring the increase of absorbance at 340 nm.
Isocitrate dehydrogenase (ICDH) activity. Cultures of E. coli DH5α (used as a positive
control) (8) and S. thermophilus (wild-type and gdhA mutant) were grown until OD600∼1.
Cells were harvested by centrifugation (5000 rpm, 15 min, 4°C) and washed twice in 35 mM
Tris/HCL buffer (pH 7.5). Cell pellet was concentrated in 1 ml 35 mM Tris/HCL buffer (pH
7.5) and beat-beated (4x30 sec, speed 4.0, Fastprep FP120). ICDH activity was assayed as
described by Cvitkovitch et al (8). Reaction mixtures were incubated at 37°C and contained
35mM Tris/HCl buffer (pH 7.5), 5 mM isocitrate, 3.5 mM MgCl2 or MnCl2, 0.35 mM NADP+
and cell free extract. The formation of NADPH was followed spectrophotometrically by
monitoring the increase of absorbance at 340 nm.
Construction of gdhA knock-out for S. thermophilus. Molecular cloning techniques were
carried out in accordance with standard laboratory procedures (20). The wild-type strain S.
thermophilus LMG18311 was used for the construction of a mutant lacking a functional gdhA
gene (ΔgdhA) using natural transformation of an overlapping PCR product as described by
Blomqvist et al (4).
Construction of gdhA / glnA knock-out for Lb. plantarum. In Lb. plantarum, a double
knock-out of both gdhA and glnA (glutamine synthetase) has been constructed following the
strategy described before (10). Both genes were inactivated by single cross-over using suicide
plasmids (pGIM008 and pJDC9) with insertion of an internal fragment of gene around 600bp.
The adjunction of erythromycin and chloramphenicol assure the stability of the insert. This
mutant is functionally the same as the S. thermophilus gdhA mutant.

Chapter 5
120
Batch cultivations. Fermentations were performed in duplicate in 1 L bioreactors (Applikon
Biotechnology BV, The Netherlands). The fermentations were controlled by a Bio Controller
ADI 1010 and by a Bio Console ADI 1025 (Applikon Biotechnology BV, The Netherlands).
S. thermophilus wild-type and ΔgdhA were grown overnight in CDM and used as an inoculum
of 1000 ml pH controlled CDM, the medium was 1% inoculated. The medium for the gdhA
knock-out was supplemented with chloramphenicol (10μg/ml). Strains were grown at 42°C,
during growth pH was kept constant at pH=6.5, by the addition of 2.5M NaOH.
Lb. plantarum wild-type and ΔgdhA were grown overnight in CDM and used as an inoculum
of 1000 ml pH controlled CDM, the medium was 1% inoculated. The medium for the gdhA
knock-out was supplemented with chloramphenicol (10μg/ml) and erythromycin (10μg/ml).
Strains were grown at 37°C, during growth pH was kept constant at pH=5.5, by the addition
of 2.5M NaOH.
Cultures were stirred at a constant speed of 100 rpm. Growth was followed by measuring the
cell density at 600 nm every 30 min. Samples for HPLC and RNA isolation (2x25 ml) were
taken at the end of exponential phase. Samples for GC-MS analysis (3 ml) were taken at mid-
exponential phase and at stationary phase.
Analysis of genome-wide mRNA transcription levels. All the procedures, from RNA
isolation to hybridization were performed as described in our previous paper. The
hybridization scheme is shown in the supplementary materials (Figure S1). Selection of scan
intensity, normalization, scaling, Cyber-T and False Discovery Rate (FDR) was performed as
described elsewhere (3). In order to describe more subtle differential expressions in the
microarray data that do not pass the single gene fdr criterion, a geometric mean of the FDRs
of multiple genes was calculated provided that they adhered to the following criteria: (i) genes
are part of the same operon, (ii) they exhibit similar differential expressions (e.g. all up-
expressed in gdhA mutant), (iii) they are involved in the subsequent metabolic conversions
(thus part of the same metabolic pathway).
With these criteria, we found 2 different pathways consisting of co-expressed genes that for
each pathway were organized in an operon (citrate pathway and competence genes).

gdhA mutation in S. thermophilus
121
Comparative genomics. The ERGO bioinformatics suite
(http://ergo.integratedgenomics.com/ERGO/) was used to compare S. thermophilus with other
sequenced LAB on genome level. In particular the presence of the pentose phosphate pathway
was tested and compared among the available 53 LAB genomes.
Ammonia measurement. The concentration of ammonia in the supernatant of fermentation
samples was determined using the UV method from an Ammonia kit (R-biopharm AG,
Darmstadt, Germany)
Protein concentration. The concentration of protein in the cell free extracts was determined
using the bicinchoninic acid protein assay reagent (Pierce, Rockford, Il. USA) (22).
Metabolic analysis. For the identification of volatile components in the samples, purge and
trap thermal desorption cold trap gas-chromatography was used as described before (9, 21).
The headspace samples were concentrated on a Fisons MFA815 cold trap (CE Instruments,
Milan, Italy), followed by separation on a GC-8000 top gas chromatograph (CE Instruments)
equipped with a CIP-SIL 5 CB low-bleed column (Chrompack, Middelburg, The
Netherlands) and detection by a flame ionization detector.
Extracellular metabolites present in the supernatant of fermentation samples were measured as
described elsewhere (23).

Chapter 5
122
Results
Prediction of NADPH generation and construction of a gdhA knock-out. As was
described in the introduction, we used the previously developed genome-scale model of S.
thermophilus (19) to search for NADPH generating pathways. S. thermophilus is predicted
not to have a complete pentose phosphate pathway and cannot generate NADPH via this
pathway. The model predicted that isocitrate dehydrogenase or glutamate dehydrogenase
might be possible NADPH producing enzymes. The pathways where these enzymes code for,
are connected via α-ketoglutarate, an important biological compound. The model predictions
were tested experimentally by assaying enzyme activities. Also, the predicted absence of the
PPP was verified by measuring the activity of the first enzyme of the PPP; glucose-6-
phosphate dehydrogenase.
Cell free extracts of Lb. plantarum and S. thermophilus were assayed for G6PDH
activity. Lb. plantarum was used as positive control, since it is known that this strain has a
complete pentose phosphate pathway. The enzymatic assay indeed showed that Lb. plantarum
has G6PDH activity and S. thermophilus does not have G6PDH activity (Table 1).
Cell free extracts of Lb. plantarum, L. lactis and S. thermophilus wild-type and ΔgdhA were
assayed for GDH activity. L. lactis was used as negative control. Lb. plantarum and wild-type
S. thermophilus possess GDH activity (Table 1). As expected, the gdhA knock-out does not
have GDH activity.
Table 1. Activities of different enzymes tested in this study. Note that not all organisms were included in every
assay.
Strain GDHA activitya
G6PDH activitya
ICDH activity a
S. thermophilus LMG18311 5.76 0 0 S. thermophilus ΔgdhA 0 -b 10.2 Lb. plantarum WCFS1 0.94 9.5 0 Lb. plantarum ΔgdhA 0 7.8 0 E. coli DH5α - - 371.4 a Enzyme activity expressed as 1 nmol NADPH (min⋅ mg protein)-1, average of two duplicates. b -, not done.

gdhA mutation in S. thermophilus
123
Cell free extracts of S. thermophilus wild-type and ΔgdhA and E. coli DH5α were
assayed for isocitrate dehydrogenase activity. E. coli was used as positive control and indeed
has ICDH activity. The ICDH of E. coli is a key regulatory enzyme in the TCA cycle and
therefore a high activity of this enzyme is observed. ICDH activity is not observed for the
wild-type of S. thermophilus), whereas the gdhA mutant has ICDH activity (Table 1).
Based on this knowledge and on the observation that the wild-type of S. thermophilus can
utilize glutamate (24), a glutamate dehydrogenase mutant was constructed, using natural
transformation of an overlapping PCR product as described by Blomqvist et al. (4). The gdhA
open reading frame was swapped by the P32-cat cassette conferring resistance to
chloramphenicol. The primers used in this study are listed in Table 2 and all PCR reactions
were performed with the Fhusion polymerase (New England Biolabs Inc, Ipswich, MA,
USA).
Table 2. Primers used in this study for construction of the gdhA knock-out in S. thermophilus
Primer Name Sequencea
UpDelgdhA1
ATATATACCTTAGTGACCGTTGAGTTGGTGTCTGC
Primers to amplify the upstream region of gdhA on chromosomal DNA UpDelgdhA2
CCTTATGGGATTTATCTTCCTTAAGCAACGTATTCTTTACC
Upcat
TAAGGAAGATAAATCCCATAAGG
Primers to amplify theP32-cat cassette on pNZ5320 Dncat
TTCACGTTACTAAAGGGAATGTA
DnDelgdhA1
TACATTCCCTTTAGTAACGTGAAATGTCAGCTCAAGGTATT
Primers to amplify the downstream region of gdhA on chromosomal DNA
DnDelgdhA2
ACGTCTTGAGCCTTCTTTTTGCCTAAGTCTGTCAG
a Bold and underlined sequences are complementary
The upstream and downstream recombination fragments (1.5 kb) of gdhA were amplified by
PCR using UpDelgdhA1/UpDelgdhA2 and DnDelgdhA1/DnDelgdhA1 primer pairs,
respectively. The P32-cat cassette from pNZ5320 (a derivative of pNZ5318, removal of lp291
fragment) (14) was amplified by PCR using Upcat and Dncat primers. The 3 overlapping
PCR products were mixed in equimolar concentration, joined together by PCR using primers

Chapter 5
124
UpDelgdhA1/ DnDelgdhA2, and the PCR mix was then used for natural transformation. The
mutant genotype was confirmed by PCR with primers located upstream and downstream of
the recombination regions. As a control, we used a pentose phosphate pathway positive LAB,
Lb. plantarum, for which a similar gdhA mutation was constructed. The primers used for the
construction of this mutant are listed in Table 3.
Table 3. Primers used in this study for construction of the gdhA/glnA knock-out in Lb. plantarum
Primer Name Sequence
Gdh1up
CCGTTAATCTGAGTATCGTC Primers to amplify the upstream region of gdh on chromosomal DNA moveR
TCAATCAAAGCAACACGTGCT
Gdh_Nco_up
CATGCCATGGCGGTGGTAAAGGGGGCTC Primers to amplify internal fragment on pGIM008 (cmR) Gdh_Sac_down
CCAGAGCTCTTGGCTTGATCACCGCTG
Gdh2dw
ACCATATAGCAAGCTGGCAG Primers to amplify the downstream region of gdh on chromosomal DNA
Move1
TTTATCGATTACAGCTCCAAG
glnA1up ATCAACTTGGTTGATCATGC Primers to amplify the upstream region of glnA on chromosomal DNA FP CGCCCGGGTTTTCCCAGTCAC
gln_Bam_up CGCGGATCCAACGACCGAATTGAATG Primers to amplify internal fragment on pJDC9 (EryR) gln_Eco_down CCGGAATTCAAGAACCGCTGCAAAG
glnA2dw CATCTTCATCCATAACATAG Primers to amplify the downstream region of gdh on chromosomal DNA
RP_24mer AGCGGATAACAATTTCACACAGGA
Metabolic response. Fermentation samples were analyzed on HPLC (Table 4). The wild-type
shows homolactic growth, as was observed and described before (11). The gdhA mutant also
mainly produces lactate and small amounts of formate, and it consumes citrate. Less glucose
is consumed by the mutant than by the wild-type, at the same growth rate, this may indicate a
more efficient growth.

gdhA mutation in S. thermophilus
125
Table 4. HPLC analyses of fermentation cell supernatants. S. thermophilus and Lb. plantarum were grown on
CDM; samples were taken at the end of the exponential growth phase
Metabolite (mM)a Citrate Lactate Formate Acetate Ethanol Glucose S.thermophilus CDM (blanc) 2.08 ND ND 11.07 ND 24.31
Wild-type
2.13 27.62 0.66 12.26 ND 8.74
gdhA knock-out
1.19 23.44 1.50 12.73 ND 12.61
Lb. plantarum CDM (blanc) 2.20 ND 0.65 9.61 ND 28.33
Wild-type
0.82 16.21 0.00 4.25 ND 0.00
gdhA knock-out
0.91 17.50 0.00 4.51 ND 0.12
a Average of 2 duplicates, N.D. not detected.
The volatile profiles are similar for the two strains (Figure 1); however the gdhA mutant
produces more acetaldehyde than the wild-type.
volatiles produced
0
10000
20000
30000
40000
50000
60000
70000
acet
aldeh
yde
met
hane
thiol
2-m
ethy
lprop
anal
2-bu
tano
ne
3-m
ethy
lbuta
nal
2-m
ethy
lbuta
nal
DMDS
3-m
ethy
l-2-b
uten
al
2-he
ptan
one
met
hiona
l
hept
anal
benz
aldeh
yde
DMTS
2-no
nano
ne
2-un
deca
none
acet
one
diace
tyl
ethy
lacet
ate
rela
tive
area
blanc
average wildtype
average knock-out
Figure 1. GC-MS analyses of the headspace of fermentation samples. S. thermophilus was grown on CDM,
samples were taken at the end of the exponential growth phase (OD600~1.3).

Chapter 5
126
The gdhA also consumes more threonine, and this can point to acetaldehyde production from
threonine conversion by threonine aldolase. Also, the gdhA mutant produces more propanone
than the wild-type does, propanone can be formed as part of glycolysis. Some aldehydes such
as 2-methylpropanal and 3-methylbutanal are found in increased concentrations in samples
from the gdhA mutant. These aldehydes are produced during valine and leucine metabolism
respectively and HPLC data indeed show increased consumption of the branched chain amino
acids by the mutant compared to the wild-type.
HPLC analyses of amino acids in the same samples (Table 5) shows that all amino acids are
more consumed by the gdhA mutant than by the wild-type.
Table 5. HPLC analyses (amino acids) of fermentation cell supernatants. S. thermophilus was grown on CDM;
samples were taken at the end of the exponential growth phase (same biomass).
Amino acid uptake (medium-sample) μMa S. thermophilus Lb. plantarum Wild-type gdhA knock-out Wild-type gdhA knock-out Alanine 510.5 908.5 838.6 930.3 Arginine 112.5 194 N.D. N.D. Asparagine -262.5 946 -191.7. -115.1 Aspartic acid 93.5 280.5 -2773.3 266.4 Cysteine 1059 1135.5 N.D. N.D. Glutamine 481.5 838 2561.1 4309.5 Glutamic acid 276.5 744.5 1613.2 1042.2 Glycine 188 470 970.5 1009.1 Histidine 63 220 445.9 463.4 Isoleucine 299.5 551 829.0 818.2 Leucine 475 1015 1815.5 1655.2 Lysine 219.5 520 1408.3 1650.5 Methionine 173.5 230 444.0 447.3 Phenylalanine 266.5 506.5 1027.5 1026.0 Proline 464.5 1190.5 1924.7 1980.5 Serine 356 891.5 2150.6 2340.5 Threonine 153 517.5 969.6 1006 Tryptophan 215.5 495.5 33.4 83.0 Tyrosine 758.5 826 994.6 1062.7 Valine 347.5 731 1336 1349.3 a Average of 2 duplicates
In addition, the mutant shows an increased production (almost 3x) of ammonia compared to
the wild-type (Table 6) and this fits well with the increased amino acid consumption. This
probably indicates amino acid degradation.

gdhA mutation in S. thermophilus
127
Table 6. Measured ammonia concentrations in fermentation cell supernatants. S. thermophilus was grown on
CDM; samples were taken at the end of the exponential growth phase (same biomass).
NH3 production (mM) Wild-type 2.2gdhA knock-out 6.0
In the case of Lb. plantarum, fermentation samples were analyzed following the same
procedure as was used for S. thermophilus (Table 4). The gdh/glnA mutant and the wild-type
do not show a difference in the primary metabolism; lactate, formate and acetate are produced
in similar amounts. Furthermore, amino acid measurements show a similar utilisation by the
mutant of the different amino acids with an exception for aspartate (Table 5). The volatile
profiles of the wild-type and the gdhA/glnA mutant were nearly identical (data not shown).
Transcriptome analysis. The impact of the absence of the ghdA gene on the gene expression
was studied with microarrays. For differentially regulation, we only selected those genes that
satisfied the following criteria (i) ratio ≥ 1.25 and (ii) FDR-value < 0.05. With these criteria,
we found 142 genes to be differentially expressed (Table S1). Logically, glutamate
dehydrogenase is heavily down regulated in the gdhA mutant. The ΔgdhA requires alternative
pathways to produce NADPH; a prediction from the recently developed Simpheny model (19)
was isocitrate dehydrogenase. The array data showed an up regulation of the citrate
metabolism (geometric mean FDR<0.05; average ratio ≥ 1.25); methylcitrate synthase,
aconitate synthase and isocitrate dehydrogenase (Figure 2). This up-regulation also
corresponds with the consumption of citrate (HPLC analysis), and the increased ICDH
activity and may indicate the importance of isocitrate dehydrogenase for NADPH.
Furthermore, some parts of the amino acid metabolism are affected in the gdhA mutant; some
amino acid transporters are up-regulated in the mutant and a branched chain amino acid
exporter is down-regulated. Histidine ammonia lyase is down-regulated, this enzyme is part of
the nitrogen metabolism. Phosphoserine aminotransferase is highly up-regulated in the gdhA
mutant; this enzyme catalyzes the formation of glutamate and phosphonooxypyruvate from O-
phospho-L-serine and 2-oxoglutarate.
Co-expressed genes (geometric mean FDR<0.05; average ratio ≥ 1.25) involved in
competence were down-regulated in the mutant compared to the wild-type.
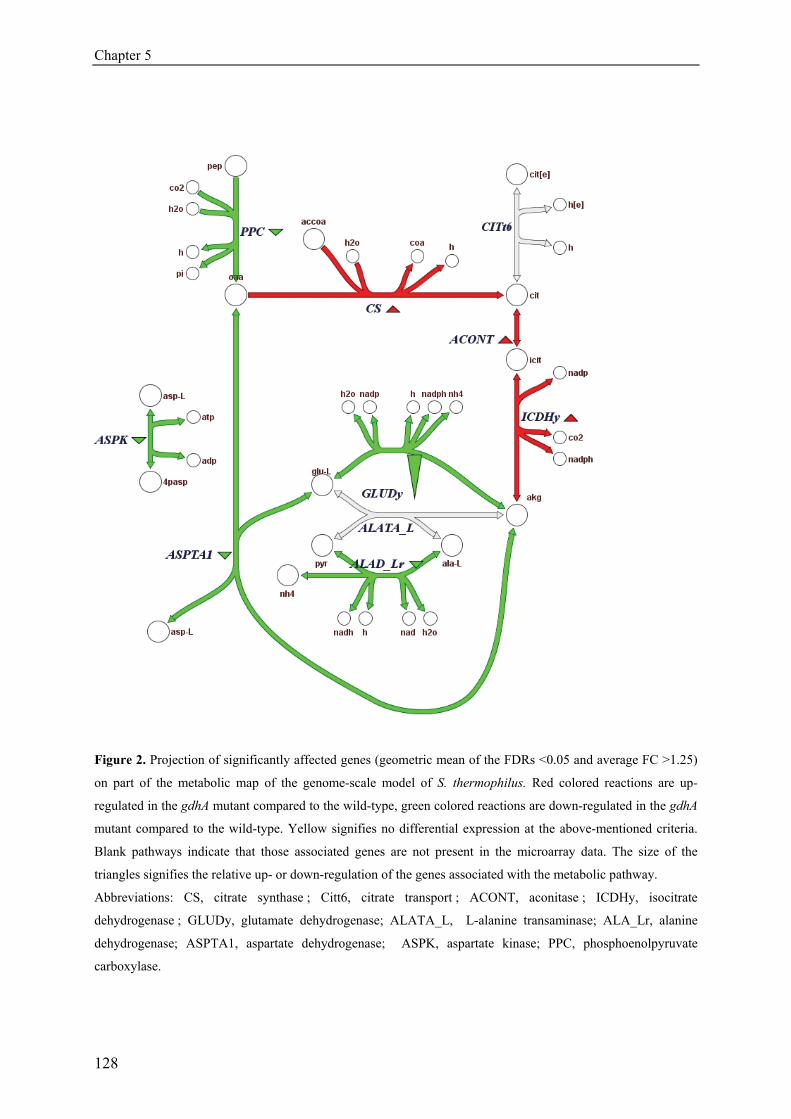
Chapter 5
128
Figure 2. Projection of significantly affected genes (geometric mean of the FDRs <0.05 and average FC >1.25)
on part of the metabolic map of the genome-scale model of S. thermophilus. Red colored reactions are up-
regulated in the gdhA mutant compared to the wild-type, green colored reactions are down-regulated in the gdhA
mutant compared to the wild-type. Yellow signifies no differential expression at the above-mentioned criteria.
Blank pathways indicate that those associated genes are not present in the microarray data. The size of the
triangles signifies the relative up- or down-regulation of the genes associated with the metabolic pathway.
Abbreviations: CS, citrate synthase ; Citt6, citrate transport ; ACONT, aconitase ; ICDHy, isocitrate
dehydrogenase ; GLUDy, glutamate dehydrogenase; ALATA_L, L-alanine transaminase; ALA_Lr, alanine
dehydrogenase; ASPTA1, aspartate dehydrogenase; ASPK, aspartate kinase; PPC, phosphoenolpyruvate
carboxylase.

gdhA mutation in S. thermophilus
129
Comparative genomics. The ERGO bioinformatics suite was used to compare the available
sequenced LAB on the absence of the pentose phosphate pathway. S. thermophilus is not the
only LAB with an incomplete PPP (Table7, end of chapter). Actually, almost all Streptococci
with the exception of a few S. suis and S. pneumonia strains, lack the oxidative part of the
PPP. All streptococci share the same common ancestor, but this ancestor splits in different
branches (17). The event of the gene loss of the PPP genes in most streptococci probably
occurred parallel and for a functional reason. S. thermophilus is known for its fast growth, and
the event of gene loss among different streptococci does not seem unique and does not result
in growth delay.
Table 7. ERGO assertions table. The presence of the pentose phosphate genes was tested for 54 sequenced lactic
acid bacteria. The numbers indicate if the gene is present and how many Open Reading Frames have the
assigned function.
Enzyme a
Strain 1 2 3 4 5 6 7 Enterococcus faecium DO (JGI) 1 1 1 1 1 Lactobacillus plantarum WCFS1 1 1 2 2 1 5 3 Lactobacillus reuteri 100-23 1 1 1 1 Lactococcus lactis 2 1 Lactococcus lactis str. IL 1403 1 1 2 1 1 1 Streptococcus mutans UA159 1 1 1 2 Streptococcus pneumoniae TIGR4 1 1 1 1 2 4 1 Streptococcus agalactiae 2603V/R 1 1 3 2 Streptococcus thermophilus Streptococcus pneumoniae 23F 1 1 1 1 4 1 Streptococcus suis 1 1 1 1 1 4 1 Streptococcus thermophilus LMG18311 1 1 1 Streptococcus equi 1 1 3 2 Streptococcus suis 89/1591 (JGI) 1 1 1 1 3 1 Streptococcus uberis 0140J 1 1 1 2 5 3 Streptococcus pyogenes M18 MGAS8232 1 1 1 3 Streptococcus pyogenes M3 SSI-1 1 1 1 3 Streptococcus pyogenes M5 1 1 1 3 Streptococcus pyogenes SF370-M1 1 1 1 3 Oenococcus oeni PSU-1 1 1 2 2 1 1 Enterococcus faecalis V583 1 1 2 1 1 1 Lactobacillus acidophilus NCFM 1 1 1 2 1 2 Lactobacillus brevis ATCC367 1 1 2 1 1 1 1 Lactobacillus delbrueckii bulgaricus ATCCBAA-365 (JGI)
1 1 1 2 1
Lactobacillus delbrueckii subsp. bulgaricus ATCC11842 (IG-98)
1 1 1 3 1
Lactobacillus gasseri ATCC-33323 (JGI) 1 1 1 1 1 Lactobacillus helveticus DPC 4571 (IG-177) 1 1 1 1 1 Lactobacillus johnsonii NCC533 1 1 1 1 1 2 Lactobacillus reuteri JCM 1112 1 1 1 1 1 Lactobacillus reuteri F275 1 1 1 1 1 Lactobacillus casei ATCC334 1 1 2 2 1 2

Chapter 5
130
Lactobacillus sakei subsp. sakei 23K 1 1 2 1 1 Lactobacillus salivarius subsp. salivarius UCC118 (IG-157)
1 1 1 2 2 1 2
Pediococcus pentosaceus ATCC25745 1 1 2 1 1 Lactococcus lactis subsp. cremoris SK11 1 1 2 1 2 1 Lactococcus lactis subsp. cremoris MG1363 1 1 2 1 2 1 Streptococcus pyogenes M6 MGAS10394 (IG-97) 1 1 1 3 Streptococcus pyogenes M28 MGAS6180 (IG-100) 1 1 1 3 Streptococcus pyogenes M1 MGAS5005 (IG-103) 1 1 1 3 Streptococcus pyogenes M2 MGAS10270 (IG-117) 1 1 3 3 Streptococcus pyogenes M4 MGAS10750 (IG-124) 1 1 3 3 Streptococcus agalactiae NEM316 1 1 3 2 Streptococcus agalactiae A909 1 1 4 3 Streptococcus gordonii str. Challis substr. CH1 1 1 1 1 1 1 Streptococcus pyogenes str. Manfredo 1 1 1 3 Streptococcus pneumoniae D39 1 1 1 1 1 3 1 Streptococcus pneumoniae Hungary19A-6 1 1 1 1 2 4 1 Streptococcus pneumoniae R6 1 1 1 1 1 3 1 Streptococcus pyogenes M3 MGAS315 1 1 1 3 Streptococcus pyogenes M12 MGAS9429 (IG-115) 1 1 1 3 Streptococcus suis 05ZYH33 1 1 3 1 1 1 1 Streptococcus suis 98HAH33 1 1 1 1 1 1 1 Streptococcus thermophilus LMD-9 1 1 1 Streptococcus thermophilus CNRZ1066 (IG-40) 1 1 1
aNr Functional description EC 1 Glucose-6-phosphate 1-dehydrogenase 1.1.1.49 2 6-phosphogluconolactonase 3.1.1.31 3 Phosphogluconate dehydrogenase 1.1.1.44 4 Ribose-5-phosphate isomerase 5.3.1.6 5 Ribulose-phosphate 3-epimerase 5.1.3.1 6 Transketolase 2.2.1.1 7 Transaldolase 2.2.1.2

gdhA mutation in S. thermophilus
131
Discussion
In this paper we discuss the absence of a complete pentose phosphate pathway (PPP) in S.
thermophilus LMG18311 and the search for other NADPH producing pathways. The pentose
phosphate pathway is mainly important for the generation of NADPH that all organisms need
for reductive biosynthesis. S. thermophilus, however, needs alternative pathways to obtain
NADPH. More streptococci do not have a complete PPP and the gene loss seems a parallel
event. The available Simpheny model for this strain (19) was used to find these alternative
pathways. One predicted alternative NADPH producing enzyme was isocitrate dehydrogenase
(encoded by the icdh gene). Another prediction was glutamate dehydrogenase (encoded by the
gdhA gene), S. thermophilus indeed has high gdhA activity and this strain is known for its
glutamate utilization. Moreover, milk, one of the natural habitats of S. thermophilus, is
glutamate rich (18). Based on this knowledge, a gdhA knock-out was constructed and
different experiments to compare this mutant with the wild-type were performed. Glutamate
dehydrogenase is the major pathway for the formation of α-amino groups directly from
ammonia (24). The amino acid glutamate can serve as carbon backbone for many other amino
acids (2). A fermentation experiment indicated that the gdhA mutant shows the same growth
performance as the wild-type. This experiment also showed that the mutant consumes citrate
and produces mainly lactate and small amounts of formate and acetaldehyde. The wild-type
uses homolactic metabolism for growth optimization. Furthermore, it seems that all the
consumed glucose is converted into lactate by the mutant and that for instance acetaldehyde is
not produced via mixed acid fermentation but as part of other pathways.
For the control organism Lb. plantarum, metabolic responses are not different between
the wild-type and the gdhA mutant. Furthermore a similar amount of volatiles is produced and
the slightly increase in the consumption of the different amino acid tends to show a high
ability of Lb. plantarum to adapt its metabolism to the double knock-out. In comparison with
S. thermophilus, this indicates that Lb. plantarum does not react in the same way, which could
be explained by the presence of a complete pentose phosphate pathway. A transcriptomics
study was not performed for Lb. plantarum.
Alcohol-acetaldehyde dehydrogenase is probably truncated in S. thermophilus as is described
elsewhere (11). However, S. thermophilus can produce acetaldehyde via threonine aldolase

Chapter 5
132
activity, in this reaction threonine is converted into glycine and acetaldehyde (7). The gdhA
mutant indeed shows increased threonine consumption.
Amino acid measurements showed that the gdhA knock-out consumes more of all amino acids
than the wild-type does, this may indicate the importance of the amino acid metabolism for
redoxbalance or for NADPH generation. The mutant also shows an increased production of
ammonia that fits well with the increased amino acid production indicating amino acid
degradation.
In a previous paper, we described that S. thermophilus has a simple primary
metabolism and a complex amino acid metabolism (19). The transcriptome data also showed
that some parts of the amino acid metabolism are affected and this might correspond with the
increased amino acid consumption. Still, the increased amino acid consumption is counter-
intuitive. Glutamate and especially its α-ketoacid α-ketoglutarate serve as a backbone for
most amino acids. When this activity is not present (in the case of the mutant), less amino
acids can be synthesized with glutamate as a backbone and less flavors can be formed.
However, the gdhA mutant of S. thermophilus shows a similar flavor profile as the wild-type.
Moreover, growth experiments showed that the gdhA knock-out needs glutamate for
(minimal) growth. Perhaps, glutamate has other (unknown) purposes than just serve as amino
acid backbone. The effect of a gdhA disruption not only affects NADPH generation, but also
pathways that synthesize glutamate or α-ketoglutarate.
As described in our previous paper (19), S. thermophilus requires only histidine and cysteine
for growth, but when glutamate is added as third amino acid, the growth rate increases
significantly. This observation may explain the essential role of glutamate for the gdhA
mutant.
The transcriptome study of the wild-type and the gdhA mutant showed some
interesting differences between the two strains. For instance co-expressed genes involved in
competence are down-regulated in the gdhA mutant compared to the wild-type. In
streptococci, competence is not a constant property, it is a transient state regulated by a
quorum-sensing mechanism consisting of ComABCDE (4). Spontaneous development of
competence in S. thermophilus probably requires special, as-yet-undiscovered growth
conditions (4). It was observed for Bacillus subtilis that the presence of glutamate in the
growth medium has adverse effects on the development of competence (26). Our study

gdhA mutation in S. thermophilus
133
showed that the gdhA mutant consumes more glutamate than the wild-type does and maybe
related to the down-regulation of the competence genes. Also for Group H Streptococci a
relationship was found between medium components (glutamate) and development of
competent state. Addition of sublethal concentrations of chloramphenicol inhibited
competence (15). Chloramphenicol was added to the growth medium of the gdhA mutant,
although not in sublethal concentrations. These findings suggest an important correlation
between glutamate (and probably chloramphenicol) and competence.
Another interesting observation is the up-regulation of the citrate metabolism
(methylcitrate synthase, aconitate synthase and isocitrate dehydrogenase) that is observed in
the mutant. Isocitrate dehydrogenase was one of the predicted alternatives from our Simpheny
model to produce NADPH. Metabolic analysis showed citrate consumption by the mutant and
the mutant also possesses ICDH activity. Isocitrate dehydrogenase and glutamate
dehydrogenase are connected via α-ketoglutarate (Figure 2). This α-ketoacid plays an
important role in the biosynthesis of other amino acids and in the formation of flavors (1, 24).
Glutamate dehydrogenase has therefore different important functions in the cell; generation of
NADPH and formation of α-ketoglutarate (and thus other amino acids and flavors). α-
ketoglutarate can also be generated by the action of isocitrate dehydrogenase.
To test the hypothesis of ICDH as possible NADPH producing enzyme we are
currently attempting to construct a knock-out of this gene, both in the wild-type and in the
ΔgdhA mutant, using the same method as described in the methods section of this paper.
Especially the double knock-out will be interesting to study, since this strain probably even
has other or more alternative pathways to produce NADPH. Options we can think of are:
aspartate semialdehyde dehydrogenase, homoserine dehydrogenase or methylene
tetrahydrofolate dehydrogenase. The afore-mentioned hypotheses are currently under
investigation.

Chapter 5
134
References
1. Banks, J. M., M. Yvon, J. C. Gripon, M. A. de la Fuente, E. Y. Brechany, A. G.
Williams, and D. D. Muir. 2001. Enhancement of amino acid metabolism in Cheddar
cheese using a-ketoglutarate: amino acid degradation in relation to volatile compounds
and aroma character. Int Dairy J 11:235-243.
2. Berg, J. M., J. L. Tymoczko, and L. Stryer. 2002. Biochemistry.
3. Blom, E. J., R. Breitling, K. J. Hofstede, J. B. Roerdink, S. A. van Hijum, and O.
P. Kuipers. 2008. Prosecutor: parameter-free inference of gene function for
prokaryotes using DNA microarray data, genomic context and multiple gene
annotation sources. BMC Genomics 9:495.
4. Blomqvist, T., H. Steinmoen, and L. S. Havarstein. 2006. Natural genetic
transformation: A novel tool for efficient genetic engineering of the dairy bacterium
Streptococcus thermophilus. Appl Environ Microbiol 72:6751-6756.
5. Bolotin, A., B. Quinquis, P. Renault, A. Sorokin, S. D. Ehrlich, S. Kulakauskas,
A. Lapidus, E. Goltsman, M. Mazur, G. D. Pusch, M. Fonstein, R. Overbeek, N.
Kyprides, B. Purnelle, D. Prozzi, K. Ngui, D. Masuy, F. Hancy, S. Burteau, M.
Boutry, J. Delcour, A. Goffeau, and P. Hols. 2004. Complete sequence and
comparative genome analysis of the dairy bacterium Streptococcus thermophilus. Nat
Biotechnol 22:1554-1558.
6. Bolotin, A., P. Wincker, S. Mauger, O. Jaillon, K. Malarme, J. Weissenbach, S.
D. Ehrlich, and A. Sorokin. 2001. The complete genome sequence of the lactic acid
bacterium Lactococcus lactis ssp. lactis IL1403. Genome Research 11:731-753.
7. Chaves, A. C., M. Fernandez, A. L. Lerayer, I. Mierau, M. Kleerebezem, and J.
Hugenholtz. 2002. Metabolic engineering of acetaldehyde production by
Streptococcus thermophilus. Appl Environ Microbiol 68:5656-5662.
8. Cvitkovitch, D. G., J. A. Gutierrez, and A. S. Bleiweis. 1997. Role of the citrate
pathway in glutamate biosynthesis by Streptococcus mutans. J Bacteriol 179:650-655.
9. Engels, W. 1997. Volatile and non-volatile compounds in ripened cheese: their
formation and their contribution to flavour. PhD thesis Wageningen University.
10. Goffin, P., L. Muscariello, F. Lorquet, A. Stukkens, D. Prozzi, M. Sacco, M.
Kleerebezem, and P. Hols. 2006. Involvement of pyruvate oxidase activity and

gdhA mutation in S. thermophilus
135
acetate production in the survival of Lactobacillus plantarum during the stationary
phase of aerobic growth. Appl Environ Microbiol 72:7933-7940.
11. Hols, P., F. Hancy, L. Fontaine, B. Grossiord, D. Prozzi, N. Leblond-Bourget, B.
Decaris, A. Bolotin, C. Delorme, S. Dusko Ehrlich, E. Guedon, V. Monnet, P.
Renault, and M. Kleerebezem. 2005. New insights in the molecular biology and
physiology of Streptococcus thermophilus revealed by comparative genomics. FEMS
Microbiol. Rev. 29:435-463.
12. Honjoh, K., A. Mimura, E. Kuroiwa, T. Hagisako, K. Suga, H. Shimizu, R. S.
Dubey, T. Miyamoto, S. Hatano, and M. Iio. 2003. Purification and characterization
of two isoforms of glucose 6-phosphate dehydrogenase (G6PDH) from Chlorella
vulgaris C-27. Biosci Biotechnol Biochem 67:1888-1896.
13. Kleerebezem, M., J. Boekhorst, R. van Kranenburg, D. Molenaar, O. P. Kuipers,
R. Leer, R. Tarchini, S. A. Peters, H. M. Sandbrink, M. W. Fiers, W. Stiekema,
R. M. Lankhorst, P. A. Bron, S. M. Hoffer, M. N. Groot, R. Kerkhoven, M. de
Vries, B. Ursing, W. M. de Vos, and R. J. Siezen. 2003. Complete genome sequence
of Lactobacillus plantarum WCFS1. Proc Natl Acad Sci U S A 100:1990-1995.
14. Lambert, J. M., R. S. Bongers, and M. Kleerebezem. 2007. Cre-lox-based system
for multiple gene deletions and selectable-marker removal in Lactobacillus plantarum.
Appl Environ Microbiol 73:1126-1135.
15. Leonard, C. G., J. M. Ranhand, and R. M. Cole. 1970. Competence factor
production in chemically defined media by noncompetent cells of group H
Streptococcus strain Challis. J Bacteriol 104:674-683.
16. Letort, C., and V. Juillard. 2001. Development of a minimal chemically-defined
medium for the exponential growth of Streptococcus thermophilus. J Appl Microbiol
91:1023-1029.
17. Makarova, K. S., and E. V. Koonin. 2007. Evolutionary genomics of lactic acid
bacteria. J Bacteriol 189:1199-1208.
18. NDC. 2000. National Dairy Council.
19. Pastink, M. I., B. Teusink, P. Hols, S. Visser, W. M. de Vos, and J. Hugenholtz.
2009. Metabolic comparison of lactic acid bacteria; genome-scale model of
Streptococcus thermophilus LMG18311. Appl Environ Microbiol 75:3627-3633.

Chapter 5
136
20. Sambrook, J., E. F. Fritsch, and T. Maniatis. 1989. Molecular cloning: a laboratory
manual, 2nd ed.
21. Smit, B. A., W. J. Engels, J. T. Wouters, and G. Smit. 2004. Diversity of L-leucine
catabolism in various microorganisms involved in dairy fermentations, and
identification of the rate-controlling step in the formation of the potent flavour
component 3-methylbutanal. Appl Microbiol Biotechnol 64:396-402.
22. Smith, P. K., R. I. Krohn, G. T. Hermanson, A. K. Mallia, F. H. Gartner, M. D.
Provenzano, E. K. Fujimoto, N. M. Goeke, B. J. Olson, and D. C. Klenk. 1985.
Measurement of protein using bicinchoninic acid. Anal Biochem 150:76-85.
23. Starrenburg, M. J., and J. Hugenholtz. 1991. Citrate Fermentation by Lactococcus
and Leuconostoc spp. Appl Environ Microbiol 57:3535-3540.
24. Tanous, C., A. Kieronczyk, S. Helinck, E. Chambellon, and M. Yvon. 2002.
Glutamate dehydrogenase activity: a major criterion for the selection of flavour-
producing lactic acid bacteria strains. Antonie Van Leeuwenhoek 82:271-278.
25. Wegmann, U., M. O'Connell-Motherway, A. Zomer, G. Buist, C. Shearman, C.
Canchaya, M. Ventura, A. Goesmann, M. J. Gasson, O. P. Kuipers, D. van
Sinderen, and J. Kok. 2007. Complete genome sequence of the prototype lactic acid
bacterium Lactococcus lactis subsp. cremoris MG1363. J Bacteriol 189:3256-3270.
26. Wilson, G. A., and K. F. Bott. 1968. Nutritional factors influencing the development
of competence in the Bacillus subtilis transformation system. J Bacteriol 95:1439-
1449.
27. Woodcock, D. M., P. J. Crowther, J. Doherty, S. Jefferson, E. DeCruz, M. Noyer-
Weidner, S. S. Smith, M. Z. Michael, and M. W. Graham. 1989. Quantitative
evaluation of Escherichia coli host strains for tolerance to cytosine methylation in
plasmid and phage recombinants. Nucleic Acids Res 17:3469-3478.

gdhA mutation in S. thermophilus
137
Supplementary material
Figure S1. Schematic design of the hybridization scheme that was used for the micro array experiment in this
study. Each arrow represents one hybridization event; the arrows point from the samples labeled with cy3 to
samples labeled with cy5. 1 and 2 refer to samples from duplicate fermentations.
ΔgdhA 1 ΔgdhA 2
Wildtype 1 Wildtype 2

Chapter 5
138
Table S1. Transcriptional analysis comparing the response of a gdhA mutant compared to the wild-type of S.
thermophilus. Significant genes have a FDR value< 0.05 and FC>1.25 (142 affected genes)
locus gene Product FC fdr stu0430 gdhA glutamate dehydrogenase 0.01731 0.00000 stu0864 hypothetical protein 0.09308 0.00014
stu1017 maltose/maltodextrin ABC uptake transporter membrane-spanning protein, truncated 0.10612 0.00673
stu0335 hypothetical protein 0.11401 0.00765 stu1391 hypothetical protein 0.12230 0.02997 stu1088 hypothetical protein 0.12246 0.00000 stu0129 truncated IS1193 transposase 0.14449 0.00000 stu0015 hypothetical protein 0.16762 0.00337 stu1663 int integrase/recombinase plasmid associated, putative 0.20922 0.00001 stu0568 hypothetical protein 0.22965 0.01278 stu1755 hypothetical protein 0.23072 0.01010 stu1603 hypothetical protein 0.23352 0.02396 stu1464 glutamine amidotransferase (class I), putative 0.23468 0.02446 stu1571 hypothetical protein 0.23734 0.00000 stu0051 hypothetical protein 0.24386 0.02683 stu1337 xanthine phosphoribosyltransferase, truncated 0.24429 0.00539 stu1334 peptide-4 ABC transporter ATP binding protein 0.25118 0.04920
stu0169 oligopeptide ABC uptake transporter substrate binding protein, truncated 0.25958 0.00776
stu0866 hypothetical protein 0.26318 0.00585 stu0016 hypothetical protein 0.26410 0.02444 stu0978 hypothetical protein 0.26729 0.00411 stu0068 hypothetical protein 0.27980 0.01276 stu0155 hypothetical protein 0.28273 0.00422 stu1784 hypothetical protein 0.29017 0.00348 stu0398 hypothetical protein 0.29028 0.02225 stu0650 eetB exfoliative exotoxin B, putative 0.29868 0.03771 stu0126 truncated IS1193 transposase 0.30208 0.00027 stu1302 truncated IS1193 transposase 0.30305 0.00164 stu0914 hypothetical protein 0.30463 0.00144 stu0935 ferrochelatase, truncated 0.31067 0.02433 stu0766 hypothetical protein 0.31399 0.02413
stu1432 ftsY signal recognition particle receptor (docking protein) 0.31458 0.01213
stu0863 hypothetical protein 0.31730 0.00048
stu1769 branched chain amino acid exporter (LIV-E) family protein 0.32270 0.04971
stu0865 hypothetical protein 0.32566 0.00625
stu0974 amino acid ABC uptake transporter substrate binding protein, truncated 0.32635 0.01015
stu1300 alkD DNA alkylation repair protein 0.32645 0.03490 stu1403 galR galactose operon repressor 0.32689 0.00157 stu0267 rRNA methyltransferase 0.33069 0.00106 stu1692 hypothetical protein 0.33108 0.02400 stu0295 hypothetical protein 0.33363 0.03949 stu0268 hypothetical protein 0.33772 0.00050 stu1405 hypothetical protein 0.34276 0.03626

gdhA mutation in S. thermophilus
139
stu1398 lacS lactose permease 0.34340 0.01167 stu_t31 0.34351 0.01631 stu1670 hypothetical protein 0.34352 0.02465 stu1780 truncated IS1193 transposase 0.34468 0.00783 stu0426 ABC transporter ATP-binding protein 0.34572 0.04071
stu0170 oligopeptide ABC uptake transporter substrate binding protein, truncated 0.34794 0.02431
stu0743 truncated IS1193 transposase 0.34797 0.02474 stu1086 tnp1193 IS1193 transposase 0.34887 0.04020 stu_t39 0.35179 0.03538 stu0821 truncated IS1193 transposase 0.36150 0.02432 stu1303 truncated IS1193 transposase 0.36150 0.02458 stu1881 alcohol-acetaldehyde dehydrogenase, truncated 0.36472 0.03738 stu0823 truncated IS1193 transposase 0.36502 0.01588 stu1313 hutH histidine ammonia-lyase 0.36908 0.01148 stu0519 hypothetical protein 0.36982 0.03521
stu0977 amino acid ABC uptake transporter membrane-spanning protein, truncated 0.37217 0.03500
stu1444 tnp1193 IS1193 transposase 0.37622 0.03048 stu0919 hypothetical protein 0.37872 0.00756 stu0925 truncated IS1193 transposase 0.37912 0.04976 stu0979 5'-nucleotidase, putative 0.37968 0.02567 stu1575 hypothetical protein 0.38025 0.00672 stu1414 truncated IS1193 transposase 0.38281 0.04476 stu0916 transcriptional regulator 0.38295 0.04701 stu1446 hypothetical protein 0.38328 0.03157 stu0881 alcohol dehydrogenase I, truncated 0.38806 0.04262 stu1272 truncated IS1193 transposase 0.39022 0.04002 stu0822 truncated IS1193 transposase 0.39344 0.03140 stu0910 acetoin reductase, truncated 0.39416 0.03339 stu0025 truncated IS1193 transposase 0.40398 0.04868 stu0019 hypothetical protein 0.40949 0.03608 stu1339 hypothetical protein 0.41563 0.04967 stu1301 phosphinothricin acetyltransferase, putative 0.41627 0.02429 stu1664 hypothetical protein 0.42553 0.01160
stu1410 ABC transporter, putative ATP binding protein, truncated 0.42671 0.00406
stu1433 hypothetical protein 0.44616 0.00777 stu1179 rpIS 50S ribosomal protein L19 0.45390 0.00022 stu_t11 0.46014 0.00880 stu1451 hypothetical protein 0.46179 0.04995 stu_t22 0.47058 0.00017 stu0013 hypothetical protein 0.47079 0.01193 stu0586 hypothetical protein 0.47966 0.00413 stu0204 GroEL chaperonin GroEL 0.49320 0.00001 stu_t64 0.49952 0.00681 stu_t12 0.52039 0.03545 stu0796 tnpSth1 IS3 familytransposase orf2 0.52789 0.04035 stu_t61 0.53329 0.00752 stu_t65 0.53329 0.00769 stu0203 GroES co-chaperonin GroES 0.54226 0.00024

Chapter 5
140
stu_t48 0.54248 0.01631 stu_t36 0.54248 0.01654 stu0207 hypothetical protein 0.54408 0.04988 stu1564 peptidoglycan GlcNAc deacetylase, truncated 0.54745 0.04952 stu1749 corA2 CorA cation transporter (MIT) family protein 0.54875 0.00426 stu1937 hypothetical protein 0.55062 0.00325 stu0955 pyrDb dihydroorotate dehydrogenase 1B 0.56245 0.03767 stu_t10 0.56365 0.01265 stu_t17 0.57123 0.02542 stu_t04 0.57252 0.02417 stu1873 ilvB acetolactate synthase catalytic subunit 0.58232 0.02465 stu_t15 0.58982 0.02962 stu_t33 0.60019 0.02474 stu_t01 0.60019 0.02505 stu_t02 0.60019 0.02537 stu_t62 0.60019 0.02570 stu_t45 0.60019 0.02604 stu_t43 0.60019 0.02639 stu_t19 0.60019 0.02675
stu1690 bacteriocin ABC exporter accessory protein, truncated 0.60332 0.03326
stu0525 pyrB aspartate carbamoyltransferase catalytic subunit 0.64831 0.03518 stu0120 dnaK molecular chaperone DnaK 0.67333 0.02538 stu1133 rpmI 50S ribosomal protein L35 0.67939 0.01415 stu1733 scrK fructokinase 1.37043 0.04958 stu1042 hypothetical protein 1.45304 0.04075 stu0007 hypothetical protein 1.45693 0.02970 stu2006 hypothetical protein 1.47039 0.01803
stu1652 polar amino acid ABC uptake transporter ATP-binding protein 1.50981 0.01336
stu1672 pepXP x-prolyl-dipeptidyl aminopeptidase 1.52573 0.02491 stu1033 alkaline amylopullulanase, truncated 1.55237 0.03329 stu1043 tyrSE tyrosyl-tRNA synthetase E 1.55493 0.01321 stu1400 galE1 UDP-glucose 4-epimerase 1.55641 0.01172 stu1032 alkaline amylopullulanase, truncated 1.59069 0.02686 stu0630 ccpA catabolite control protein 1.61572 0.01630 stu1034 alkaline amylopullulanase, truncated 1.64157 0.03767 stu1360 hypothetical protein 1.80747 0.00756 stu1540 folK hydroxymethylpterin pyrophosphokinase 1.90931 0.00592 stu1306 uvrC excinuclease ABC subunit C 1.95608 0.01194 stu1316 sdaB L-serine dehydratase beta subunit 1.96373 0.04267
stu0301 polar amino acid ABC uptake transporter ATP binding protein 1.97230 0.00246
stu0454 pepB oligopeptidase 2.05681 0.01031 stu0838 cspB cold shock protein B 2.08717 0.03578 stu0837 cspA cold shock protein A 2.18760 0.01044
stu1104 eps3 exopolysaccharide biosynthesis protein, glycosyltransferase 2.21704 0.02451
stu0458 cell wall protein precursor, choline binding protein, truncated 2.41362 0.02495
stu1027 fatC iron compound ABC uptake transporter membrane-spanning protein 2.57056 0.00165

gdhA mutation in S. thermophilus
141
stu0497 hypothetical protein 2.92669 0.00018
stu1025 fatB iron compound ABC uptake transporter substrate-binding protein 3.31099 0.00012
stu1570 hypothetical protein 3.50290 0.00001 stu1529 serC phosphoserine aminotransferase 6.84862 0.00000 stu0496 mur1 peptidoglycan hydrolase 9.84294 0.00018

Chapter 5
142

Chapter 6
General discussion and future perspectives

Chapter 6
144
Introduction
The research described in this thesis focuses on the amino acid metabolism of three
different, Lactic Acid Bacteria (LAB), of which the genomes are sequenced; Lactococcus
lactis MG1363 (30), Lactobacillus plantarum WCFS1 (15) and Streptococcus thermophilus
LMG18311 (4). Several approaches were applied to elucidate the amino acid metabolism in
these LAB; (i) fermentations on media with differing composition, (ii) comparison of
genome-scale models, (iii) transcriptome studies and (iv) metabolic engineering.
In Chapter 1 we provided an overview of LAB and highlighted their economic importance as
industrial food fermenters. Furthermore, we introduced the amino acid metabolism, functional
genomics, and metabolic modeling approaches of LAB. Finally, a brief outline of this thesis
was provided.
This chapter will provide an overview of the work described in this thesis. The
different sections in this chapter will focus on flavor formation, fermentations on different
media, genome-scale modeling, transcriptome studies and metabolic engineering. Finally,
future perspectives will be given.
Flavor formation
The flavor profiles of food products are subject to the metabolic activities of the
fermenting LAB (22). For the development of novel or improved dairy and other food
products, flavor characteristics are an important selection criterion. In this respect, high-
throughput screening systems are important tools to study (and ultimately manipulate) the
flavor formed by cultures of LAB. The study of the factors that affect flavor profiles was the
primary topic of Chapter 2. Since many fermented dairy products are manufactured with
mixed cultures (such as yoghurt), we included single cultures but also mixed cultures. As the
composition of the growth media also affects the flavor profile, a defined medium was
compared with an industrial medium based on milk. GC-MS was used to analyze the flavor
profiles and genome-scale models were constructed to link the generated flavor data to
metabolic routes.
Flavor analysis of mixed cultures brings additional challenges. The flavor profile of a
mixed culture is not simply the sum of the individual cultures, as many metabolic interactions
occur. For example, our studies of the mixed yoghurt culture, consisting of S. thermophilus

General discussion
145
and Lb. delbrueckii subsp. bulgaricus showed that diacetyl is present at lower levels in the
mixed culture than in the pure culture of S. thermophilus. In addition, ethanol is only detected
in the monoculture of Lb. bulgaricus. Moreover, the environmental conditions also appeared
to affect the metabolic profiles. Some remarkable differences in metabolic profiles were
observed between cultures grown on media of different composition (although many
compounds are also produced independently). Acetaldehyde and diacetyl are formed by S.
thermophilus both on a defined medium (CDM) and an industrial medium (skimmed milk),
whereas acetic acid and 2,3-pentanedione are only produced during growth on CDM and not
on milk.
A detailed comparison of the metabolites present in the headspace of fermentation
samples of L. lactis, Lb. plantarum and S. thermophilus is described in Chapter 3.
Comparative analysis of the GC-MS profiles of the three strains, grown on defined medium,
revealed that S. thermophilus is able to produce a broad variety of flavors, in comparison to L.
lactis and Lb. plantarum, as will be described below.
Genome-scale models can be used, in combination with experimental data, to
elucidate the flavor producing pathways. We have used the SimphenyTM software package
(Genomatica Inc., San Diego CA, USA) to visualize the similarities and differences between
strains or conditions on the metabolic maps. An important result from these types of studies is
that the key flavor acetaldehyde that is produced by L. lactis, Lb. plantarum and S.
thermophilus, can be generated via different pathways. As described previously, L. lactis and
Lb. plantarum, among others can produce acetaldehyde during lactose metabolism by
pyruvate decarboxylation (6). S. thermophilus, which has a truncated acetaldehyde
dehydrogenase (13), can convert threonine into acetaldehyde and glycine by the action of
threonine aldolase (8), as is shown in Figure 1.

Chapter 6
146
(a)
(b)
Figure 1. (a) Metabolic map (Simpheny) of part of the primary metabolism in Lactobacillus plantarum WCFS1,
the acetaldehyde pathway is highlighted. pyr = pyruvate, PDH = pyruvate dehydrogenase, accoa = acetyl
coenzyme A, ACALD = acetaldehyde dehydrogenase, acald = acetaldehyde, ACALD2x = alcohol
dehydrogenase, etoh = ethanol. (b) Metabolic map (Simpheny) of part of the amino acid metabolism in S.
thermophilus LMG18311, the acetaldehyde pathway is highlighted. thr = threonine, THRA = threonine aldolase,
acald = acetaldehyde, gly = glycine.
In Chapter 4 we studied the effect of environmental conditions on the flavor profiles. Three
different LAB (L. lactis, Lb. plantarum and S. thermophilus) were grown on two different
defined media; one with a surplus of amino acids (rich medium) and one with a minimal
amount of amino acids (poor medium). Volatile analysis of the headspace showed that all
three LAB produced less flavors during growth on the poor medium. This observation
confirmed that the concentration of present amino acids is important for the flavor profile.
Development of a minimal medium
Single amino acid omissions in S. thermophilus have shown that the number and type
of essential amino acids is strain-dependent and range from 2-5 amino acids (11, 17, 19).
However, in general, S. thermophilus has a much lower degree of auxotrophy for amino acids
than other LAB (7). For example, L. lactis MG1363 and Lb. plantarum WCFS require
respectively 6 and 11 amino acids for (minimal) growth (14, 28).
In Chapter 3 we describe the development of a medium with a defined amount of
amino acids for S. thermophilus LMG18311. The amino acid requirements can then be

General discussion
147
compared with in silico predictions based on the amino acid biosynthesis pathways of S.
thermophilus LMG18311. The in silico predictions, based on the genomic information,
suggest a biosynthetic capacity for all amino acids except histidine (13). Indeed our multiple
omission experiments showed an auxotrophy for this amino acid. Besides histidine, however,
S. thermophilus LMG18311 also requires one of the sulfur-containing amino acids (with a
preference for cysteine), when grown in the presence of citrate for growth (Table 1) Citrate
can play an important role in the generation of NADPH and CO2 . Detailed in silico analysis
revealed that the yhcE gene is truncated. The product of yhcE shows similarity to the vitamin
B12-independent 5-methyltetrahydropteroyltriglutamate-homocysteine S-methyltransferase.
Its orthologue in L. lactis is involved in the synthesis of cysteine from methionine (13).
Therefore, the inactivation of this gene in S. thermophilus may explain the auxotrophy for one
of the two sulfur amino acids.
Table 1. Essential amino acids for three different lactic acid bacteria: L. lactis MG1363 (14), Lb. plantarum
WCFS1 (28) and S. thermophilus LMG18311 (Chapter 3 (23))
Strain Essential amino acids L. lactis MG1363 Glutamate, hisitidine, isoleucine, leucine,
methionine, valine Lb. plantarum WCFS1 Arginine, cysteine, glutamate, isoleucine,
leucine, methionine, phenylalanine, threonine, tryptophan, tyrosine, valine
S. thermophilus LMG18311 Cysteine, histidine
The low degree of amino acid auxotrophies of S. thermophilus and the ability to
generate a varied amount of flavors, suggests a rather elaborate set of amino acid converting
pathways. This is unexpected, because S. thermophilus, is used for centuries together with Lb.
bulgaricus to produce yoghurt resulting in a high degree of gene loss (18). The continued
cultivation of S. thermophilus in the protein rich milk-environment would make the loss of
one or more amino acid biosynthesis pathways a likely scenario. Remarkably, Lb. bulgaricus
has lost most of its amino acid biosynthetic capacity (29). We can speculate why S.
thermophilus has retained most of its amino acid biosynthetic capacity. Firstly, amino acid
metabolism is not only important for the synthesis of amino acids but also plays a role in
maintaining the redox balance and NADPH generation. Secondly, S. thermophilus strains are

Chapter 6
148
selected for quick growth and acidification in milk where the availability of amino acids
forms the rate-limiting factor for growth in milk. To support such a quick growth, the
operation of, apart from histidine and cysteine, all amino acid pathways is required. Thirdly,
S. thermophilus does not possess an extracellular protease to exploit the abundantly present
milk proteins. S. thermophilus may have adapted to the protein-rich environment independent
or it was co-evolved with the protease positive Lb. bulgaricus but maintains an advantage by
conserving most of the amino acid biosynthesis pathways (29).
Development of a genome-scale model
Genome-scale models are the basis for many developments. They are based on
annotated genome sequences and experimental data and have become available for an
increasing number of organisms, including various LAB (21, 28). A useful tool for the
construction of these in silico models is the SimphenyTM software package (Genomatica Inc.,
San Diego CA, USA). The thus generated in silico models are stoichiometric models and are
based on a thorough metabolic reconstruction of well-annotated genome sequences (27). In
this work we have constructed a metabolic model for S. thermophilus. The existing models of
Lb. plantarum (28) and of L. lactis, which was constructed using the Autograph method (20),
were used as the initial basis, for the construction and development of the S. thermophilus
model (Chapter 3).
Comparative evaluation of the generated models revealed considerable differences as
can be expected as the three LAB are highly diverse. In particular they differ in the size of the
genome and thus the number of genes incorporated in the model, as is shown in table 2.
Table 2. Some properties about three different lactic acid bacteria: L. lactis MG1363 (14), Lb. plantarum
WCFS1 (28) and S. thermophilus LMG18311 (Chapter 3 (23)) and their respective models.
L. lactis Lb. plantarum S. thermophilus Genome size 2.5 Mb 3.3 Mb 1.8 Mb Genes in model 2563 3064 1889 Reactions in model 598 598 598
The metabolic models for these three LAB were used as mapping tools for microarray data,
different simulations and a comparative in silico analysis. Unique for the S. thermophilus

General discussion
149
genome and therefore also model, are the absence of a complete pentose phosphate pathway
and the simple primary metabolism.
Homofermentative metabolism
LAB can be divided into two groups concerning their carbohydrate metabolism (see
Chapter 1). The LAB belonging to the homofermentative group use the Embden-Meyerhof
pathway in which glucose is completely converted into lactate (25). The heterofermentative
LAB produce lactate, acetate, CO2 and ethanol using the hexose monophosphate pathway
(25). Some homolactic LAB can also have a mixed acid fermentation, producing mainly
acetate, formate and ethanol (12, 28).
The metabolic model of S. thermophilus predicts that homofermentative lactic acid
production is the only primary metabolism operating in S. thermophilus (Figure 2) (Chapter
3). Our fermentation data indeed showed that S. thermophilus consumes (almost) all the
glucose and produces mainly lactate, in line with earlier observations (13). The mixed acid
fermentation is metabolically the most efficient route for lactic acid bacteria whereas the
homolactic route is catalytically more efficient (12). Typically, both L. lactis and Lb.
plantarum grow homolactically at high dilution rates or via mixed acid fermentation at low
dilution rates (12, 28). Because S. thermophilus has pseudogenes that affect the primary
metabolism, the number of pyruvate branches is limited. The presence of these pseudogenes,
especially those which are normally important for NAD+ regeneration, limit the number of
alternative metabolic routes for lactate dehydrogenase. Thus, when grown anaerobically on
glucose, the redox-balance constrains the glucose catabolism by S. thermophilus to the
production of lactate.

Chapter 6
150
Figure 2. Primary metabolism of Streptococcus thermophilus. This map is part of the total genome-scale
metabolic model developed for S. thermophilus. Large bold capital italics indicate the enzymes and normal small
italics the metabolites. Taken from Chapter 3.
The developed metabolic model of S. thermophilus is suitable for Flux Balance Analysis
(FBA) (28). FBA can be used to explore the metabolic potential of the metabolic network,
while taking into account mass balance equations and other constraints (24). FBA correctly
predicted homolactic fermentation in S. thermophilus, (growing anaerobically on glucose) in
contrast to what was found for Lb. plantarum (28) and L. lactis (21). The developed model of
S. thermophilus thus has many different possibilities.

General discussion
151
Transcriptional response towards amino acid depletion
For the development of novel or improved dairy and other food products, flavor
characteristics are an important selection criterion. We elaborated on this observation and in
Chapter 4 we describe a more detailed study of the physiological response of L. lactis, Lb.
plantarum and S. thermophilus to amino acid availability using microarray techniques and
volatile analysis. The growth of single cultures of these three different lactic acid bacteria on a
defined medium containing all amino acids was compared with that on the same with a
minimal amount of amino acids. As expected, growth on medium with a minimum of amino
acids triggers a major response in the expression of genes encoding amino acid metabolic
pathways.
When the transcriptional response of the three LAB towards the depletion of amino
acids was compared, we observed that not only genes involved in the amino acid metabolism
are affected but also those involved in other parts of the metabolism. In addition, the specific
growth rate and yield is influenced/reduced, and in Lb. plantarum the expression of stress-
related genes was affected. Obviously, the three LAB have different strategies to cope with a
depletion of amino acids. S. thermophilus has a simple primary metabolism and a complex
amino acid metabolism. A large part of the affected genes is involved in amino acid
metabolism, in contrast to what was found for the other two LAB. The primary metabolism is
not very flexible due to the presence of pseudogenes and the amino acid metabolism is quite
complete and flexible. The other two LAB, L. lactis and Lb. plantarum have a more flexible
primary metabolism in comparison to S. thermophilus. They show a more general response
than S. thermophilus, since not only amino acid metabolism, but also other parts of the
metabolism are affected by the depletion of amino acids. On restricted medium, less volatile
compounds (some volatiles are flavors) are formed than on the complete medium by all three
LAB because most flavors are generated during amino acid metabolism. Of the three studied
LAB, L. lactis is probably most adapted to the protein-rich milk environment and this
bacterium also shows the largest response (relatively most differentially regulated genes)
towards amino acid depletion.
Overall these data showed that not only amino acid metabolism is affected by a
depletion (or surplus) of amino acids, but also overall metabolism is affected. This study also
showed that different LAB have different strategies to cope with a depletion of amino acids.

Chapter 6
152
Even though these organisms are closely related, they have their own unique requirements
and their own response.
Effect of GDH inactivation in S. thermophilus
All living organisms need NADPH for reductive biosynthesis. The activity of the
pentose phosphate pathway typically generates intracellular NADPH to be used in reductive
biosynthesis. This pathway contains two parts: an oxidative part and a nonoxidative part that
interconverts phosphorylated sugars (3). Most LAB possess a complete pentose phosphate
pathway. However, S. thermophilus LMG18311 (5, 13) interestingly, lacks a complete
pentose phosphate pathway, as is described in Chapter 5. The genome predicts that the
oxidative phase (the conversion of glucose-6-phosphate to ribulose-5- phosphate) is absent in
S. thermophilus. In agreement with this, we have experimentally verified that S. thermophilus
does not have glucose-6-phosphate dehydrogenase activity. However, S. thermophilus must
have alternative pathways to synthesize NADPH. To find alternative NADPH-producing
pathways, we analyzed the available genome-scale model of S. thermophilus (described in
Chapter 3) and tested the various model-predictions experimentally. One alternative
NADPH-generating pathway may involve isocitrate dehydrogenase (encoded by the icdh
gene), another glutamate dehydrogenase (encoded by the gdhA gene). In fact, S. thermophilus
was found to possess high GdhA activity, which is NADP-dependent (Chapter 5). Moreover,
wild-type S. thermophilus is known for its glutamate consumption. We deleted the gdhA gene
and characterized the mutant with growth experiments and transcriptomics, to investigate its
involvement in NADPH-generation. These experiments indicate that, contrary to
expectations, the gdhA mutant has a similar growth performance to the wild-type. The mutant
produces mainly lactate and small amounts of formate and acetaldehyde, whereas the wild-
type uses homolactic metabolism for growth optimization. Amino acid measurements
revealed that the gdhA mutant has an increased amino acid consumption which may form an
alternative pathway to generate NADPH for growth. As a reference, we used the well-studied
LAB, Lb. plantarum, which does contain the pentose phosphate pathway. In this reference
strain, we performed a similar glutamate dehydrogenase mutant and the clear difference
between the wild-type and the gdhA mutant was not found for this control organism.
Comparison of the transcriptome profiles between the wild-type and the gdhA mutant of S.

General discussion
153
thermophilus, suggests that metabolic flux through the citrate metabolism (methylcitrate
synthase, aconitate synthase and isocitrate dehydrogenase), was upregulated in the gdhA
mutant (figure 3).
.
Figure 3. Projection of significantly affected genes (average FDR<0.05 and FC>1.25) on part of the metabolic
map of the genome-scale model of S. thermophilus. Red colored reactions are up-regulated in the gdhA mutant
compared to the wildtype. The size of the triangles signifies the relative up- or down-regulation of the genes
associated with the metabolic pathway.
Isocitrate dehydrogenase was the second alternative NADHP generating pathway, as
predicted by our metabolic model. In agreement with the observed upregulation of genes
encoding the enzymes of this pathway, the gdhA knock-out has retained isocitrate
dehydrogenase activity (icdh) and increased citrate consumption as well. This shows the
importance of citrate as an alternative source of NADPH. Citrate is also present in milk (7-11
mM) and S. thermophilus might be adapted to the presence of citrate. The transcriptome data
also showed an up-regulation of genes involved in various amino acid converting pathways,
which was also in agreement with increased amino acid consumption by the mutant and the

Chapter 6
154
increased ammonia production. As revealed by comparative genomics, the absence of a
complete PPP is not unique to S. thermophilus, but a common feature among Streptococci.
Concluding remarks and future perspectives
This thesis has shed light on the amino acid metabolism of LAB, in particular L. lactis,
Lb. plantarum and S. thermophilus. It has shown the importance of the comparative approach
to study the differences in amino acid metabolism. Comparative genomics was used for two
main reasons: (i) the availability of complete genomes enabled us to identify sets of orthologs
involved in amino acid metabolism (10) (ii) comparison of complete genomes not only
showed which genes are present, but also which ones are absent (16). The research described
in this study deals with the analysis of extensive amino acid metabolism of S. thermophilus
and its potential to produce a varied amount of flavors. The amino acid metabolism of S.
thermophilus is rather extensive as compared to that of the other LAB. Since more and more
genomes are sequenced, this comparative approach can be expanded to study more strains and
species, allowing for the comparison of different features. Comparative metabolomics can
also be applied to study mixed cultures of bacteria and eukaryotes. For instance some beer
consortia consist of LAB and yeasts. In addition, some type of cheeses such as Brie,
Camembert and Roquefort, are fermented by the combined action of LAB and fungi. It would
be of interest to study their interaction by comparative ~omics techniques which will
ultimately lead to a better understanding of their (combined) metabolism and the flavor
profile. Other examples of industrially relevant topics that can be studied and compared
include the production of vitamins, flavors or antimicrobials, growth requirements and
possible probiotic properties. Nowadays, much attention is given to the contribution of food
and dietary habits to public health, especially since the prevalence of welfare related diseases
is increasing (31). From this point of view, probiotic properties of LAB can be relevant and
important. Strains that are marketed as probiotic, can confer a health benefit in the host (9).
As was shown in this study, some important properties can only be revealed and appreciated
when a comparative approach is used. This can also be the case when searching for probiotic
properties of different LAB with known genomes. This was realized by the genomic
comparison of different Lb. plantarum strains, revealing the presence of a large number of

General discussion
155
genes located in so-called ‘lifestyle adaptation islands’ predicted to be involved in niche-
specific, and possibly probiotic, functions (15).
One of the striking characteristics of S. thermophilus is its fast growth. When grown in
a rich medium it can have a doubling time of as low as 10 minutes although total biomass
production is not very high (23). Based on the insights gained in this study, we can speculate
about this typical growth behavior. One possible explanation can be that the high growth rate
is a result of excessive loss of unnecessary gene functions. This is supported by the
observation that S. thermophilus has the highest number of pseudogenes compared to other
LAB. Moreover, a clear example of gene loss is the absence of a complete pentose phosphate
pathway, the maintenance of which probably costs too much energy and is therefore less
efficient than obtaining NADPH via other pathways (Chapter 5). Alternatively, fast growth
can be considered from the competition point of view as S. thermophilus is often co-cultivated
with Lb. bulgaricus for the production of yoghurt. Transcriptome analysis of this mixed
culture showed in S. thermophilus a strong up-regulation of peptide transporters. This study of
the mixed culture also revealed an up-regulation of the biosynthesis of the sulfur amino acids
and up-regulation of the cycling of the folate genes, correlated with the production of purines
(26). Our transcriptome data (Chapter 4) obtained from S. thermophilus during growth on a
restricted medium also showed an up-regulation of the biosynthesis of the sulfur amino acids
and the biosynthesis of tetrahydrofolate in S. thermophilus. Transcriptome analysis of an S.
thermophilus gdhA mutant also showed an up-regulation of amino acid metabolism and some
transporters. S. thermophilus has an extensive amino acid metabolism that is combined with a
simple, non flexible primary metabolism. Therefore, it seems logical that the amino acid
metabolism in S. thermophilus is more affected by different growth conditions than the
primary metabolism. The consequence of the fast growth is that S. thermophilus has to
choose a metabolic pathway that is suitable for this growth behavior.
Growth on a medium with only the two restricted amino acids (histidine and cysteine)
was also simulated with our genome-scale model. These simulations exposed a redox problem
but this could be solved by incorporating additional oxygen. Fermentation experiments also
showed that during growth on this minimal medium, it was essential to provide air (nitrogen,
oxygen and carbon dioxide) in the headspace. Moreover, the data of Arioli et al (1) also
suggested an important role of CO2 in S. thermophilus physiology and CO2 is also present in

Chapter 6
156
the air headspace. Furthermore, the in silico analysis of growth on minimal medium showed
the accumulation of α-ketoglutarate and this prevented optimal growth. To solve this
problem, an exchange reaction of α-ketoglutarate was added. This solution is artificial but
may correspond to the measured increase in succinate production during growth in minimal
medium, compared to growth on complete medium. To really solve and understand this
problem, more simulations should be performed instead of adding compensating reactions. In
addition, α-ketoglutarate concentrations in fermentation samples from growth on both
complete and minimal need to be determined in order to validate the model.
We observed a remarkable species-specific distribution of the pentose phosphate
pathway and glutamate dehydrogenase. S. thermophilus lacks a complete pentose phosphate
pathway, but it has a NADP-dependent glutamate dehydrogenase activity. L. lactis on the
contrary, has a complete pentose phosphate pathway but it does not exhibit glutamate
dehydrogenase activity. Lb. plantarum as a third partner in the present comparative study has
both a complete pentose phosphate pathway and glutamate dehydrogenase activity. In
Chapter 5 we describe the study of a gdhA mutant in S. thermophilus, which was found to
have an increased amino acid uptake and ammonia production in comparison with the wild-
type strain. Furthermore, the citrate pathway was up-regulated. A knock-out of gdhA was also
constructed in Lb. plantarum but this mutant did not show a clear phenotype. The effect of the
knock-out in this bacterium is expected to be different than for S. thermophilus probably
because Lb. plantarum has a complete pentose phosphate pathway and specifically needs
gdhA for amino acid and/or flavor biosynthesis, via α-ketoglutarate rather than for NADPH
production. It would be of interest to construct a knock-out of the NADP generating part of
the pentose phosphate pathway in L. lactis and study how this knock-out copes with a
defective pentose phosphate pathway and how NADPH is produced. L. lactis possesses
isocitrate dehydrogenase activity and a pentose phosphate pathway mutant might show an up-
regulation of the citrate pathway, since it does not contain a gdhA gene. A complementary
approach would be to transfer a complete, functional pentose phosphate pathway into S.
thermophilus. Growth and flavor formation of the resulting strain can be compared with the
wild-type. Since the biosynthesis of histidine is coupled to ribose-5-phosphate, the
introduction of a functional pentose phosphate pathway is predicted to have an influence on

General discussion
157
the amino acid auxotrophy of S. thermophilus and it is conceivable that the resulting strain is
able to grow without any supplemented amino acid.
Another relevant engineering approach would be to transfer the extensive flavor
forming pathways from S. thermophilus to other LAB for manipulation of flavor production
in fermented (dairy) products. A more direct way, and this is one recommendation coming
from this thesis, would be to consider S. thermophilus more often as a (thermophilic) cheese
or adjunct starter, also under mesophilic conditions. Nowadays, especially Lactobacilli are
used as so-called adjunct starters to boost flavor production in several cheese varieties.
However, the work described is this thesis showed that S. thermophilus has a broad variety of
industrially relevant properties (such as an extensive amino acid metabolism and many flavor
producing pathways), it is a proper acidifier and it can properly ferment at 30°C, notably, this
temperature is also used for yoghurt production in the Netherlands (personal communication
J. Hugenholtz). These findings all indicate that S. thermophilus could do even better than the
frequently used thermophilic lactobacilli for flavor enhancement in cheese.

Chapter 6
158
References
1. Arioli, S., P. Roncada, A. M. Salzano, F. Deriu, S. Corona, S. Guglielmetti, L.
Bonizzi, A. Scaloni, and D. Mora. 2009. The relevance of carbon dioxide
metabolism in Streptococcus thermophilus. Microbiology 155:1953-1965.
2. Arioli, S., P. Roncada, A. M. Salzano, F. Deriu, S. Corona, S. Guglielmetti, L.
Bonizzi, A. Scaloni, and D. Mora. 2009. The Relevance of Carbon Dioxide
Metabolism in Streptococcus thermophilus. Microbiology.
3. Berg, J. M., J. L. Tymoczko, and L. Stryer. 2002. Biochemistry.
4. Bolotin, A., B. Quinquis, P. Renault, A. Sorokin, S. D. Ehrlich, S. Kulakauskas,
A. Lapidus, E. Goltsman, M. Mazur, G. D. Pusch, M. Fonstein, R. Overbeek, N.
Kyprides, B. Purnelle, D. Prozzi, K. Ngui, D. Masuy, F. Hancy, S. Burteau, M.
Boutry, J. Delcour, A. Goffeau, and P. Hols. 2004. Complete sequence and
comparative genome analysis of the dairy bacterium Streptococcus thermophilus. Nat
Biotechnol 22:1554-1558.
5. Bolotin, A., P. Wincker, S. Mauger, O. Jaillon, K. Malarme, J. Weissenbach, S.
D. Ehrlich, and A. Sorokin. 2001. The complete genome sequence of the lactic acid
bacterium Lactococcus lactis ssp. lactis IL1403. Genome Research 11:731-753.
6. Bongers, R. S., M. H. Hoefnagel, and M. Kleerebezem. 2005. High-level
acetaldehyde production in Lactococcus lactis by metabolic engineering. Appl
Environ Microbiol 71:1109-1113.
7. Bracquart, P., and D. Lorient. 1979. Effet des acides amines et peptides sur la
croissance de Streptococcus thermophilus III. Peptides comportant Glu, His et met.
Milchwissenschaft 34:676-679.
8. Chaves, A. C., M. Fernandez, A. L. Lerayer, I. Mierau, M. Kleerebezem, and J.
Hugenholtz. 2002. Metabolic engineering of acetaldehyde production by
Streptococcus thermophilus. Appl Environ Microbiol 68:5656-5662.
9. FAO/WHO. 2001. Health and Nutritional Properties of Probiotics in Food including
Powder Milk with Live Lactic Acid Bacteria. Report of a Joint FAO/WHO Expert
Consultation on Evaluation of Health and Nutritional Properties of Probiotics in Food
Including Powder Milk with Live Lactic Acid Bacteria. .

General discussion
159
10. Fitch, W. M. 2000. Homology a personal view on some of the problems. Trends
Genet 16:227-231.
11. Garault, P., C. Letort, V. Juillard, and V. Monnet. 2000. Branched-chain amino
acid biosynthesis is essential for optimal growth of Streptococcus thermophilus in
milk. Appl Environ Microbiol 66:5128-5133.
12. Garrigues, C., P. Loubiere, N. D. Lindley, and M. Cocaign-Bousquet. 1997.
Control of the shift from homolactic acid to mixed-acid fermentation in Lactococcus
lactis: predominant role of the NADH/NAD+ ratio. J. Bacteriol. 179:5282-5287.
13. Hols, P., F. Hancy, L. Fontaine, B. Grossiord, D. Prozzi, N. Leblond-Bourget, B.
Decaris, A. Bolotin, C. Delorme, S. Dusko Ehrlich, E. Guedon, V. Monnet, P.
Renault, and M. Kleerebezem. 2005. New insights in the molecular biology and
physiology of Streptococcus thermophilus revealed by comparative genomics. FEMS
Microbiol. Rev. 29:435-463.
14. Jensen, P. R., and K. Hammer. 1993. Minimal Requirements for Exponential
Growth of Lactococcus lactis. Appl Environ Microbiol 59:4363-4366.
15. Kleerebezem, M., J. Boekhorst, R. van Kranenburg, D. Molenaar, O. P. Kuipers,
R. Leer, R. Tarchini, S. A. Peters, H. M. Sandbrink, M. W. Fiers, W. Stiekema,
R. M. Lankhorst, P. A. Bron, S. M. Hoffer, M. N. Groot, R. Kerkhoven, M. de
Vries, B. Ursing, W. M. de Vos, and R. J. Siezen. 2003. Complete genome sequence
of Lactobacillus plantarum WCFS1. Proc Natl Acad Sci U S A 100:1990-1995.
16. Koonin, E. V., and Y. I. Wolf. 2008. Genomics of bacteria and archaea: the emerging
dynamic view of the prokaryotic world. Nucleic Acids Res 36:6688-6719.
17. Letort, C., and V. Juillard. 2001. Development of a minimal chemically-defined
medium for the exponential growth of Streptococcus thermophilus. J Appl Microbiol
91:1023-1029.
18. Makarova, K., A. Slesarev, Y. Wolf, A. Sorokin, B. Mirkin, E. Koonin, A. Pavlov,
N. Pavlova, V. Karamychev, N. Polouchine, V. Shakhova, I. Grigoriev, Y. Lou, D.
Rohksar, S. Lucas, K. Huang, D. M. Goodstein, T. Hawkins, V. Plengvidhya, D.
Welker, J. Hughes, Y. Goh, A. Benson, K. Baldwin, J. H. Lee, I. Diaz-Muniz, B.
Dosti, V. Smeianov, W. Wechter, R. Barabote, G. Lorca, E. Altermann, R.
Barrangou, B. Ganesan, Y. Xie, H. Rawsthorne, D. Tamir, C. Parker, F. Breidt,

Chapter 6
160
J. Broadbent, R. Hutkins, D. O'Sullivan, J. Steele, G. Unlu, M. Saier, T.
Klaenhammer, P. Richardson, S. Kozyavkin, B. Weimer, and D. Mills. 2006.
Comparative genomics of the lactic acid bacteria. Proc Natl Acad Sci U S A
103:15611-15616.
19. Neviani, E., G. Giraffa, A. Brizzi, and D. Carminati. 1995. Amino acid
requirements and peptidase activities of Streptococcus salivarius subsp. thermophilus.
J Appl Bacteriol 79:302-307.
20. Notebaart, R. A., F. H. van Enckevort, C. Francke, R. J. Siezen, and B. Teusink.
2006. Accelerating the reconstruction of genome-scale metabolic networks. BMC
Bioinformatics 7:296.
21. Oliveira, A. P., J. Nielsen, and J. Forster. 2005. Modeling Lactococcus lactis using
a genome-scale flux model. BMC Microbiol 5:39.
22. Pastink, M. I., S. Sieuwerts, F. A. M. de Bok, P. W. M. Janssen, B. Teusink, J.
Van Hylckama Vlieg, and J. Hugenholtz. 2008. Genomics and high-throughput
screening approaches for optimal flavour production in dairy fermentation. Int Dairy J
18:781-789.
23. Pastink, M. I., B. Teusink, P. Hols, S. Visser, W. M. de Vos, and J. Hugenholtz.
2009. Metabolic comparison of lactic acid bacteria; genome-scale model of
Streptococcus thermophilus LMG18311. Appl Environ Microbiol.
24. Price, N. D., J. L. Reed, and B. Palsson. 2004. Genome-scale models of microbial
cells: evaluating the consequences of constraints. Nature reviews 2:886-897.
25. Ross, R. P., S. Morgan, and C. Hill. 2002. Preservation and fermentation: past,
present and future. Int J Food Microbiol 79:3-16.
26. Sieuwerts, S. 2009. Analysis of molecular interactions between yoghurt bacteria by an
integrated genomics approach. PhD-thesis Wageningen University.
27. Teusink, B., F. H. van Enckevort, C. Francke, A. Wiersma, A. Wegkamp, E. J.
Smid, and R. J. Siezen. 2005. In silico reconstruction of the metabolic pathways of
Lactobacillus plantarum: comparing predictions of nutrient requirements with those
from growth experiments. Appl Environ Microbiol 71:7253-7262.
28. Teusink, B., A. Wiersma, D. Molenaar, C. Francke, W. M. de Vos, R. J. Siezen,
and E. J. Smid. 2006. Analysis of growth of Lactobacillus plantarum WCFS1 on a

General discussion
161
complex medium using a genome-scale metabolic model. J Biol Chem 281:40041-
40048.
29. van de Guchte, M., S. Penaud, C. Grimaldi, V. Barbe, K. Bryson, P. Nicolas, C.
Robert, S. Oztas, S. Mangenot, A. Couloux, V. Loux, R. Dervyn, R. Bossy, A.
Bolotin, J. M. Batto, T. Walunas, J. F. Gibrat, P. Bessieres, J. Weissenbach, S. D.
Ehrlich, and E. Maguin. 2006. The complete genome sequence of Lactobacillus
bulgaricus reveals extensive and ongoing reductive evolution. Proc. Natl. Acad. Sci. U
S A 103:9274-9279.
30. Wegmann, U., M. O'Connell-Motherway, A. Zomer, G. Buist, C. Shearman, C.
Canchaya, M. Ventura, A. Goesmann, M. J. Gasson, O. P. Kuipers, D. van
Sinderen, and J. Kok. 2007. Complete genome sequence of the prototype lactic acid
bacterium Lactococcus lactis subsp. cremoris MG1363. J Bacteriol 189:3256-3270.
31. www.etp.ciaa.be.

Chapter 6
162

Nederlandse Samenvatting

Nederlandse samenvatting
164
Nederlandse samenvatting – in lekentaal
Melkzuurbacteriën worden al eeuwenlang gebruikt voor de productie van diverse
levenmiddelen. Voorbeelden hiervan zijn de fermentatie van melk om yoghurt en kaas te
maken en de fermentatie van kool om zuurkool te maken. Melkzuurbacteriën zetten de
aanwezige suikers om in met name melkzuur (vandaar de naam van deze bacteriën). Tijdens
de groei van deze melkzuurbacteriën worden ook andere, interessante voedingsstoffen
geproduceerd, zoals vitaminen en smaakstoffen. Door fermentatie worden de organoleptische
eigenschappen (smaak, textuur) van het beginproduct beïnvloed. Vergelijk bijvoorbeeld maar
melk met kaas; de smaak is anders, het uiterlijk is anders en ook houdbaarheid is verbeterd.
De betere houdbaarheid wordt deels veroorzaakt doordat de verzuring (o.a. melkzuur) de
groei van andere, mogelijk ziekteverwekkende micro-organismen wordt geremd. Daarnaast
produceren veel melkzuurbacteriën antimicrobiële stoffen (zoals nisine) die een verdere
conserverende werking hebben.
Momenteel worden een aantal melkzuurbacteriën ook als probioticum op de markt gebracht.
Deze stammen zouden na inname, een positieve invloed hebben op de gezondheid van de
gastheer, enkele van deze gezondheidsbevorderende eigenschappen zijn: verbetering van het
immuunsysteem en het verkorten van de duur van diaree.
Zoals hierboven al is genoemd, kunnen melkzuurbacteriën de smaak van het uiteindelijke
fermentatieproduct beïnvloeden. Zo smaakt zuurkool anders dan kool en yoghurt anders dan
melk. Er zijn vele verschillende melkzuurbacteriën en zij kunnen, naast de invloed van het
productieproces, elk op hun mannier de smaak beïnvloeden van het gefermenteerde voedsel.
Goudse kaas smaakt bijvoorbeeld heel anders dan Cheddar kaas en ook weer anders dan een
Edammer. Het aminozuurmetabolisme speelt een belangrijke rol in de smaakvorming.
Aminozuren zijn de bouwstenen van eiwitten en melkzuurbacteriën kunnen aminozuren
omzetten of afbreken tot belangrijke smaakstoffen. Echter, niet alle smaakstoffen zijn gewild,
deze kunnen de gefermenteerde producten een vervelende bijsmaak geven. Het is daarom
belangrijk om de productie van smaakstoffen te controleren en dit kan gebeuren door de juiste
bacteriën toe te voegen of door het juiste groeimedium te gebruiken.

Nederlandse samenvatting
165
In hoofdstuk 2 wordt een onderzoek beschreven naar de analyse van smaakvorming door
verschillende melkzuurbacteriën en onder verschillende kweekcondities. De onderzochte
bacteriën zijn Streptococcus thermophilus en Lactobacillus bulgaricus, deze twee bacteriën
worden gebruikt voor de bereiding van yoghurt. We hebben de bacteriën gekweekt op een
industrieel medium, melk, en op een gedefinieerd medium. Tevens hebben we de twee
bacteriën samen gekweekt op melk, als zogenaamde mengculture. Tijdens de groei hebben we
monsters genomen van de ‘headspace’, de gaslaag boven de groeiende culture omdat veel
smaakstoffen vluchtig zijn en in de gaslaag gaan zitten. De headspace monsters zijn
geanalyseerd met een gaschromatograaf. Deze studie liet zien dat tijdens groei op melk andere
smaakstoffen worden gevormd dan tijdens groei op een gedefinieerd medium. Daarnaast is de
smaakvorming van een mengculture niet simpel de optelsom van de smaakvorming van de
twee individuele culturen. Dit laatste waarschijnlijk omdat er allerlei interacties zijn tussen
verschillende stammen, die nog niet helemaal ontrafeld zijn.
Als laatste hebben we computermodellen van verschillende bacteriën gebruikt om te zoeken
naar smaakvormende routes. Met deze modellen kan groei van bacteriën worden gesimuleerd
en kan het gedrag worden bestudeerd, alvorens experimenten te doen.
In hoofdstuk 3 wordt beschreven hoe een computermodel kan worden gemaakt. Allereerst is
de genoomsequentie van een bacterie nodig. Het genoom omvat alle genen van een
organisme. Op basis van de basenvolgorde van dit genoom kan worden gezocht naar bepaalde
eigenschappen. Wij hebben een model ontwikkeld voor de yoghurtbacterie Streptococcus
thermophilus en er waren al modellen beschikbaar van twee andere melkzuurbacteriën,
Lactococcus lactis en Lactobacillus plantarum. Hierdoor konden we niet alleen de drie
bacteriën experimenteel vergelijken, maar ook via theoretische modellen.
Doordat tijdens een vergelijkende studie verschillen en overeenkomsten tussen organismen
aan het licht komen, kan dit soort studies soms meer inzichten geven in het gedrag van een
organisme.
Deze studie bracht naar voren dat Streptococcus thermophilus al het aanwezige suiker
omzet in melkzuur, dat wil zeggen een homofermentatieve groei. Sommige
melkzuurbacteriën kunnen naast melkzuur ook nog kleine hoeveelheden ethanol, azijnzuur en
mierenzuur maken. Het zelf-ontwikkelde metabole model van Streptococcus thermophilus

Nederlandse samenvatting
166
voorspelt ook inderdaad een homofermentatief metabolisme, dit in tegenstelling tot de
bestaande modellen van de andere twee melkzuurbacteriën, die juist een zogenaamde
gemengdzuur metabolisme, met azijnzuur, mierenzuur en ethanol als eindproducten,
voorspellen. Tevens liet deze studie zien dat Streptococcus thermophilus maar twee
aminozuren nodig heeft in het groeimedium en de andere achttien aminozuren zelf kan
maken. Ook is deze bacterie in staat om veel verschillende smaakstoffen te produceren.
Lactococcus lactis en Lactobacillus plantarum daarentegen, hebben respectievelijk 6 en 11
aminozuren nodig in het medium en produceren minder smaakstoffen dan Streptococcus
thermophilus.
De vergelijkende studie van de beschikbare modellen bracht tevens de afwezigheid
van een complete pentose fosfaat route in Streptococcus thermophilus naar voren, dit wordt
verder behandeld in hoofdstuk 5.
In hoofdstuk 4 wordt een vergelijkende studie beschreven naar het effect van een tekort aan
aminozuren op de groei van Streptococcus thermophilus, Lactococcus lactis en Lactobacillus
plantarum. Elk van deze melkzuurbacteriën heeft specifieke aminozuurbehoeften (zie vorige
paragraaf). We hebben de drie bacteriën gekweekt op een gedefinieerd medium met alle
aminozuren (rijk medium) en op een zelfde medium maar dan met een minimal hoeveelheid
aan aminozuren (arm medium).
De groei van Streptococcus thermophilus, Lactococcus lactis en Lactobacillus plantarum is
vervolgens vergeleken en de respons is bestudeerd op DNA niveau met zogenaamde micro-
arrays. Deze studie liet zien dat niet alleen genen betrokken in het aminozuurmetabolisme
anders werden gereguleerd op het arme medium, maar ook genen betrokken bij groei en bij
stress.
Daarnaast hebben we monsters genomen voor de analyse van smaakstoffen en deze studie
liet, zoals verwacht, zien dat op het arme medium minder smaakstoffen worden gevormd dan
op het rijke medium. Een laatste resultaat van deze studie was dat de drie melkzuurbacteriën
op zowel rijk als arm medium, enkel melkzuur als eindproduct maken.
Hoofdstuk 5 behandelt de studie van een glutamaat dehydrogenase mutant van Streptococcus
thermophilus. In hoofdstuk 3 staat beschreven dat deze bacterie geen complete pentose fostaat

Nederlandse samenvatting
167
route heeft. Deze route is belangrijk voor de productie van NADPH, een co-factor die nodig is
voor diverse biosynthese routes. De afwezigheid van een complete pentose fostaat route is
ook experimenteel vastgesteld.
Het model van S. thermophilus is gebruikt om te zoeken naar alternatieve routes die
NADPH kunnen genereren, mogelijke alternatieven waren; glutamaat dehydrogenase en
isocitraat dehydrogenase. De activiteit van beide enzymen is in het lab gemeten en met name
glutamaat dehydrogenase activiteit was overtuigend aanwezig. Het is ook bekend dat
Streptococcus thermophilus glutamaat kan consumeren. Gebaseerd op deze kennis, is besloten
om het gen dat codeert voor glutamaat dehydrogenase uit het genoom te verwijderen. Deze
gdh mutant heeft dus geen glutamaat dehydrogenase activiteit meer.
We hebben een fermentatie uitgevoerd om het wild-type en de gdh mutant van
Streptococcus thermophilus te bestuderen. De mutant produceert net als het wildtype
voornamelijk melkzuur en daarnaast consumeert de mutant citroenzuur (citraat). Tevens werd
er een hogere mate van aminozuur-verbruik gevonden en als gevolg hiervan een toename in
ammonia-vorming. De vorming van smaakstoffen was echter vergelijkbaar tussen het
wildtype en de gdh mutant.
Tijdens de groei van beide stammen, zijn ook monsters genomen voor een micro-array
studie. Met de micro-array kan de respons van organismen op DNA niveau worden bekeken.
Deze studie liet een aantal verschillen zien tussen het wildtype en de gdh mutant. In de gdh
mutant zijn een aantal routes in het aminozuurmetabolisme anders gereguleerd dan in het
wildtype, evenals een aantal routes betrokken bij groei. Tevens is in de gdh mutant de citraat
route (inclusief het eerder genoemde isocitraat dehydrogenase) anders gereguleerd dan in het
wild-type. We hebben ook citraat consumptie gemeten door de gdh mutant, en dit zou erop
kunnen wijzen dat isocitraat dehydrogenase inderdaad NADPH zou kunnen maken.
In hoofdstuk 6 tenslotte, wordt een Engelstalige samenvatting van het uitgevoerde werk
beschreven evenals de eindconclusies. Het werk dat staat beschreven in dit proefschrift, zou
kunnen helpen bij een betere selectie van melkzuurbacteriën voor bestaande (gefermenteerde)
producten en voor de ontwikkeling van nieuwe (gefermenteerde) producten. Tevens geeft dit
werk een beter inzicht in aminozuurmetabolisme en de vorming van smaakstoffen,
belangrijke onderwerpen voor de levensmiddelenindustrie.

Nederlandse samenvatting
168

List of publications
169
List of publications Hinz, S. W., M. I. Pastink, L. A. van den Broek, J. P. Vincken and A. G. Voragen. 2005.
Bifidobacterium longum endogalactanase liberates galactotriose from type I galactans. Appl.
Environ. Microbiol. 71: 5501-5510
Pastink, M. I., B. Teusink, W. M. de Vos, J. Hugenholtz. 2007. Comparative metabolomics
in lactic acid bacteria. J.of Biotechnol. 131 (2S): S196-197
Pastink, M. I., S. Sieuwerts, F. A. M. de Bok, P. W. M. Janssen, B. Teusink, J. van
Hylckama Vlieg and J. Hugenholtz. 2008. Genomics and high-thoughput screening
approaches for optimal flavour production in dairy fermentation. Int. Dairy J. 18: 781-789
Pastink, M. I., B. Teusink, P. Hols, S. Visser, W. M. de Vos and J. Hugenholtz. 2009.
Metabolic comparison of lactic acid bacteria; genome-scale model of S. thermophilus
LMG18311. Appl. Environ. Microbiol. 75: 3627-3633
Siezen, R. J., M. I. Pastink, R. J. W. Brooijmans. Oil-degrading bacteria; the supertanker oil-
spill cleaning crew. Microbiol. Biotech. Submitted for publication
Pastink, M. I., B. Teusink, D. Molenaar, W. M. de Vos and J. Hugenholtz. 2009. Effect of
amino acid quantity on the metabolism of three lactic acid bacteria: a comparative study.
Manuscript in preparation
Pastink, M. I., N. A. L. Flahaut, A. Wiersma, , M. Starrenburg, S. van Hijum, B. Teusink, W.
M. de Vos, J. Hugenholtz L. Fontaine. 2009. The role of glutamate dehydrogenase in
Streptococcus thermophilus. Manuscript in preparation
Pastink M. I., J. Sikkema, W.M. de Vos and J. Hugenholtz. Method for improving flavor
production in a fermented food product. Patent filed.
Gold Elsevier Award, 5th NIZO Dairy Conference, 2007

170

Training and supervision plan
171
Training and Supervision Plan (VLAG) Courses
• Physiology of food associated organisms, VLAG, Wageningen, 2004 • Metabolomics, VLAG, Wageningen, 2005 • Stralingshygiëne 5b, Larenstein, Wageningen, 2005 • Advanced Course Strategic Communication in Biotechnology, Kluyver Centre, Oxford, 2006 • Advanced Course on Applied Genomics of Industrial Fermentation, Kluyver Centre, Wageningen, 2005 • Systems biology, VLAG/CMBI, Nijmegen, 2005 • Food Fermentation, VLAG, Wageningen, 2008 • Probiotics, NIZO food research, Ede, 2007 • Career assesment, Meijer&Meijaard, Wageningen, 2008 • Time planning and project management, WGS, Wageningen, 2006 • Afstudeervak organiseren en begeleiden, WUR, Wageningen, 2006 • Patent course, Kluyver Centre, Wageningen, 2007 • Writing and presenting a scientific paper, WGS, Wageningen, 2007
Conferences • Kluyver Centre for Genomics of Industrial Fermentation symposium (oral and poster presentations), 2005-2009 • 8th international LAB symposium, Egmond aan Zee, (poster presentation), 2005 • 9th international LAB symposium, Egmond aan Zee, (poster presentation), 2008 • 5th NIZO dairy conference, Papendal, (oral and poster presentation), 2007 • 13th European Conference on Biotechnology, Barcelona, (poster presentation), 2007
Optional activities • Training at Université Catholique de Louvain (2009) • Participant PhD study excursion California (2006) • TIFN WE-days (2005-2009, oral presentations) • Organizing social program of spring WE-days (2006) • Teaching and supervision Microbial physiology (2005-2006)

172

About the Author
173
About the Author
Margreet Ineke (Marieke) Pastink was born on the 17th of March 1981 in Amsterdam. After
graduating in 1999 from the Ashram College in Alphen a/d Rijn, she moved to Wageningen
where she studied food science at Wageningen University and Research Centre. She
completed the study with master courses at the departments of Food Microbiology and Food
Chemistry. She also performed research internships at the University of Queensland
(Brisbane, Australia) and at Kerry Bioscience in Naarden. She obtained her Master’s degree
in November 2004. From December 2003 until July 2009, she worked on her PhD studies at
the department of Microbiology from Wageningen University. The research was performed at
NIZO Food Research and was part of TI Food and Nutrition and Kluyver Centre for
Genomics of Industrial Fermentation. The research performed during this period is described
in this thesis.
From August 2009, she is working at SenterNovem as National Contact Point Food within the
European seventh Frame Work Program.

174

Acknowledgements

Acknowledgements
176
Acknowledgements
As I am writing the last chapter of my thesis, I realize that I’m also closing the book
on the 4.5 years of my PhD-life. Although only my name is on the cover of this thesis, I could
never have accomplished all the work without the help my colleagues, friends and family.
Before I move on to open the chapter of a new book, I would therefore like to pause for a
moment and acknowledge the contributions and support of all of you. I’ll only mention a few
people names, as otherwise I would have to make a very long list of names in which I may
forget to mention some.
First of all, my supervisors Jeroen and Willem, thank you for your trust and the
opportunity to start as PhD-student, in the first place. Jeroen, thanks for the freedom that you
gave me to find my own way (although sometimes bumpy) in the project. This stimulated me
to take my own decisions. I also would like to thank you for the quick corrections of my
manuscripts. I enjoyed our Friday morning meetings, together with Lehninger.
Willem, thank you for all your good ideas and suggestions you have offered during all these
years. Your insights and critical views have been very valuable. Furthermore, I’d like to
express my gratitude to both of you for your understanding while I was recovering from the
three surgeries on my leg.
Bas, although you were not an official supervisor, you’ve always stayed involved with
my project, even after you moved to Amsterdam. I learnt a lot from your modelling
experience and your inspirational remarks, thanks for that.
Roommate Patrick, during our time together I have had a growing appreciation for
your practical skills and want to thank for all the help in the lab and also for the pleasurable
atmosphere and background music in A225. Furthermore, thanks for the design of the cover,
it looks really good. I hope I have shown my appreciation by choosing you as my paranymf.
Sanne, working with you as supervisor during your internship was a pleasure. For me
it was a valuable experience and I’m happy that we’re still in touch.
Marjo, you have done a lot for me during all the many fermentation and array
experiments we had to run, I learnt a lot from you.
Part of my PhD studies were spent in the lab of Prof. Pascal Hols in Louvain-la-
Neuve. Pascal, thank you very much for the opportunity to work in your lab. Laetitia, thanks

Acknowledgements
177
for everything you taught me about the genetics of S. thermophilus. Furthermore I would like
to thank all the people in the lab for their help and nice evenings in the pub. Merci beaucoup!
My colleagues at NIZO, thank you all for the many good ideas, help and pleasant
atmosphere during the meetings, breaks and in the labs. I had a very good time at NIZO,
thanks to all of you. The dinners, drinks in the Irish pub and the-girls-only sauna visits after
working hours, were always very enjoyable (and relaxing).
My colleagues from the TI Food and Nutrition and the Kluyver Centre; I have good
memories of useful meetings, informative courses and the WE-days. Furthermore, I’d like to
thank my colleagues from the Microbiology department for the unforgettable California PhD-
trip. As for the first chapter in my new book, even though I only just started a few months ago
at the EG liaison office from SenterNovem, I can say that I already feel at home, thanks to my
new colleagues.
Naast het harde werken is ontspanning erg belangrijk. Daarom wil ik graag mijn
(schoon)familie en vrienden, zowel in binnen- als buitenland, bedanken voor alle afleiding die
jullie mij hebben gebracht. Jullie vriendschap betekent veel voor mij.
Oma’s, bedankt dat jullie van die lieve en zorgzame oma’s voor mij zijn.
Papa en mama, bedankt voor jullie betrokkenheid en voor alles wat jullie voor mij doen. Het
is fijn om te weten dat jullie altijd achter mij staan, en in papa’s geval ook naast mij staan als
paranimf.
Erik&Ceciel en Nynke, bedankt voor alle gezelligheid en plezier die we samen hebben, ik ben
altijd blij om jullie te zien.
Lieve Rob, samen met jou ben ik heel gelukkig. Bedankt voor al je goede zorgen, steun en
relativering. Nu onze beide proefschriften af zijn, beginnen we aan een nieuw hoofdstuk. Ik
kijk met veel plezier uit naar onze toekomst samen in Delft!

178

179

180

181

182

183

184
Printed by GVO drukkers & vormgevers B.V.⏐Ponsen & Looijen
Cover photos: Marke Beerthuyzen and Roger Bongers
Cover design: Patrick Janssen


