Page 1
COMPARATIVE STUDY OF INELASTIC BEHAVIOR OF RC
FRAME WITH AND WITHOUT BRICK INFILL USING
APPLIED ELEMENT METHOD
by
Archanaa Dongre, Pradeep Kumar Ramancharla
in
ISET Golden Jubilee Symposium on Earthquake Engineering(ISET)
Report No: IIIT/TR/2012/-1
Centre for Earthquake EngineeringInternational Institute of Information Technology
Hyderabad - 500 032, INDIAOctober 2012
Page 2
COMPARATIVE STUDY OF INELASTIC BEHAVIOR OF RC
FRAME WITH AND WITHOUT BRICK INFILL
Archanaa Dongre1 and Ramancharla Pradeepkumar
2
Associate Professor, IPEC Ghaziabad, [email protected]
Associate Professor, IIIT Hyderabad, [email protected]
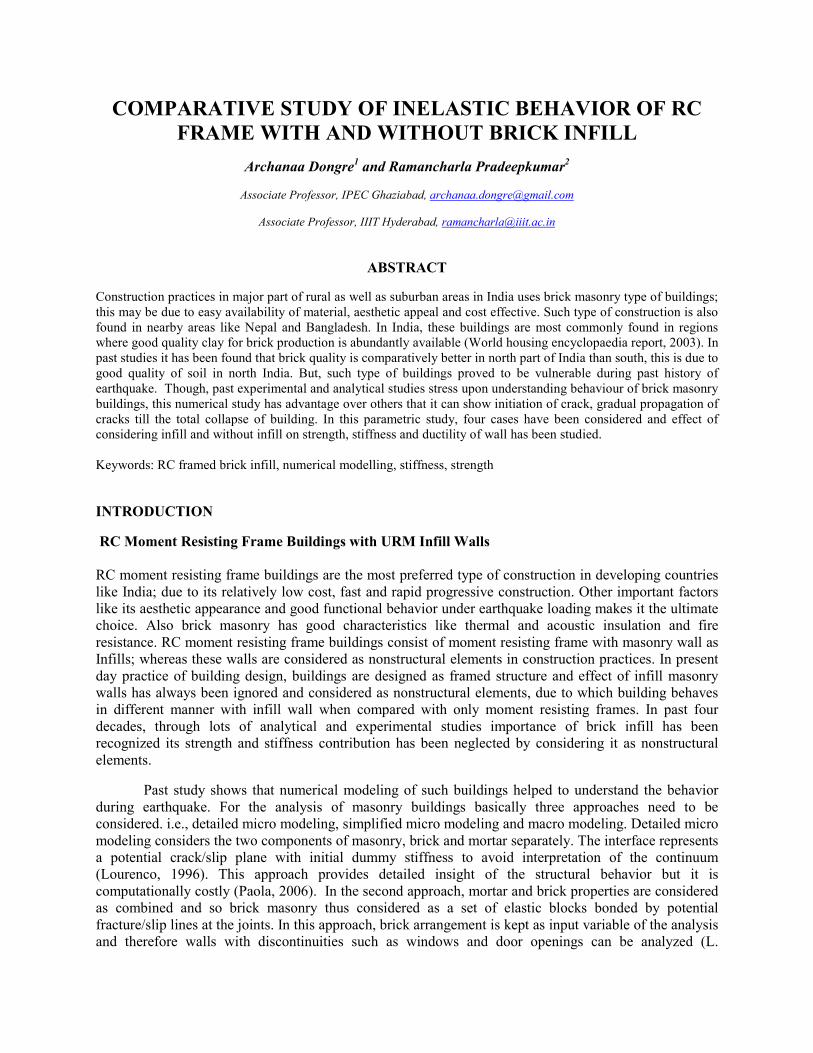
ABSTRACT
Construction practices in major part of rural as well as suburban areas in India uses brick masonry type of buildings;
this may be due to easy availability of material, aesthetic appeal and cost effective. Such type of construction is also
found in nearby areas like Nepal and Bangladesh. In India, these buildings are most commonly found in regions
where good quality clay for brick production is abundantly available (World housing encyclopaedia report, 2003). In
past studies it has been found that brick quality is comparatively better in north part of India than south, this is due to
good quality of soil in north India. But, such type of buildings proved to be vulnerable during past history of
earthquake. Though, past experimental and analytical studies stress upon understanding behaviour of brick masonry
buildings, this numerical study has advantage over others that it can show initiation of crack, gradual propagation of
cracks till the total collapse of building. In this parametric study, four cases have been considered and effect of
considering infill and without infill on strength, stiffness and ductility of wall has been studied.
Keywords: RC framed brick infill, numerical modelling, stiffness, strength
INTRODUCTION
RC Moment Resisting Frame Buildings with URM Infill Walls
RC moment resisting frame buildings are the most preferred type of construction in developing countries
like India; due to its relatively low cost, fast and rapid progressive construction. Other important factors
like its aesthetic appearance and good functional behavior under earthquake loading makes it the ultimate
choice. Also brick masonry has good characteristics like thermal and acoustic insulation and fire
resistance. RC moment resisting frame buildings consist of moment resisting frame with masonry wall as
Infills; whereas these walls are considered as nonstructural elements in construction practices. In present
day practice of building design, buildings are designed as framed structure and effect of infill masonry
walls has always been ignored and considered as nonstructural elements, due to which building behaves
in different manner with infill wall when compared with only moment resisting frames. In past four
decades, through lots of analytical and experimental studies importance of brick infill has been
recognized its strength and stiffness contribution has been neglected by considering it as nonstructural
elements.
Past study shows that numerical modeling of such buildings helped to understand the behavior
during earthquake. For the analysis of masonry buildings basically three approaches need to be
considered. i.e., detailed micro modeling, simplified micro modeling and macro modeling. Detailed micro
modeling considers the two components of masonry, brick and mortar separately. The interface represents
a potential crack/slip plane with initial dummy stiffness to avoid interpretation of the continuum
(Lourenco, 1996). This approach provides detailed insight of the structural behavior but it is
computationally costly (Paola, 2006). In the second approach, mortar and brick properties are considered
as combined and so brick masonry thus considered as a set of elastic blocks bonded by potential
fracture/slip lines at the joints. In this approach, brick arrangement is kept as input variable of the analysis
and therefore walls with discontinuities such as windows and door openings can be analyzed (L.
Page 3
Gambarotta, 1996 and Lourenco, 1996). The third approach is macro modeling, it uses homogenization
techniques which considers masonry as a periodic media i.e. elements arranged in uniform pattern. Two
stages of homogenization are used, one for the orthotropic material and the other for smeared cracking of
the material (Lofti et al, 1994). Macro models are capable to analyze large structures, but it cannot
consider discontinuities and details.
In this study, inelastic response of RC moment resisting framed with un-reinforced masonry Infills is
considered. Four cases are considered in order to understand the capacity of bare frame and infill wall
with and without consideration of reinforcement. A monotonic load has been considered under
displacement control and a base shear versus drift ration relation has been plotted and effect of loading on
strength and stiffness of the wall has been studied.
NUMERICAL MODELING USING APPLIED ELEMENT METHOD
Description
In AEM, structure is assumed to be virtually divided into small square elements each of which is
connected by pairs of normal and shear springs set at contact locations with adjacent elements. These
springs bear the constitutive properties of the domain material in the respective area of representations
(Figure 1). Global stiffness of structure is built up with all element stiffness contributed by that of
springs around corresponding element. Global matrix equation is solved for three degrees of freedom of
these elements for 2D problem. Stress and strain are defined based on displacement of spring end points
of element edges. Details of Applied Element scheme can be found in literatures by Meguro et al (1998).
Discretization for brick masonry:
Anisotropy of the masonry is accounted by considering masonry as a two phase material with brick units
and mortar joint set in a regular interval. Structure is discretized such that each brick unit is represented
by a set of square elements where mortar joints lie in their corresponding contact edges (see Figure 2).
In spring level, springs that lie within one unit of brick are termed as ‘unit springs’. For those springs, the
corresponding domain material is brick as isotropic nature and they are assigned to structural properties of
brick. Springs those accommodate mortar joints are treated as ‘joint springs’. They are defined by
equivalent properties based on respective portion of unit and mortar thickness.
Figure 1 Element shape, contact point and degrees of freedom
Page 4
Figure 2 shows the configuration of brick units, joints and their representation in this study. The initial
elastic stiffness values of joint springs are defined as in Eq. 1 and 2 (Bishnu, 2004).
int
int
; (1)
x t ( )
; (2)
x t ( )
u u mnunit njo
u h m h
u u msunit sjo
u h m h
E t d E E t dK K
a E E a t
G t d G G t dK K
a G G a t
= =+ −
= =+ −
Where Eu and Em are Young’s modulus for brick unit and mortar, respectively, whereas Gu and Gm are
shear modulus for the same. Thickness of wall is denoted by ‘t’ and ‘th’ is mortar thickness. Dimension
of element size is represented by ‘a’ and‘d’ is the fraction part of element size that each spring represent.
While assembling the spring stiffness for global matrix generation, contribution of all springs around the
structural element are added up irrespective to the type of spring. In the sense, for global solution of
problem, there is no distinction of different phase of material but only their corresponding contribution to
the stiffness system.
Masonry material model
Material model used was a composite model that takes into account of brick and mortar with their
respective constitutive relation with elastic and plastic behavior of hardening and softening. Brick springs
were assumed to follow principal stress failure criteria with linear elastic behavior. Once there is splitting
of brick reaching elastic limit, normal and shear stress are assumed not to transfer through cracked surface
in tensile state. The brick spring’s failure criterion is based on a failure envelope given by Eq. 3:
. '
1 (3)b t
b t
f f
f f+ =
Where fb and ft are the principal compression and tensile stresses, respectively, and f’b and f’t
are the uniaxial compression and tensile strengths, respectively.
Figure 2 Masonry discretization: Details of brick unit spring and mortar joint spring
Page 5
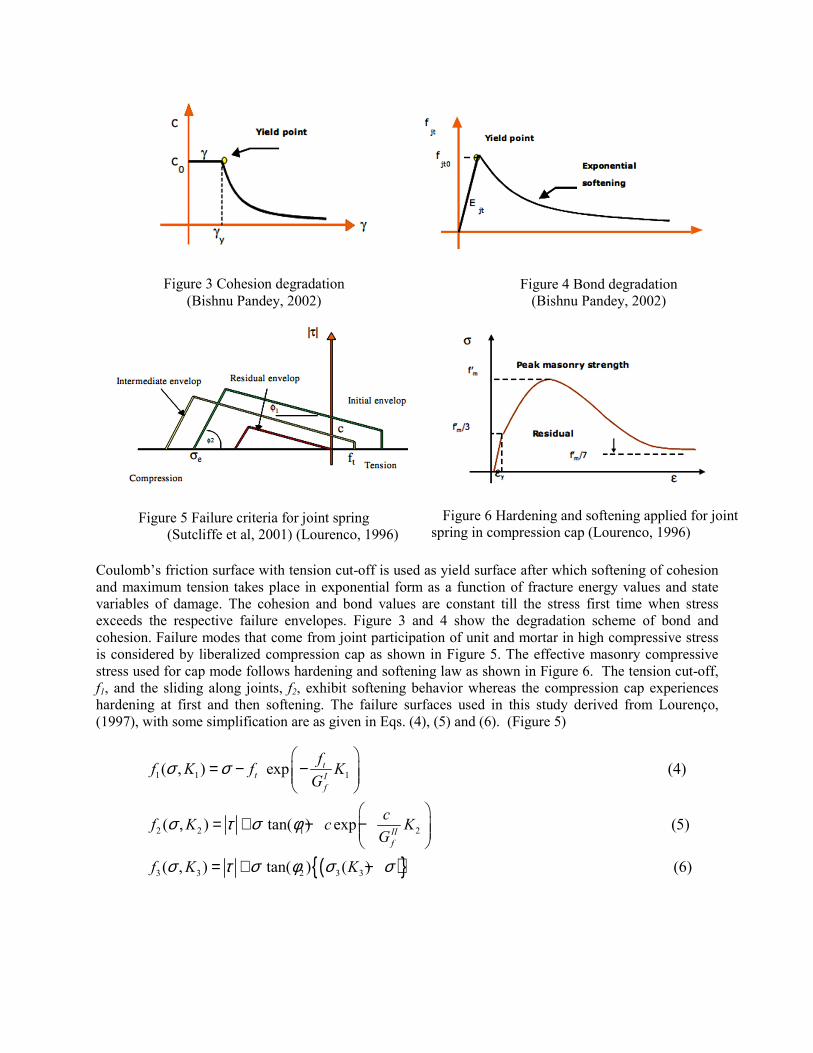
Coulomb’s friction surface with tension cut-off is used as yield surface after which softening of cohesion
and maximum tension takes place in exponential form as a function of fracture energy values and state
variables of damage. The cohesion and bond values are constant till the stress first time when stress
exceeds the respective failure envelopes. Figure 3 and 4 show the degradation scheme of bond and
cohesion. Failure modes that come from joint participation of unit and mortar in high compressive stress
is considered by liberalized compression cap as shown in Figure 5. The effective masonry compressive
stress used for cap mode follows hardening and softening law as shown in Figure 6. The tension cut-off,
f1, and the sliding along joints, f2, exhibit softening behavior whereas the compression cap experiences
hardening at first and then softening. The failure surfaces used in this study derived from Lourenço,
(1997), with some simplification are as given in Eqs. (4), (5) and (6). (Figure 5)
1 1 1
2 2 1 2
( , ) exp (4)
( , ) tan( ) exp
tt I
f
II
f
ff K f K
G
cf K c K
G
σ σ
σ τ σ φ
= − −
= + − −
( ){ }3 3 2 3 3
(5)
( , ) tan( ) ( ) (6)f K Kσ τ σ φ σ σ= + −
Figure 3 Cohesion degradation
(Bishnu Pandey, 2002)
Figure 4 Bond degradation
(Bishnu Pandey, 2002)
Figure 5 Failure criteria for joint spring
(Sutcliffe et al, 2001) (Lourenco, 1996)
Figure 6 Hardening and softening applied for joint
spring in compression cap (Lourenco, 1996)
Page 6
In above equations, K1, K2 and K3 are hardening and softening parameters for tension, shear and
compression behavior respectively. GIf and G
IIf is fracture energy in tension and shear respectively.
Material model for concrete and steel:
As a material modeling of concrete under compression condition, Maekawa compression model
[Okamura and Maekawa, 1991], as shown in Figure 7 (a), is adopted. The tangent modulus is calculated
according to the strain at the spring location and whether the spring is in loading or unloading process.
For more details, refer to [Okamura and Maekawa, 1991]. After reaching the peak compression stresses,
stiffness is assumed as a minimum value (1% of initial value) to avoid having a singular stiffness matrix.
The difference between calculated spring stress and stress corresponding to the strain at the spring
location are redistributed each increment. And for shear springs, model shown in Figure 7 (b) is assumed.
Till the cracking point stresses are assumed to be proportional to strains and after that stiffness is assumed
as minimum value (1% of initial value) to avoid having a singular stiffness matrix. For reinforcement,
bilinear stress strain relation is assumed. After yield of reinforcement, steel spring stiffness is assumed as
1% of the initial stiffness as shown in Figure 7(c). No model is used, up to this stage, for cut of
reinforcement because the behavior of the structure becomes mainly dynamic behavior and the static
stiffness matrix becomes singular.
It should be emphasized that some other failure phenomena, like buckling of reinforcement and spalling
of concrete cover, are not considered in the analysis in this analysis. However, the shear transfer and shear
softening are approximately considered in the analysis. For more details about material models used and
the results in case of monotonic loading conditions, refer to [Meguro and Tagel-din, 2001]
(a) Concrete in Tension and compression (b) Concrete in Shear direction
(c) Steel
Figure 7 Material models for concrete and steel
Page 7
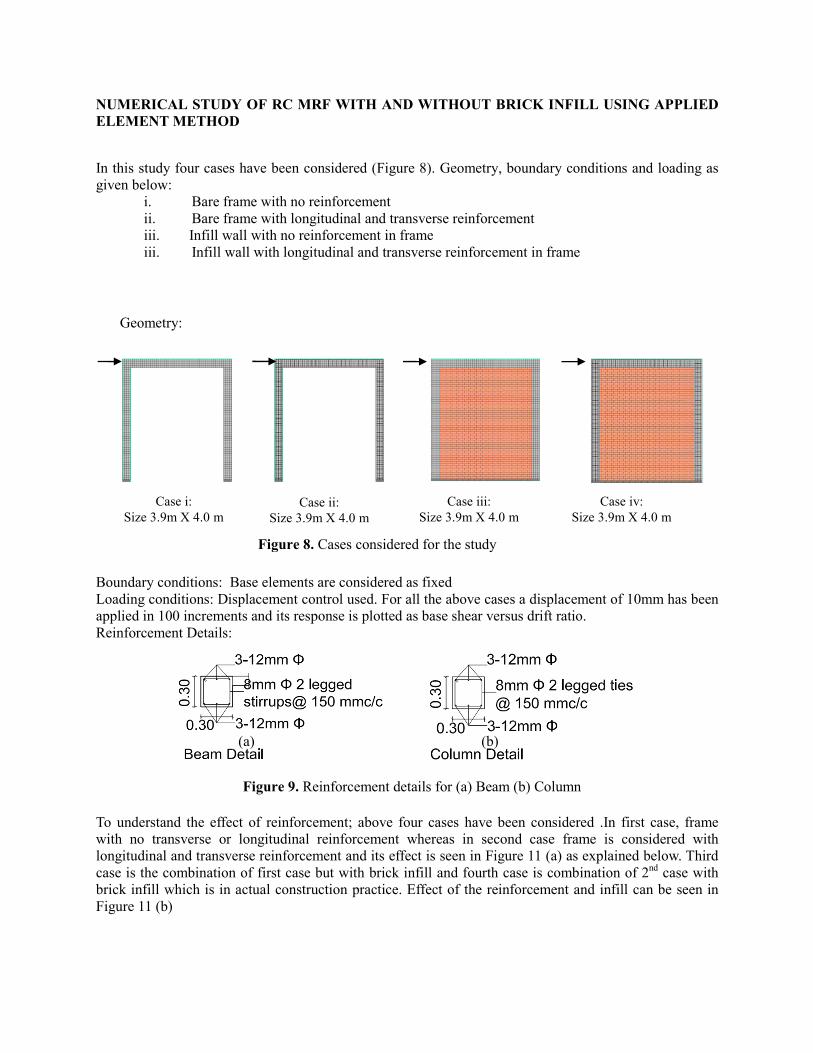
NUMERICAL STUDY OF RC MRF WITH AND WITHOUT BRICK INFILL USING APPLIED
ELEMENT METHOD
In this study four cases have been considered (Figure 8). Geometry, boundary conditions and loading as
given below:
i. Bare frame with no reinforcement
ii. Bare frame with longitudinal and transverse reinforcement
iii. Infill wall with no reinforcement in frame
iii. Infill wall with longitudinal and transverse reinforcement in frame
Geometry:
Boundary conditions: Base elements are considered as fixed
Loading conditions: Displacement control used. For all the above cases a displacement of 10mm has been
applied in 100 increments and its response is plotted as base shear versus drift ratio.
Reinforcement Details:
To understand the effect of reinforcement; above four cases have been considered .In first case, frame
with no transverse or longitudinal reinforcement whereas in second case frame is considered with
longitudinal and transverse reinforcement and its effect is seen in Figure 11 (a) as explained below. Third
case is the combination of first case but with brick infill and fourth case is combination of 2nd
case with
brick infill which is in actual construction practice. Effect of the reinforcement and infill can be seen in
Figure 11 (b)
Figure 9. Reinforcement details for (a) Beam (b) Column
(a) (b)
Case i:
Size 3.9m X 4.0 m Case ii:
Size 3.9m X 4.0 m
Case iii:
Size 3.9m X 4.0 m
Case iv:
Size 3.9m X 4.0 m
Figure 8. Cases considered for the study
Page 8
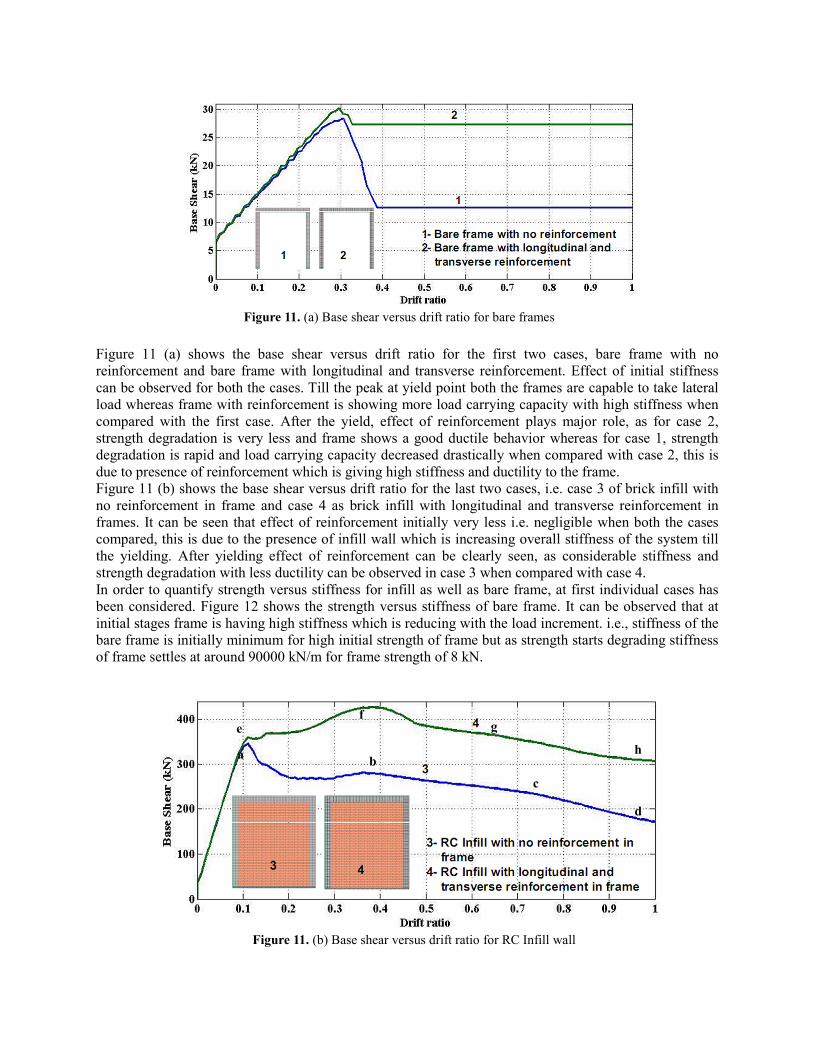
Figure 11 (a) shows the base shear versus drift ratio for the first two cases, bare frame with no
reinforcement and bare frame with longitudinal and transverse reinforcement. Effect of initial stiffness
can be observed for both the cases. Till the peak at yield point both the frames are capable to take lateral
load whereas frame with reinforcement is showing more load carrying capacity with high stiffness when
compared with the first case. After the yield, effect of reinforcement plays major role, as for case 2,
strength degradation is very less and frame shows a good ductile behavior whereas for case 1, strength
degradation is rapid and load carrying capacity decreased drastically when compared with case 2, this is
due to presence of reinforcement which is giving high stiffness and ductility to the frame.
Figure 11 (b) shows the base shear versus drift ratio for the last two cases, i.e. case 3 of brick infill with
no reinforcement in frame and case 4 as brick infill with longitudinal and transverse reinforcement in
frames. It can be seen that effect of reinforcement initially very less i.e. negligible when both the cases
compared, this is due to the presence of infill wall which is increasing overall stiffness of the system till
the yielding. After yielding effect of reinforcement can be clearly seen, as considerable stiffness and
strength degradation with less ductility can be observed in case 3 when compared with case 4.
In order to quantify strength versus stiffness for infill as well as bare frame, at first individual cases has
been considered. Figure 12 shows the strength versus stiffness of bare frame. It can be observed that at
initial stages frame is having high stiffness which is reducing with the load increment. i.e., stiffness of the
bare frame is initially minimum for high initial strength of frame but as strength starts degrading stiffness
of frame settles at around 90000 kN/m for frame strength of 8 kN.
Figure 11. (a) Base shear versus drift ratio for bare frames
Figure 11. (b) Base shear versus drift ratio for RC Infill wall
a b
c
d
e f
g
h
Page 9
Figure 13 clearly shows the effect of infill wall on overall strength of the wall, wall shows high load
carrying capacity above 350 kN till the stiffness of 350000 kN/m but later stages of loading strength starts
degrading but wall still carries a stiffness of 630000 kN/m.
Range of shift in stiffness for bare frame and infill:
Figure 14 shows the stiffness versus displacement applied for bare frame and infill wall, a clear
shift in stiffness can be observed in curve 1 and curve 2 with respect to the displacement applied on
structure. This increase in stiffness in curve 1 is due to the addition of infill wall in frame increased the
stiffness of wall considerably.
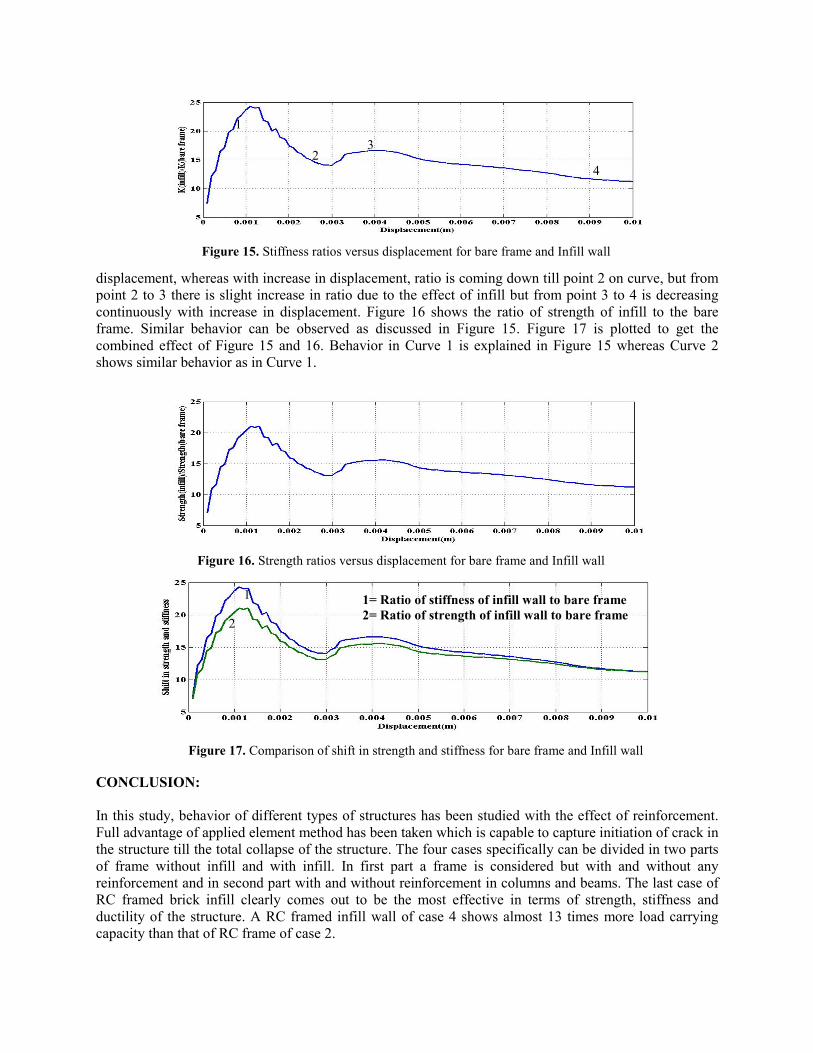
A ratio of stiffness of infill and stiffness of bare frame is plotted in Figure 15 with respect to
displacement applied. Initially this ratio is continuously increasing; at peak (point 1) is 24 at 0.0014m
Figure 13. Strength versus stiffness of Infill wall
Figure 14 Stiffness versus displacement for bare frame and Infill wall
Figure 12. Strength versus stiffness of bare frame
1
2
1= Infill wall
2= Bare frame
Page 10
displacement, whereas with increase in displacement, ratio is coming down till point 2 on curve, but from
point 2 to 3 there is slight increase in ratio due to the effect of infill but from point 3 to 4 is decreasing
continuously with increase in displacement. Figure 16 shows the ratio of strength of infill to the bare
frame. Similar behavior can be observed as discussed in Figure 15. Figure 17 is plotted to get the
combined effect of Figure 15 and 16. Behavior in Curve 1 is explained in Figure 15 whereas Curve 2
shows similar behavior as in Curve 1.
CONCLUSION:
In this study, behavior of different types of structures has been studied with the effect of reinforcement.
Full advantage of applied element method has been taken which is capable to capture initiation of crack in
the structure till the total collapse of the structure. The four cases specifically can be divided in two parts
of frame without infill and with infill. In first part a frame is considered but with and without any
reinforcement and in second part with and without reinforcement in columns and beams. The last case of
RC framed brick infill clearly comes out to be the most effective in terms of strength, stiffness and
ductility of the structure. A RC framed infill wall of case 4 shows almost 13 times more load carrying
capacity than that of RC frame of case 2.
Figure 15. Stiffness ratios versus displacement for bare frame and Infill wall
Figure 16. Strength ratios versus displacement for bare frame and Infill wall
Figure 17. Comparison of shift in strength and stiffness for bare frame and Infill wall
1
2 3
4
1
2
1= Ratio of stiffness of infill wall to bare frame
2= Ratio of strength of infill wall to bare frame
Page 11
REFERENCES:
1. L. Gambarotta and S. Lagomarsino, (1996) “Damage models for the seismic response of brick masonry shear
walls”, Part1: The mortar joint model and its applications, Part2: The continuum model and its applications,
1996
2. Lofti, H.R. Shing, (1994) “Interface model applied to fracture of masonry structures”, J. structure eng., ASCE,
120(1), 63-80
3. Lourenco P. B., (1996), “Computational strategies for masonry structures”, Ph. D. Dissertation, Delft
University of Technology, Delft, The Netherlands
4. Meguro K. and Hakuno M. (1989), “Fracture analyses of structures by the modified distinct element method”,
Structural Eng./Earthquake Eng., Japan Society of Civil Engineers, Vol. 6. No. 2, pp. 283s-294s.
5. Okamura, H. and Maekawa, (1991)., “Nonlinear analysis and constitutive models of reinforced concrete,
Gihodo Co. Ltd., Tokyo
6. Paola Mayorca, (2006), “Report on the state – of-the art in the seismic retrofitting of unreinforced masonry
houses by PP-Band meshes”, 2006
7. Pandey Bishnu et al,(2004), “Simulation of brick masonry wall behavior under in-plane lateral loading using
Applied Element method”, 13th World Conference on Earthquake Engineering, Canada
8. Rots, (1991), “Numerical simulation of cracking in structural masonry”, Project under Computational Masonry
Mechanics
9. Sutcliffe DJ, Yu H.S, Page AW, (2001) "Lower Bound Limit Analysis of Unreinforced Masonry Shear Walls."
Computer & Structures 2001;1295-1312
10. Tagel-Din Hatem and Meguro (2001), A new efficient method for nonlinear, large deformation and collapse
analysis of structures