International Journal of Engineering Science Invention ISSN (Online): 2319 – 6734, ISSN (Print): 2319 – 6726 www.ijesi.org ||Volume 4 Issue 6|| June 2015 || PP.42-51 www.ijesi.org 42 | Page Comparative Study on Non-Linear Analysis of Infilled Frames for Vertically Irregular Buildings G.V. Sai Himaja¹, Ashwini .L.K², N. Jayaramappa³ ¹( M.Tech Structural student, Department of Civil Engineering, TOCE, VTU, Bangalore, Karnataka, India) ²(Assistant Professor, Department of Civil Engineering, TOCE, VTU, Bangalore, Karnataka, India) ³(Assistant Professor, Department of Civil Engineering, UVCE, Bangalore, Karnataka, India) ABSTRACT: The performance of a structural system can be evaluated resorting to non-linear static analysis. This involves the estimation of the structural strength and deformation demands and the comparison with the available capacities at desired performance levels. This study aims at evaluating and comparing the response of thirty reinforced concrete buildings, systems with different with and without infill materials by the use of methodology namely the ones described by the FEMA-273 using nonlinear static procedures, with described acceptance criteria. The methodology is applied to a 4 and 10 storey frames system with and without vertical irregularity, both designed as per the IS 456-2000 and IS 1893-2002 (Part I) in the context of Performance Based Seismic Design procedures. Present study aims towards doing Nonlinear Static Pushover Analysis of G+3 medium rises and G+9 high rises RCC residential building frame which is to be designed by Conventional Design Methodology. A Non-linear Static Analysis (Pushover Analysis) had been used to obtain the inelastic deformation capability of frame. It was found that Ferro cement infilled irregular model 4 (300%) high rises building decrease in deformation or displacement of the building as it’s stiffer than other buildings. KEYWORDS - Base shears, Displacement, Push-over curve, Static Push-Over Analysis, etc. I. INTRODUCTION Over the past twenty decades and more it has been recognized that damage control must become a more explicit design consideration which can be achieved only by introducing some kind of non-linear analysis into the seismic design methodology. Following this pushover analysis has been developed during past decades and more and has become the preferred method of analysis for performance-based seismic design, PBSD and evaluation purposes. It is the method by which the ultimate strength and the limit state can be effectively investigated after yielding, which has been researched and applied in practice for earthquake engineering and seismic design. Non-linear response history analysis is a possible method to calculate structural response under a strong seismic event. However, due to the large amount of data generated in such analysis, it is not preferred practical and PBSE usually involves non-linear static analysis, also known as push-over analysis. The simplified approaches for the seismic evaluation of structures, which account for the inelastic behaviour, generally use the results of static collapse analysis to define the inelastic performance of the structure. Currently, for this purpose, the non- linear static procedure (NSP) or push-over analysis described in FEMA-273, ATC-40 documents are used. However, the procedure involves certain approximations and simplifications that some amount of variation is always expected to exist in seismic demand prediction of push-over analysis. II. MODELING 2.1 General The Push-over Analysis is defined as a non-linear static approximation of the response a structure that will undergo when subjected to static earthquake loading. Because we are approximating the complex static loading characteristic of ground motion with a much simpler monotonically increasing static load, there are bound to be limitations to the procedure. The objective is to quantify these limitations. This will be accomplished by performing the Push-over analysis of reinforced concrete of four and ten stories with and without vertical irregularity with different infills like bare frame, brick infilled frame, Ferro cement infilled frame.
Transcript
International Journal of Engineering Science Invention
www.ijesi.org ||Volume 4 Issue 6|| June 2015 || PP.42-51
www.ijesi.org 42 | Page
Comparative Study on Non-Linear Analysis of Infilled Frames
for Vertically Irregular Buildings
G.V. Sai Himaja¹, Ashwini .L.K², N. Jayaramappa³ ¹( M.Tech Structural student, Department of Civil Engineering, TOCE, VTU, Bangalore, Karnataka, India)
²(Assistant Professor, Department of Civil Engineering, TOCE, VTU, Bangalore, Karnataka, India) ³(Assistant Professor, Department of Civil Engineering, UVCE, Bangalore, Karnataka, India)
ABSTRACT: The performance of a structural system can be evaluated resorting to non-linear static
analysis. This involves the estimation of the structural strength and deformation demands and the comparison
with the available capacities at desired performance levels. This study aims at evaluating and comparing the
response of thirty reinforced concrete buildings, systems with different with and without infill materials by the
use of methodology namely the ones described by the FEMA-273 using nonlinear static procedures, with
described acceptance criteria. The methodology is applied to a 4 and 10 storey frames system with and without
vertical irregularity, both designed as per the IS 456-2000 and IS 1893-2002 (Part I) in the context of
Performance Based Seismic Design procedures.
Present study aims towards doing Nonlinear Static Pushover Analysis of G+3 medium rises and G+9
high rises RCC residential building frame which is to be designed by Conventional Design Methodology. A
Non-linear Static Analysis (Pushover Analysis) had been used to obtain the inelastic deformation capability of
frame. It was found that Ferro cement infilled irregular model 4 (300%) high rises building decrease in
deformation or displacement of the building as it’s stiffer than other buildings.
KEYWORDS - Base shears, Displacement, Push-over curve, Static Push-Over Analysis, etc.
I. INTRODUCTION Over the past twenty decades and more it has been recognized that damage control must become a
more explicit design consideration which can be achieved only by introducing some kind of non-linear analysis
into the seismic design methodology. Following this pushover analysis has been developed during past decades
and more and has become the preferred method of analysis for performance-based seismic design, PBSD and
evaluation purposes. It is the method by which the ultimate strength and the limit state can be effectively
investigated after yielding, which has been researched and applied in practice for earthquake engineering and
seismic design. Non-linear response history analysis is a possible method to calculate structural response under
a strong seismic event.
However, due to the large amount of data generated in such analysis, it is not preferred practical and
PBSE usually involves non-linear static analysis, also known as push-over analysis. The simplified approaches
for the seismic evaluation of structures, which account for the inelastic behaviour, generally use the results of
static collapse analysis to define the inelastic performance of the structure. Currently, for this purpose, the non-
linear static procedure (NSP) or push-over analysis described in FEMA-273, ATC-40 documents are used.
However, the procedure involves certain approximations and simplifications that some amount of variation is
always expected to exist in seismic demand prediction of push-over analysis.
II. MODELING 2.1 General
The Push-over Analysis is defined as a non-linear static approximation of the response a structure that
will undergo when subjected to static earthquake loading. Because we are approximating the complex static
loading characteristic of ground motion with a much simpler monotonically increasing static load, there are
bound to be limitations to the procedure. The objective is to quantify these limitations. This will be
accomplished by performing the Push-over analysis of reinforced concrete of four and ten stories with and
without vertical irregularity with different infills like bare frame, brick infilled frame, Ferro cement infilled
frame.
Comparative Study on Non-Linear Analysis of Infilled Frames for Vertically Irregular Buildings
www.ijesi.org 43 | Page
2.2 Assumed data of G+3 & G+9 RCC frame
This is the basic and the with & without vertically irregular structure of the building having 6 bays in
both the directions and four storeys and ten storey on the ground storey, the dimension of the storey is reduced
after consecutive one storey as shown in the fig.1.The typical storey height and ground storey height is same i.e.,
3.0m. The bay width is 3.5 m. The detail basic specifications of the building are given in the below table:
Table 2.1 Preliminary Assumed data of G+3 & G+9 RCC frame
Sl.no Contents Description
1 No. of storeys G+3,G+9
2 Height of each floor 3.0m
3 Thickness of infill wall 230 mm
4 Imposed load 3 kN/m²
5 Materials Concrete (M25) Reinforcement (Fe415)
6 Size of G+3 columns Storey2,3, interior columns and4allcolumns=250*250 mm
Storey2,3 outer columns = 280*280 mm
Storey 1 all columns = 280*250 mm
7 Size of G+9 columns Storey 2 to 9 outer columns and storey 10 all columns = 250* 250 mm
Storey 2to 9 inter columns = 280*280 mm
Storey 1 all columns = 280*250 mm
8 Size of beam for G+3 and
G+9
230*280 mm
9 Depth of slab 150 mm
10 Specific density RCC= 25kN/m³
Brick =20kN/m³
Ferro cement=22.243kN/m³
11 Modulus of Elasticity Concrete=25000M Pa
Brick=2100M Pa
Ferro cement=4011.06M Pa
12 Seismic zone V
13 Zone Factor 0.36
14 Type of soil Medium
15 Important Factor 1
16 Live load on roof 1.5kN/m²
17 Response reduction factor 5
18 Dead load on frames Brick infill= 12.51kN/m
Ferro cement infill=14.54 kN/m
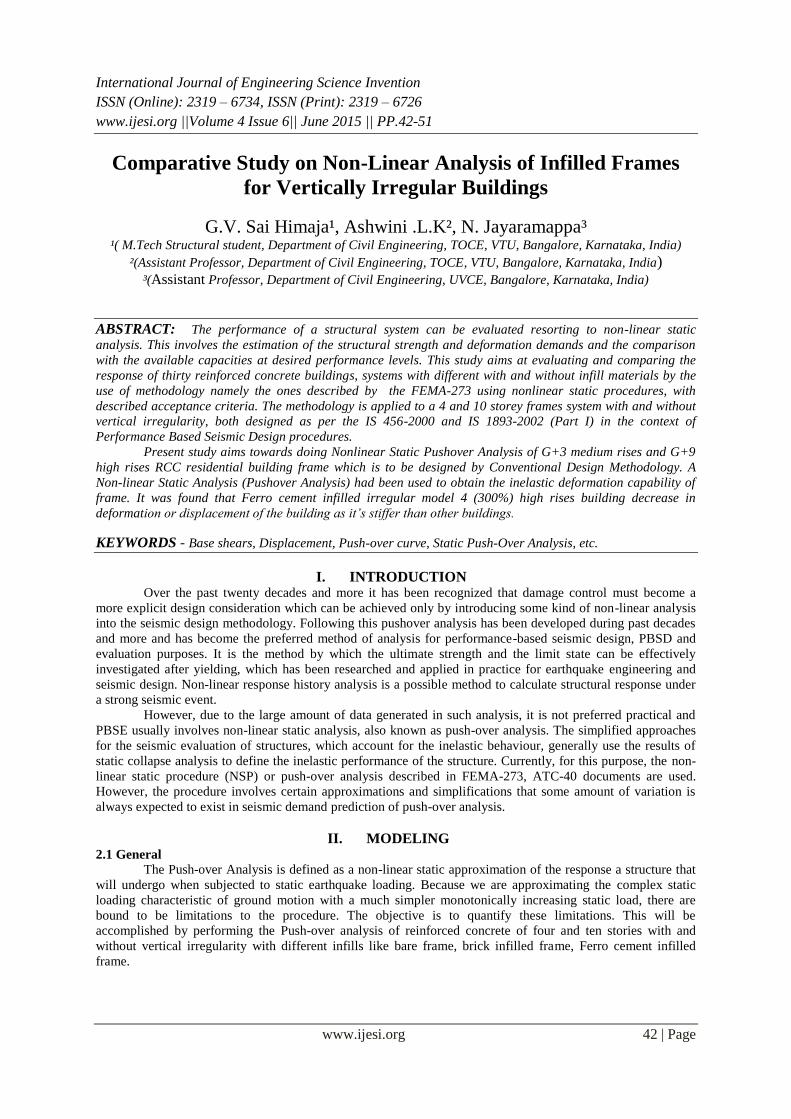
With respect to the above structural & seismic data for modelling the plan of the base model as shown
below. All dimensions are in mm.
Fig.2.1 Base plan
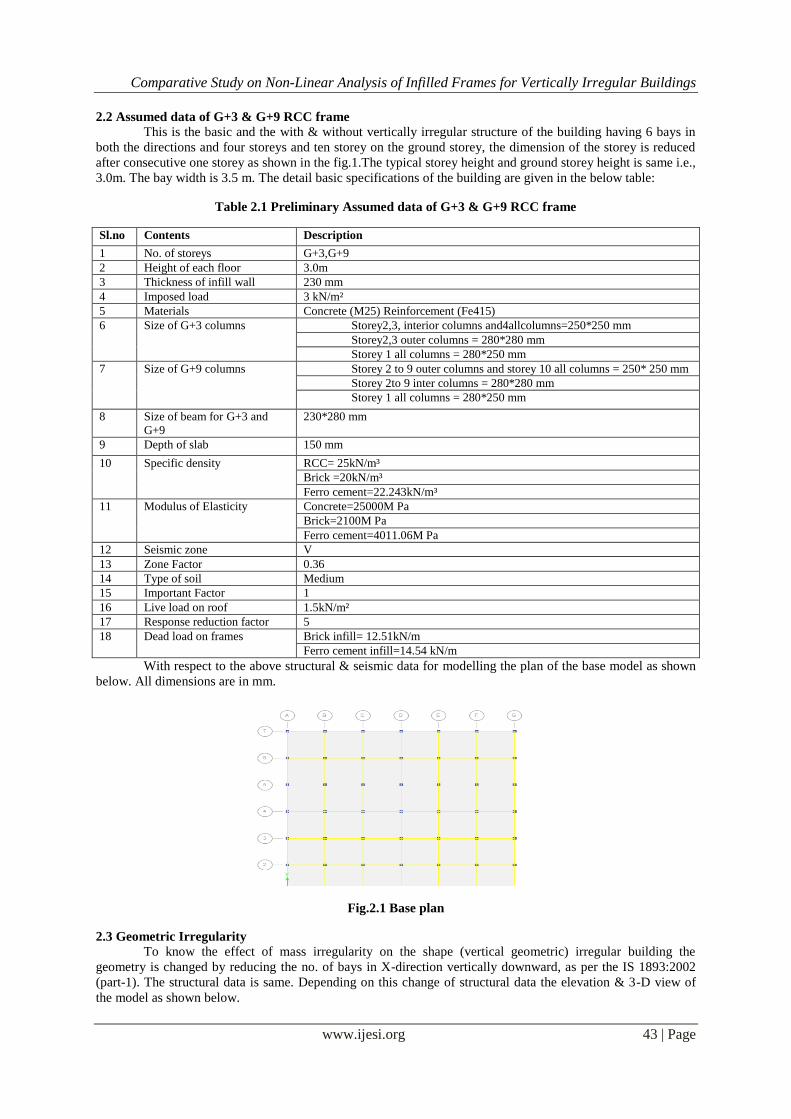
2.3 Geometric Irregularity
To know the effect of mass irregularity on the shape (vertical geometric) irregular building the
geometry is changed by reducing the no. of bays in X-direction vertically downward, as per the IS 1893:2002
(part-1). The structural data is same. Depending on this change of structural data the elevation & 3-D view of
the model as shown below.
Comparative Study on Non-Linear Analysis of Infilled Frames for Vertically Irregular Buildings
www.ijesi.org 44 | Page
Table.2.1 Percentage of Irregularity
Sl. No Designation Type of Frame Percentage irregularity
1 Model 01 Regular 0%
2 Model 02 Irregular 200%
3 Model 03 Irregular 300%
4 Model 04 Irregular 200%
5 Model 05 Irregular 300%
2.3.1 Bare frames 3D & elevation views
Fig 2.2G+3 Bare Frames 3D view
Fig 2.3 G+3 Bare Frames Elevation view
Fig 2.4 G+9 Bare Frames 3D view
Comparative Study on Non-Linear Analysis of Infilled Frames for Vertically Irregular Buildings
www.ijesi.org 45 | Page
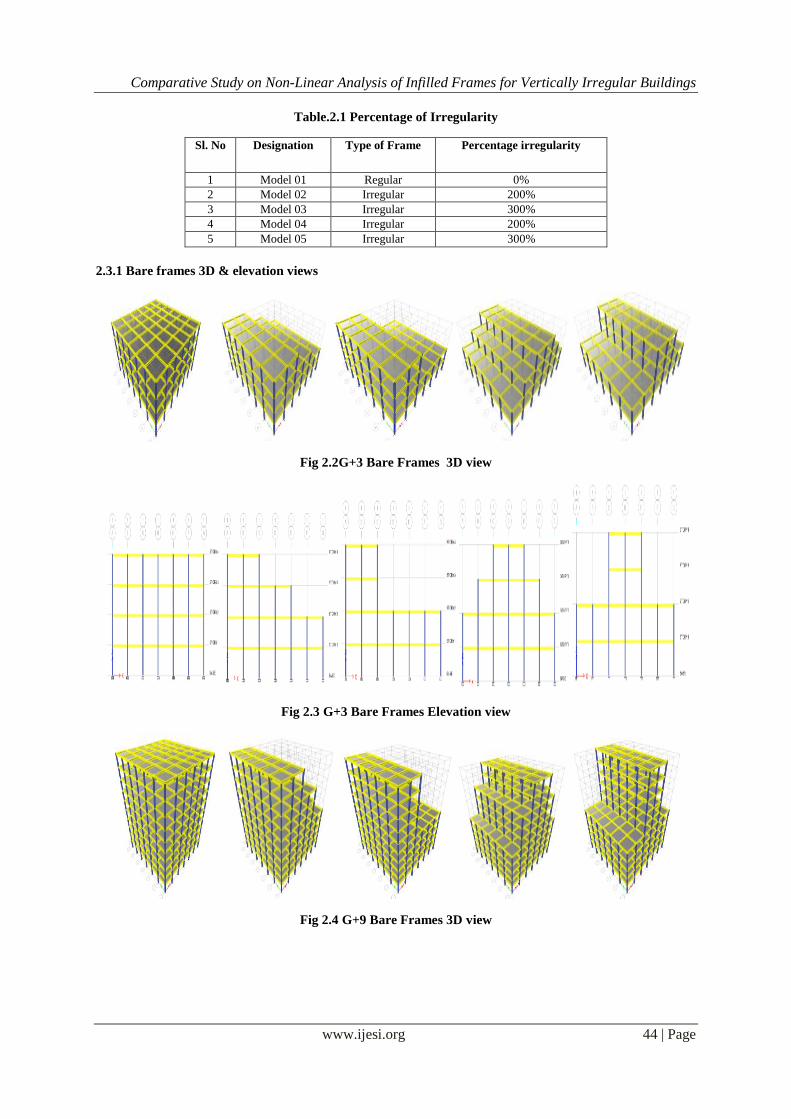
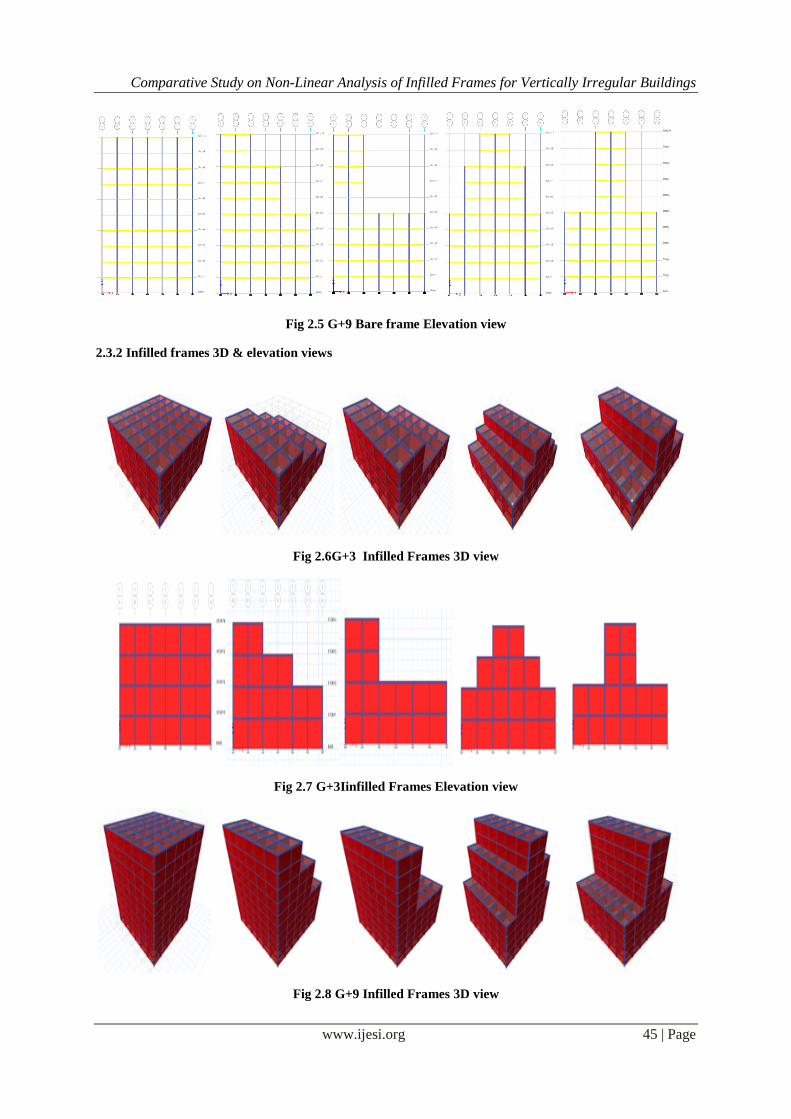
Fig 2.5 G+9 Bare frame Elevation view
2.3.2 Infilled frames 3D & elevation views
Fig 2.6G+3 Infilled Frames 3D view
Fig 2.7 G+3Iinfilled Frames Elevation view
Fig 2.8 G+9 Infilled Frames 3D view
Comparative Study on Non-Linear Analysis of Infilled Frames for Vertically Irregular Buildings
www.ijesi.org 46 | Page
Fig 2.9 G+9 Infilled Frames Elevation view
III. RESULTS AND DISCUSSION Analysis of G+3 and G+ 9 storied bare frame, brick infilled frame, Ferro cement infilled frame models,
with and without vertical irregularity is done using ETABS-2013, from the analysis results obtained for bare
frame, brick infilled frame, Ferro cement infilled frame models with and without irregularity are compared. The
comparison of these results to find effect of vertical irregularity is as below.
3.1 push-Over results
Push-Over analysis is an analytical method in which the structure is subjected to monotonically
increasing lateral forces with an invariant height-wise distribution until a target displacement is reached, and this
method predicts seismic forces and deformation demands for the purpose of performance evaluation of existing
and new structures. For complex problem it is a partial and relatively simple intermediate solution to predict
force and deformation demands imposed on structures and their elements by severe ground motion. Push-Over
analysis is one of the analysis method recommended by Euro code and FEMA-273.
Fig 3.1 Push-Over curve of the model 3 bare frame G+3 building
Comparative Study on Non-Linear Analysis of Infilled Frames for Vertically Irregular Buildings
www.ijesi.org 47 | Page
Fig 3.2 Push-Over curve of the model 3 bare frame G+9 building
Fig 3.3 Push-Over curve of the brick infilled frame G+3 building model 3
Fig 3.4 Push-Over curve of the brick infilled frame G+9 building model 3
Comparative Study on Non-Linear Analysis of Infilled Frames for Vertically Irregular Buildings
www.ijesi.org 48 | Page
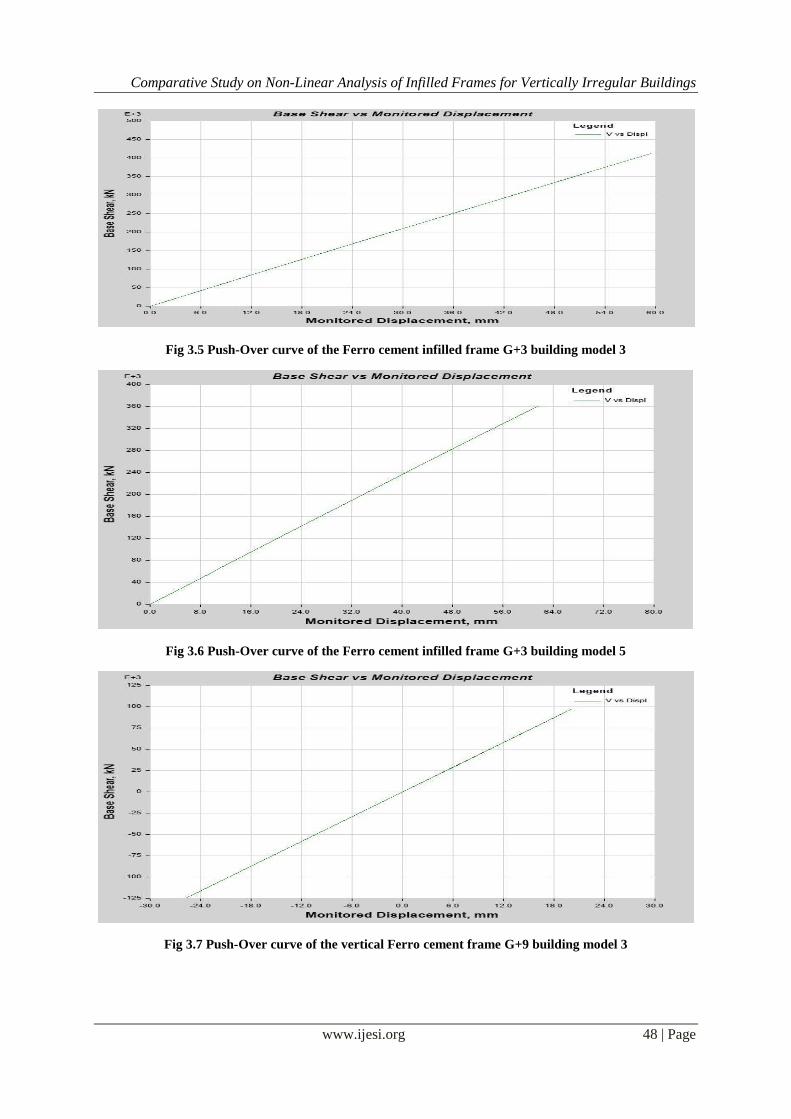
Fig 3.5 Push-Over curve of the Ferro cement infilled frame G+3 building model 3
Fig 3.6 Push-Over curve of the Ferro cement infilled frame G+3 building model 5
Fig 3.7 Push-Over curve of the vertical Ferro cement frame G+9 building model 3
Comparative Study on Non-Linear Analysis of Infilled Frames for Vertically Irregular Buildings
www.ijesi.org 49 | Page
Fig 3.8 push-Over curve of the Ferro cement infilled frame G+9 building model 5
Table 3.1 Max Displacements of the models in mm
Frame type Bare frame Brick infilled frame Ferro cement infilled
frame
G+3 G+9 G+3 G+9 G+3 G+9
Model 1 370 594 48 45.2 35 33.7
Model 2 354 588 70 68.5 59 57.8
Model 3 464 607 79.3 41.6 69 20.1
Model 4 357 590 63.2 47.2 44 46.6
Model 5 462 612 70.8 60.2 62 59.4
Table 3.2 Max Base shears of the models in kN
Frame type Bare frame Brick infilled frame Ferro cement infilled frame
G+3 G+9 G+3 G+9 G+3 G+9
Model 1 2117 1337 19808 11638 25727 14343
Model 2 2125.6 1441 28069 19140 41214 26995
Model 3 2066.8 1458 25729 11953 36413 9731.7
Mode 4 2129.7 1445 27103 13388 33735 21997
Model 5 2080.9 1461 24662 17946 36075 29766
DISPLACEMENT GRAPH OF G+3 IN mm
0
50
100
150
200
250
300
350
400
450
500
Model 1 Model 2 Model 3 Model 4 Model 5
Bare frame
Brick infilled frame
Ferro cement infilled frame
Comparative Study on Non-Linear Analysis of Infilled Frames for Vertically Irregular Buildings
www.ijesi.org 50 | Page
BASE SHEAR GRAPH OF G+3 IN kN
DISPLACEMENT GRAPH OF G+9 IN mm
BASE SHEAR GRAPH OF G+9 IN kN
0
5000
10000
15000
20000
25000
30000
35000
40000
45000
Model 1 Model 2 Model 3 Model 4 Model 5
Bare frame
Brick infilled frame
Ferro cement infilled frame
0
100
200
300
400
500
600
700
Model 1 Model 2 Model 3 Model 4 Model 5
Bare frame
Brick infilled frame
Ferro cement infilled frame
0
5000
10000
15000
20000
25000
30000
35000
Model 1 Model 2 Model 3 Model 4 Model 5
Bare frame
Brick infilled frame
Ferro cement infilled
Comparative Study on Non-Linear Analysis of Infilled Frames for Vertically Irregular Buildings
www.ijesi.org 51 | Page
From the results it is clear that as the bare frames displacement increases the base shear decreases. The
values of the displacement and the base shear are vice versa. And as the height of the building increases the
displacement increases and the base shear decreases.
But in the infilled frames it is like as the displacement of the building increases the base shear of the
building also increases. And as the height of the building increases the displacement and the base shear
decreases. The behaviour of the bare frames is opposite to the infilled frames.
IV. CONCLUSIONS G+3, G+9 with & without vertical irregularity Models are analysed using Standard Software ETABS-
2013,with different infill’s like bare frame, brick infilled frame, Ferro cement infilled frame and the following
conclusions are drawn based on the present study.
1. Bare frame produces more displacement in comparison with brick infill and Ferro cement infill frames.
2. Ferro cement produces least displacement than brick infill and brick infill produces least displacement than
bare frame.
3. Bare frames produces less Base shear than brick infilled and Ferro cement infilled frames.
4. Model 3 (300% irregularity )for the Ferro cement infilled frames produces least displacement compared to
the model 1 (0% irregularity i.e., regular building)
5. Model 2 (200% irregularity) produces max displacement for brick infilled and Ferro cement infilled when
compared to regular building i.e., model 1.
6. Ferro cement infilled frame is highly recommended for model 3 that is vertically irregular to 300% as it
produces least displacement.
REFERENCES [1] ATC-40: Applied Technology Council, “Seismic Evaluation and Retrofit of Concrete Buildings”. [2] FEMA-273: Federal Emergency Management Agency, “NEHRP Guidelines for the Seismic Rehabitation of Building”.
[3] FEMA-440: Federal Mechanics & Management Agency, “Improvement of Non-Linear Static Seismic Analysis Procedure (2004-
2005)”.
[4] IS 456:2000- “Code Of Practice For Plain And Reinforced Concrete” (Fourth Revision).
[5] IS 516-1969: “Methods Of Tests For Strength Of Concrete”.
[6] IS 875 (Part1)-1987: “Code of Practice for Design Loads (Other than Earth Quake) For Building & Structures” (Second Revision). [7] IS 875 (Part2)-1969: “Code of Practice for Design Loads (Other than Earth Quake) For Building & Structures” (Second Revision).
[8] IS 1893 (Part1)-2002: “Criteria for Earth Quake Resistant Design Of Structures”.
[9] Kiran.K.Shetty, K.Anil Hedge, Govind M (2014): “Non-Linear Static Pushover Analysis Of Irregular Space Frame Structure With & Without T Shaped Columns”, International Journal Of Research In Engineering & Technology, Vol.3, Issue.3, NCRIET-2014.
[10] M A M Akberuddin, M Z M Saleemuddin (2013): “Pushover Analysis of Medium Rise Multi-Story RCC Frame with & without
Vertical Irregularity”, International Journal of Engineering Research & Applications, Vol.3, Issue5, Sep-Oct 2013, pp.540-546. [11] Ms. Nivedita N. Raut & Ms. Swathi D. Ambadkar (2013): “Pushover Analysis of Multi-storeyed Building”, Global Journal of
Research in Engineering Civil & Structural Engineering, Vol.13, Issue 4, Version1.
[12] P.B. Oni, Dr.S.B. Vanakudre (2013): “Performance Based Evaluation of Shear Walled RCC Building by Pushover Analysis”, International Journal of Modern Engineering Research, Vol.3, Issue4, Jul-Aug 2013, pp-2522-2525.
[13] R.S.Londhel, D.B. Karwar (2014) “Performance Of RC Framed Structure By Using Pushover Analysis”, International Journal Of
Emerging Technology & Advanced Engineering, Vol.4, Issue6, June 2014. [14] Rupali Kavilkar and Shweta Patil (2014) “Study of High Rise Residential Buildings in Indian Cities”, International Journal of
Engineering and Technology, Vol. 6, No. 1, February 2014.