33
University of Twente Comparing or combining scores from instruments: Linking, equating and statistical inference Cees Glas University of Twente
| Date post: | 03-Apr-2018 |
| Category: |
Documents |
| Upload: | truongngoc |
| View: | 220 times |
| Download: | 2 times |

University of Twente
Comparing or combining scores
from instruments: Linking,
equating and statistical inference
Cees Glas
University of Twente
Outline
The big advantage of IRT: obtaining theta’s on a
common scale using incomplete designs
If we have our theta’s: what can we do with them:
Equating and linking
Statistical inference
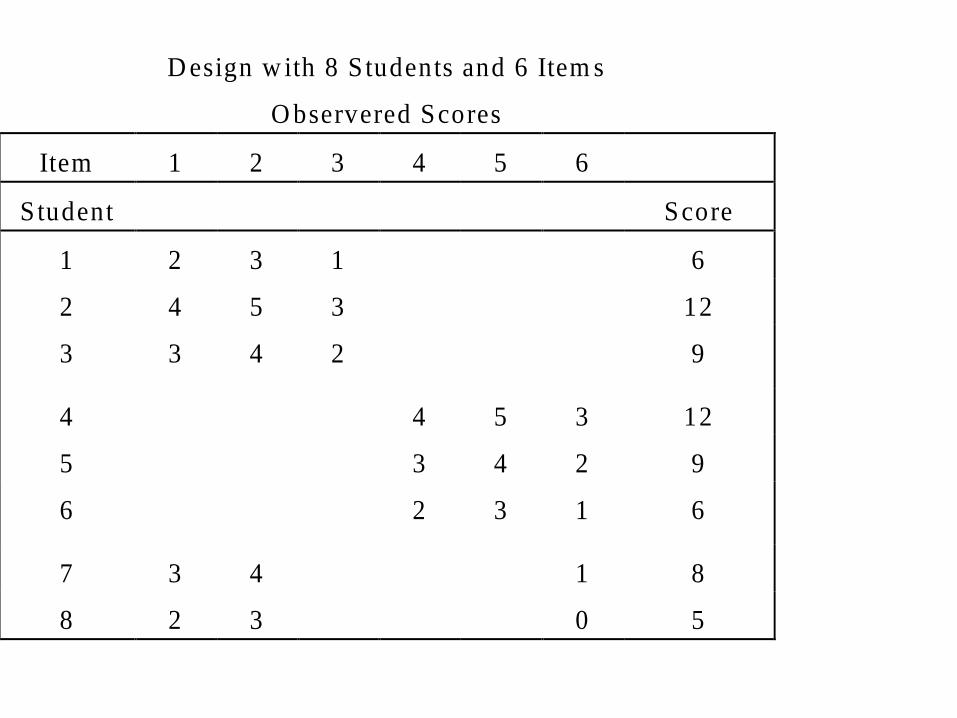
D esign w ith 8 S tudents and 6 Item s
O bservered Scores
Item 1 2 3 4 5 6
Student Score
1 2 3 1 6
2 4 5 3 12
3 3 4 2 9
4 4 5 3 12
5 3 4 2 9
6 2 3 1 6
7 3 4 1 8
8 2 3 0 5

Anchor Item Equating Design

Problems Anchor Item Design
Student ability increases between test administrations due to learning
Difference in ability and item ordering between anchor test and examination due to low motivation of students
If anchor test becomes known, the test functions different over the years
All these effects violate the model and bias the estimates
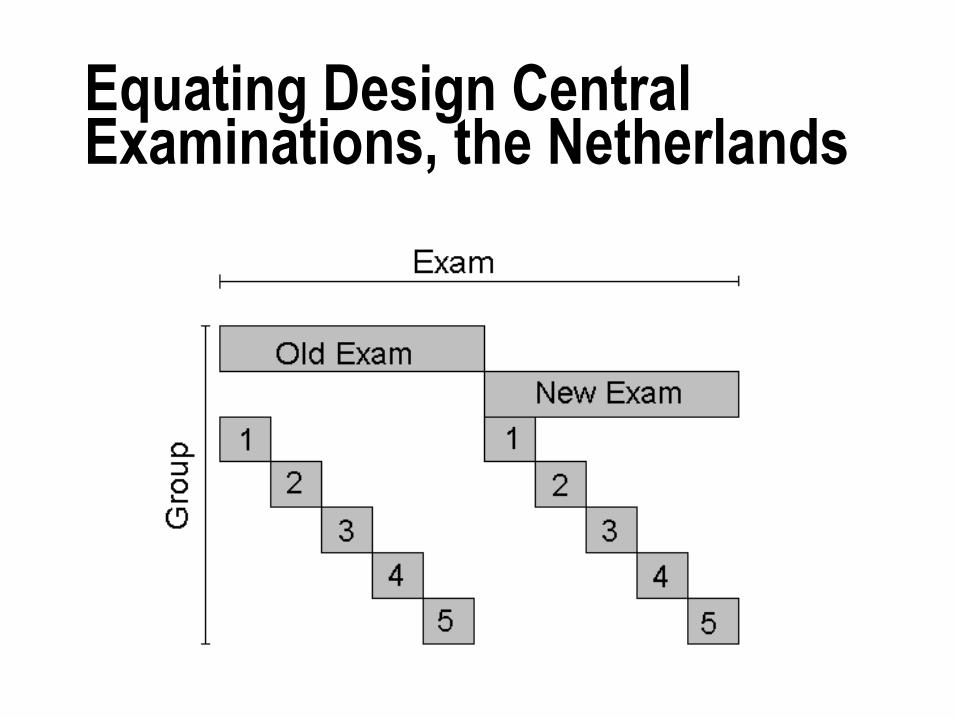
Equating Design Central Examinations, the Netherlands

Equating Design SweSat

Two-stage Testing Design
Extreme case: adaptive testing (CAT) where every
stage consists of one item only

So now we have theta, what are
we going to do with it:
Equating and Linking
Equating
Two tests measure the same construct
We want to find equivalent scores
Linking
Two tests measure different but related constructs
We want to predict one score from the other score

Suppose the Rasch model holds:
Ability Estimates and their reliability
T e s t 1 T e s t 2
s c o r e S E ( ) s c o r e S E ( )
1 - 2 . 3 7 1 . 9 7 3 1 - 1 . 5 3 3 . 9 7 4
2 - 1 . 7 4 7 . 7 7 1 2 - . 9 0 9 . 7 8 1
3 - 1 . 2 8 4 . 6 8 5 3 - . 5 4 6 . 6 9 5
4 - . 8 8 8 . 6 4 5 4 . 1 5 0 . 6 5 5
5 - . 5 1 9 . 6 3 4 5 . 5 1 9 . 6 5 5
6 - . 1 4 9 . 6 4 5 6 . 8 8 8 . 6 3 3
7 . 2 4 7 . 6 8 5 7 1 . 2 8 4 . 6 8 7
8 . 7 1 0 . 7 7 1 8 1 . 7 4 7 . 7 4 5
9 1 . 3 3 3 . 9 7 3 9 2 . 3 7 0 . 9 7 7
1 0 2 . 5 3 4 1 . 8 4 6 1 0 3 . 5 7 0 1 . 8 4 9

Equating using IRT
What if the Rasch model does not hold, and
we use the 2PL, or 3PL, or GPCM, or a
multidimensional IRT model?
Assuming we have a linked design
Several possibilities:
IRT observed score equating
Orlando & Thissen method

IRT observed-score equating
We have frequency distributions
We can estimate frequency distributions
And then we can perform equipercentile
equating
, 0, ...., and , 0, ...., ref new
r ref r newN r K N r K
( | , , , ) and ( | , , , )
( | , , , ) and ( | , , , )
ref new
r ref ref ref ref r new new new new
ref new
r ref ref new new r new new ref ref
E N E N
E N E N


Method Orlando and Thissen (2000)
Compute:
The variance is larger than the variance
obtained using the Rasch model
This indicates the loss of precision due to lack
of model fit
( | ) and ( | )
for 1 and 2
t tE r Var r
t t


Linking
Two tests measure different but related
constructs
We assume a between-items two-
dimensional IRT model.
IRT models:
Joint distribution:
Compute and
1 1 1 2 2 2( | , ) and ( | , )p x p x
1 2 1 2( , ; , , )g
1 2, 2 1 1 2 1 2( | , , , , , )
E r r
1 2, 2 1 1 2 1 2( | , , , , , )
Var r r

Theta in statistical inference
2
1 if person lives urban
0 if person lives rural
i
ix
i
1 1 2 2 1 2 12i i i i i ix x x x ~ (0, )
iN
1
1 if person is male
0 if person is female
i
ix
i
Measurement model: Item responses modeled
by IRT model with person parameter θ
Structural model:

Measurement model and Structural model
, , , , | , | , ik i k i i
i k
p Y X p y p X
Measurement model:
Item response given person
& item parameters
Structural model:
Distributions for person parameters
How to make inferences
Analyze the theta’s in general purpose
software (e.g. SPSS)
Wrong!!
Theta is not an observation but an estimate with a
standard error

How to make inferences
Method 1: Estimate the measurement model with
dedicated software (e.g. MIRT, IRTPRO) and
proceed with the structural model in (e.g. Winbugs)
Method 2: Concurrent Estimate of measurement and
structural model (e.g. Bayesian software: Winbugs)
Method 3: Estimate the measurement model with
dedicated software (e.g. MIRT, IRTPRO), draw
plausible values and analyze these in general
purpose software (e.g. SPSS)

Plausible Values
Estimate the measurement model with dedicated
software (e.g. MIRT, IRTPRO)
Draw 5 (or more) random values from the
posterior distribution of each person’s theta
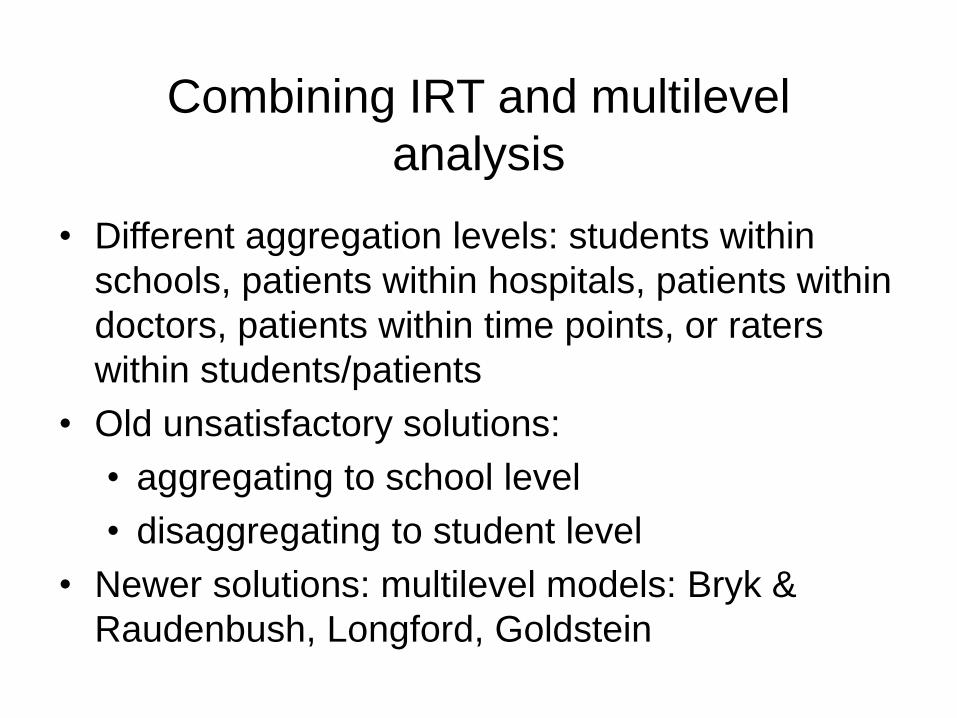
Combining IRT and multilevel
analysis
• Different aggregation levels: students within
schools, patients within hospitals, patients within
doctors, patients within time points, or raters
within students/patients
• Old unsatisfactory solutions:
• aggregating to school level
• disaggregating to student level
• Newer solutions: multilevel models: Bryk &
Raudenbush, Longford, Goldstein

Irt multilevel model (Fox & Glas, 2001, 2003)
0 1
ij j j ij ijx
jjjUz
010000
jjjUz
111101
with
),0(2
Nij
2
110
01
2
0
1
0 ,
0
0
N
U
U
j
j
For time: j becomes t
For raters: j becomes r


Motivation for this approach
All the niceties of IRT are available in
Multilevel Analysis
Method to model unreliability in the dependent and independent variables
Hetroscedasticity: reliability is defined locally
Incomplete test administration and calibration design (possibility to include selection models)
No assumption of normally distributed scores
Less ceiling problems
Software scripts for Winbugs are available

An Example (Shalabi, Fox, Glas, Bosker)
3384 grade seven pupils in 119
schools in the West Bank
Mathematics test
Gender
SES
IQ
School Leadership
School Climate

0ij j ije
0 00 0j ju
2
0
2 2
0
.
MLIRT estimates ML estimates
Estimate C.I. Estimate C.I.
00
Variance components
02
2
Intra-school correlation
0.519
0.211
0.211
0.500
0.357 - 0.672
0.147 - 0.270
0.174 - 0.249
0.519
0.163
0.211
0.435
0.456 - 0.583
0.125 - 0.201
0.209 - 0.219
Model:
Intra-class correlation:
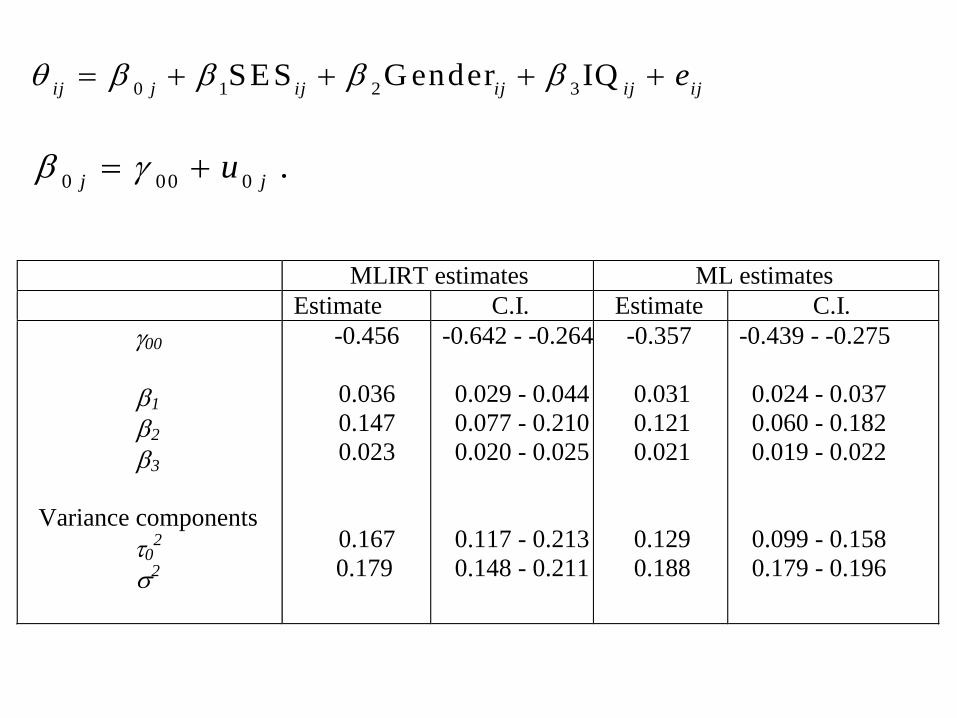
0 1 2 3SES G ender IQ
ij j ij ij ij ije
0 00 0.
j ju
MLIRT estimates ML estimates
Estimate C.I. Estimate C.I.
00
1
2
3
Variance components
02
2
-0.456
0.036
0.147
0.023
0.167
0.179
-0.642 - -0.264
0.029 - 0.044
0.077 - 0.210
0.020 - 0.025
0.117 - 0.213
0.148 - 0.211
-0.357
0.031
0.121
0.021
0.129
0.188
-0.439 - -0.275
0.024 - 0.037
0.060 - 0.182
0.019 - 0.022
0.099 - 0.158
0.179 - 0.196
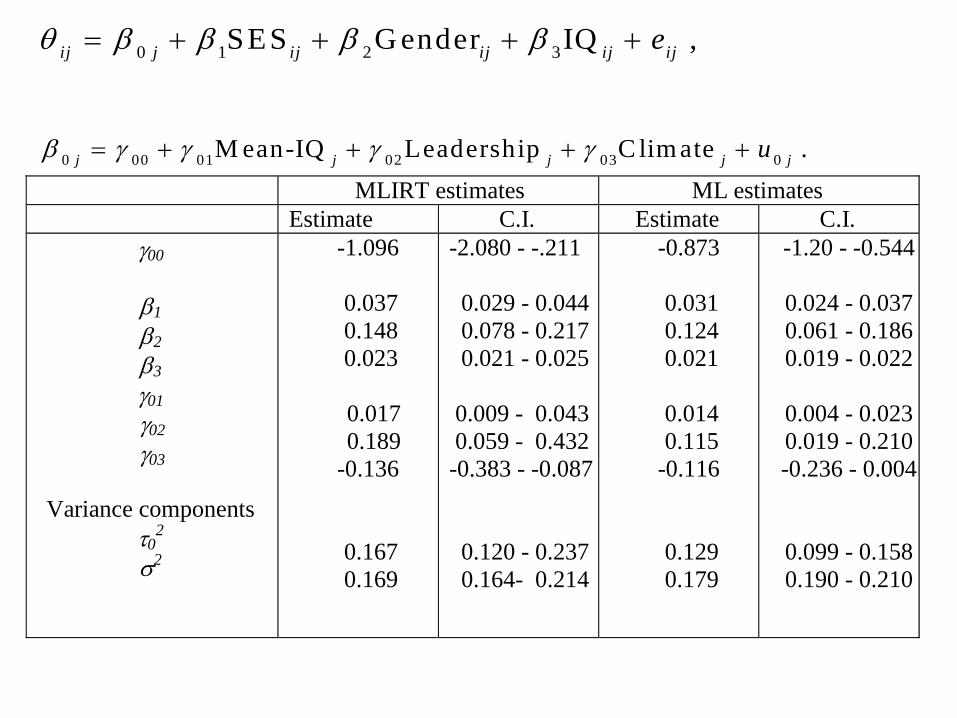
0 1 2 3SES G ender IQ ,
ij j ij ij ij ije
0 00 01 02 03 0M ean-IQ Leadership C lim ate .
j j j j ju
MLIRT estimates ML estimates
Estimate C.I. Estimate C.I.
00
1
2
3
01
02
03
Variance components
02
2
-1.096
0.037
0.148
0.023
0.017
0.189
-0.136
0.167
0.169
-2.080 - -.211
0.029 - 0.044
0.078 - 0.217
0.021 - 0.025
0.009 - 0.043
0.059 - 0.432
-0.383 - -0.087
0.120 - 0.237
0.164- 0.214
-0.873
0.031
0.124
0.021
0.014
0.115
-0.116
0.129
0.179
-1.20 - -0.544
0.024 - 0.037
0.061 - 0.186
0.019 - 0.022
0.004 - 0.023
0.019 - 0.210
-0.236 - 0.004
0.099 - 0.158
0.190 - 0.210

Conclusion
The big advantage of IRT: obtaining theta’s on a
common scale using incomplete designs
If we have our theta’s: what can we do with them:
Equating and linking different measures
Statistical inference, but not as straight forward
as you might expect


