Page 1
1
Comparing Project TIPS Surveys from Conkey &
Clifford Area to Three Other Neighborhoods in
Rochester, NY
March 2014
Pedro Vazquez
Research Assistant
[email protected]
John Klofas, Ph.D.
Director
(585) 475-6386
[email protected]
Center for Public Safety Initiatives
Rochester Institute of Technology
Page 2
2
Summary
By comparing responses to surveys from four different neighborhoods in Rochester, NY,
this paper shows the unique concerns and circumstances residents in the Conkey and Clifford
neighborhood face. Respondents from Conkey and Clifford felt more positively about the people
in their neighborhood than they did about the neighborhood itself, but Conkey and Clifford
respondents felt more negatively about their neighborhood and neighbors than any other
neighborhood surveyed. Conkey and Clifford experiences a higher turnover of residents than
other neighborhoods, with people living in the neighborhood for less time than in other places.
Many of the concerns listed by residents were related to the open-air marijuana market that has
been identified in the area, and this was unique to this neighborhood. Finally, we discuss some
ways that these issues could be addressed by policy or initiatives in the area.
Introduction
This paper presents data from the survey that was conducted in the Conkey and Clifford
neighborhood (see Appendix A) and from Project TIPS surveys that were conducted in the
Parkside Avenue, Jefferson Avenue, and Clinton Avenue neighborhoods. The TIPS (Trust,
Information, Programs, and Services) initiative is coordinated by the City of Rochester and uses
a survey to obtain information from residents in the given neighborhood that is surveyed. For
the purpose of this study, a supplemental survey using two adjective checklists was attached to
the TIPS survey (see Appendix B). The supplemental survey questions consisted of negative and
positive adjectives that are used to obtain information about the resident’s feelings or attitudes
toward their neighborhood and neighbors.
Residents were also asked on the TIPS survey how long they lived in the neighborhood,
whether they rented or owned their home, and to list three features they liked and disliked about
Page 3
3
their neighborhood. The survey was conducted door-to-door during the afternoon, so the
resulting samples are not random and may not be representative of the neighborhood as a whole.
Despite the somewhat small number of residents surveyed in each neighborhood, the resulting
analysis should give valuable insight into the numerous issues within the neighborhoods.
The overall objective of this paper is to compare the Conkey and Clifford neighborhood
with the other three neighborhoods surveyed to consider the impact the open-air marijuana
market has had in the Conkey and Clifford Ave neighborhood compared to the other three
neighborhoods. The paper also discusses the overall issues within these neighborhoods.
Neighborhood Characteristics
The neighborhoods chosen for this study have similarly high rates of poverty and
minority residents. They were chosen because the T.I.P.S (see other CPSI TIPS papers) project
was already having their events in these areas. First, we look at information about these
neighborhoods from the United States Census Bureau and the Federal Financial Institutions
Council. To obtain a good representation of the areas, data is collected at the census tract level
to most closely match neighborhood boundaries.
Even when using the census tracts for the neighborhoods, we still have to take into
account that the census tracts embody a larger area than that of the area surveyed. Also, some
neighborhoods must be represented by one or more census tract numbers. For example, Conkey
and Clifford Ave neighborhood is represented by two, whereas Jefferson Ave neighborhood is
represented by three. To estimate the information for studied neighborhoods, the information
from each census tract for the given area was added up and then divided by the number of
individual census tracts. For example, Conkey and Clifford neighborhood covers two census
tracts (39 and 50). To get the average of household incomes, we added up both households’
Page 4
4
incomes from census tracts 39 and 50 and then divided by 2.
(Example: (Household income: $25,657 (CT-39) + $15,426 (CT-50) = $41,083/2= 20,541 avg.)
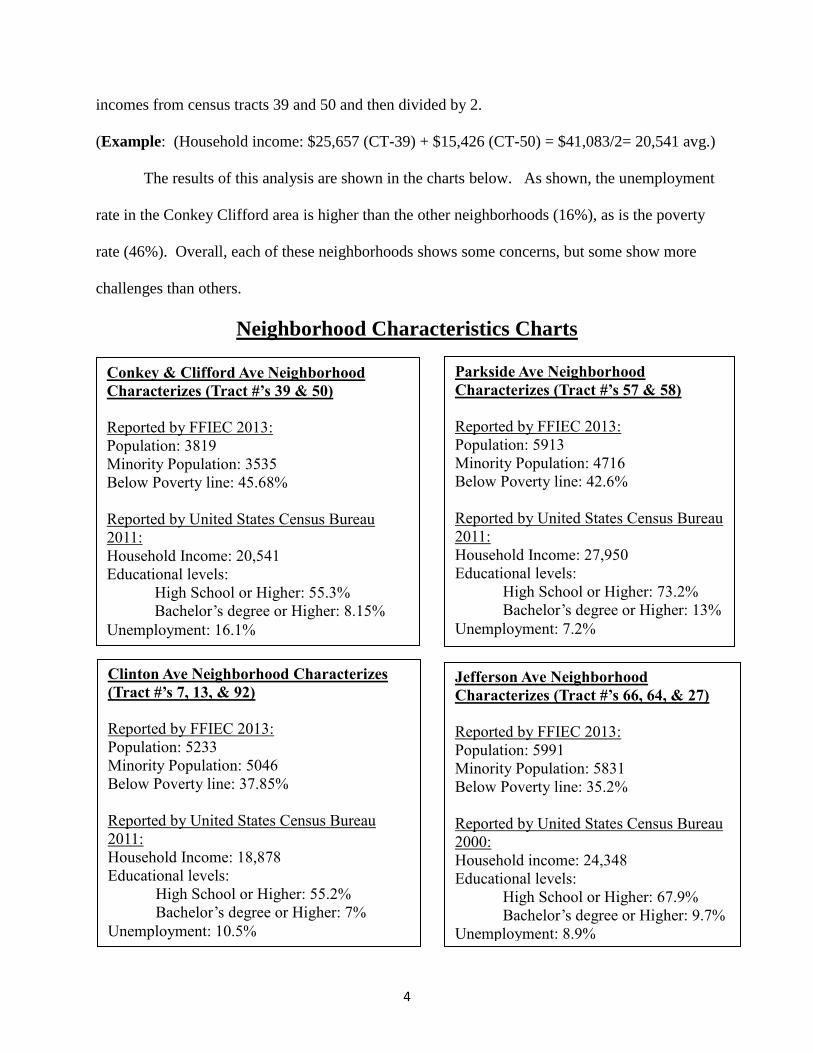
The results of this analysis are shown in the charts below. As shown, the unemployment
rate in the Conkey Clifford area is higher than the other neighborhoods (16%), as is the poverty
rate (46%). Overall, each of these neighborhoods shows some concerns, but some show more
challenges than others.
Neighborhood Characteristics Charts
Conkey & Clifford Ave Neighborhood
Characterizes (Tract #’s 39 & 50)
Reported by FFIEC 2013:
Population: 3819
Minority Population: 3535
Below Poverty line: 45.68%
Reported by United States Census Bureau
2011:
Household Income: 20,541
Educational levels:
High School or Higher: 55.3%
Bachelor’s degree or Higher: 8.15%
Unemployment: 16.1%
Clinton Ave Neighborhood Characterizes
(Tract #’s 7, 13, & 92)
Reported by FFIEC 2013:
Population: 5233
Minority Population: 5046
Below Poverty line: 37.85%
Reported by United States Census Bureau
2011:
Household Income: 18,878
Educational levels:
High School or Higher: 55.2%
Bachelor’s degree or Higher: 7%
Unemployment: 10.5%
Parkside Ave Neighborhood
Characterizes (Tract #’s 57 & 58)
Reported by FFIEC 2013:
Population: 5913
Minority Population: 4716
Below Poverty line: 42.6%
Reported by United States Census Bureau
2011:
Household Income: 27,950
Educational levels:
High School or Higher: 73.2%
Bachelor’s degree or Higher: 13%
Unemployment: 7.2%
Jefferson Ave Neighborhood
Characterizes (Tract #’s 66, 64, & 27)
Reported by FFIEC 2013:
Population: 5991
Minority Population: 5831
Below Poverty line: 35.2%
Reported by United States Census Bureau
2000:
Household income: 24,348
Educational levels:
High School or Higher: 67.9%
Bachelor’s degree or Higher: 9.7%
Unemployment: 8.9%
Page 5
5
TIPS Results: Household Status
On the TIPS survey, residents in each neighborhood were asked how long they have lived
in the neighborhood. In total across all neighborhoods, 250 residents were surveyed. Just under
half of those surveyed lived in their neighborhood for 5 years or less. Under a quarter (20.8%)
lived in their neighborhood for 21 years or more. Across the city, then, there are high rates of
residential turnover in these neighborhoods.
Figure 1 below shows the number of years residents have lived in each of the
neighborhoods. Out of the 42 residents surveyed in the Conkey and Clifford neighborhood,
40.5% reported living in the neighborhood for 3 to 5 years, and 7.1% reported living in the 31
years or more. Overall, this illustrates that out of all these neighborhoods, Conkey and Clifford
shows a higher number of residents living in the neighborhood for less than 10 years. This can
indicate a high turnover among neighbors and lower neighborhood stability in the Conkey and
Clifford neighborhood than other neighborhoods surveyed. Since this area has been identified as
Figure 1
35.7% 11.8%
23.2%
31.1%
40.5%
17.6%
12.5% 22.2%
4.8%
19.6%
23.2%
22.2%
4.8% 13.7%
21.4%
13.3%
7.1% 7.8%
8.0%
6.7%
7.1% 4.4% 11.6% 29.4%
0%
10%
20%
30%
40%
50%
60%
70%
80%
90%
100%
Conkey andClifford Ave N=42
Jefferson AveN=45
Clinton AveN=112
Parkside AveN=51
Pe
rce
nta
ge
Studied Neighborhoods
How long have you lived in the neighborhood? Year=2013 N= 250
31 years or more
21 to 30 years
11 to 20 years
6 to 10 years
3 to 5 years
2 years or less
Page 6
6
having an open-air marijuana market, it is possible that the market is influencing the turnover
among residents or alternately that such markets exist more comfortably in such neighborhoods .
The Parkside Ave. neighborhood seems to have the lowest turnover of neighbors and highest
neighborhood stability, followed by the Jefferson Ave. neighborhood. Clinton Ave., which is
Conkey and Clifford Ave.’s neighbor, also has a lower turnover among neighbors than Conkey
and Clifford Ave.
Combining all residents surveyed in all four neighborhoods, 63.45% reported that they
rented their home, and the remaining 36.6% reported that they owned their home (n=238). A
low percentage of resident home owners is often associated with a high turnover of neighbors
and lower neighborhood stability and could demonstrate a challenge during times when
community cohesion is needed.
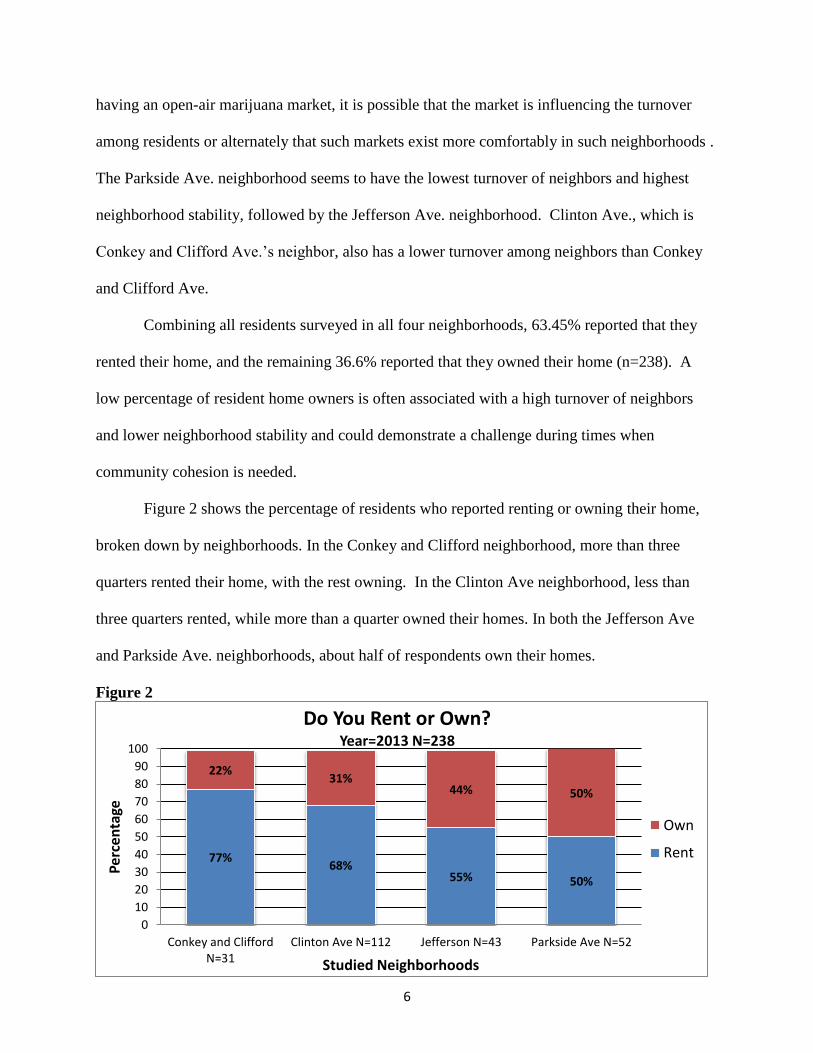
Figure 2 shows the percentage of residents who reported renting or owning their home,
broken down by neighborhoods. In the Conkey and Clifford neighborhood, more than three
quarters rented their home, with the rest owning. In the Clinton Ave neighborhood, less than
three quarters rented, while more than a quarter owned their homes. In both the Jefferson Ave
and Parkside Ave. neighborhoods, about half of respondents own their homes.
Figure 2
77% 68%
55% 50%
22% 31%
44% 50%
0
10
20
30
40
50
60
70
80
90
100
Conkey and CliffordN=31
Clinton Ave N=112 Jefferson N=43 Parkside Ave N=52
Per
cen
tage
Studied Neighborhoods
Do You Rent or Own? Year=2013 N=238
Own
Rent
Page 7
7
In summary, there is lower number of reported home owners in the Conkey and Clifford
Ave. neighborhood. This is often associated with a high turnover of neighbors and lower
neighborhood stability, which may be a cause or effect of the area’s open-air marijuana market.
Descriptions of the Neighborhoods
The residents of all four neighborhoods were also asked to circle adjectives on a list to
describe their neighborhoods and the people in their neighborhoods. These types of questions are
called adjective checklists and provide insight into respondents’ complex feelings about a topic.
Here, we compare the results from the Conkey and Clifford neighborhood to the results from all
three other neighborhoods combined (Jefferson Ave., Clinton Ave., and Parkside Ave.). Figures
3 through 6 show the percentage of respondents from either the Conkey and Clifford
neighborhood or from the other three neighborhoods combined that chose each word.
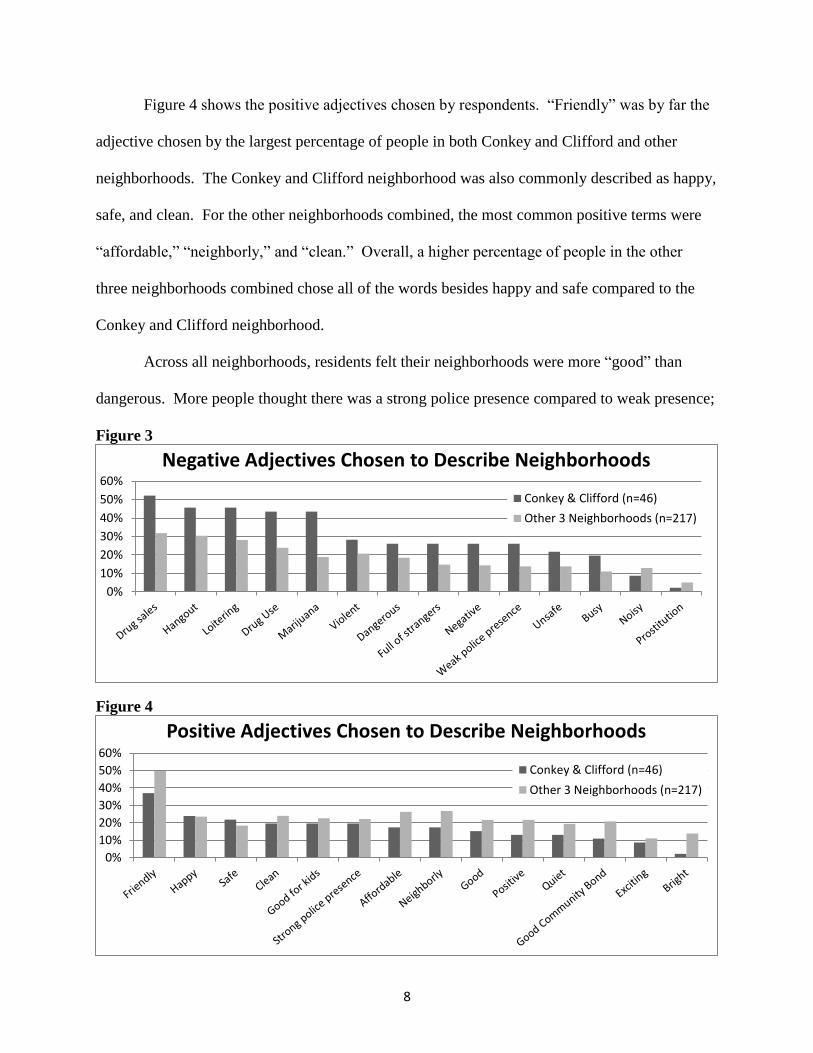
Figures 3 and 4 show which adjectives respondents circled to describe the
neighborhoods. These demonstrate that the residents in all these neighborhoods have a more
negative view of their neighborhoods than a positive view, since a higher percentage of
respondents circled negative words compared to positive. Responses from the Conkey and
Clifford neighborhood followed mostly the same pattern as the other neighborhoods, meaning
that the most-common words chosen were similar across neighborhoods.
The terms “drug sale,” “hangouts,” “loitering,” and “drug use” were the most commonly-
chosen negative words in both Conkey and Clifford and the other neighborhoods combined (see
Figure 3). However, a higher percentage of residents in Conkey and Clifford chose these terms
than in the other neighborhoods combined. These adjectives are associated with what one might
consider a drug-market. “Noisy” and “prostitution” were the only two negative adjectives that
were circled less in the Conkey and Clifford neighborhood.
Page 8
8
Figure 4 shows the positive adjectives chosen by respondents. “Friendly” was by far the
adjective chosen by the largest percentage of people in both Conkey and Clifford and other
neighborhoods. The Conkey and Clifford neighborhood was also commonly described as happy,
safe, and clean. For the other neighborhoods combined, the most common positive terms were
“affordable,” “neighborly,” and “clean.” Overall, a higher percentage of people in the other
three neighborhoods combined chose all of the words besides happy and safe compared to the
Conkey and Clifford neighborhood.
Across all neighborhoods, residents felt their neighborhoods were more “good” than
dangerous. More people thought there was a strong police presence compared to weak presence;
Figure 3
Figure 4
0%
10%
20%
30%
40%
50%
60%
Negative Adjectives Chosen to Describe Neighborhoods
Conkey & Clifford (n=46)
Other 3 Neighborhoods (n=217)
0%
10%
20%
30%
40%
50%
60%
Positive Adjectives Chosen to Describe Neighborhoods
Conkey & Clifford (n=46)
Other 3 Neighborhoods (n=217)
Page 9
9
more people thought it was neighborly compared to “full of strangers.” Residents did indicate
that their neighborhoods were more quiet than noisy. Overall, Figures 3 and 4 show that the
majority of the people who live within in these four neighborhoods have a slightly negative view
of their neighborhood than a positive view. The negative adjectives that were circled by the
residents might demonstrate the activities of an operational drug-market, particularly in the
Conkey and Clifford neighborhood.
Residents were also asked to circle all the adjectives that describe the people who live in
their neighborhoods. Figures 5 and 6 show these results, comparing the Conkey and Clifford
neighborhood results to the results from the other three neighborhoods combined.
Figure 5
Figure 6
0%
10%
20%
30%
40%
50%
60%Negative Adjectives Chosen to Describe People in Neighborhoods
Conkey & Clifford (n=46)
Other 3 Neighborhoods (n=217)
0%
10%
20%
30%
40%
50%
60%Positive Adjectives Chosen to Describe People in Neighborhoods
Conkey & Clifford (n=46)
Other 3 Neighborhoods (n=217)
Page 10
10
Figure 5 shows the negative adjectives. The most commonly circled negative adjectives
among all four neighborhoods were drug dealer, bad, nosy, and distrustful. A much higher
percentage of Conkey and Clifford respondents circled the words “drug dealer” and “bad” to
describe the people in their neighborhood than in the other neighborhoods combined. In fact, a
higher percentage of Conkey and Clifford respondents circled every negative word than residents
from other neighborhoods.
Nonetheless, comparing Figure 5 to Figure 6, a higher percentage of respondents in every
neighborhood, including Conkey and Clifford, circled positive words than negative words. The
adjective “friendly” was circled by far the most, followed by helpful, good, and respectful.
Conkey and Clifford residents chose positive words less often than residents in other areas,
except for friendly, good, and trustworthy. Despite these differences, residents, including those
in Conkey and Clifford, have a more positive feeling about their neighbors than negative.
Next, we examine how many more positive adjectives respondents circled than negative.
In these histograms (Figures 7 through 14), the numbers on the x axis show the difference
between the number of positive and negative responses (i.e. number of positives responses minus
the number of negative responses). The height of the bars show how many respondents answered
in such a way to yield the number on the x axis.
Figures 7 through 10 show these histograms for how residents’ chose words to describe
their neighborhood. For the Parkside Avenue neighborhood, residents circled more positive
adjectives than negative adjectives. The curve in the graph (Figure 10) represents a “Bell Curve”,
which means that there is a normal distribution of responses. Although, the graph represents a
normal curve, the curve’s center is shifted slightly positively. The mean is +1.11, meaning that,
on average, residents circled one more positive word than negative. So, most Parkside Avenue
area residents feel slightly positively about their neighborhood.
Page 11
11
Residents’ Descriptions of their Neighborhoods
Figure 7 Figure 8
Figure 9 Figure 10
Page 12
12
Clinton Avenue residents circled almost the same number of positive and negative
adjectives (see Figure 9). The curve approximates a “Bell Curve”, which means that there is a
normal distribution of the negative and positive response neighborhood. The curve’s center is
shifted slightly very negatively, with a mean of -0.19. Thus, most Clinton Ave. residents feel
slightly negatively, but mostly neutral, about their neighborhood.
Jefferson Ave. residents (Figure 8) circled more positive adjectives than negative,
yielding a mean of +2.17, which means that residents on average circled two more positive
adjectives than negative. The distribution in the graph represents a skewed curve, with a larger
number of responses to the right (positive responses).
The Conkey and Clifford neighborhood responses represent a skewed curve also (see
Figure 7), but this time with a larger number of responses to the left (negative responses). The
mean is -1.82, the lowest of all the neighborhoods studied, meaning that respondents circled
nearly two more negative words than positive words. Therefore, people in the Conkey and
Clifford Ave. neighborhood have a more negative view of the neighborhood. In contrast,
Clinton Ave. residents were mostly neutral, and residents in the Jefferson Avenue neighborhood
and the Parkside Ave. neighborhood view their neighborhoods positively.
Hence, the negative view of residents in the Conkey and Clifford area gives valuable
insight into the issues within the neighborhood. The negative view might be caused by the
ongoing issues surrounding the open-air marijuana market in their area, or other negative factors
may contribute to the continuation of the market. It is clear from the list of concerns residents
made that drug activity in the area is a top concern.
We now look at how respondents felt about the people in their neighborhoods. Figures
11 through 14 display the histograms for each neighborhood. Again, the x axis represents the
Page 13
13
number of positive adjectives people circled minus the number of negative adjectives circled.
The height of the bars (the y axis) shows how many people circled that number of positive minus
negative adjectives.
For Parkside Ave. residents (Figure 14), the distribution in the graph represents a
negatively skewed curve, which means that there is a larger number of responses to the right
(positive responses). The mean is +2.20, which represents that the residents on average, circled
two more positive words than negative. The responses from Clinton Ave. residents also show a
negatively skewed curve, meaning there are more positive responses than negative (Figure 13).
Overall, the mean for Clinton Ave. (+1.57) is slightly less than Parkside Ave. Jefferson Ave.
residents were slightly more neutral but still positive overall. The curve in Figure 12 is not
skewed, which means there is an even distribution of negative and positive responses. Jefferson
Ave. residents generally circled 1 or 2 more positive words than negative (mean = +1.65). So,
most Jefferson Ave. residents feel positively overall about their neighborhood. Respondents
from the Conkey and Clifford neighborhood were more neutral than the other neighborhoods
(Figure 11). Their responses create a negatively skewed curve, with a larger number of
responses to the right (positive responses). The mean is +0.41 which represents a somewhat
positive view of the people in the neighborhood.
Thus, while Conkey and Clifford respondents viewed the people in their neighborhood
slightly positively, residents in all other neighborhoods had more positive responses. For all
neighborhoods, respondents seemed to feel more positively about the people in their
neighborhoods than the neighborhoods themselves. One explanation may be that residents in all
four neighborhoods could be possibility speaking about just their favorite neighbors when
responding about the people and not the community as a whole.
Page 14
14
Residents Description of the People in their Neighborhood
Figure 11 Figure 12
Figure 13 Figure 14
Page 15
15
Residents’ Concerns
Residents were also asked to list the top three concerns they had about their
neighborhoods. Table 1 below shows the residents’ highest-ranked concerns for each
neighborhood, in order of the total most common concerns. For the purposes of this analysis, the
variable “Drug Activity” describes all related responses such as drug dealers, drugs, drugs use,
and drug sales. The category “Drama” describes issues that residents see between neighbors but
are not involved in, and the category “Crime (in General)” describes any crime.
Table 1: Residents Top Concern in the Studied Neighborhoods (2013)
Survey Location
Total
Conkey and
Clifford N=44
Parkside Ave
N=54
Clinton Ave
N=118
Jefferson Ave
N=46
Drug Activity % 75.0% 9.3% 39.2% 12.5% 32.7%
Unsupervised or problematic kids
% 0.0% 11.6% 13.4% 9.4% 10.7%
Speeding % 8.3% 11.6% 8.2% 12.5% 9.7%
Crime (in general) % 0.0% 4.7% 7.2% 9.4% 6.1%
Safety % 0.0% 11.6% 4.1% 0.0% 4.6%
Violence % 4.2% 7.0% 2.1% 6.3% 4.1%
Noise % 4.2% 4.7% 3.1% 6.3% 4.1%
Shootings % 0.0% 2.3% 4.1% 6.3% 3.6%
If yes, what are your top 3 concerns?
(1st)
Break ins % 0.0% 7.0% 0.0% 9.4% 3.1%
Cleanliness % 4.2% 2.3% 1.0% 9.4% 3.1%
Vacant homes % 0.0% 2.3% 4.1% 3.1% 3.1%
Location % 0.0% 0.0% 5.2% 0.0% 2.6%
Fighting % 0.0% 2.3% 2.1% 3.1% 2.0%
People hanging out/ loitering
% 4.2% 0.0% 2.1% 3.1% 2.0%
Lack of police presence
% 0.0% 7.0% 0.0% 3.1% 2.0%
Corner stores % 0.0% 2.3% 1.0% 3.1% 1.5%
Robberies % 0.0% 4.7% 0.0% 0.0% 1.0%
Drama % 0.0% 2.3% 0.0% 3.1% 1.0%
Gangs % 0.0% 4.7% 0.0% 0.0% 1.0%
Guns % 0.0% 2.3% 0.0% 0.0% .5%
Communication % 0.0% 0.0% 1.0% 0.0% .5%
Homeless people % 0.0% 0.0% 1.0% 0.0% .5%
Outsiders % 0.0% 0.0% 1.0% 0.0% .5%
Total Count 24 43 97 32 196
% 100.0% 100.0% 100.0% 100.0% 100.0%
Page 16
16
Table 1 shows that more residents in Conkey and Clifford are concerned about drug
activity (75%) compared to the other neighborhoods (Parkside Ave. 9.3%, Clinton Ave. 39.2%,
Jefferson Ave. 12.5%). More residents in the Conkey and Clifford Ave neighborhood also
reported people hanging out/loitering as a top concern compared to Parkside Avenue, Clinton
Avenue, and Jefferson Avenue. However, a higher percentage of residents in the Parkside
Avenue neighborhood reported violence as a top concern, compared to the other neighborhoods.
As a second concern, 21.1% of the residents in the Conkey and Clifford neighborhood
reported people hanging out/loitering at a higher rate than residents in the other neighborhoods
(9.7% in Parkside Avenue, 2.7% in Clinton Avenue, and 0% in Jefferson Ave). Residents in the
Conkey and Clifford neighborhood also reported fighting (10.5%) and safety (15.8%) as their
second-highest concerns compared to the other neighborhoods. Conkey and Clifford Avenue
residents also reported vacant homes (5.3%) and violence (10.5%) as a second concern, more
than the other neighborhoods.
As a third concern, more residents in the Conkey and Clifford neighborhood (12.5%)
reported cleanliness than the other neighborhoods (Parkside Ave= 5.9%, Clinton Ave= 10.3%,
and Jefferson Ave= 9.1%). Also, 6.3% of residents in the Conkey and Clifford neighborhood and
9.1% of residents in the Jefferson Avenue neighborhood reported corner stores as a third
concern, compared to 0% in Parkside Ave and Clinton Ave. Gangs is another concern that was
reported by some residents of the Conkey and Clifford Ave. and Parkside Ave. neighborhoods,
while no residents in the Clinton Ave. or Jefferson Ave. neighborhoods reported gangs as a third
concern. Also, 12.5 % of residents in the Conkey and Clifford Ave neighborhood reported
people hanging out/loitering as a third concern, which is once again higher than the compared
neighborhoods (Parkside Ave = 0%, Clinton Ave = 2.6%, Jefferson Ave = 0%). More Conkey
Page 17
17
and Clifford residents also reported violence (6.3%) and lighting in the area (6.3%) as a third
concern, compared to the other neighborhoods.
Next, residents in the studied neighborhoods were asked to list the top three attributes
they liked about their neighborhoods. Table 4 shows the residents’ most-liked community
attributes. Specifically, 8.3% of the residents in the Conkey and Clifford Avenue neighborhood
reported cleanliness as something they liked, whereas residents in other neighborhoods rarely
mentioned this, if at all. In contrast, none of the residents in the Conkey and Clifford Ave
neighborhood reported quiet as something they most-liked, whereas this was much more
commonly reported by residents in other neighborhoods. None of the residents in the Conkey
and Clifford Avenue or Jefferson Avenue neighborhoods reported liking the safety of their
neighborhood, compared to the 6.3% of residents in Parkside Avenue and 5.7% of residents in
Clinton Avenue. Less than a quarter (16.7%) of residents reported liking the park in the Conkey
and Clifford Avenue neighborhood. Also, 12.5% of residents in the Conkey and Clifford
Avenue neighborhood liked the good community, compared to 6.3% of residents in Parkside
Avenue, 3.8% of residents in the Clinton Avenue area, and 4.7% of residents in the Jefferson
Ave neighborhood. None of the residents surveyed in the Conkey and Clifford neighborhood
reported that their area being a convenient location as a most-liked attribute, whereas some
residents in all other neighborhoods mentioned this.
For the residents’ second highest-ranked positive attributes residents in the Conkey and
Clifford neighborhood reported liking the diversity of their neighborhood (16.7%) and the
activities for kids (5.6%) than in any other neighborhood. Once again, we see that none of the
residents in the Conkey and Clifford Ave neighborhood reported it being a convenient location.
Also, none of the Conkey and Clifford residents reported friendly neighbors here, compared to
Page 18
18
Table 2: Residents Top Liked Feature in The Studied Neighborhoods (2013)
Survey Location
Total
Conkey and
Clifford Parkside
Ave Clinton
Ave Jefferson
Ave
If yes, then please list the top three things (1st)
Quiet % 0.0% 16.7% 18.9% 34.9% 19.6%
Friendly neighbors % 16.7% 25.0% 17.0% 9.3% 17.3%
Friendly people % 16.7% 8.3% 18.9% 11.6% 13.7%
Good community % 12.5% 6.3% 3.8% 4.7% 6.0%
Kids % 4.2% 4.2% 11.3% 2.3% 6.0%
Park % 16.7% 4.2% 0.0% 4.7% 4.8%
Convenient location % 0.0% 6.3% 5.7% 4.7% 4.8%
Location % 8.3% 2.1% 3.8% 4.7% 4.2%
Nice % 4.2% 0.0% 5.7% 7.0% 4.2%
Peace and quiet % 4.2% 6.3% 1.9% 4.7% 4.2%
safe % 0.0% 6.3% 5.7% 0.0% 3.6%
Affordable % 0.0% 4.2% 0.0% 4.7% 2.4%
Police in the area % 0.0% 4.2% 0.0% 4.7% 2.4%
Clean % 8.3% 0.0% 1.9% 0.0% 1.8%
Activities % 0.0% 4.2% 0.0% 0.0% 1.2%
Rec center % 4.2% 2.1% 0.0% 0.0% 1.2%
child-friendly % 0.0% 0.0% 3.8% 0.0% 1.2%
Schools nearby % 4.2% 0.0% 0.0% 2.3% 1.2%
Neighborhood watch % 0.0% 0.0% 1.9% 0.0% .6%
Total Count 24 48 53 43 168
% 100.0% 100.0% 100.0% 100.0% 100.0%
8.6% in Parkside, 23.15% in Clinton, and 20.6% in Jefferson. None of the residents in the
Conkey and Clifford Avenue neighborhood reported safety as a second most-liked attribute,
while some residents in all the other neighborhoods mentioned this.
Regarding the residents’ third most-liked attribute, 8.3% of residents in the Conkey and
Clifford neighborhood reported convenient location as a third highest-ranked attribute of the
area. The only neighborhood who listed convenience more than Conkey and Clifford was its
neighbor, Clinton Avenue. More residents in Conkey and Clifford than in other neighborhoods
listed activities, affordability, quiet, and stores as third-highest-ranked attributes. Another 8.3%
Page 19
19
of the residents in the Conkey and Clifford neighborhood reported liking the kids in the area,
while no one in the other neighborhoods mentioned this as a third most-liked attribute. Safety
was again not reported by any of the residents in the Conkey and Clifford neighborhood or in the
Clinton Ave neighborhood, while it was mentioned mostly by Parkside residents and by some
Jefferson Ave. residents.
Initiatives like Project HOPE aim to improve the quality of life in Conkey and Clifford
and can use some of these results to inform their programming. Compared to other
neighborhoods, Conkey and Clifford has an opportunity to positively use the park, which Project
HOPE has done by holding family activities there. Such activities can help residents reclaim
their neighborhood from those selling drugs and loitering. Strengthening community activities,
the area’s police presence, and the neighborhood watch may help residents feel safer as well.
Finally, the marijuana market there not only affects quality of life but economic
development of the area. Residents reported liking the stores in the area, but many businesses
are reluctant to do business in areas with high drug activity. Thus, there is an opportunity to
provide businesses or non-profits with more support to open and maintain storefront businesses
in the area. This could provide more positive activities and positive traffic in the area,
potentially dissuading the marijuana market that has claimed so much of this community. Any
such endeavors would need tangible and long-term support to be maintained, but residents would
likely support economic improvements to their area.
Conclusion
These findings show that the Conkey and Clifford Ave neighborhood does indeed face
many challenges along with the open-air marijuana market that has been identified in the area.
Page 20
20
The majority of Conkey and Clifford residents view their neighborhood negatively but have a
positive view of the people who live in the neighborhood. However, they tend to feel more
negatively about their neighborhood and neighbors than residents of the other surveyed
neighborhoods. Fewer people in Conkey and Clifford live in the area for a long period of time
compared to other neighborhoods, which may be explained by the pressures of the open-air
marijuana market. This causes a high turnover of residents and lower neighborhood stability,
which in turn, creates an environment for crime, drug sales, and drug use. Drug concerns were
reported by a much higher percentage of Conkey and Clifford residents (75%) than the other
three neighborhoods. The open-air marijuana market located in the Conkey and Clifford Avenue
is affecting the way residents view their neighborhood. Thus, while each area shows a variety of
issues, Conkey and Clifford Avenue seems to struggle more than others, perhaps because of the
marijuana market.
While there are some aspects of the neighborhood that residents liked, there do seem to
be several indicators that the quality of life in Conkey and Clifford is negatively affected by the
drug market there, and Conkey and Clifford’s challenges differ from other neighborhoods. This
information can inform initiatives to help revitalize and reclaim this area, including and
expanding on Project HOPE’s efforts.
Page 21
21
Community Survey 2013
Rochester Drug-Free Street Initiative
Thesis Project Pedro Vazquez
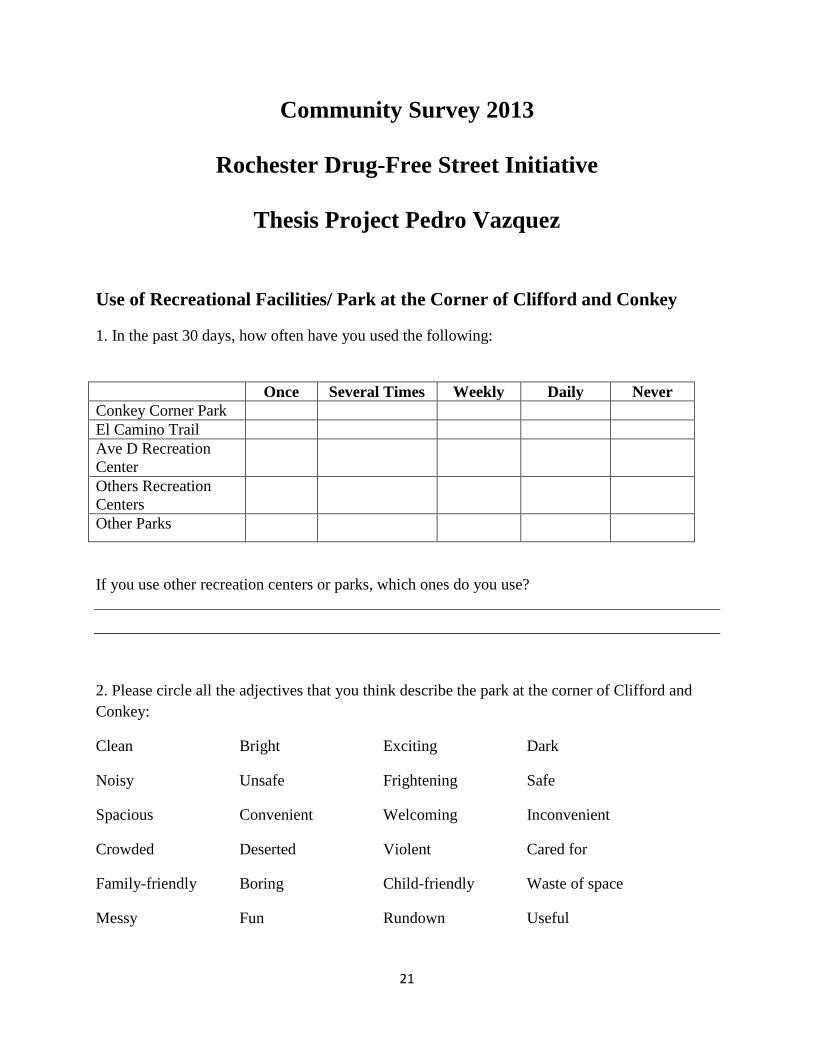
Use of Recreational Facilities/ Park at the Corner of Clifford and Conkey
1. In the past 30 days, how often have you used the following:
Once Several Times Weekly Daily Never
Conkey Corner Park
El Camino Trail
Ave D Recreation
Center
Others Recreation
Centers
Other Parks
If you use other recreation centers or parks, which ones do you use?
2. Please circle all the adjectives that you think describe the park at the corner of Clifford and
Conkey:
Clean Bright Exciting Dark
Noisy Unsafe Frightening Safe
Spacious Convenient Welcoming Inconvenient
Crowded Deserted Violent Cared for
Family-friendly Boring Child-friendly Waste of space
Messy Fun Rundown Useful
Page 22
22
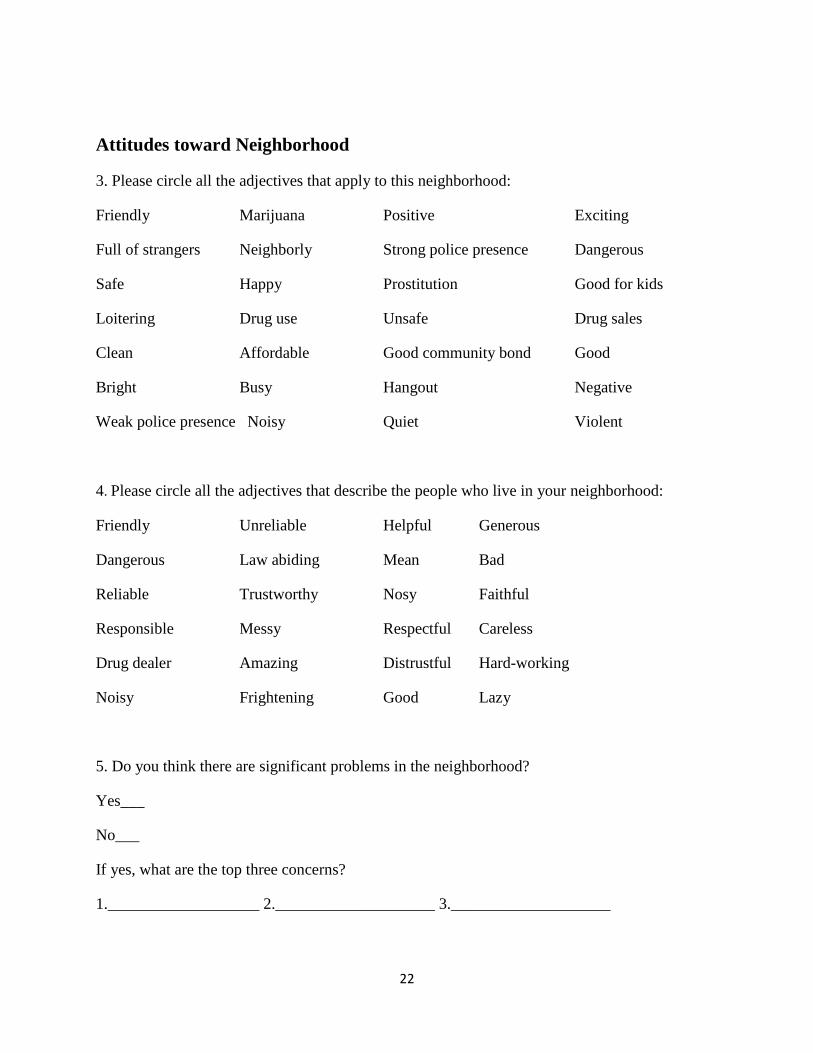
Attitudes toward Neighborhood
3. Please circle all the adjectives that apply to this neighborhood:
Friendly Marijuana Positive Exciting
Full of strangers Neighborly Strong police presence Dangerous
Safe Happy Prostitution Good for kids
Loitering Drug use Unsafe Drug sales
Clean Affordable Good community bond Good
Bright Busy Hangout Negative
Weak police presence Noisy Quiet Violent
4. Please circle all the adjectives that describe the people who live in your neighborhood:
Friendly Unreliable Helpful Generous
Dangerous Law abiding Mean Bad
Reliable Trustworthy Nosy Faithful
Responsible Messy Respectful Careless
Drug dealer Amazing Distrustful Hard-working
Noisy Frightening Good Lazy
5. Do you think there are significant problems in the neighborhood?
Yes___
No___
If yes, what are the top three concerns?
1.___________________ 2.____________________ 3.____________________
Page 23
23
6. Do you think there are really good things about the neighborhood?
Yes____
No____
If yes, then please list the top three things
1.____________________ 2.___________________ 3._____________________
Household and Respondent Demographics
7. How old are you? _____
8. What gender are you?
Male___
Female___
9. How long have you lived in the area? _____
10. Do you rent or own the home? ______
Page 24
24
Appendix B
Community Survey 2013
TIPS Supplement
Attitudes/Opinion toward Neighborhood
1. Please circle all the adjectives that apply to this neighborhood:
Friendly Marijuana Positive Exciting
Full of strangers Neighborly Strong police presence Dangerous
Safe Happy Prostitution Good for kids
Loitering Drug use Unsafe Drug sales
Clean Affordable Good community bond Good
Bright Busy Hangout Negative
Weak police presence Noisy Quiet Violent
2. Please circle all the adjectives that describe the people who live in your neighborhood:
Friendly Unreliable Helpful Generous
Dangerous Law abiding Mean Bad
Reliable Trustworthy Nosy Faithful
Responsible Messy Respectful Careless
Drug dealer Amazing Distrustful Hard-working
Noisy Frightening Good Lazy


![THE CONKEY FAMILY OF PELHAM, MASSACHUSETTS · 2017. 9. 15. · Alexander was progenitor of the Conkey family ["Mc" dropped in America] of Pelham, Massachusetts. Alexander is assumed](https://static.documents.pub/doc/80x56/60cf4e48b75d5a0a997ee800/the-conkey-family-of-pelham-massachusetts-2017-9-15-alexander-was-progenitor.jpg)


