Comparing the fatality risks in United States transportation across modes and over time Ian Savage Department of Economics and the Transportation Center, Northwestern University, 2001 Sheridan Road, Evanston, IL 60208, USA article info Article history: Available online 21 January 2013 JEL Codes: R41 Keywords: Safety Transportation United States abstract This paper analyzes the transportation fatality risk in the United States. The analysis is in two parts. The first part compares the relative risks of the different modes based on data for the decade from 2000 to 2009. The second part is a time-series analysis for each mode using annual data from 1975 to 2010. By almost any measure, transportation is considerably safer now than it was in the mid 1970s. The improvement is especially noticeable for commercial modes such as aviation, railroads and maritime. Even the risks from private highway driving have halved during the past thirty-five years. Ó 2012 Elsevier Ltd. All rights reserved. This paper analyzes the transportation fatality risk in the United States. The analysis is in two parts. The first part compares the relative risks of the different modes based on data for the decade from 2000 to 2009. Using data from an entire decade minimizes any misleading comparisons that might results from using data for a single year. This is because for some modes there are extreme fluctuations in annual fatality counts due to rare catastrophes that can claim tens, and sometimes hundreds, of lives. The second part is a time-series analysis for each mode using annual data from 1975 to 2010. The choice of 1975 as the starting point was primarily determined by data availability. The federal government estab- lished a number of transportation safety agencies in the late 1960s and early 1970s and this resulted in an expansion of data collection. The focus on fatalities is primarily motivated by a greater confidence that this measure of safety is reported more consistently and accurately across modes and time. In general, cross-sectional and time-series comparisons in fatalities are also indicative of differences in non-fatal injuries, illnesses, and property damage. Albeit that the correlation is not perfect. In particular, fatalities are a poor measure of some of the environmental risks associated with the transportation of oil products and hazardous materials. In addition many of the advances in safety in recent decades have focused on “crashworthiness” whereby design changes have been made to increase the survivability of crashes and mitigate the severity of injuries. Consequently it is possible that a reduction in fatalities may be partly compensated for by an increase in the number of injuries. Often fatality data is problematic for analytical purposes because fatalities are generally few in numbers, and in some modes occur in very rare multi-fatality events. As a consequence there are often considerable year-to-year fluctuations, and analyses comparing different modes or time periods suffer from large standard errors and poor statistical significance. However, the United States is a large country with an average population in the decade from 2000 to 2009 of 295 million. Therefore, while the risks are low, the annual count of fatalities is substantial in most modes. While passenger fatalities in scheduled aviation, passenger rail, ferryboat and bus modes are dominated by rare catastrophes, other classes of fatalities within these modes are characterized by many single-fatality events that are more consistent in number from year to year. Examples include fatalities resulting from on-demand air taxis, private flying, private boating, collisions between trains and vehicles at rail-highway grade crossings and between trains and pedestrians who are trespassing on the tracks. 1. Cross-sectional analysis The analysis in this section is based on calculating an average annual number of fatalities using data for the ten-year period from 2000 to 2009. An Appendix A gives details on the sources of the data. 1.1. An overview In an average year between 2000 and 2009, 43,239 people died in transportation incidents. This is an annual risk of 1 in 6800 based E-mail address: [email protected]. Contents lists available at SciVerse ScienceDirect Research in Transportation Economics journal homepage: www.elsevier.com/locate/retrec 0739-8859/$ e see front matter Ó 2012 Elsevier Ltd. All rights reserved. http://dx.doi.org/10.1016/j.retrec.2012.12.011 Research in Transportation Economics 43 (2013) 9e22
Transcript
at SciVerse ScienceDirect
Research in Transportation Economics 43 (2013) 9e22
0739-8859/$ e see front matter � 2012 Elsevier Ltd.http://dx.doi.org/10.1016/j.retrec.2012.12.011
a b s t r a c t
This paper analyzes the transportation fatality risk in the United States. The analysis is in two parts. Thefirst part compares the relative risks of the different modes based on data for the decade from 2000 to2009. The second part is a time-series analysis for each mode using annual data from 1975 to 2010. Byalmost any measure, transportation is considerably safer now than it was in the mid 1970s. Theimprovement is especially noticeable for commercial modes such as aviation, railroads and maritime.Even the risks from private highway driving have halved during the past thirty-five years.
� 2012 Elsevier Ltd. All rights reserved.
This paper analyzes the transportation fatality risk in the UnitedStates. The analysis is in two parts. The first part compares therelative risks of the different modes based on data for the decadefrom 2000 to 2009. Using data from an entire decade minimizesany misleading comparisons that might results from using data fora single year. This is because for some modes there are extremefluctuations in annual fatality counts due to rare catastrophes thatcan claim tens, and sometimes hundreds, of lives. The second part isa time-series analysis for eachmode using annual data from1975 to2010. The choice of 1975 as the starting point was primarilydetermined by data availability. The federal government estab-lished a number of transportation safety agencies in the late 1960sand early 1970s and this resulted in an expansion of data collection.
The focus on fatalities is primarily motivated by a greaterconfidence that thismeasure of safety is reportedmore consistentlyand accurately across modes and time. In general, cross-sectionaland time-series comparisons in fatalities are also indicative ofdifferences in non-fatal injuries, illnesses, and property damage.Albeit that the correlation is not perfect. In particular, fatalities area poor measure of some of the environmental risks associated withthe transportation of oil products and hazardous materials. Inaddition many of the advances in safety in recent decades havefocused on “crashworthiness” whereby design changes have beenmade to increase the survivability of crashes and mitigate theseverity of injuries. Consequently it is possible that a reduction infatalities may be partly compensated for by an increase in thenumber of injuries.
All rights reserved.
Often fatality data is problematic for analytical purposesbecause fatalities are generally few in numbers, and in somemodesoccur in very rare multi-fatality events. As a consequence there areoften considerable year-to-year fluctuations, and analysescomparing different modes or time periods suffer from largestandard errors and poor statistical significance. However, theUnited States is a large country with an average population in thedecade from 2000 to 2009 of 295million. Therefore, while the risksare low, the annual count of fatalities is substantial in most modes.While passenger fatalities in scheduled aviation, passenger rail,ferryboat and bus modes are dominated by rare catastrophes, otherclasses of fatalities within these modes are characterized by manysingle-fatality events that are more consistent in number from yearto year. Examples include fatalities resulting from on-demand airtaxis, private flying, private boating, collisions between trains andvehicles at rail-highway grade crossings and between trains andpedestrians who are trespassing on the tracks.
1. Cross-sectional analysis
The analysis in this section is based on calculating an averageannual number of fatalities using data for the ten-year period from2000 to 2009. An Appendix A gives details on the sources of thedata.
1.1. An overview
In an average year between 2000 and 2009, 43,239 people diedin transportation incidents. This is an annual risk of 1 in 6800 based
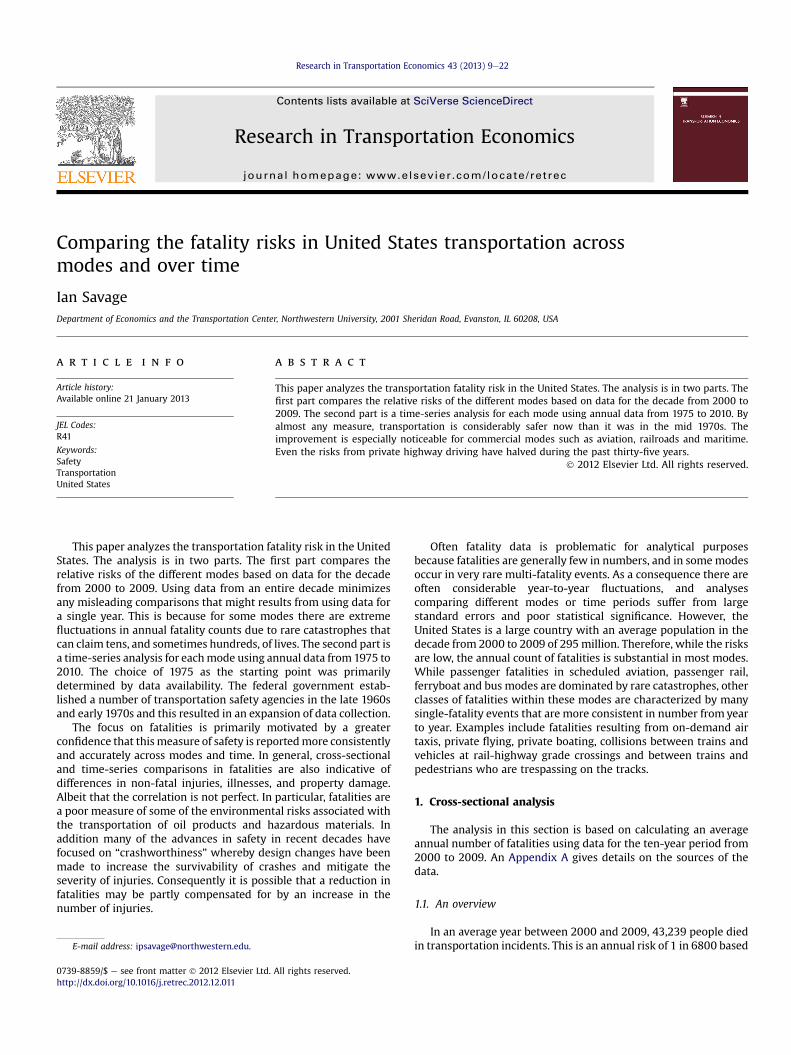
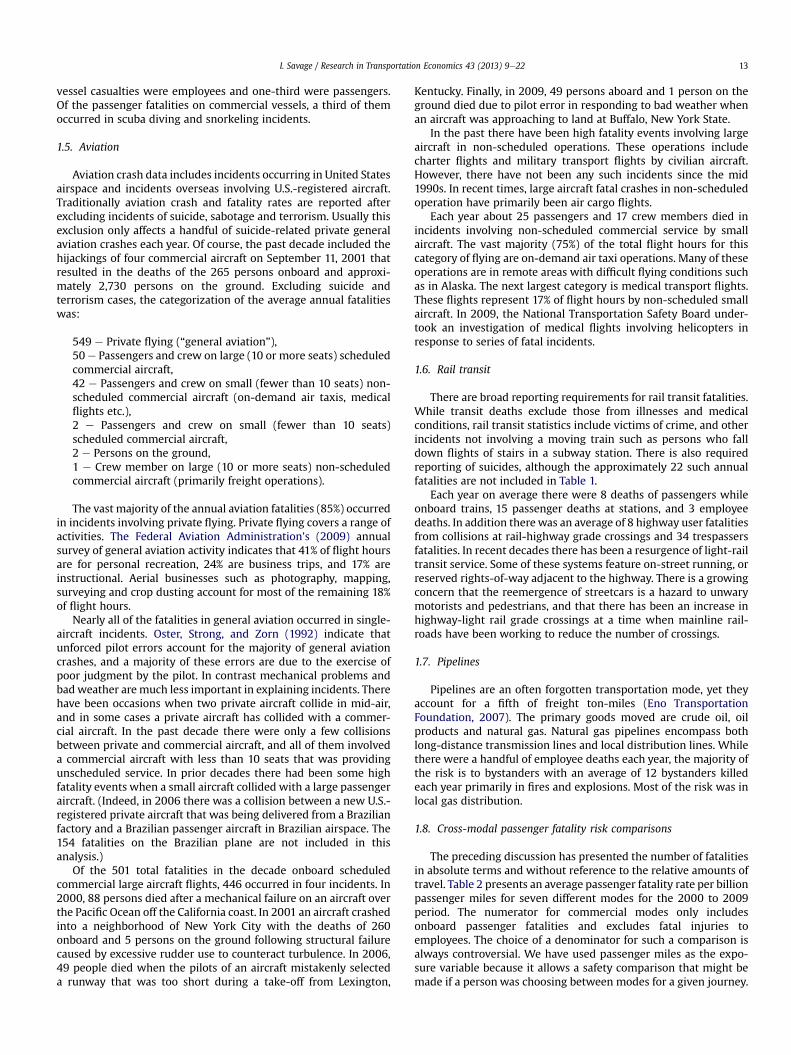
Fig. 1. Categorization of average annual fatalities 2000e2009.
I. Savage / Research in Transportation Economics 43 (2013) 9e2210
on the number of U.S. residents (of course, some U.S. residents diein transportation incidents elsewhere in the world, and someforeign residents die in incidents within the United States).
Transportation risks accounted for about 1.78% of the 2.43million annual deaths from all causes in the United States. Thisamounted to 1 in every 56 deaths. However, among “unintentionalinjury deaths” e those deaths not caused by aging, disease, suicideand homicide e transportation incidents were the most prevalentcause of death. Transportation-related fatalities represented 38% ofall “unintentional injury deaths.”Moreover, theywere equivalent innumber to the sum of the next two most prevalent causes, whichwere falls and poisonings.
One might argue that transportation equipment, and in partic-ular the motor vehicle, must be the most dangerous machines thatwe interact with on a daily basis. The annual toll in motor vehiclecrashes exceeds the deaths resulting from the next most dangerousmechanical device,firearms, byabout 40% (based ondata from2000to 2007, with total firearms deaths calculated from a combination ofhomicides, suicides, law enforcement acts and accidentaldischarges).
A categorization of the 43,239 fatalities by mode and type ofuser is shown in Table 1. Users are divided to two broad categories.The first is private transportation that encompasses walking,bicycles, motorcycles, cars and light trucks, recreational boatingand private flying. Here the user is in control of their vehicle, or isa passenger in such a private vehicle. The other broad category iscommercial transportation where passengers or freight shipperscontract with transportation providers. Victims in the commercialcategory can be either users (primarily passengers), employees oftransportation companies, or bystanders who are fatally injured bydebris or hazardous materials releases. There is also an intersectionof the two categories when there is a collision between a privateuser and a commercial carrier.
Fig. 1 provides a diagrammatic presentation of the magnitude ofthe various categories. Incidents that solely involved private usersaccounted for the vast majority (85.2%) of total transportationfatalities. Some of these incidents are single-vehicle crashes andothers are when multiple private users collide with each other.About 1 out of every 7 (14.8%) transportation fatalities occurred in
Table 1Average annual fatalities in the United States 2000e2009.
Notes: n.a. ¼ not applicable.a collisions with trains and rail transit vehicles at highway-rail grade crossings.b taxi and limousine occupants.c 11% result from collisions with trains and rail transit vehicles at highway-rail grade cr
suicides. Suicides on rail transit lines averaged 22 a year. During this time period suicidal aunreported annual suicides on mainline railroads.
d aviation deaths exclude those caused by suicide, sabotage and terrorism. Sources: Se
incidents involving commercial transportation. The vast majority,83%, of the victims of commercial transportation-related incidentswere actually private users who were in collision with a commer-cial carrier. Collisions between private highway users and trucks,taxis and buses resulted in an average loss of 4467 private user liveseach year. In addition, 247 motorized private users, and 68 pedes-trians, died each year in collisions with trains at rail-highway gradecrossings. A further 524 pedestrians died each year as a result oftrespassing on train tracks at locations away from formal crossings.
Consequently only 2.5% of the total fatalities were peopledirectly involved in the production or consumption of commercialtransportation services as an employee or passenger. The implica-tion for economists is that two extensive field of safety research e
industrial organization analysis of firms’ commercial safety choicesand labor economics’ examination of workplace safety e bear ononly a small minority of total fatalities.
1.2. Highways
We now turn to look at individual modes, and start by analyzingthe highway sector. Nearly all of the total fatality risk occurs in thissector. Deaths on the highway were 94.4% of the national total. Ifhighway deaths that occurred in collisions at rail-highway gradecrossings were included the total would be even higher at 95.2%.
ossings. 89% are pedestrian trespassers elsewhere on the railroad. These data excludects onmainline railroads were not reportable. It is suspected that there are 220e245
e Appendix A.
I. Savage / Research in Transportation Economics 43 (2013) 9e22 11
In structuring the discussion, wewill follow the distinctions thatare usually made by traffic safety engineers who look at the role ofthe vehicle, the roadway, and the driver in crash causation(Haddon, 1972). We will first look at how crashes frequency, char-acteristics and severity varied by the type of vehicle or vehiclesinvolved.
Approximately three-quarters (73.7%) of total highway fatalitieswere occupants of automobiles and light trucks. The light truckcategory encompasses passenger minivans, pickup trucks andsport-utility vehicles in addition to light freight and commercialvehicles. We have grouped these two categories together becausehousehold passenger vehicles may fall into either category. More-over, Oster and Strong (2013) in this volume show that the occu-pant fatality rates for these two categories of vehicle areapproximately the same and have been similar for several decades.
It is notable that greater than half (55%) of the fatalities sufferedby occupants of automobiles and light trucks occurred in incidentsthat did not involve another vehicle. These single-vehicle crashesoccur when a vehicle rolls over without a prior collision, strikesa fixed object at the side of the road, strikes an animal or debris inthe roadway, or catches fire. The proportion of total occupantfatalities that occurred in single vehicle crashes is much higher forlight trucks (66%) than it is for automobiles (47%). Light trucks tendto have a higher center of gravity than automobiles resulting ina greater propensity to roll over.
The remaining half of automobile occupant fatalities and third oflight truck fatalities occurred in multi-vehicle crashes. Becauseautomobiles and light trucks have similar overall occupant fatalityrates, light trucks had a lower rate of occupant fatalities in multi-vehicle collisions. This might be expected given the generallygreater mass and size of light trucks compared with automobiles.
An astonishing 9.9% of all highway fatalities were motorcyclists.As with automobiles, about half of all motorcyclist fatalitiesoccurred in single-vehicle incidents. When amotorcycle is involvedin a collision with another vehicle, the motorcyclist invariablyreceives more serious injuries. The ratio of fatalities in two-vehiclecollisions was 70 motorcyclist fatalities for each fatal injury sus-tained by the occupant of the other vehicle. Motorcycles have beena source of particular concern in the past decade as they havebecome more popular, with vehicle miles increasing by as much as75% and there has been a proportionate increase in fatalities.
Occupants of large trucks, freight vehicles weighing at least10,000 lbs, represented 1.7% of total highway fatalities. Three-quarters of the truck occupant fatalities occurred in single-vehicleincidents, with two-thirds of these occurring in incidents wherea truck jack-knifed or rolled on its side without involvement ina prior collision. In incidents where there is a collision betweena truck and another highway user, the laws of physics wouldsuggest that truck occupants are much better protected than theother road user. Indeed in incidents of a collision between a truckand some other highway user (including pedestrians) there were23 other highway user fatalities for each truck occupant fatality.
Occupants of buses (vehicles with a capacity of 10 passengersand greater) represented just 0.1% of the total fatalities. The averageannual number of fatalities was roughly 40, with employees of buscompanies representing a quarter of the total. Long distancescheduled and charter service accounted for 44% of total busfatalities, school buses 23%, urban transit 11%, and the remaining22% encompassed a myriad of other types of bus service such asprivate workplace and church buses.
The type of highway has a significant effect on the fatality risk.Federal data on both fatalities and the amount of vehicle miles oftravel is categorized by the functional class of the road (Interstatehighway, arterial, collector or local) and whether the highway is inan urban or rural area. Based on data from 2009, highways in rural
areas have a fatality risk that is 2.7 times greater than that in urbanareas. In general the lower average speeds, greater provision oflighting, greater deployment of traffic control devices and fewercurves in urban areas more than compensate for factors such as thegreater number of intersections and the presence of pedestrians.The safest functional class of roads is the Interstate HighwaySystem. This type of highway has a fatality rate per vehicle mile thatis about half the national average for all roads. The elimination ofintersections and the construction of a median between the vehi-cles moving in opposite directions reduces the frequency ofcrashes, albeit that the crashes that do occur tend to bemore severedue to the higher travel speeds. In general, the riskiest types ofhighways are those in rural areas that do not have a middle divisionbetween oncoming traffic.
We finally turn to the characteristics of the victims. Of theoccupants of automobiles and light trucks who received fatalinjuries approximately 70% were the driver of the vehicle and 30%were passengers in the vehicle. About 1 in 7 (14.6%) of totalhighway fatalities were not occupants of motor vehicles ormotorcycle riders. This category is primarily (85%) composed ofpedestrians, but also includes bicyclists, other non-motorizedusers, and those who may be living or working adjacent to thehighway. Greater than 90% of pedestrian fatalities occurred incollisions with automobiles and light trucks.
A driver’s gender and age has a considerable effect on thefatality risk. Some basic insights can be found by comparing 2009data on the age and gender distribution of motor vehicle andmotorcycle driver fatalities with the gender and age distributions ofthe population in general. Based on this comparison, males facea risk that is three times higher than that for females. Of course, onewould ideally wish to examine gender differences based on theproportion of each gender that possesses a drivers’ license and theamount of driving that they do. Looking at the same risk measureby age reveals that most age groups have broadly the same fatalityrisk with the exception of younger people between the ages of 18and 29. The risk for people in this age range is 50e90% higher thanaverage.
Irrespective of age and gender, about a third of highway fatali-ties occur in incidents in which at least one of the involved drivers/motorcycle riders was impaired by alcohol consumption in excessof the legal alcohol-blood limit of 0.8 g per deciliter. The proportionof incidents that involve alcohol has not changed in the past twodecades. In addition to alcohol impairment there is a continuingconcern about drivers whose reactions and judgment are impairedby tiredness, and an increasing debate about drivers beingdistracted from the driving task as new electronic communicationand listening devices supplement traditional in-car distractionssuch as tuning the car radio.
Highway users can also affect their fatality rate by their choice ofwhether or not they fasten their safety belt. The National HighwayTraffic Safety Administration (2010) estimated that 16% of vehicleoccupants did not use a seat belt in 2009. However, these non-beltusers are overrepresented in the fatality totals. Almost half (49.2%)of fatally-injured automobile and light truck occupants were notwearing a seat belt or using a child safety seat at the time of theirdeath.
1.3. Mainline railroads
Compared with highways, other modes had considerably lowerannual fatality counts. However, the totals are still substantial.Mainline railroads claimed an average of 876 lives a year. Maritimefatalities were of a similar magnitude at an average of 833 a year,and aviation fatalities were only slightly less at 646 a year. Aviationand maritime are somewhat different from railroads in that 85% of
I. Savage / Research in Transportation Economics 43 (2013) 9e2212
both aviation and maritime fatalities were associated with privateusage in the form of private flying (known as “general aviation”)and recreational boating, whereas the land-based railroad modehad a substantial number of collisions with highway users andpedestrians.
Mainline railroads comprise the freight railroad system, Amtrakinter-city trains and commuter passenger trains. Incidentsinvolving urban subway, elevated and light rail transit systems arereported to a separate federal agency and are discussed in a latersection.
The vast majority of the risk was suffered by people other thanthose involved in the production and consumption of rail service.The breakdown of the average of 876 annual fatalities was:
490 e Trespassers (primarily pedestrians) at places other thangrade crossings,281 e Motorized highway users at grade crossings,68 e Pedestrians and non-motorized highway users at gradecrossings,26e On and off-duty employees and contractors working on therailroad,7 e Passengers on trains,4 e Bystanders not on railroad property.
Pedestrians and other non-motorized persons constitutedalmost two-thirds (64%) of total railroad fatalities. There wereadditional fatal collisions between trains and pedestrians that arenot accounted for in our analysis because prior to July 2011 rail-roads were not required to report suicidal acts to the federalgovernment. Professionals working in suicide prevention estimatethat about 1% of the approximately 33,000 annual suicides in theUnited States involve a train (coding of data from death certificatesreported by local medical examiners to the federal government issufficiently ambiguous to prevent calculation of a definitivenumber). Even though suicides were not, at the time of our analysis,supposed to be reported by the railroads, there is evidence thatsome suicides have been included in the trespasser fatalitynumbers. This is because the intentions of some victims are notalways readily apparent, and federal trespassing data was not,during the time period under study, always reconciled with deci-sions on the cause of death made by local medical examiners,especially when there was a time lag between the incident and themedical examiner’s final report.
George (2008) matched up 60% of the trespassing fatalities inthe federal database that occurred in 2002, 2003 or 2004 with therecords held by local coroners and medical examiners. He foundthat in 17.5% of the available cases the coroner had used the words“suicide” or “intentional” somewhere in their report. An additional5.2% of cases contained a written narrative that would suggestsuicide as a motive. If the proportions found by George are appliedto the annual total of 490 trespassers, approximately 85e110 areprobably suicides. If rail-based suicides are about 1% of the33,000 annual suicides, it is likely that unreported suicides wouldhave added 220e245 fatalities to the annual toll on the railroad.This would suggest that total railroad-related fatalities would havebeen in the range of 1095 to 1120 a year.
Fuller and Savage (2012) analyzed a dataset on pedestrian andbicyclist fatalities in the Chicagometropolitan area. The data for theyears from 2004 to 2011 was derived from a wider array of sourcesthan the federal government’s database. They found that 47% ofnon-motorized fatalities were likely suicides, 22% were due to non-suicidal collisions at highway grade crossings or at pedestrianwalkways between platforms at stations, and the remaining 31%were non-suicidal events occurring at locations other than stationsand grade crossings.
The annual toll to trespassers, and pedestrians and other non-motorized users at crossings, while varying from year-to-year, didnot trend either upwards or downwards over the decade. Incontrast the number of motorized highway user fatalities at gradecrossings declined markedly. The absolute number of fatalities fellby 50% from 361 in 2000 to 180 in 2009. In 2009 there were 40%fewer motorized and non-motorized crossing fatalities than tres-passing deaths.
When suicides and pedestrian fatalities at grade crossings areincluded with trespassers, it is clear that, numerically, the greatestsafety problem facing the railroads is trains striking pedestrians.That said, pedestrian incidents rarely lead to physical damage to thetrain or serious injuries to passengers or employees on the train.(The mental injuries suffered by locomotive engineers and trainconductors who witness these events are another matter entirely.)In contrast there is a genuine concern that collisions with motorvehicles can lead to catastrophic consequences including thederailment of the train. At Glendale, California in 2005 a highwayuser drove a sport-utility vehicle off of a crossing onto the adjacenttracks leading to collision involving two passenger trains anda freight train and the deaths of 10 passengers and one employee. In1999 a collision between an Amtrak train and a truck at Bourbon-nais, Illinois led to the deaths of 11 train passengers.
Relative to trespasser and crossing incidents, fatal incidentsaffecting other groups were quite rare. Half of the 26 employee andcontractor fatalities each year occurred in maintenance activitiesincluding the maintenance of track and structures. Many of thesedid not involve amoving train. Train crews do face risks in collisionsand derailments, but they also face risks while coupling anduncoupling locomotives and train cars, and from falling whilegetting on or off rolling stock or while walking beside the track.
Over the whole decade, there were a total of 70 passengers-on-trains fatalities. Half of the fatalities occurred in two incidents, the10 passenger fatalities in the 2005 Glendale, California crashdescribed above, and the 24 passengers who died at Chatsworth,California in 2008when a commuter train passed a signal at danger,and collided head-on with a freight train.
Finally there were a total of 38 people in the decade who wereadjacent to the railroad and fatally injured by flying debris or therelease of hazardous materials. Eight of the off-railroad fatalitiesoccurred in a single incident at Graniteville, South Carolina in 2005when a two-train collision led to the release of chlorine gas.
1.4. Maritime
Maritime data includes all incidents in United States territorialwaters and inland waterways and lakes, and all incidents involvingU.S.-registered vessels anywhere in the world. The data excludesdeaths due to suicide, homicide, altercations onboard and passen-gers who die onboard from pre-existing medical conditions. It alsoexcludes deaths in shore-side port facilities, and persons who arewalking on docks and fall into the water and drown.
The annual maritime death toll averaged 833. The vast majority(85%) of the deaths involved private recreational vessels whichrange in size from large luxury private yachts to personal watercraft (commonly referred to by the commercial trade names “jetski” and “wave runner”), row boats, kayaks and canoes. Theremaining fatalities were in a variety of commercial vessels thatrange from small vessels offering fishing and diving trips throughtugs and commercial fishing vessels to large passenger ships, oiltankers and container ships. About 55% of commercial-sectorfatalities occurred in “vessel casualties” where the vessel alsosustained damage, but 45% were in circumstances where the vesseldid not sustain any damage such as would occur if a person felloverboard and drowned. Approximately two-thirds of commercial
I. Savage / Research in Transportation Economics 43 (2013) 9e22 13
vessel casualties were employees and one-third were passengers.Of the passenger fatalities on commercial vessels, a third of themoccurred in scuba diving and snorkeling incidents.
1.5. Aviation
Aviation crash data includes incidents occurring in United Statesairspace and incidents overseas involving U.S.-registered aircraft.Traditionally aviation crash and fatality rates are reported afterexcluding incidents of suicide, sabotage and terrorism. Usually thisexclusion only affects a handful of suicide-related private generalaviation crashes each year. Of course, the past decade included thehijackings of four commercial aircraft on September 11, 2001 thatresulted in the deaths of the 265 persons onboard and approxi-mately 2,730 persons on the ground. Excluding suicide andterrorism cases, the categorization of the average annual fatalitieswas:
549 e Private flying (“general aviation”),50 e Passengers and crew on large (10 or more seats) scheduledcommercial aircraft,42 e Passengers and crew on small (fewer than 10 seats) non-scheduled commercial aircraft (on-demand air taxis, medicalflights etc.),2 e Passengers and crew on small (fewer than 10 seats)scheduled commercial aircraft,2 e Persons on the ground,1 e Crew member on large (10 or more seats) non-scheduledcommercial aircraft (primarily freight operations).
The vast majority of the annual aviation fatalities (85%) occurredin incidents involving private flying. Private flying covers a range ofactivities. The Federal Aviation Administration’s (2009) annualsurvey of general aviation activity indicates that 41% of flight hoursare for personal recreation, 24% are business trips, and 17% areinstructional. Aerial businesses such as photography, mapping,surveying and crop dusting account for most of the remaining 18%of flight hours.
Nearly all of the fatalities in general aviation occurred in single-aircraft incidents. Oster, Strong, and Zorn (1992) indicate thatunforced pilot errors account for the majority of general aviationcrashes, and a majority of these errors are due to the exercise ofpoor judgment by the pilot. In contrast mechanical problems andbadweather are much less important in explaining incidents. Therehave been occasions when two private aircraft collide in mid-air,and in some cases a private aircraft has collided with a commer-cial aircraft. In the past decade there were only a few collisionsbetween private and commercial aircraft, and all of them involveda commercial aircraft with less than 10 seats that was providingunscheduled service. In prior decades there had been some highfatality events when a small aircraft collided with a large passengeraircraft. (Indeed, in 2006 there was a collision between a new U.S.-registered private aircraft that was being delivered from a Brazilianfactory and a Brazilian passenger aircraft in Brazilian airspace. The154 fatalities on the Brazilian plane are not included in thisanalysis.)
Of the 501 total fatalities in the decade onboard scheduledcommercial large aircraft flights, 446 occurred in four incidents. In2000, 88 persons died after a mechanical failure on an aircraft overthe Pacific Ocean off the California coast. In 2001 an aircraft crashedinto a neighborhood of New York City with the deaths of 260onboard and 5 persons on the ground following structural failurecaused by excessive rudder use to counteract turbulence. In 2006,49 people died when the pilots of an aircraft mistakenly selecteda runway that was too short during a take-off from Lexington,
Kentucky. Finally, in 2009, 49 persons aboard and 1 person on theground died due to pilot error in responding to bad weather whenan aircraft was approaching to land at Buffalo, New York State.
In the past there have been high fatality events involving largeaircraft in non-scheduled operations. These operations includecharter flights and military transport flights by civilian aircraft.However, there have not been any such incidents since the mid1990s. In recent times, large aircraft fatal crashes in non-scheduledoperation have primarily been air cargo flights.
Each year about 25 passengers and 17 crew members died inincidents involving non-scheduled commercial service by smallaircraft. The vast majority (75%) of the total flight hours for thiscategory of flying are on-demand air taxi operations. Many of theseoperations are in remote areas with difficult flying conditions suchas in Alaska. The next largest category is medical transport flights.These flights represent 17% of flight hours by non-scheduled smallaircraft. In 2009, the National Transportation Safety Board under-took an investigation of medical flights involving helicopters inresponse to series of fatal incidents.
1.6. Rail transit
There are broad reporting requirements for rail transit fatalities.While transit deaths exclude those from illnesses and medicalconditions, rail transit statistics include victims of crime, and otherincidents not involving a moving train such as persons who falldown flights of stairs in a subway station. There is also requiredreporting of suicides, although the approximately 22 such annualfatalities are not included in Table 1.
Each year on average there were 8 deaths of passengers whileonboard trains, 15 passenger deaths at stations, and 3 employeedeaths. In addition there was an average of 8 highway user fatalitiesfrom collisions at rail-highway grade crossings and 34 trespassersfatalities. In recent decades there has been a resurgence of light-railtransit service. Some of these systems feature on-street running, orreserved rights-of-way adjacent to the highway. There is a growingconcern that the reemergence of streetcars is a hazard to unwarymotorists and pedestrians, and that there has been an increase inhighway-light rail grade crossings at a time when mainline rail-roads have been working to reduce the number of crossings.
1.7. Pipelines
Pipelines are an often forgotten transportation mode, yet theyaccount for a fifth of freight ton-miles (Eno TransportationFoundation, 2007). The primary goods moved are crude oil, oilproducts and natural gas. Natural gas pipelines encompass bothlong-distance transmission lines and local distribution lines. Whilethere were a handful of employee deaths each year, the majority ofthe risk is to bystanders with an average of 12 bystanders killedeach year primarily in fires and explosions. Most of the risk was inlocal gas distribution.
The preceding discussion has presented the number of fatalitiesin absolute terms and without reference to the relative amounts oftravel. Table 2 presents an average passenger fatality rate per billionpassenger miles for seven different modes for the 2000 to 2009period. The numerator for commercial modes only includesonboard passenger fatalities and excludes fatal injuries toemployees. The choice of a denominator for such a comparison isalways controversial. We have used passenger miles as the expo-sure variable because it allows a safety comparison that might bemade if a person was choosing between modes for a given journey.
Table 3Workplace fatality rate per 1000 employees 2009 with comparison to other non-transportation industry segments in italics.
NAICS classification Fatality rate
Fishing 1141 8.81Agriculture 111/112 0.76Taxi and limousine 4853 0.62a
bus, charter bus, other transit andground passenger transportation
4852/4/5/9 0.03
Manufacturing 31/32/33 0.03Warehousing and Storage 493 0.02
Notes: NAICS ¼ North American Industry Classification System.a 55% of fatalities to taxi and limousine employees are due to assaults and violent
acts. Source: Bureau of Labor Statistics.
Table 2Passenger fatalities per billion passenger miles 2000e2009.
Riding a motorcycle 212.57Driving or passenger in a car or light truck 7.28Passenger on a local ferryboat 3.17Passenger on commuter rail and Amtrak 0.43Passenger on urban mass transit rail (2002e2009)a 0.24Passenger on a bus (holding more than 10
passengers e transit, inter-city, school, charter)0.11
Passenger on commercial aviation 0.07
a While onboard a train including assault and violent acts. Sources: See Appendix A.
I. Savage / Research in Transportation Economics 43 (2013) 9e2214
Engineers might argue for the use of more technology-drivendenominators such as passenger-hours or vehicle-hours toaccount for different vehicle capacities and the average speed oftravel.
Commercial aviation, which is defined here as scheduled serviceprovided in a U.S.-registered aircraft of more than 10 seats indomestic and international service (“Part 121 scheduled service”)was the safest mode of travel at 0.07 fatalities per billion passengermiles. A person who took a 500 mile flight every single day fora year, would have a fatality risk of 1 in 85,000.
While commercial aviation has long been recognized as thesafest mode of transportation, passengers on buses had a fatalityrate that was almost as good. Passengers on buses of all typesholding more than 10 passengers had a fatality rate of 0.11 perbillion passenger-miles or about 65% greater than that for aviation.
It would appear that urban mass transit rail had a fatality rateabout double that for buses, but it should be remembered that therail mode includes crime victims, whereas bus casualties are onlythose that occur in a crash or if a person falls within the vehicle.
Mainline passenger rail service had a considerably worse fatalityrate at 0.43 per billion passenger miles. This is about four times therisk for bus passengers and six times the risk in commercialaviation.
Deaths on scheduled ferryboats are rare, but the number ofpassengers each year is relatively small. Consequently, when thedecade includes a major incident, the risks can look large at 30times the risk for bus passengers. All of the 11 ferry passengerdeaths in the past decade occurred in one incident in New York Cityin 2003 when a ferry approached a dock at faster than normalspeed and struck the jetty.
Persons whowere the driver of, or a passenger in, an automobileor light truck faced a fatality risk of 7.3 per billion passenger-miles.A person who was in a motor vehicle for 30 miles every day fora year faced a fatality risk of about 1 in 12,500. Relative to mainlinetrains, buses and commercial aviation the risk was 17, 67, and 112times greater, respectively. Of course, unlike the commercial modeswhere passengers are victimized randomly, the risk to individualhighways users varies considerably depending on age, alcoholconsumption and the type of road used. To the extent that aviationis disproportionately used by business travelers who are typicallyolder, travel at times of day when there is a lesser incidence ofimpaired drivers, drive larger vehicles, and use Interstate highways,the comparison between driving and aviation would be lessunfavorable.
Finally, motorcycles had a fatality rate of 212 per billionpassenger miles. A motorcyclist who traveled 15miles every day fora year, had an astonishing 1 in 860 chance of dying. The rate perpassenger mile was 29 times that for automobiles and light trucks.
The annual fatality risk per 1000 employees in different industrysegments is shown in Table 3. The data are for 2009 and are
obtained from the Department of Labor. Reporting firms are clas-sified into industrial groups using the North American IndustryClassification System. Consequently, there may not be a perfectalignment of this data with the modal data that was discussedearlier in this section. In addition some fatalities that occur inancillary activities such as maintenance would be included in thisdataset but not in the data on crashes that are reported to theDepartment of Transportation. Table 3 displays the industries ina descending order of fatality risk. For purposes of comparison,leading non-transportation industry segments are also included,and are shown in italics.
One might imagine that transportation would be a relativelyrisky industry in which to work as it is characterized by outdooractivities involving heavy moving machinery in locations that canbe far away from immediate medical care. Indeed, fishing is one ofthe most hazardous occupations in the United States with anannual fatality rate of 1 in 115. The risk is about 30 times that oftruck drivers. The next most dangerous transportation occupationis driving a taxi or limousine with an annual fatality risk of 1 in1600. More than half of the fatalities occur in assaults and violentacts. Excluding homicides the risk to taxi and limousine drivers iscomparable to that of truck drivers.
Even the more moderate fatality risks in trucking and non-fishing maritime transportation are quite high in comparisonwith some other industries that might appear to be quite compa-rable in terms of the type of risks that might be faced. Trucking andmaritime fatality rates are twice as high as those in the mining andconstruction industries. Working in the railroad and aviationindustry is much less risky. The risks are only one fifth of those inthe trucking industry. But even in the comparatively less riskyrailroad and aviation industries, employee fatality rates are stilltwice those of working in manufacturing.
2. Time-series analysis
The second part of the paper is an analysis of the trends infatalities and fatality rates across the 36 year period from 1975 to2010. A series of figures is used to plot the data and illustrate thetrends. A Supplementary Appendix containing the data for thefigures is posted on the journal website.
I. Savage / Research in Transportation Economics 43 (2013) 9e22 15
2.1. Highways
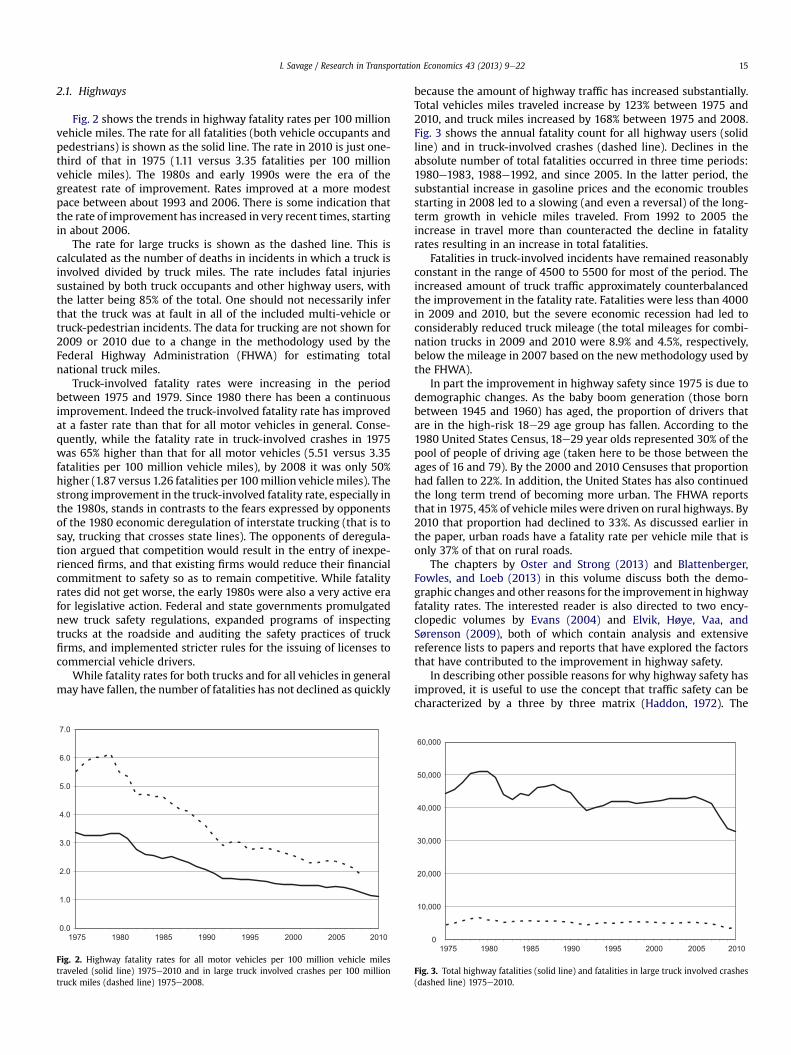
Fig. 2 shows the trends in highway fatality rates per 100 millionvehicle miles. The rate for all fatalities (both vehicle occupants andpedestrians) is shown as the solid line. The rate in 2010 is just one-third of that in 1975 (1.11 versus 3.35 fatalities per 100 millionvehicle miles). The 1980s and early 1990s were the era of thegreatest rate of improvement. Rates improved at a more modestpace between about 1993 and 2006. There is some indication thatthe rate of improvement has increased in very recent times, startingin about 2006.
The rate for large trucks is shown as the dashed line. This iscalculated as the number of deaths in incidents in which a truck isinvolved divided by truck miles. The rate includes fatal injuriessustained by both truck occupants and other highway users, withthe latter being 85% of the total. One should not necessarily inferthat the truck was at fault in all of the included multi-vehicle ortruck-pedestrian incidents. The data for trucking are not shown for2009 or 2010 due to a change in the methodology used by theFederal Highway Administration (FHWA) for estimating totalnational truck miles.
Truck-involved fatality rates were increasing in the periodbetween 1975 and 1979. Since 1980 there has been a continuousimprovement. Indeed the truck-involved fatality rate has improvedat a faster rate than that for all motor vehicles in general. Conse-quently, while the fatality rate in truck-involved crashes in 1975was 65% higher than that for all motor vehicles (5.51 versus 3.35fatalities per 100 million vehicle miles), by 2008 it was only 50%higher (1.87 versus 1.26 fatalities per 100million vehiclemiles). Thestrong improvement in the truck-involved fatality rate, especially inthe 1980s, stands in contrasts to the fears expressed by opponentsof the 1980 economic deregulation of interstate trucking (that is tosay, trucking that crosses state lines). The opponents of deregula-tion argued that competition would result in the entry of inexpe-rienced firms, and that existing firms would reduce their financialcommitment to safety so as to remain competitive. While fatalityrates did not get worse, the early 1980s were also a very active erafor legislative action. Federal and state governments promulgatednew truck safety regulations, expanded programs of inspectingtrucks at the roadside and auditing the safety practices of truckfirms, and implemented stricter rules for the issuing of licenses tocommercial vehicle drivers.
While fatality rates for both trucks and for all vehicles in generalmay have fallen, the number of fatalities has not declined as quickly
0.0
1.0
2.0
3.0
4.0
5.0
6.0
7.0
1975 1980 1985 1990 1995 2000 2005 2010
Fig. 2. Highway fatality rates for all motor vehicles per 100 million vehicle milestraveled (solid line) 1975e2010 and in large truck involved crashes per 100 milliontruck miles (dashed line) 1975e2008.
because the amount of highway traffic has increased substantially.Total vehicles miles traveled increase by 123% between 1975 and2010, and truck miles increased by 168% between 1975 and 2008.Fig. 3 shows the annual fatality count for all highway users (solidline) and in truck-involved crashes (dashed line). Declines in theabsolute number of total fatalities occurred in three time periods:1980e1983, 1988e1992, and since 2005. In the latter period, thesubstantial increase in gasoline prices and the economic troublesstarting in 2008 led to a slowing (and even a reversal) of the long-term growth in vehicle miles traveled. From 1992 to 2005 theincrease in travel more than counteracted the decline in fatalityrates resulting in an increase in total fatalities.
Fatalities in truck-involved incidents have remained reasonablyconstant in the range of 4500 to 5500 for most of the period. Theincreased amount of truck traffic approximately counterbalancedthe improvement in the fatality rate. Fatalities were less than 4000in 2009 and 2010, but the severe economic recession had led toconsiderably reduced truck mileage (the total mileages for combi-nation trucks in 2009 and 2010 were 8.9% and 4.5%, respectively,below the mileage in 2007 based on the newmethodology used bythe FHWA).
In part the improvement in highway safety since 1975 is due todemographic changes. As the baby boom generation (those bornbetween 1945 and 1960) has aged, the proportion of drivers thatare in the high-risk 18e29 age group has fallen. According to the1980 United States Census, 18e29 year olds represented 30% of thepool of people of driving age (taken here to be those between theages of 16 and 79). By the 2000 and 2010 Censuses that proportionhad fallen to 22%. In addition, the United States has also continuedthe long term trend of becoming more urban. The FHWA reportsthat in 1975, 45% of vehicle miles were driven on rural highways. By2010 that proportion had declined to 33%. As discussed earlier inthe paper, urban roads have a fatality rate per vehicle mile that isonly 37% of that on rural roads.
The chapters by Oster and Strong (2013) and Blattenberger,Fowles, and Loeb (2013) in this volume discuss both the demo-graphic changes and other reasons for the improvement in highwayfatality rates. The interested reader is also directed to two ency-clopedic volumes by Evans (2004) and Elvik, Høye, Vaa, andSørenson (2009), both of which contain analysis and extensivereference lists to papers and reports that have explored the factorsthat have contributed to the improvement in highway safety.
In describing other possible reasons for why highway safety hasimproved, it is useful to use the concept that traffic safety can becharacterized by a three by three matrix (Haddon, 1972). The
0
10,000
20,000
30,000
40,000
50,000
60,000
1975 1980 1985 1990 1995 2000 2005 2010
Fig. 3. Total highway fatalities (solid line) and fatalities in large truck involved crashes(dashed line) 1975e2010.
0
25
50
75
100
125
1975 1980 1985 1990 1995 2000 2005 2010
Trespassers per Capita Employees per Employee HourPassengers per Passenger Mile (11-yr Moving Av) Crossing Users per Vehicle Registered
Fig. 4. Indices of railroad fatality rates 1975e2010 with 1975 ¼ 100.
I. Savage / Research in Transportation Economics 43 (2013) 9e2216
categories on one axis are the driver, the vehicle, and the highway.The other axis is composed of actions before a crash (“crashavoidance”), the crash phase, and the post-crash phase.
In the crash avoidance phase there has been public policy actionto improve the training of young drivers and to restrict the activi-ties of the youngest and most inexperienced drivers. Society hasalso taken a strong line since the 1970s to combat driving under theinfluence of alcohol through public information campaigns,lowering the permissible level of alcohol in the blood, lawenforcement efforts, and increasing the minimum age for alcoholconsumption to 21. Vehicle improvements that have aided crashavoidance include advances in tire technology, and the deploymentof stability control and anti-lock brakes. In addition, improvementsin highway construction and geometry have promoted crashavoidance.
During the crash phase, injuries have been reduced and theirseverity mitigated by educational programs, legal changes and lawenforcement efforts that have led to a greater proportion of driversand passengers using seat belts and child safety seats. Vehicledesign changes have reduced the severity of injuries. These includethe strengthening of the passenger cabin and the redesigning ofinterior surfaces. The design of highways has also changed overtime to mitigating the harm when a crash occurs. In particularguardrails, signposts and bridge abutments have been redesignedto be less dangerous when a vehicle collides with them after havingleft the highway.
Finally, a significant reduction in fatality risk has come from animproved medical response in the post-crash phase. Theimprovement has come in the form of quicker initial responsetimes, better equipment available in ambulances, and the use ofhelicopters to transport crash victims to hospital.
But there have been changes that have worked against thesafety improvements. In 1975 there was a 55 mph national speedlimit that was introduced as a result of the oil crisis of 1973. Thefederal speed limits were subsequently relaxed in the late 1980sand abolished in 1995. Consumers also elected to drive smaller andlighter vehicles. This was due to the increased cost of gasoline in thelate 1970s, and new standards for fuel economy that were imposedstarting with the 1978 model year. Finally, there has been a generalrollback in the number of states requiringmotorcycle riders towearhelmets.
While the downward trend in fatality rates may appear to beimpressive, other countries have improved at an even faster rate. In1970 the United States was the leader in highway safety asmeasured by fatalities per vehicle mile. Now Australia, Canada, andcountries in Scandinavia and Western Europe have lower fatalityrates (International Transport Forum, 2011). Evans (2004, chapter15) argues that laxer laws in the United States compared withother countries on seat belt use and driving while intoxicated havecontributed to the slower rate of improvement.
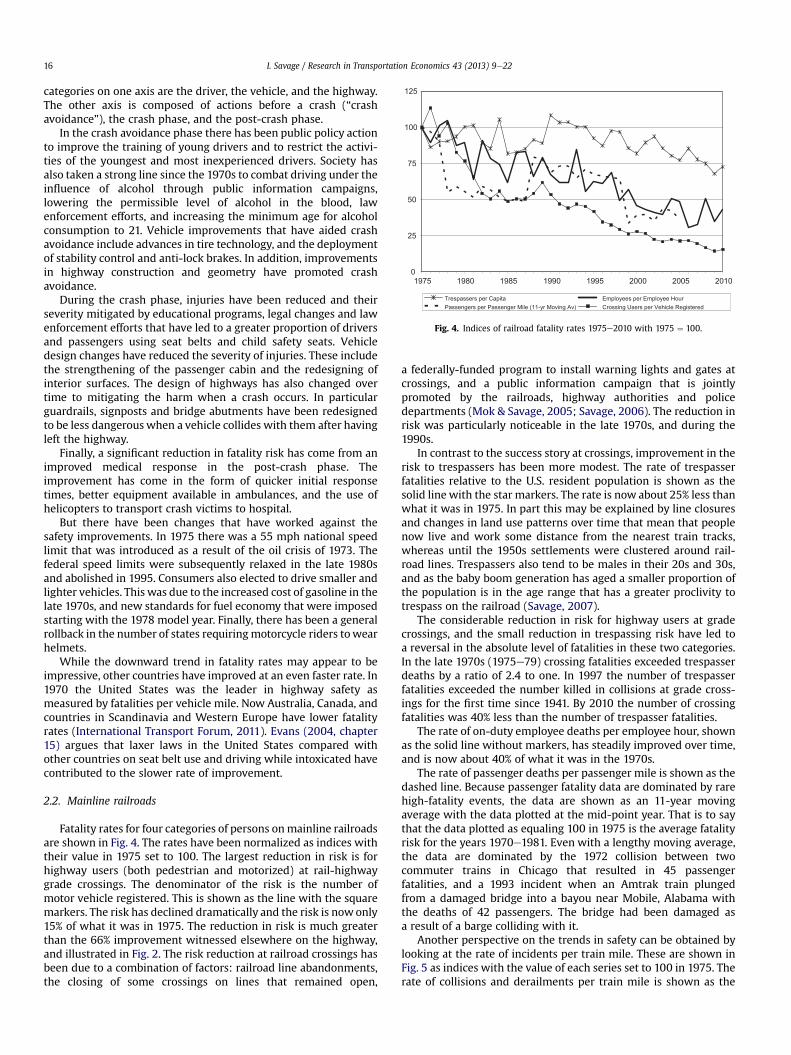
2.2. Mainline railroads
Fatality rates for four categories of persons onmainline railroadsare shown in Fig. 4. The rates have been normalized as indices withtheir value in 1975 set to 100. The largest reduction in risk is forhighway users (both pedestrian and motorized) at rail-highwaygrade crossings. The denominator of the risk is the number ofmotor vehicle registered. This is shown as the line with the squaremarkers. The risk has declined dramatically and the risk is now only15% of what it was in 1975. The reduction in risk is much greaterthan the 66% improvement witnessed elsewhere on the highway,and illustrated in Fig. 2. The risk reduction at railroad crossings hasbeen due to a combination of factors: railroad line abandonments,the closing of some crossings on lines that remained open,
a federally-funded program to install warning lights and gates atcrossings, and a public information campaign that is jointlypromoted by the railroads, highway authorities and policedepartments (Mok & Savage, 2005; Savage, 2006). The reduction inrisk was particularly noticeable in the late 1970s, and during the1990s.
In contrast to the success story at crossings, improvement in therisk to trespassers has been more modest. The rate of trespasserfatalities relative to the U.S. resident population is shown as thesolid line with the star markers. The rate is now about 25% less thanwhat it was in 1975. In part this may be explained by line closuresand changes in land use patterns over time that mean that peoplenow live and work some distance from the nearest train tracks,whereas until the 1950s settlements were clustered around rail-road lines. Trespassers also tend to be males in their 20s and 30s,and as the baby boom generation has aged a smaller proportion ofthe population is in the age range that has a greater proclivity totrespass on the railroad (Savage, 2007).
The considerable reduction in risk for highway users at gradecrossings, and the small reduction in trespassing risk have led toa reversal in the absolute level of fatalities in these two categories.In the late 1970s (1975e79) crossing fatalities exceeded trespasserdeaths by a ratio of 2.4 to one. In 1997 the number of trespasserfatalities exceeded the number killed in collisions at grade cross-ings for the first time since 1941. By 2010 the number of crossingfatalities was 40% less than the number of trespasser fatalities.
The rate of on-duty employee deaths per employee hour, shownas the solid line without markers, has steadily improved over time,and is now about 40% of what it was in the 1970s.
The rate of passenger deaths per passenger mile is shown as thedashed line. Because passenger fatality data are dominated by rarehigh-fatality events, the data are shown as an 11-year movingaverage with the data plotted at the mid-point year. That is to saythat the data plotted as equaling 100 in 1975 is the average fatalityrisk for the years 1970e1981. Even with a lengthy moving average,the data are dominated by the 1972 collision between twocommuter trains in Chicago that resulted in 45 passengerfatalities, and a 1993 incident when an Amtrak train plungedfrom a damaged bridge into a bayou near Mobile, Alabama withthe deaths of 42 passengers. The bridge had been damaged asa result of a barge colliding with it.
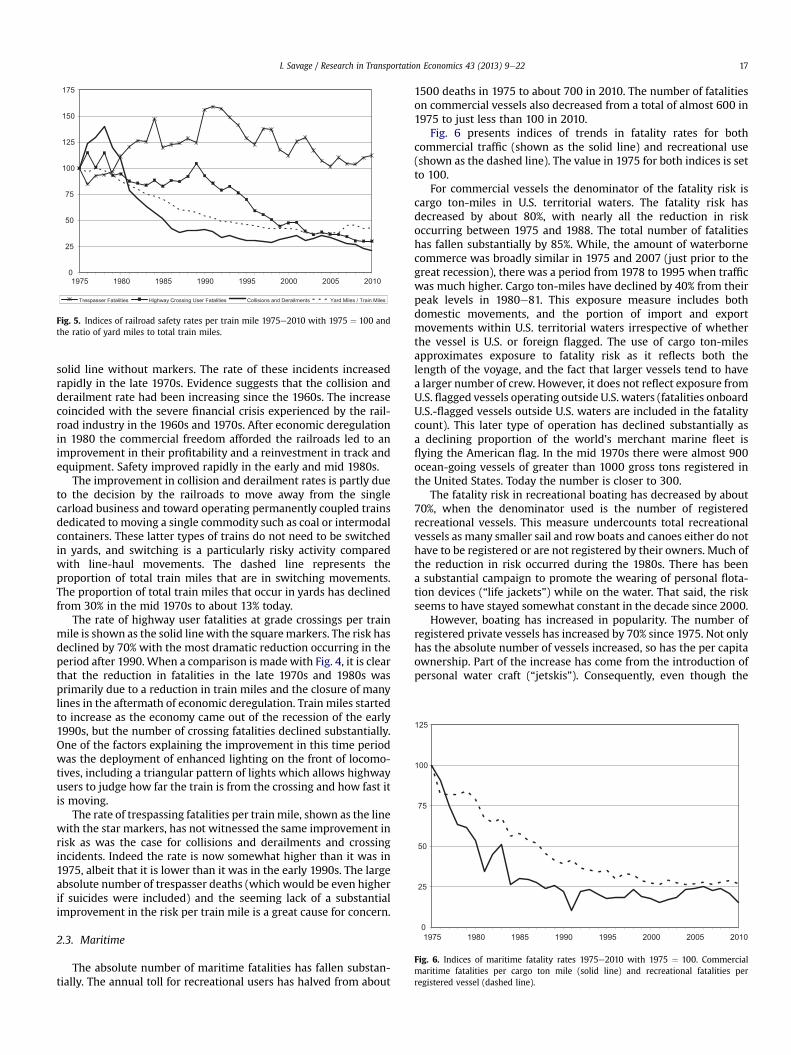
Another perspective on the trends in safety can be obtained bylooking at the rate of incidents per train mile. These are shown inFig. 5 as indices with the value of each series set to 100 in 1975. Therate of collisions and derailments per train mile is shown as the
Fig. 5. Indices of railroad safety rates per train mile 1975e2010 with 1975 ¼ 100 andthe ratio of yard miles to total train miles.
0
25
50
75
100
125
1975 1980 1985 1990 1995 2000 2005 2010
Fig. 6. Indices of maritime fatality rates 1975e2010 with 1975 ¼ 100. Commercialmaritime fatalities per cargo ton mile (solid line) and recreational fatalities perregistered vessel (dashed line).
I. Savage / Research in Transportation Economics 43 (2013) 9e22 17
solid line without markers. The rate of these incidents increasedrapidly in the late 1970s. Evidence suggests that the collision andderailment rate had been increasing since the 1960s. The increasecoincided with the severe financial crisis experienced by the rail-road industry in the 1960s and 1970s. After economic deregulationin 1980 the commercial freedom afforded the railroads led to animprovement in their profitability and a reinvestment in track andequipment. Safety improved rapidly in the early and mid 1980s.
The improvement in collision and derailment rates is partly dueto the decision by the railroads to move away from the singlecarload business and toward operating permanently coupled trainsdedicated to moving a single commodity such as coal or intermodalcontainers. These latter types of trains do not need to be switchedin yards, and switching is a particularly risky activity comparedwith line-haul movements. The dashed line represents theproportion of total train miles that are in switching movements.The proportion of total train miles that occur in yards has declinedfrom 30% in the mid 1970s to about 13% today.
The rate of highway user fatalities at grade crossings per trainmile is shown as the solid linewith the squaremarkers. The risk hasdeclined by 70% with the most dramatic reduction occurring in theperiod after 1990. When a comparison is madewith Fig. 4, it is clearthat the reduction in fatalities in the late 1970s and 1980s wasprimarily due to a reduction in train miles and the closure of manylines in the aftermath of economic deregulation. Train miles startedto increase as the economy came out of the recession of the early1990s, but the number of crossing fatalities declined substantially.One of the factors explaining the improvement in this time periodwas the deployment of enhanced lighting on the front of locomo-tives, including a triangular pattern of lights which allows highwayusers to judge how far the train is from the crossing and how fast itis moving.
The rate of trespassing fatalities per trainmile, shown as the linewith the star markers, has not witnessed the same improvement inrisk as was the case for collisions and derailments and crossingincidents. Indeed the rate is now somewhat higher than it was in1975, albeit that it is lower than it was in the early 1990s. The largeabsolute number of trespasser deaths (which would be even higherif suicides were included) and the seeming lack of a substantialimprovement in the risk per train mile is a great cause for concern.
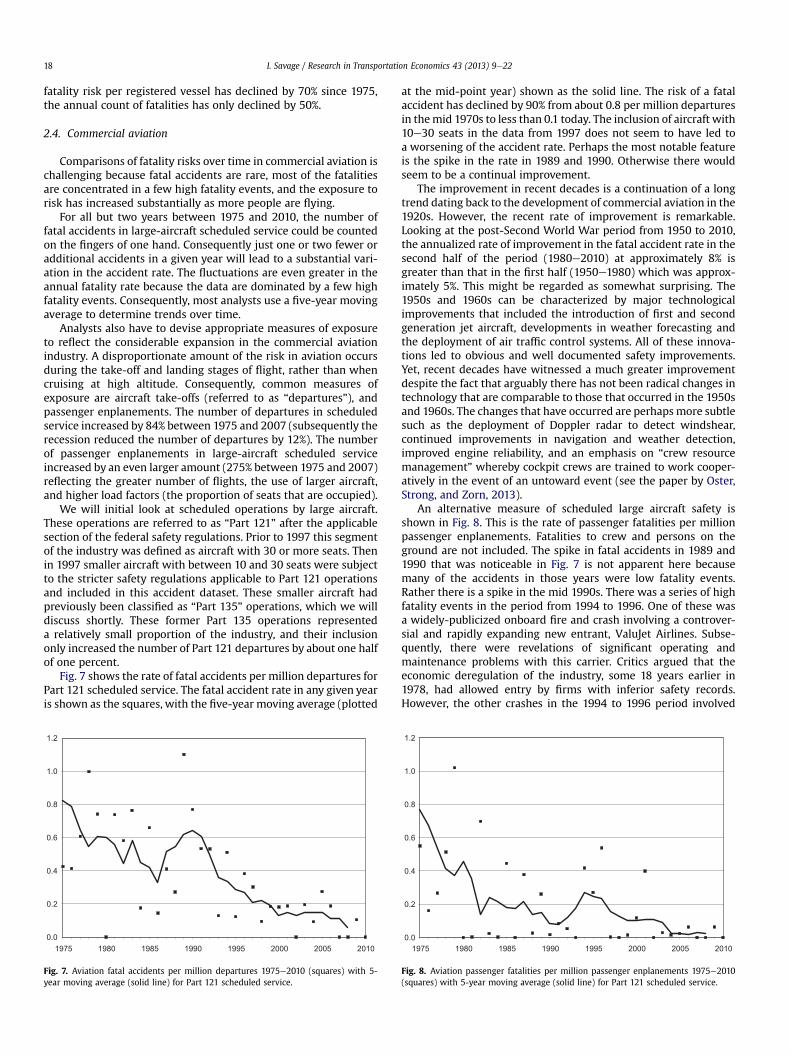
2.3. Maritime
The absolute number of maritime fatalities has fallen substan-tially. The annual toll for recreational users has halved from about
1500 deaths in 1975 to about 700 in 2010. The number of fatalitieson commercial vessels also decreased from a total of almost 600 in1975 to just less than 100 in 2010.
Fig. 6 presents indices of trends in fatality rates for bothcommercial traffic (shown as the solid line) and recreational use(shown as the dashed line). The value in 1975 for both indices is setto 100.
For commercial vessels the denominator of the fatality risk iscargo ton-miles in U.S. territorial waters. The fatality risk hasdecreased by about 80%, with nearly all the reduction in riskoccurring between 1975 and 1988. The total number of fatalitieshas fallen substantially by 85%. While, the amount of waterbornecommerce was broadly similar in 1975 and 2007 (just prior to thegreat recession), there was a period from 1978 to 1995 when trafficwas much higher. Cargo ton-miles have declined by 40% from theirpeak levels in 1980e81. This exposure measure includes bothdomestic movements, and the portion of import and exportmovements within U.S. territorial waters irrespective of whetherthe vessel is U.S. or foreign flagged. The use of cargo ton-milesapproximates exposure to fatality risk as it reflects both thelength of the voyage, and the fact that larger vessels tend to havea larger number of crew. However, it does not reflect exposure fromU.S. flagged vessels operating outside U.S. waters (fatalities onboardU.S.-flagged vessels outside U.S. waters are included in the fatalitycount). This later type of operation has declined substantially asa declining proportion of the world’s merchant marine fleet isflying the American flag. In the mid 1970s there were almost 900ocean-going vessels of greater than 1000 gross tons registered inthe United States. Today the number is closer to 300.
The fatality risk in recreational boating has decreased by about70%, when the denominator used is the number of registeredrecreational vessels. This measure undercounts total recreationalvessels as many smaller sail and row boats and canoes either do nothave to be registered or are not registered by their owners. Much ofthe reduction in risk occurred during the 1980s. There has beena substantial campaign to promote the wearing of personal flota-tion devices (“life jackets”) while on the water. That said, the riskseems to have stayed somewhat constant in the decade since 2000.
However, boating has increased in popularity. The number ofregistered private vessels has increased by 70% since 1975. Not onlyhas the absolute number of vessels increased, so has the per capitaownership. Part of the increase has come from the introduction ofpersonal water craft (“jetskis”). Consequently, even though the
I. Savage / Research in Transportation Economics 43 (2013) 9e2218
fatality risk per registered vessel has declined by 70% since 1975,the annual count of fatalities has only declined by 50%.
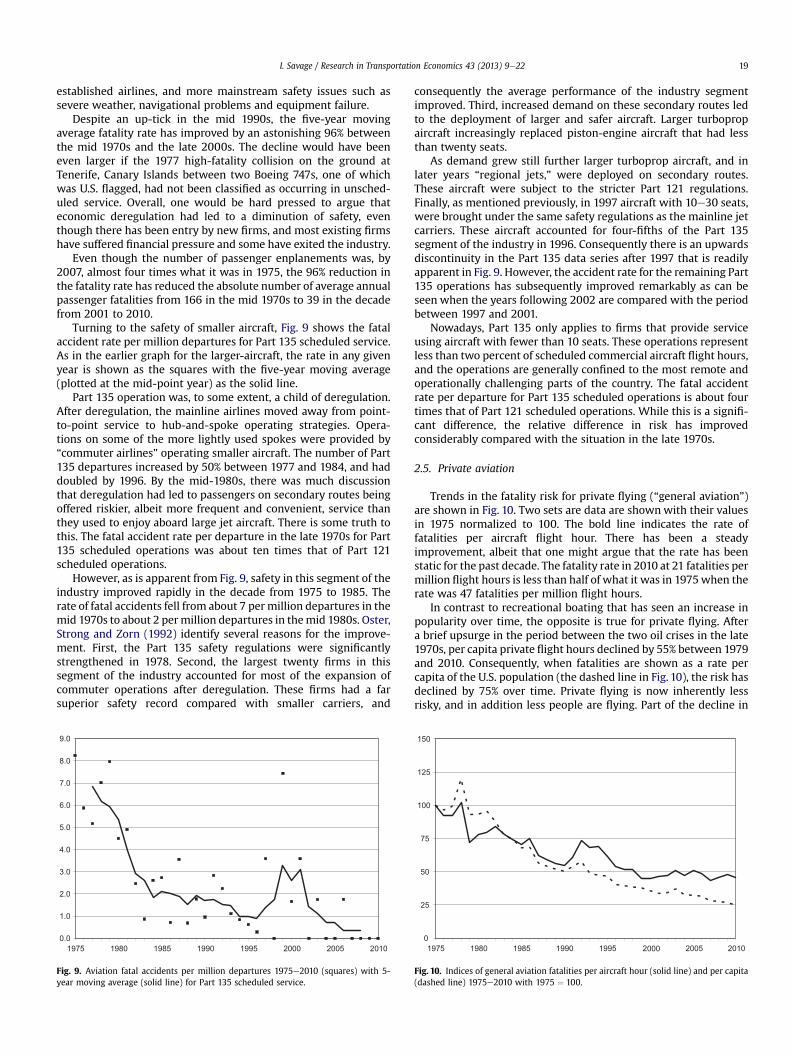
2.4. Commercial aviation
Comparisons of fatality risks over time in commercial aviation ischallenging because fatal accidents are rare, most of the fatalitiesare concentrated in a few high fatality events, and the exposure torisk has increased substantially as more people are flying.
For all but two years between 1975 and 2010, the number offatal accidents in large-aircraft scheduled service could be countedon the fingers of one hand. Consequently just one or two fewer oradditional accidents in a given year will lead to a substantial vari-ation in the accident rate. The fluctuations are even greater in theannual fatality rate because the data are dominated by a few highfatality events. Consequently, most analysts use a five-year movingaverage to determine trends over time.
Analysts also have to devise appropriate measures of exposureto reflect the considerable expansion in the commercial aviationindustry. A disproportionate amount of the risk in aviation occursduring the take-off and landing stages of flight, rather than whencruising at high altitude. Consequently, common measures ofexposure are aircraft take-offs (referred to as “departures”), andpassenger enplanements. The number of departures in scheduledservice increased by 84% between 1975 and 2007 (subsequently therecession reduced the number of departures by 12%). The numberof passenger enplanements in large-aircraft scheduled serviceincreased by an even larger amount (275% between 1975 and 2007)reflecting the greater number of flights, the use of larger aircraft,and higher load factors (the proportion of seats that are occupied).
We will initial look at scheduled operations by large aircraft.These operations are referred to as “Part 121” after the applicablesection of the federal safety regulations. Prior to 1997 this segmentof the industry was defined as aircraft with 30 or more seats. Thenin 1997 smaller aircraft with between 10 and 30 seats were subjectto the stricter safety regulations applicable to Part 121 operationsand included in this accident dataset. These smaller aircraft hadpreviously been classified as “Part 135” operations, which we willdiscuss shortly. These former Part 135 operations representeda relatively small proportion of the industry, and their inclusiononly increased the number of Part 121 departures by about one halfof one percent.
Fig. 7 shows the rate of fatal accidents per million departures forPart 121 scheduled service. The fatal accident rate in any given yearis shown as the squares, with the five-year moving average (plotted
0.0
0.2
0.4
0.6
0.8
1.0
1.2
1975 1980 1985 1990 1995 2000 2005 2010
Fig. 7. Aviation fatal accidents per million departures 1975e2010 (squares) with 5-year moving average (solid line) for Part 121 scheduled service.
at the mid-point year) shown as the solid line. The risk of a fatalaccident has declined by 90% from about 0.8 per million departuresin themid 1970s to less than 0.1 today. The inclusion of aircraft with10e30 seats in the data from 1997 does not seem to have led toa worsening of the accident rate. Perhaps the most notable featureis the spike in the rate in 1989 and 1990. Otherwise there wouldseem to be a continual improvement.
The improvement in recent decades is a continuation of a longtrend dating back to the development of commercial aviation in the1920s. However, the recent rate of improvement is remarkable.Looking at the post-Second World War period from 1950 to 2010,the annualized rate of improvement in the fatal accident rate in thesecond half of the period (1980e2010) at approximately 8% isgreater than that in the first half (1950e1980) which was approx-imately 5%. This might be regarded as somewhat surprising. The1950s and 1960s can be characterized by major technologicalimprovements that included the introduction of first and secondgeneration jet aircraft, developments in weather forecasting andthe deployment of air traffic control systems. All of these innova-tions led to obvious and well documented safety improvements.Yet, recent decades have witnessed a much greater improvementdespite the fact that arguably there has not been radical changes intechnology that are comparable to those that occurred in the 1950sand 1960s. The changes that have occurred are perhapsmore subtlesuch as the deployment of Doppler radar to detect windshear,continued improvements in navigation and weather detection,improved engine reliability, and an emphasis on “crew resourcemanagement” whereby cockpit crews are trained to work cooper-atively in the event of an untoward event (see the paper by Oster,Strong, and Zorn, 2013).
An alternative measure of scheduled large aircraft safety isshown in Fig. 8. This is the rate of passenger fatalities per millionpassenger enplanements. Fatalities to crew and persons on theground are not included. The spike in fatal accidents in 1989 and1990 that was noticeable in Fig. 7 is not apparent here becausemany of the accidents in those years were low fatality events.Rather there is a spike in the mid 1990s. There was a series of highfatality events in the period from 1994 to 1996. One of these wasa widely-publicized onboard fire and crash involving a controver-sial and rapidly expanding new entrant, ValuJet Airlines. Subse-quently, there were revelations of significant operating andmaintenance problems with this carrier. Critics argued that theeconomic deregulation of the industry, some 18 years earlier in1978, had allowed entry by firms with inferior safety records.However, the other crashes in the 1994 to 1996 period involved
0.0
0.2
0.4
0.6
0.8
1.0
1.2
1975 1980 1985 1990 1995 2000 2005 2010
Fig. 8. Aviation passenger fatalities per million passenger enplanements 1975e2010(squares) with 5-year moving average (solid line) for Part 121 scheduled service.
I. Savage / Research in Transportation Economics 43 (2013) 9e22 19
established airlines, and more mainstream safety issues such assevere weather, navigational problems and equipment failure.
Despite an up-tick in the mid 1990s, the five-year movingaverage fatality rate has improved by an astonishing 96% betweenthe mid 1970s and the late 2000s. The decline would have beeneven larger if the 1977 high-fatality collision on the ground atTenerife, Canary Islands between two Boeing 747s, one of whichwas U.S. flagged, had not been classified as occurring in unsched-uled service. Overall, one would be hard pressed to argue thateconomic deregulation had led to a diminution of safety, eventhough there has been entry by new firms, and most existing firmshave suffered financial pressure and some have exited the industry.
Even though the number of passenger enplanements was, by2007, almost four times what it was in 1975, the 96% reduction inthe fatality rate has reduced the absolute number of average annualpassenger fatalities from 166 in the mid 1970s to 39 in the decadefrom 2001 to 2010.
Turning to the safety of smaller aircraft, Fig. 9 shows the fatalaccident rate per million departures for Part 135 scheduled service.As in the earlier graph for the larger-aircraft, the rate in any givenyear is shown as the squares with the five-year moving average(plotted at the mid-point year) as the solid line.
Part 135 operation was, to some extent, a child of deregulation.After deregulation, the mainline airlines moved away from point-to-point service to hub-and-spoke operating strategies. Opera-tions on some of the more lightly used spokes were provided by“commuter airlines” operating smaller aircraft. The number of Part135 departures increased by 50% between 1977 and 1984, and haddoubled by 1996. By the mid-1980s, there was much discussionthat deregulation had led to passengers on secondary routes beingoffered riskier, albeit more frequent and convenient, service thanthey used to enjoy aboard large jet aircraft. There is some truth tothis. The fatal accident rate per departure in the late 1970s for Part135 scheduled operations was about ten times that of Part 121scheduled operations.
However, as is apparent from Fig. 9, safety in this segment of theindustry improved rapidly in the decade from 1975 to 1985. Therate of fatal accidents fell from about 7 permillion departures in themid 1970s to about 2 permillion departures in themid 1980s. Oster,Strong and Zorn (1992) identify several reasons for the improve-ment. First, the Part 135 safety regulations were significantlystrengthened in 1978. Second, the largest twenty firms in thissegment of the industry accounted for most of the expansion ofcommuter operations after deregulation. These firms had a farsuperior safety record compared with smaller carriers, and
0.0
1.0
2.0
3.0
4.0
5.0
6.0
7.0
8.0
9.0
1975 1980 1985 1990 1995 2000 2005 2010
Fig. 9. Aviation fatal accidents per million departures 1975e2010 (squares) with 5-year moving average (solid line) for Part 135 scheduled service.
consequently the average performance of the industry segmentimproved. Third, increased demand on these secondary routes ledto the deployment of larger and safer aircraft. Larger turbopropaircraft increasingly replaced piston-engine aircraft that had lessthan twenty seats.
As demand grew still further larger turboprop aircraft, and inlater years “regional jets,” were deployed on secondary routes.These aircraft were subject to the stricter Part 121 regulations.Finally, as mentioned previously, in 1997 aircraft with 10e30 seats,were brought under the same safety regulations as the mainline jetcarriers. These aircraft accounted for four-fifths of the Part 135segment of the industry in 1996. Consequently there is an upwardsdiscontinuity in the Part 135 data series after 1997 that is readilyapparent in Fig. 9. However, the accident rate for the remaining Part135 operations has subsequently improved remarkably as can beseen when the years following 2002 are compared with the periodbetween 1997 and 2001.
Nowadays, Part 135 only applies to firms that provide serviceusing aircraft with fewer than 10 seats. These operations representless than two percent of scheduled commercial aircraft flight hours,and the operations are generally confined to the most remote andoperationally challenging parts of the country. The fatal accidentrate per departure for Part 135 scheduled operations is about fourtimes that of Part 121 scheduled operations. While this is a signifi-cant difference, the relative difference in risk has improvedconsiderably compared with the situation in the late 1970s.
2.5. Private aviation
Trends in the fatality risk for private flying (“general aviation”)are shown in Fig. 10. Two sets are data are shownwith their valuesin 1975 normalized to 100. The bold line indicates the rate offatalities per aircraft flight hour. There has been a steadyimprovement, albeit that one might argue that the rate has beenstatic for the past decade. The fatality rate in 2010 at 21 fatalities permillion flight hours is less than half of what it was in 1975when therate was 47 fatalities per million flight hours.
In contrast to recreational boating that has seen an increase inpopularity over time, the opposite is true for private flying. Aftera brief upsurge in the period between the two oil crises in the late1970s, per capita private flight hours declined by 55% between 1979and 2010. Consequently, when fatalities are shown as a rate percapita of the U.S. population (the dashed line in Fig. 10), the risk hasdeclined by 75% over time. Private flying is now inherently lessrisky, and in addition less people are flying. Part of the decline in
0
25
50
75
100
125
150
1975 1980 1985 1990 1995 2000 2005 2010
Fig. 10. Indices of general aviation fatalities per aircraft hour (solid line) and per capita(dashed line) 1975e2010 with 1975 ¼ 100.
Fig. 11. Indices of time trends in per capita fatality rates 1975e2010.
I. Savage / Research in Transportation Economics 43 (2013) 9e2220
popularity may be due to changes in tastes, and a continued shift ofthe population from rural to urban areas. However, the lower faresand greater range of services offered by commercial aviationfollowing deregulation may have also contributed to the decline.
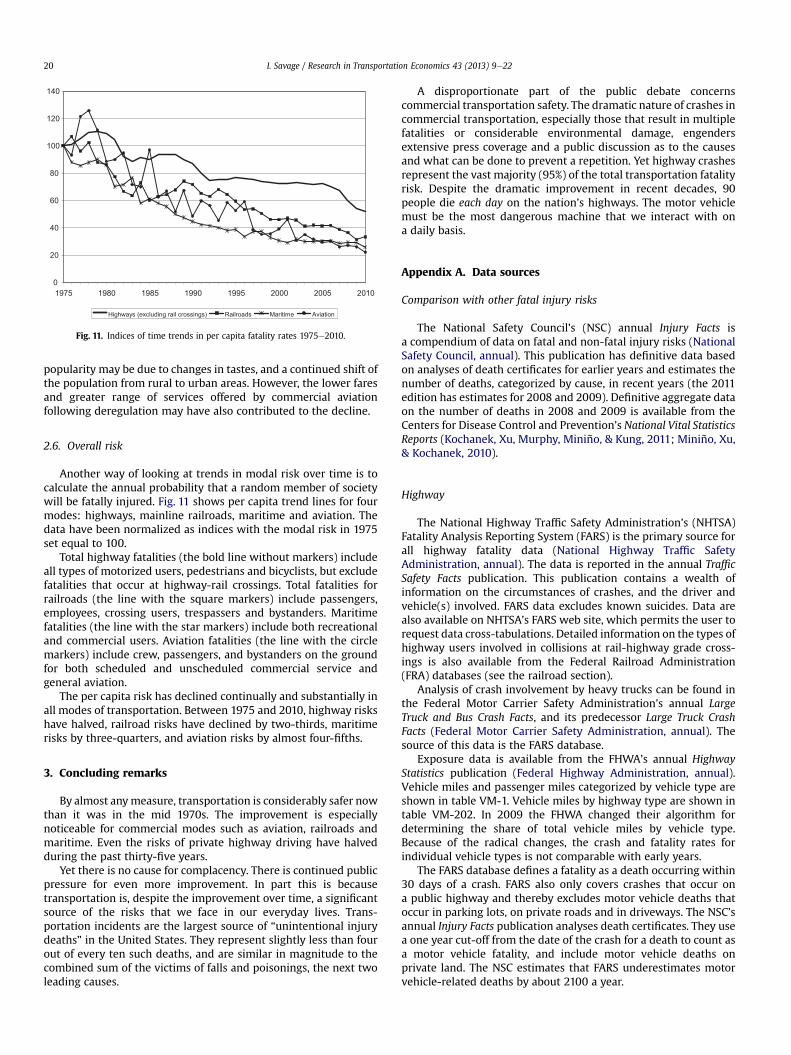
2.6. Overall risk
Another way of looking at trends in modal risk over time is tocalculate the annual probability that a random member of societywill be fatally injured. Fig. 11 shows per capita trend lines for fourmodes: highways, mainline railroads, maritime and aviation. Thedata have been normalized as indices with the modal risk in 1975set equal to 100.
Total highway fatalities (the bold line without markers) includeall types of motorized users, pedestrians and bicyclists, but excludefatalities that occur at highway-rail crossings. Total fatalities forrailroads (the line with the square markers) include passengers,employees, crossing users, trespassers and bystanders. Maritimefatalities (the line with the star markers) include both recreationaland commercial users. Aviation fatalities (the line with the circlemarkers) include crew, passengers, and bystanders on the groundfor both scheduled and unscheduled commercial service andgeneral aviation.
The per capita risk has declined continually and substantially inall modes of transportation. Between 1975 and 2010, highway riskshave halved, railroad risks have declined by two-thirds, maritimerisks by three-quarters, and aviation risks by almost four-fifths.
3. Concluding remarks
By almost anymeasure, transportation is considerably safer nowthan it was in the mid 1970s. The improvement is especiallynoticeable for commercial modes such as aviation, railroads andmaritime. Even the risks of private highway driving have halvedduring the past thirty-five years.
Yet there is no cause for complacency. There is continued publicpressure for even more improvement. In part this is becausetransportation is, despite the improvement over time, a significantsource of the risks that we face in our everyday lives. Trans-portation incidents are the largest source of “unintentional injurydeaths” in the United States. They represent slightly less than fourout of every ten such deaths, and are similar in magnitude to thecombined sum of the victims of falls and poisonings, the next twoleading causes.
A disproportionate part of the public debate concernscommercial transportation safety. The dramatic nature of crashes incommercial transportation, especially those that result in multiplefatalities or considerable environmental damage, engendersextensive press coverage and a public discussion as to the causesand what can be done to prevent a repetition. Yet highway crashesrepresent the vast majority (95%) of the total transportation fatalityrisk. Despite the dramatic improvement in recent decades, 90people die each day on the nation’s highways. The motor vehiclemust be the most dangerous machine that we interact with ona daily basis.
Appendix A. Data sources
Comparison with other fatal injury risks
The National Safety Council’s (NSC) annual Injury Facts isa compendium of data on fatal and non-fatal injury risks (NationalSafety Council, annual). This publication has definitive data basedon analyses of death certificates for earlier years and estimates thenumber of deaths, categorized by cause, in recent years (the 2011edition has estimates for 2008 and 2009). Definitive aggregate dataon the number of deaths in 2008 and 2009 is available from theCenters for Disease Control and Prevention’s National Vital StatisticsReports (Kochanek, Xu, Murphy, Miniño, & Kung, 2011; Miniño, Xu,& Kochanek, 2010).
Highway
The National Highway Traffic Safety Administration’s (NHTSA)Fatality Analysis Reporting System (FARS) is the primary source forall highway fatality data (National Highway Traffic SafetyAdministration, annual). The data is reported in the annual TrafficSafety Facts publication. This publication contains a wealth ofinformation on the circumstances of crashes, and the driver andvehicle(s) involved. FARS data excludes known suicides. Data arealso available on NHTSA’s FARS web site, which permits the user torequest data cross-tabulations. Detailed information on the types ofhighway users involved in collisions at rail-highway grade cross-ings is also available from the Federal Railroad Administration(FRA) databases (see the railroad section).
Analysis of crash involvement by heavy trucks can be found inthe Federal Motor Carrier Safety Administration’s annual LargeTruck and Bus Crash Facts, and its predecessor Large Truck CrashFacts (Federal Motor Carrier Safety Administration, annual). Thesource of this data is the FARS database.
Exposure data is available from the FHWA’s annual HighwayStatistics publication (Federal Highway Administration, annual).Vehicle miles and passenger miles categorized by vehicle type areshown in table VM-1. Vehicle miles by highway type are shown intable VM-202. In 2009 the FHWA changed their algorithm fordetermining the share of total vehicle miles by vehicle type.Because of the radical changes, the crash and fatality rates forindividual vehicle types is not comparable with early years.
The FARS database defines a fatality as a death occurring within30 days of a crash. FARS also only covers crashes that occur ona public highway and thereby excludes motor vehicle deaths thatoccur in parking lots, on private roads and in driveways. The NSC’sannual Injury Facts publication analyses death certificates. They usea one year cut-off from the date of the crash for a death to count asa motor vehicle fatality, and include motor vehicle deaths onprivate land. The NSC estimates that FARS underestimates motorvehicle-related deaths by about 2100 a year.
I. Savage / Research in Transportation Economics 43 (2013) 9e22 21
Mainline railroads
Both fatality and exposure data (employee hours, train miles,passenger miles) for mainline railroads are obtained from the FRA’sannual Railroad Safety Statistics publication (Federal RailroadAdministration, annual) and its predecessor publications Accident/Incident Bulletin and Highway-Rail Crossing Accident/IncidentBulletin and Inventory Bulletin. The data is also available on the FRA’sweb site.
Maritime
Data on recreational boating deaths is reported in the UnitedStates Coast Guard’s (USCG) annual Boating Statistics (U.S. CoastGuard, annual) This publication also shows the number of regis-tered private recreational vessels (this understates boat ownershipas most small craft such as kayaks, canoes and row boats do nothave to be registered).
Information on incidents on commercial vessels is reported tothe USCG and recorded in the Marine Safety Management Infor-mation System database (CASMAIN) in the period to 2001 andMarine Information for Safety and Law Enforcement System(MISLE) database from 2002. Aggregate fatalities are reported inthe Bureau of Transportation Statistics’ (BTS) annual NationalTransportation Statistics publication (Bureau of TransportationStatistics, annual). Data on individual incidents were downloadedfrom the CASMAIN and MISLE databases, available on the USCG’sweb page, to determine the relative number of employee andpassenger fatalities. The BTS annual National Transportation Statis-tics publication provides information on the number of largecommercial vessels registered in the United States. The U.S. ArmyCorp of Engineers’ annualWaterborne Commerce of the United States(United States Army Corp of Engineers, annual) provides informa-tion on the number of ton-miles of commercial cargo carried byUnited States and foreign-flagged vessels in United States territorialwaters (the whole of the Great Lakes are considered U.S. waters forthe purposes of this calculation).
Data on fatalities on ferryboats, and the number of passengermiles of travel, were obtained from the Federal Transit Adminis-tration’s (FTA) National Transit Database (NTD).
Aviation
The National Transportation Safety Board (NTSB) is the report-ing agency for all types of aviation incidents. They publish statisticalsummaries in an annual press release, and in two annual publica-tions Annual Review of Aircraft Accident Data, U.S. Air Carrier Oper-ations (National Transportation Safety Board, annual-a) and AnnualReview of Aircraft Accident Data, U.S. General Aviation (NationalTransportation Safety Board, annual-b). The NTSB publicationsalso contain information on exposure to crashes (aircraft depar-tures, passenger enplanements, aircraft hours, passenger miles)based on data reported to the Federal Aviation Administration andthe BTS. Since 1997 commercial aircraft withmore than 10 seats areregulated and identified as “Part 121” operations, and those withless than ten seats as “Part 135.” Prior to 1997 the boundarybetween these two types of operations was 30 seats.
Rail transit
Local transit is primarily regulated at the state level. The data forour analysis is drawn from information reported by transit agenciesto the FTA’s NTD, and from information reported to the FTA fromstate safety oversight agencies. Data were obtained from the FTANational Transit Database e Safety and Security Report for 2002 and
2009 (Federal Transit Administration, 2003, 2010), and theFTA’s2009 Rail Safety Statistics Report for 2003e2008 (FederalTransit Administration, 2009).
Pipelines
Pipeline fatalities are reported in the BTS annual NationalTransportation Statistics publication based on information collectedby the Pipeline and Hazardous Materials Safety Administration(Bureau of Transportation Statistics, annual).
Workplace fatalities and injuries
Workplace fatalities are reported to the Bureau of Labor Statis-tics (BLS) as part of the Census of Fatal Occupational Injuries(Bureau of Labor Statistics, annual). The data are available on theBLS web site.
Population
Population data is the mid-year (July 1) estimate of the UnitedStates Resident population made by the Census Bureau, and isavailable on their web site.
Appendix B. Supplementary data
Supplementary data related to this article can be found at http://dx.doi.org/10.1016/j.retrec.2012.12.011.
References
Blattenberger, G., Fowles, R., & Loeb, P. D. (2013). Determinants of motor vehiclecrash fatalities using Bayesian model selection methods. Research in Trans-portation Economics, 43(1), 112e122.
Bureau of Labor Statistics, (annual). Census of fatal occupational injuries. Wash-ington, DC: U.S. Department of Labor.
Bureau of Transportation Statistics, (annual). National transportation statistics.Washington, DC: U.S. Department of Labor.
Elvik, R., Høye, A., Vaa, T., & Sørenson, M. (2009). The handbook of road safetymeasures (2nd ed.). Bingley, UK: Emerald Group Publishing Limited.
Eno Transportation Foundation. (2007). Transportation in America (12th ed.).Washington, DC: Eno Transportation Foundation.
Evans, L. (2004). Traffic safety. Bloomington Hills, MI: Science Serving Society.Federal Aviation Administration. (2009). General aviation and air taxi activity survey.
Washington, DC: U.S. Department of Transportation.Federal Highway Administration, (annual). Highway statistics. Washington, DC: U.S.
Department of Transportation.Federal Motor Carrier Safety Administration, (annual). Large truck and bus crash
facts. Washington, DC: U.S. Department of Transportation.Federal Railroad Administration, (annual). Railroad safety statistics. Washington, DC:
U.S. Department of Transportation.Federal Transit Administration. (2003). National transit database e safety and
security report for 2002. Washington, DC: U.S. Department of Transportation.Federal Transit Administration. (2009). 2009 Rail safety statistics report for 2003e
2008. Washington, DC: U.S. Department of Transportation.Federal Transit Administration. (2010). National transit database e safety and secu-
rity report for 2009. Washington, DC: U.S. Department of Transportation.Fuller, J. K., & Savage, I. (2012). Analysis of non-motorized rail fatalities in metropolitan
Chicago 2004e11. Working paper. Evanston, IL: Northwestern University.George, B. F. (2008). Rail trespasser fatalities: Developing demographic profiles. Report
to the Federal Railroad Administration. Edgewater, MD: Cadle Creek Consulting.Haddon, W., Jr. (1972). A logical framework for categorizing highway safety
phenomena and activity. Journal of Trauma, 12(1), 193e207.International Transport Forum. (2011). Road safety annual report 2011. Paris: Inter-
national Transport Forum.Kochanek, K. D., Xu, J., Murphy, S. L., Miniño, A. M., & Kung, H.-C. (2011). National
Vital Statistics Reports. Deaths: Preliminary data for 2009, Vol. 59(4). NationalVital Statistics System, Centers for Disease Control and Prevention, U.S.Department of Health and Human Services.
Miniño, A. M., Xu, J., & Kochanek, K. D. (2010). National Vital Statistics Reports.Deaths: Preliminary data for 2008, Vol. 59(2). National Vital Statistics System,Centers for Disease Control and Prevention, U.S. Department of Health andHuman Services.
Mok, S., & Savage, I. (2005). Why has safety improved at rail-highway gradecrossings? Risk Analysis, 25(4), 867e881.
I. Savage / Research in Transportation Economics 43 (2013) 9e2222
National Highway Traffic Safety Administration, (annual). Traffic safety facts.Washington, DC: U.S. Department of Transportation.
National Highway Traffic Safety Administration. (2010). Seat belt use in 2009dUserates in the States and Territories. Report DOT-HS-811e324. Washington, DC: U.S.Department of Transportation.
National Safety Council, (annual). Injury facts. Itasca, IL: National Safety Council.National TransportationSafetyBoard, (annual-a).Annual reviewofaircraft accidentdata.
U.S. Air Carrier Operations.Washington, DC: National Transportation Safety Board.National Transportation Safety Board, (annual-b). Annual review of aircraft accident
data.Washington,DC:U.S.GeneralAviation.NationalTransportationSafetyBoard.Oster, C. V., Jr., & Strong, J. S. (2013). Analyzing road safety in the United States.
Research in Transportation Economics, 43(1), 98e111.
Oster, C. V., Jr., Strong, J. S., & Zorn, C. K. (1992). Why airplanes crash: Aviation safetyin a changing world. New York: OxfordUniversity Press.
Oster, C. V., Jr., Strong, J. S., & Zorn, C. K. (2013). Analyzing aviation safety: problems,challenges, opportunities. Research in Transportation Economics, 43(1), 148e164.
Savage, I. (2006). Does public education improve rail-highway crossing safety?Accident Analysis and Prevention, 38(2), 310e316.
Savage, I. (2007). Trespassing on the railroad. Research in Transportation Economics,20(1), 199e224.
United States Army Corp of Engineers, (annual). Waterborne commerce of the UnitedStates. Alexandria, VA: U.S. Army Corp of Engineers.
United States Coast Guard, (annual). Boating statistics. Washington, DC: U.S.Department of Homeland Security.