Comparing Three or More Groups: Multiple Comparisons vs Planned Comparisons Robert Boudreau, PhD Co-Director of Methodology Core PITT-Multidisciplinary Clinical Research Center for Rheumatic and Musculoskeletal Diseases. First a simple thought experiment. - PowerPoint PPT Presentation
34
Comparing Three or More Comparing Three or More Groups: Groups: Multiple Comparisons Multiple Comparisons vs vs Planned Comparisons Planned Comparisons Robert Boudreau, PhD Robert Boudreau, PhD Co-Director of Methodology Core Co-Director of Methodology Core PITT-Multidisciplinary Clinical Research Center PITT-Multidisciplinary Clinical Research Center for Rheumatic and Musculoskeletal Diseases for Rheumatic and Musculoskeletal Diseases
Transcript
Comparing Three or More Groups:Comparing Three or More Groups:
Multiple Comparisons Multiple Comparisons vs vs
Planned ComparisonsPlanned Comparisons
Robert Boudreau, PhDRobert Boudreau, PhDCo-Director of Methodology CoreCo-Director of Methodology Core
PITT-Multidisciplinary Clinical Research Center PITT-Multidisciplinary Clinical Research Center for Rheumatic and Musculoskeletal Diseasesfor Rheumatic and Musculoskeletal Diseases
First a simple thought First a simple thought experimentexperiment
Flip a fair coin 100 times: Let H=# Flip a fair coin 100 times: Let H=# headsheads
H = 0,1,2, …, 100 are the possible H = 0,1,2, …, 100 are the possible outcomesoutcomes
H has a binomial distribution with H has a binomial distribution with known probs known probs
Prob[ 40 < H < 60 ] very close to 0.95Prob[ 40 < H < 60 ] very close to 0.95
Prob [ H ≤ 40 ] + P[ H ≥ 60] = 0.05 Prob [ H ≤ 40 ] + P[ H ≥ 60] = 0.05
First a simple thought First a simple thought experimentexperiment
Flip a fair coin 100 times: Let H=# headsFlip a fair coin 100 times: Let H=# heads H = 0,1,2, …, 100 are the possible outcomesH = 0,1,2, …, 100 are the possible outcomes H has a binomial distribution with known H has a binomial distribution with known
probs probs Prob[ 40 < H < 60 ] very close to 0.95Prob[ 40 < H < 60 ] very close to 0.95
Prob [ H ≤ 40 ] + P[ H ≥ 60] = 0.05 Prob [ H ≤ 40 ] + P[ H ≥ 60] = 0.05 --------------------------------------------------------------------------------------------------------------------------------------------------------------------------------------------------------------
ExperimentExperiment: 20 people flip their own coin 100 : 20 people flip their own coin 100 timestimes
Q: Q: Approx how many will get 40 or fewer headsApprox how many will get 40 or fewer heads
or 60+ heads? or 60+ heads?
First a simple thought First a simple thought experimentexperiment
Flip a fair coin 100 times: Let H=# headsFlip a fair coin 100 times: Let H=# heads H = 0,1,2, …, 100 are the possible outcomesH = 0,1,2, …, 100 are the possible outcomes H has a binomial distribution with known H has a binomial distribution with known
probs probs Prob[ 40 < H < 60 ] very close to 0.95Prob[ 40 < H < 60 ] very close to 0.95
Prob [ H ≤ 40 ] + P[ H ≥ 60] = 0.05 Prob [ H ≤ 40 ] + P[ H ≥ 60] = 0.05 --------------------------------------------------------------------------------------------------------------------------------------------------------------------------------------------------------------
ExperimentExperiment: 20 people flip their own coin 100 : 20 people flip their own coin 100 timestimes
Q: Q: Approx how many will get less than 40 headsApprox how many will get less than 40 heads
or 60+ heads? or 60+ heads? Answer: OneAnswer: One
First a simple thought First a simple thought experimentexperiment
Flip a fair coin 100 times: Let H=# headsFlip a fair coin 100 times: Let H=# heads H = 0,1,2, …, 100 are the possible outcomesH = 0,1,2, …, 100 are the possible outcomes H has a binomial distribution with known probs H has a binomial distribution with known probs Prob[ 40 < H < 60 ] very close to 0.95Prob[ 40 < H < 60 ] very close to 0.95
Prob [ H ≤ 40 ] + P[ H ≥ 60] = 0.05 Prob [ H ≤ 40 ] + P[ H ≥ 60] = 0.05 --------------------------------------------------------------------------------------------------------------------------------------------------------------------------------------------------------------
ExperimentExperiment: 20 people flip their own coin 100 : 20 people flip their own coin 100 timestimes
Q: Q: Approx how many will get less than 40 headsApprox how many will get less than 40 heads
or 60+ heads? or 60+ heads? Answer: One (1/20 = 5%)Answer: One (1/20 = 5%)
First a simple thought First a simple thought experimentexperiment
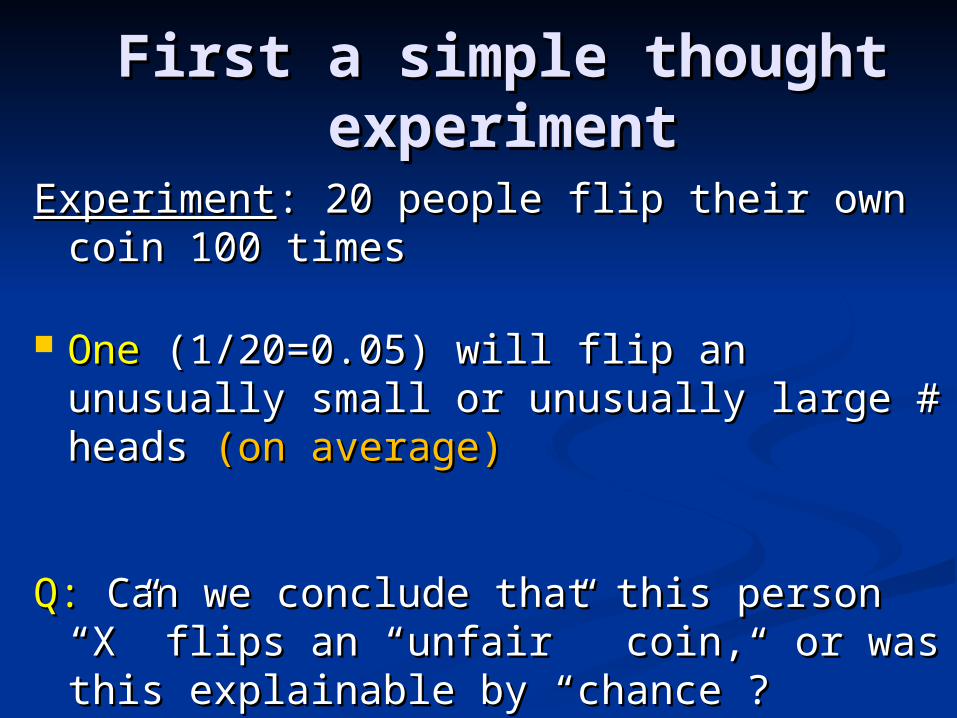
ExperimentExperiment: 20 people flip their own coin : 20 people flip their own coin 100 times100 times
OneOne (1/20=0.05) will flip an unusually (1/20=0.05) will flip an unusually small or unusually large # heads small or unusually large # heads (on (on average)average)
Q: Q: Can we conclude that this person “X” Can we conclude that this person “X” flips an “unfair” coin, or was this flips an “unfair” coin, or was this explainable by “chance”?explainable by “chance”?
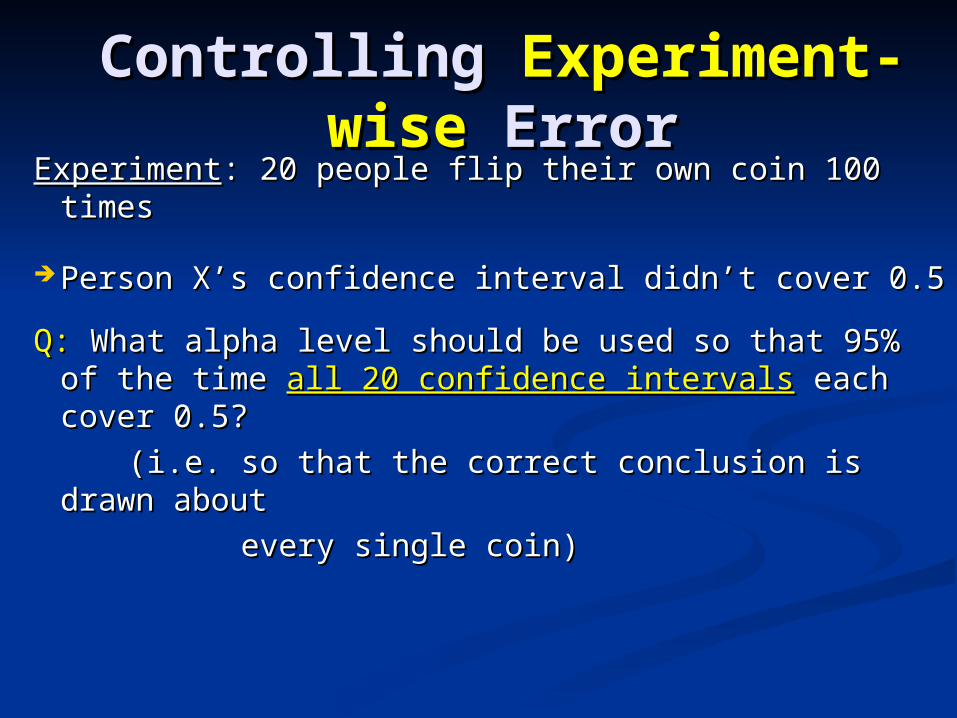
Q: Q: What alpha level should be used so that 95% of What alpha level should be used so that 95% of the time the time all 20 confidence intervalsall 20 confidence intervals each cover each cover 0.5?0.5?
(i.e. so that the correct conclusion is drawn (i.e. so that the correct conclusion is drawn about about
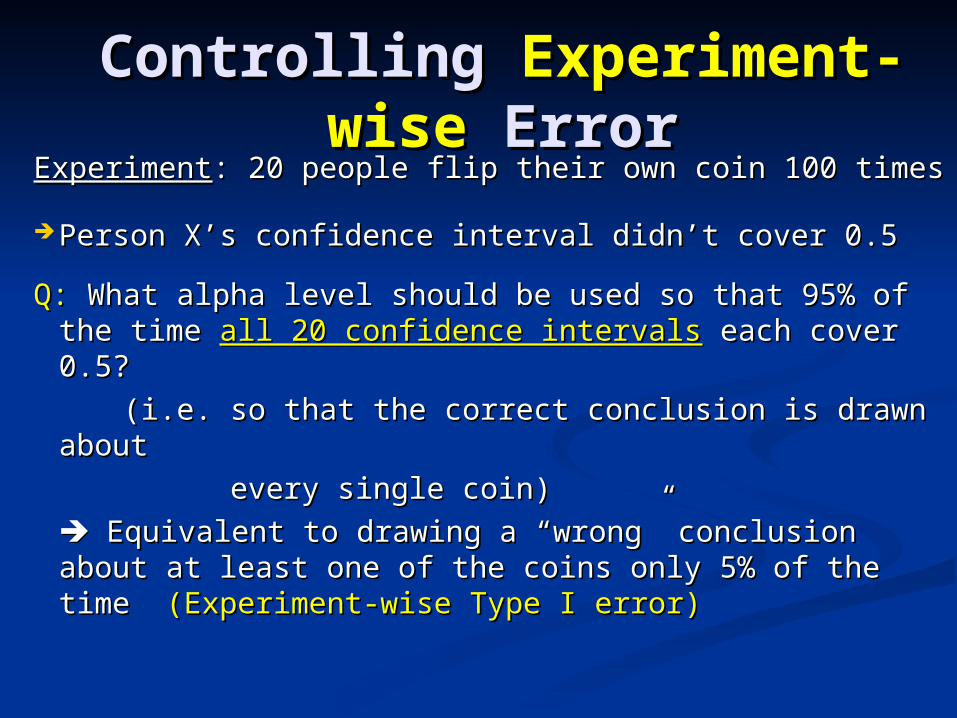
Q: Q: What alpha level should be used so that 95% of the What alpha level should be used so that 95% of the time time all 20 confidence intervalsall 20 confidence intervals each cover 0.5?each cover 0.5?
(i.e. so that the correct conclusion is drawn about (i.e. so that the correct conclusion is drawn about
every single coin)every single coin)
Equivalent to drawing a “wrong” conclusion Equivalent to drawing a “wrong” conclusion about at least one of the coins only 5% of the time about at least one of the coins only 5% of the time (Experiment-wise Type I error)(Experiment-wise Type I error)
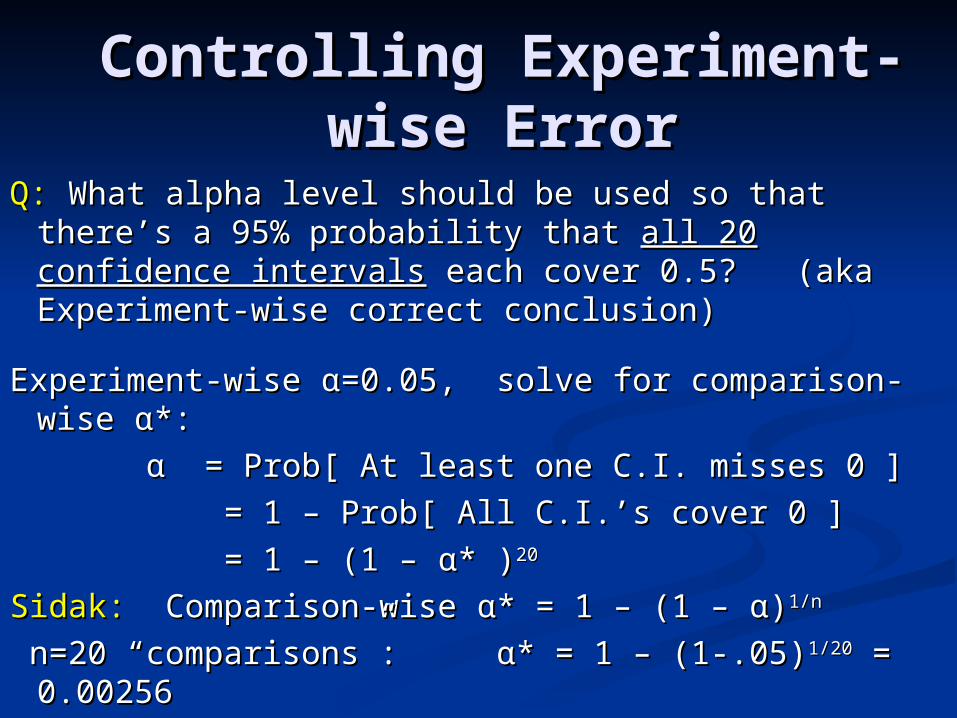
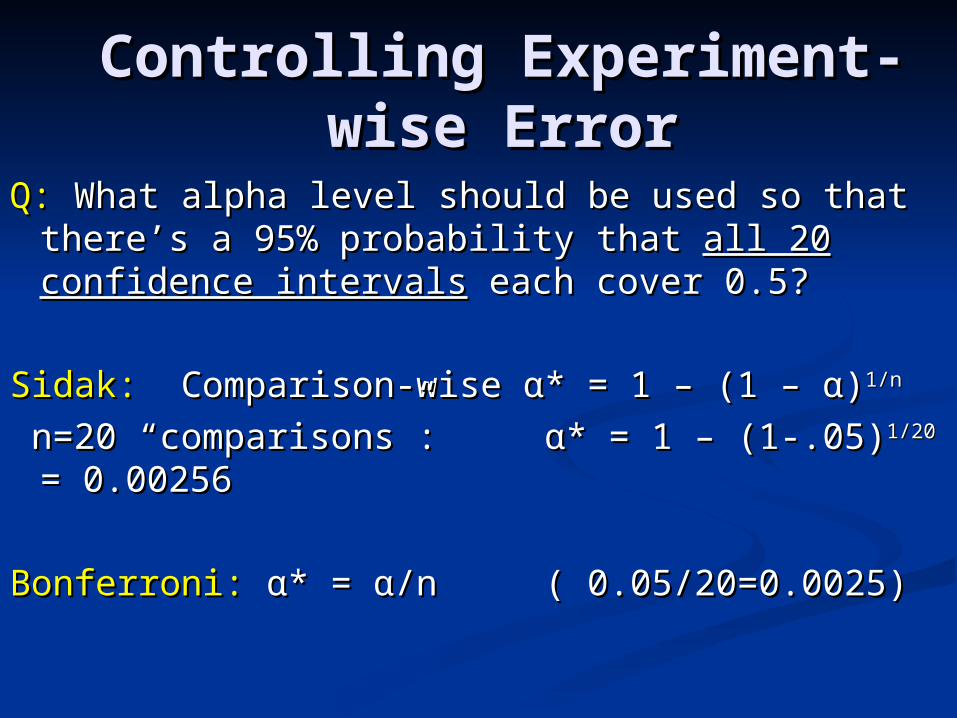
Q: Q: What alpha level should be used so that there’s a What alpha level should be used so that there’s a 95% probability that 95% probability that all 20 confidence intervalsall 20 confidence intervals each cover 0.5? (aka Experiment-wise correct each cover 0.5? (aka Experiment-wise correct conclusion)conclusion)
Experiment-wise Experiment-wise αα=0.05, solve for comparison-wise =0.05, solve for comparison-wise αα*: *:
αα = Prob[ At least one C.I. misses 0 ] = Prob[ At least one C.I. misses 0 ]
= 1 – Prob[ All C.I.’s cover 0 ]= 1 – Prob[ All C.I.’s cover 0 ]
Q:Q: What alpha level should be used so that What alpha level should be used so that there’s a 95% probability that there’s a 95% probability that all 20 confidence all 20 confidence intervalsintervals each cover 0.5? each cover 0.5?
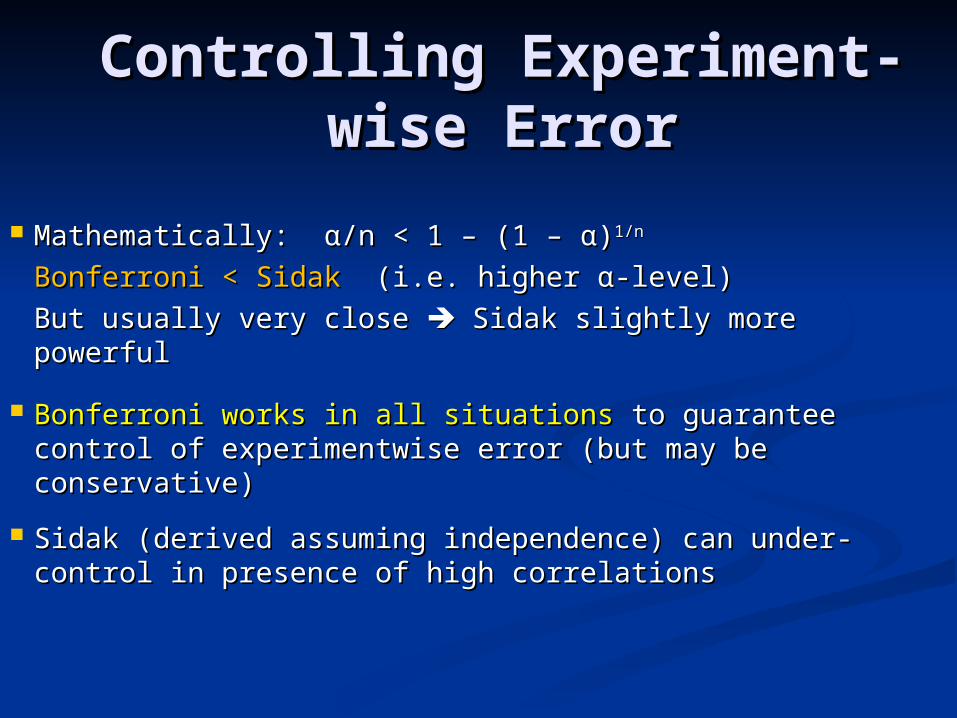
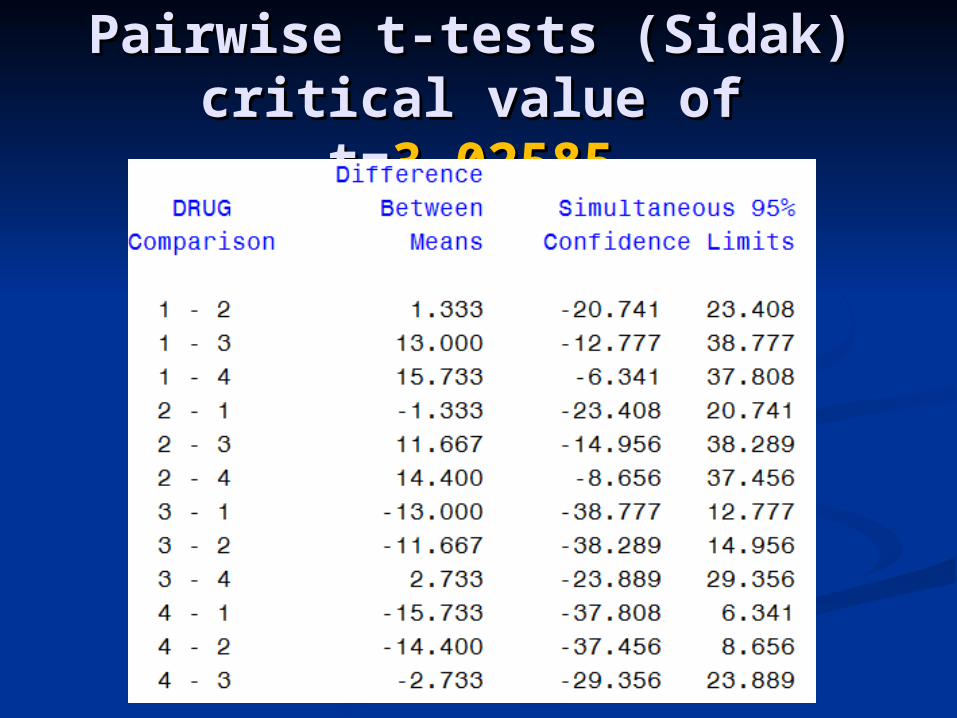
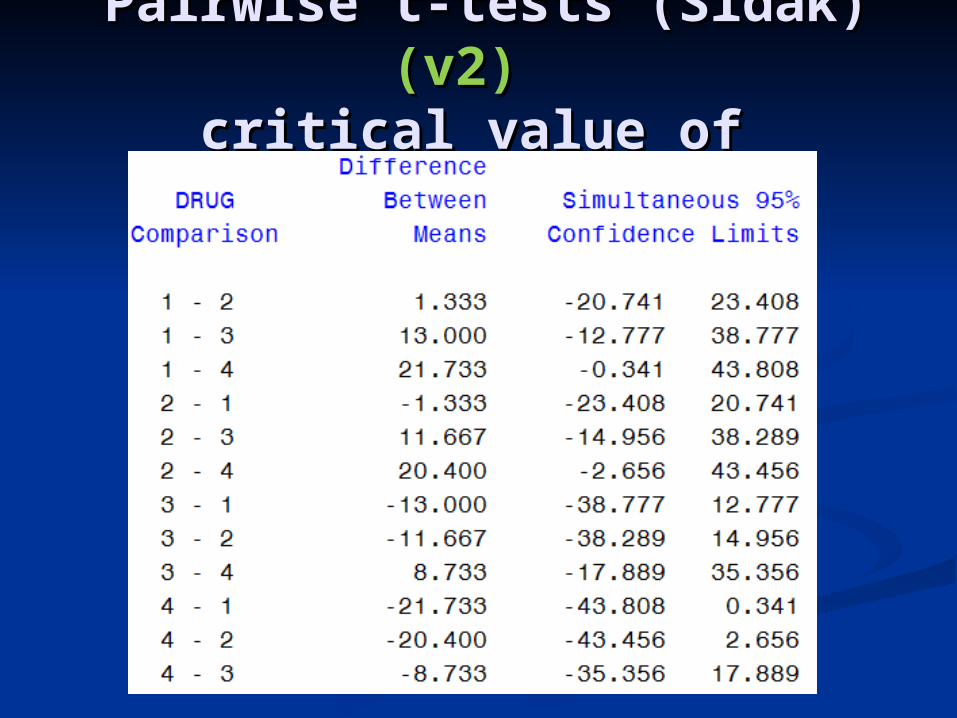
But usually very close But usually very close Sidak slightly more powerful Sidak slightly more powerful
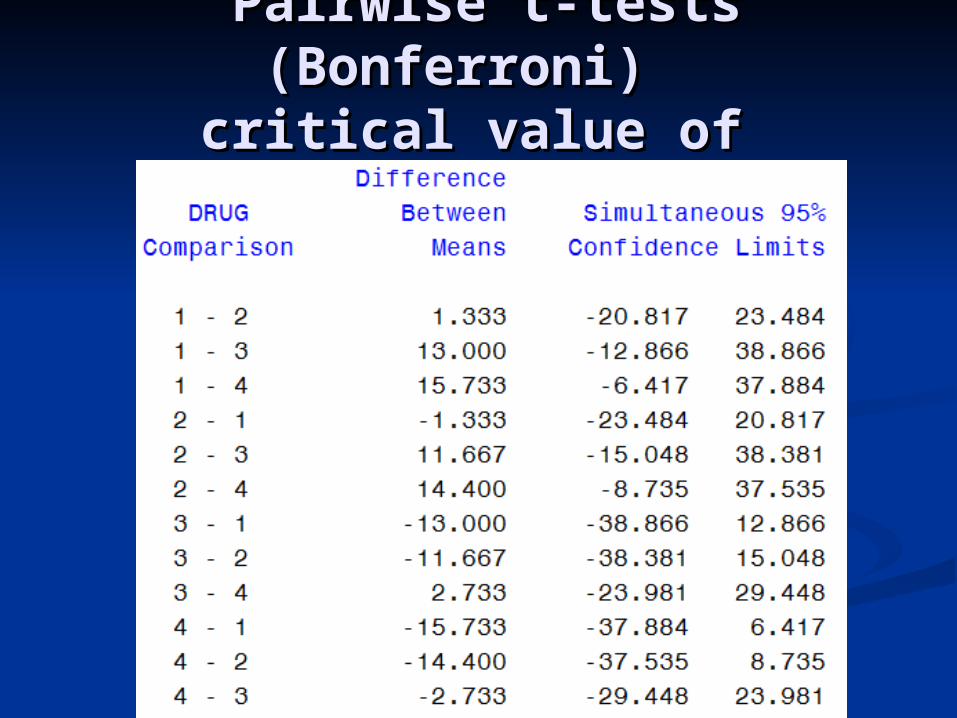
Bonferroni works in all situations Bonferroni works in all situations to guarantee control to guarantee control of experimentwise error (but may be conservative)of experimentwise error (but may be conservative)
Sidak (derived assuming independence) can under-Sidak (derived assuming independence) can under-control in presence of high correlations control in presence of high correlations
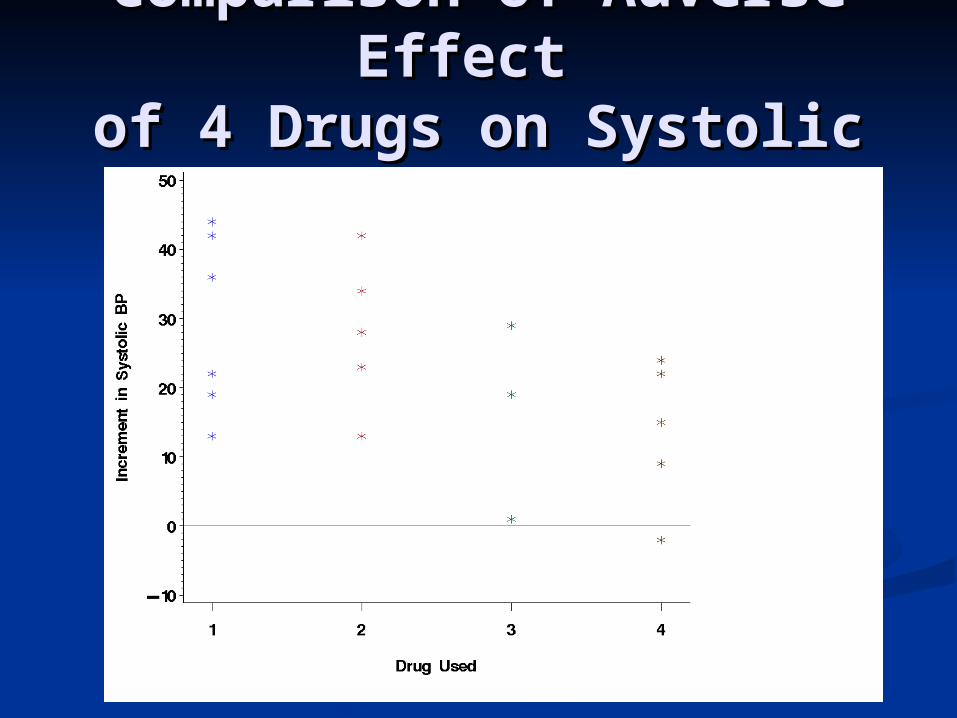
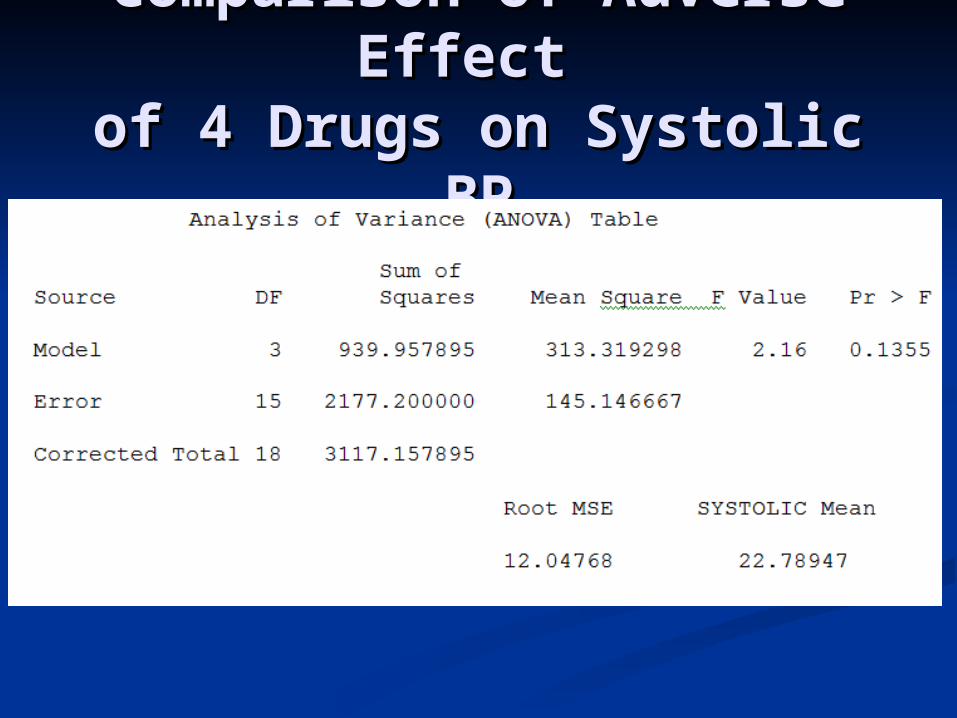
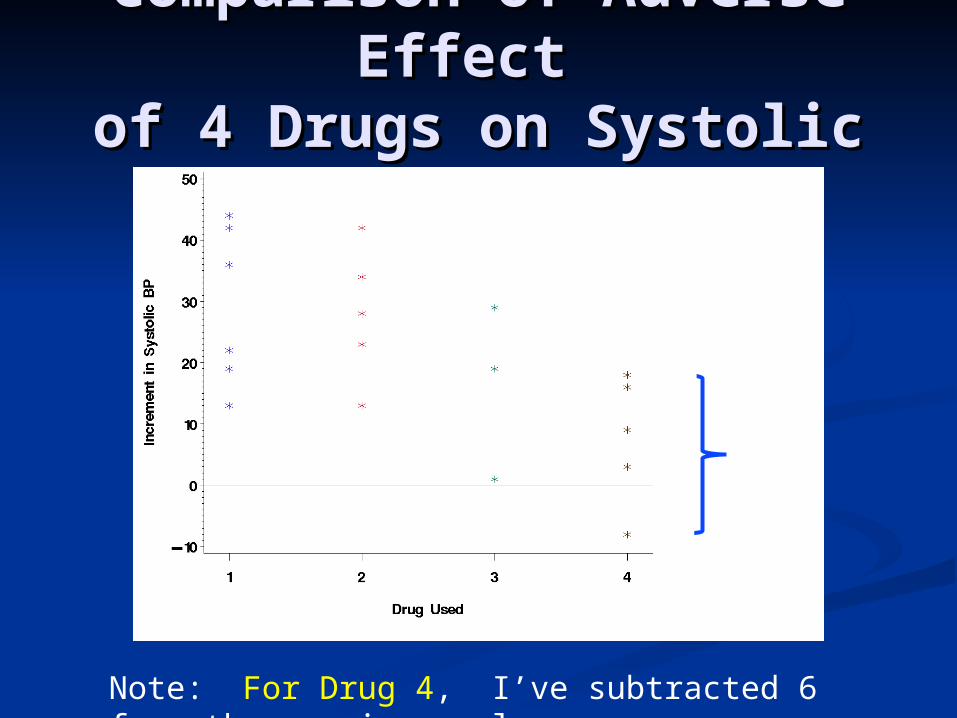
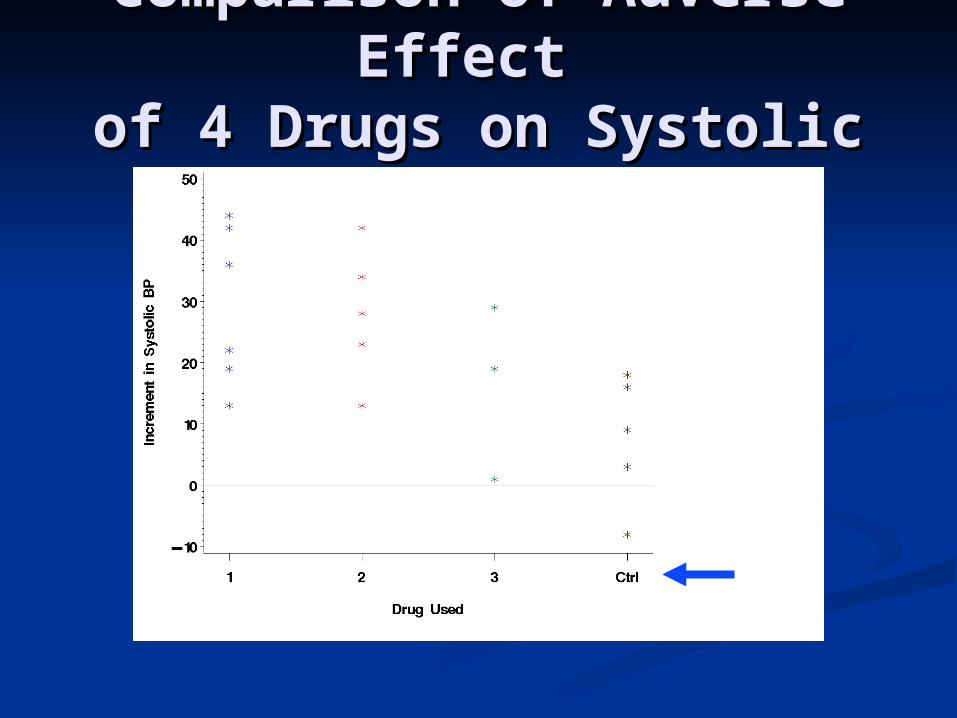
Comparison of Adverse Comparison of Adverse Effect Effect
of 4 Drugs on Systolic BPof 4 Drugs on Systolic BP
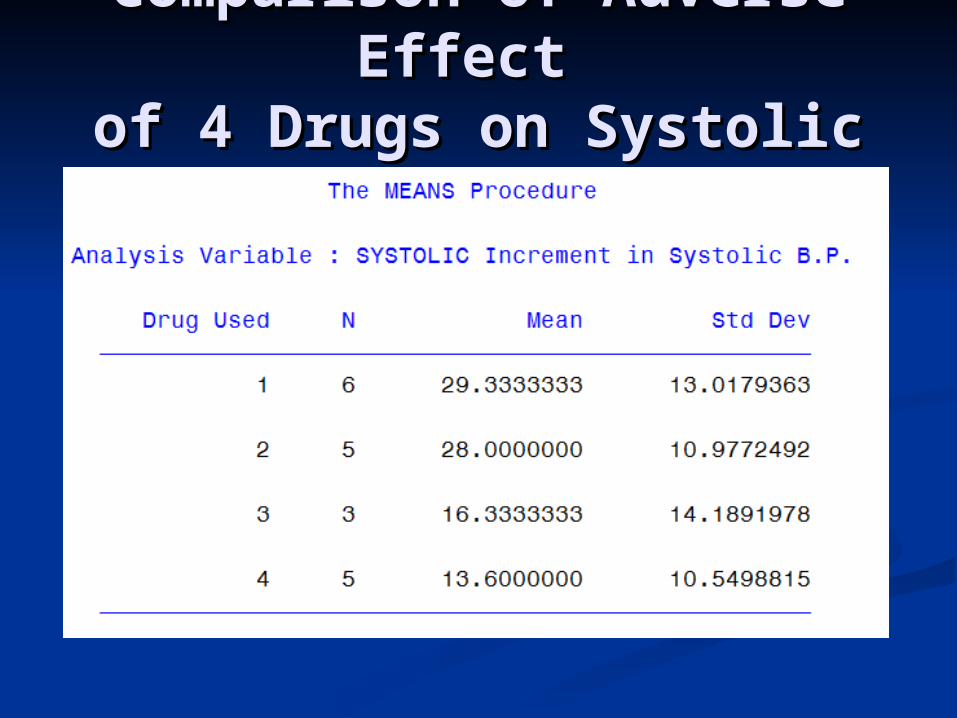
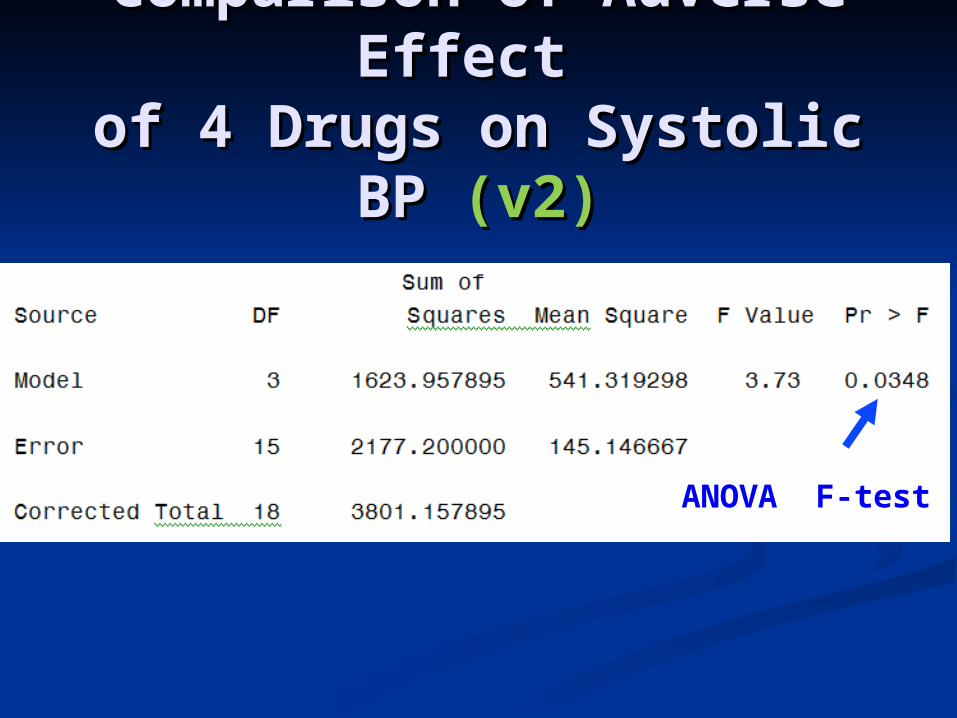
Comparison of Adverse Comparison of Adverse Effect Effect
of 4 Drugs on Systolic BPof 4 Drugs on Systolic BP
Comparison of Adverse Comparison of Adverse Effect Effect
of 4 Drugs on Systolic BPof 4 Drugs on Systolic BP
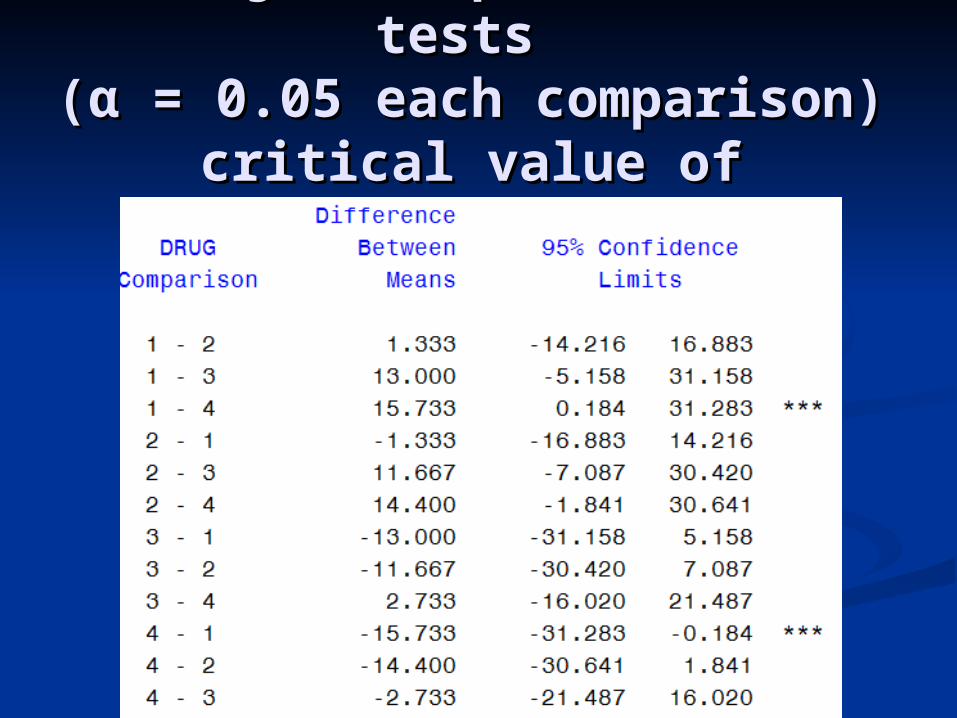
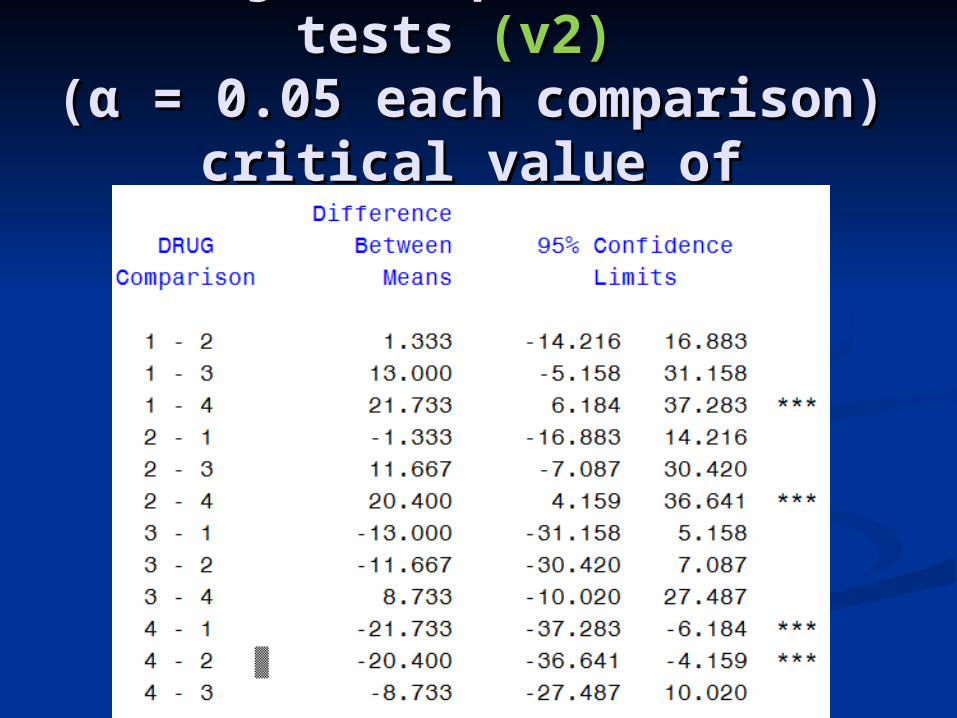
Unadjusted pairwise t-tests Unadjusted pairwise t-tests ((αα = 0.05 each comparison) = 0.05 each comparison)critical value of t=critical value of t=2.131452.13145
critical value of t=critical value of t=3.025853.02585
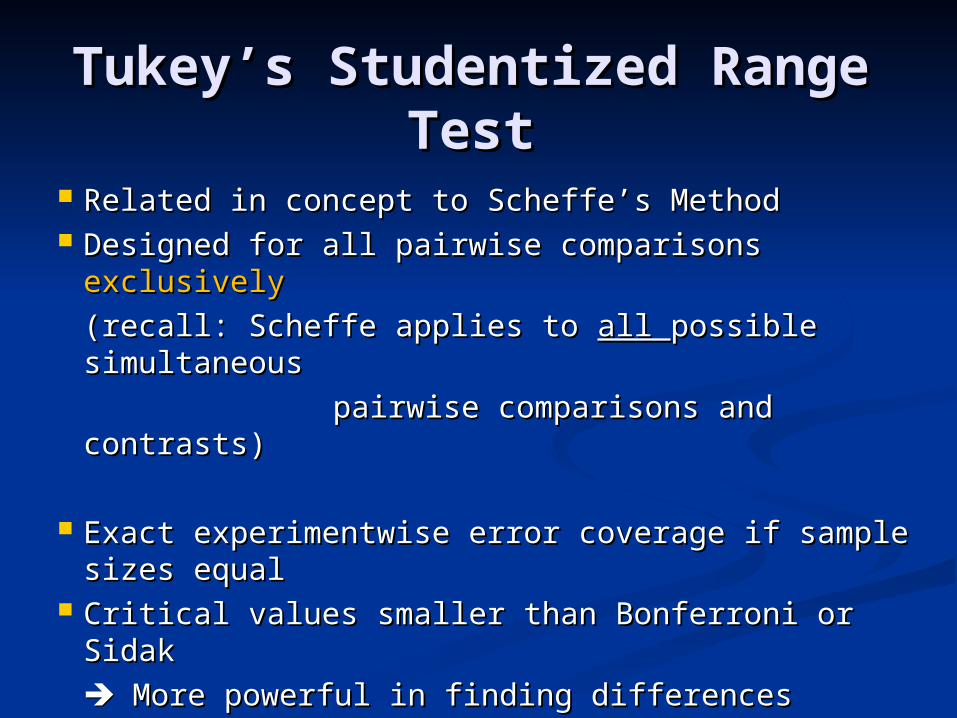
Tukey’s Studentized Range Tukey’s Studentized Range TestTest
Related in concept to Scheffe’s MethodRelated in concept to Scheffe’s Method Designed for all pairwise comparisons Designed for all pairwise comparisons
exclusivelyexclusively
(recall: Scheffe applies to (recall: Scheffe applies to all all possible possible simultaneous simultaneous
pairwise comparisons and contrasts)pairwise comparisons and contrasts)
Exact experimentwise error coverage if sample Exact experimentwise error coverage if sample sizes equalsizes equal
Critical values smaller than Bonferroni or SidakCritical values smaller than Bonferroni or Sidak
More powerful in finding differencesMore powerful in finding differences
critical value of t= critical value of t=2.882152.88215
Comparison of Adverse Comparison of Adverse Effect Effect
of 4 Drugs on Systolic BPof 4 Drugs on Systolic BP
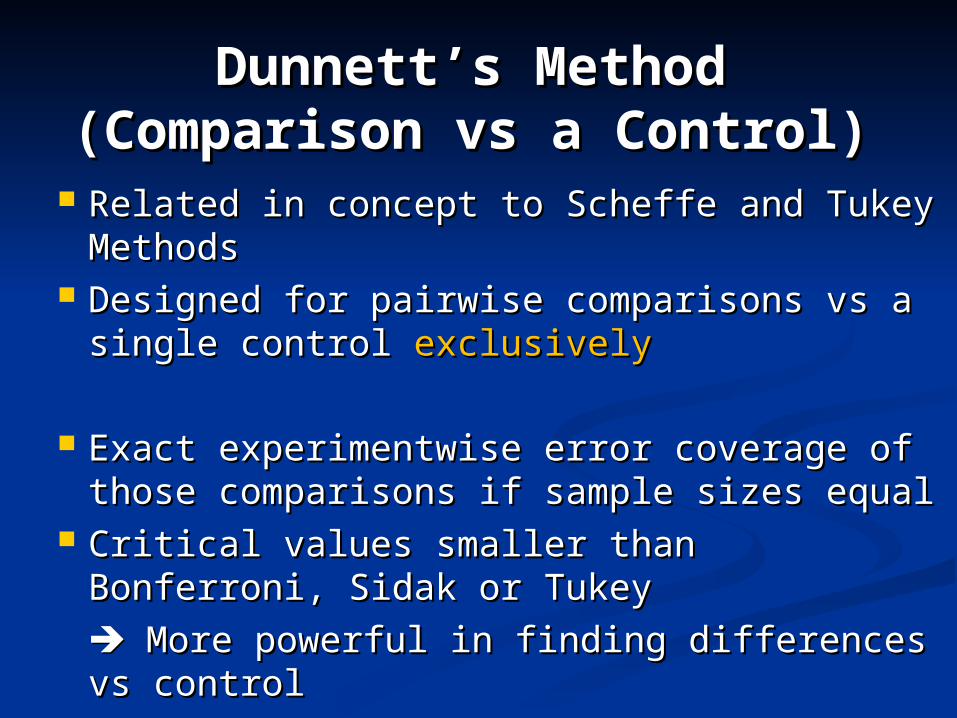
Dunnett’s MethodDunnett’s Method(Comparison vs a Control)(Comparison vs a Control)
Related in concept to Scheffe and Tukey Related in concept to Scheffe and Tukey MethodsMethods
Designed for pairwise comparisons vs a Designed for pairwise comparisons vs a single control single control exclusivelyexclusively
Exact experimentwise error coverage of Exact experimentwise error coverage of those comparisons if sample sizes equalthose comparisons if sample sizes equal
Critical values smaller than Bonferroni, Critical values smaller than Bonferroni, Sidak or TukeySidak or Tukey
More powerful in finding differences vs More powerful in finding differences vs controlcontrol
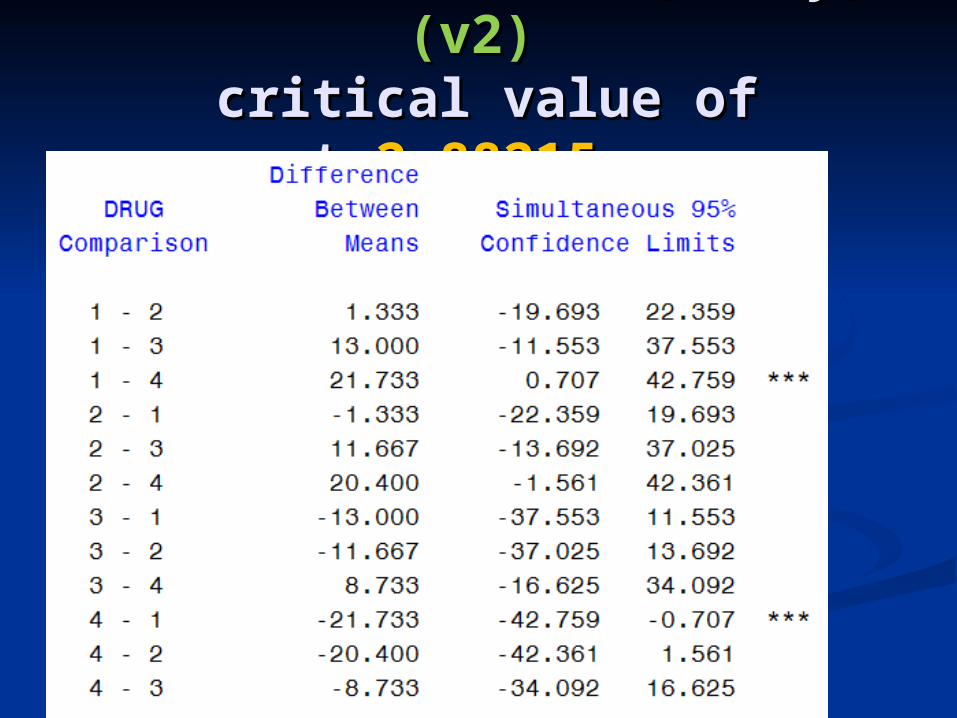
Comparison vs Control Comparison vs Control (Dunnett) (Dunnett) (v2)(v2)
critical value of t= critical value of t=2.617022.61702
Controlling for Multiple Controlling for Multiple Comparisons in Exploratory Comparisons in Exploratory
AnalysesAnalyses Caterina Rosano, Howard J. Caterina Rosano, Howard J.
Aizenstein, Stephanie Studenski, Anne Aizenstein, Stephanie Studenski, Anne B. Newman. B. Newman.
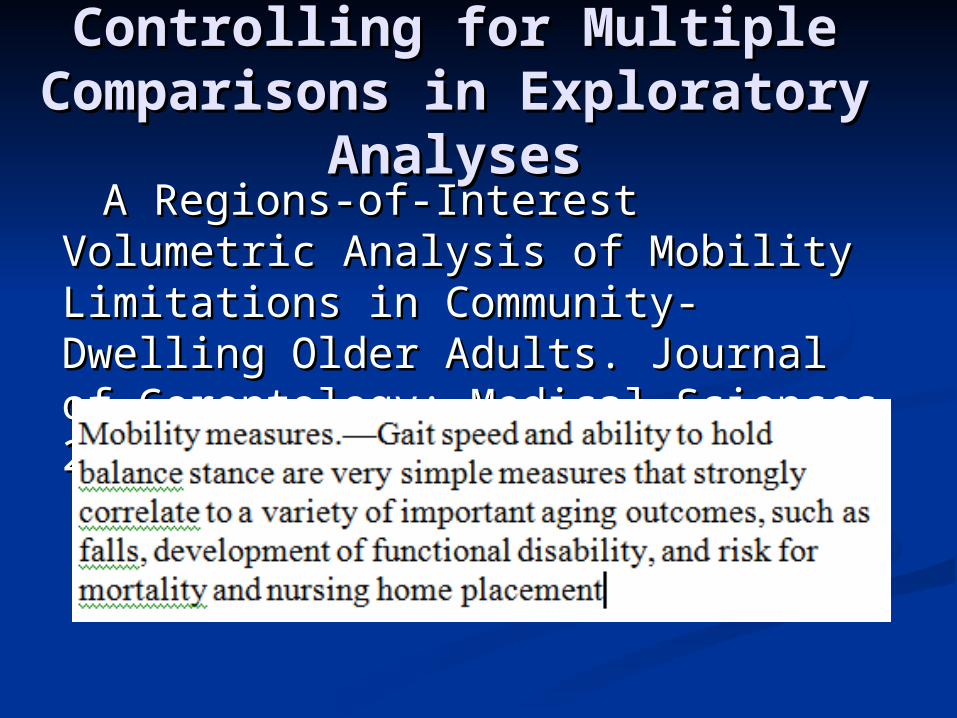
A Regions-of-Interest Volumetric A Regions-of-Interest Volumetric Analysis of Mobility Limitations in Analysis of Mobility Limitations in Community-Dwelling Older Adults. Community-Dwelling Older Adults. Journal of Gerontology: Medical Journal of Gerontology: Medical Sciences 2007Sciences 2007
Controlling for Multiple Controlling for Multiple Comparisons in Exploratory Comparisons in Exploratory
AnalysesAnalyses A Regions-of-Interest Volumetric A Regions-of-Interest Volumetric
Analysis of Mobility Limitations in Analysis of Mobility Limitations in Community-Dwelling Older Adults. Community-Dwelling Older Adults. Journal of Gerontology: Medical Journal of Gerontology: Medical Sciences 2007Sciences 2007
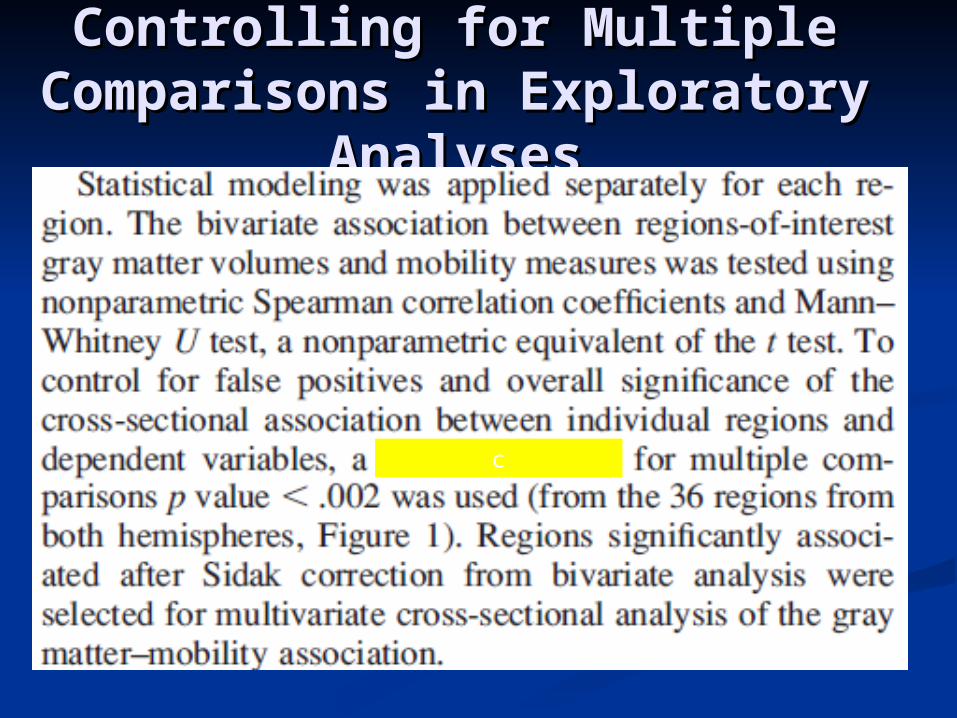
Controlling for Multiple Controlling for Multiple Comparisons in Exploratory Comparisons in Exploratory
AnalysesAnalyses
Controlling for Multiple Controlling for Multiple Comparisons in Exploratory Comparisons in Exploratory
AnalysesAnalyses
c
Thank you !Thank you !
Any Questions?Any Questions?
Robert Boudreau, PhDRobert Boudreau, PhDCo-Director of Methodology CoreCo-Director of Methodology Core
PITT-Multidisciplinary Clinical Research Center PITT-Multidisciplinary Clinical Research Center for Rheumatic and Musculoskeletal Diseasesfor Rheumatic and Musculoskeletal Diseases


![[2003] 3 R.C.S. DOUCET-BOUDREAU c. NOUVELLE-ÉCOSSE 3[2003] 3 R.C.S. DOUCET-BOUDREAU c. NOUVELLE-ÉCOSSE 3 Glenda Doucet-Boudreau, Alice Boudreau, Jocelyn Bourbeau, Bernadette Cormier-Marchand,](https://static.documents.pub/doc/80x56/5e55f1919ac6771b5d14d0f6/2003-3-rcs-doucet-boudreau-c-nouvelle-cosse-3-2003-3-rcs-doucet-boudreau.jpg)


