21
PhD graduates career paths access to funding 1

PhD graduates career paths
access to funding
1

Different patters of financing the PhD project: In Norway, 53% women and 45% men took advantage of financial support of the research Council, in Poland – one half less (23% women and the same number of men). Financing by industry or enterprises was more popular in Norway, although it was still a marginal phenomenon.
The course of the doctoral studies: Norwegian female and male doctoral students almost equally often (54% and 62%, respectively) stayed abroad in association with their research. In Poland, the respective numbers were two times lower.
The traditional image of professional career at the beginning of doctorate was definitely dominant among the Polish graduates. In Norway, the group of those wanting to work in non-academic research institution was much bigger.
2

The comparison of the plans preceding commencement of work on their doctoral dissertation and the situation of Ph.D. graduates five years after they earned their degree shows that their plans were realistic. In Poland, as well as Norway, similar numbers of people got employed by institutions, in which they wanted to work when starting their studies.
The employment statuses of those working in both countries are significantly different. In Poland, only one half have permanent job positions – almost as many are occupying temporary positions. In Norway, 71% women and a much greater number of men (86%) have permanent positions, while a much lesser number is hired on temporary ones.
While in Poland the percentages of women and men were similar, when it comes to their status at work, in Norway, men occupied permanent positions much more often than women.
3

The comparison of Polish and Norwegian results shows that the concept of earning Ph.D. as opening to get a satisfactory job is closer to the function of PhD studies in Norway, and has been popularized in the recent years.
In Norway PhD studies treated as the way of securing highly qualified human resources for economy, and not only the way of increasing of the number of people engaged in scientific work.
The traditional image of academic career was definitely dominant among the Polish graduates. About 70% of both women and men wanted to stay at the university – in Norway, this group was also the most numerous, but it was much smaller (47% women, 40% men).
In Norway, the group of those wanting to work in non-academic research institution was much bigger than in Poland. In both countries, men expressed this intent more often than women.
4

The comparison of the plans preceding commencement of work on their doctoral dissertation and the situation of PhD graduates five years after they earned their degree shows that their plans were realistic.
In Poland, as well as Norway, similar numbers of people got employed by institutions, in which they wanted to work when starting their studies.
In Poland, 71% of women and 72% of men indicated working for universities, 29% of women and 28% of men – for other types of institutions.
In Norway this distribution is different: 46% of women and 38% of men found jobs at the university/institution, where they earned their PhD, while more than half (50% of women and 55% of men) worked in other institutions.
5

Signif. codes: 0 ‘***’ 0.001 ‘**’ 0.01 ‘*’ 0.05 ‘.’ 0.1 ‘ ’ 1
Poland; R2: 0.085 ;df: 10 ;f: 5.774
Est. Sig. (Intercept) 52.734 *** Men -4.149 Social Sciences 19.538 * Natural Sciences 2.671 Engineering and technology -3.696 Medical sciences -13.806 . Men:Social Sciences -1.060 Men:Natural Sciences 14.702 Men:Engineering and technology 31.316 * Men:Medical sciences 5.846
6
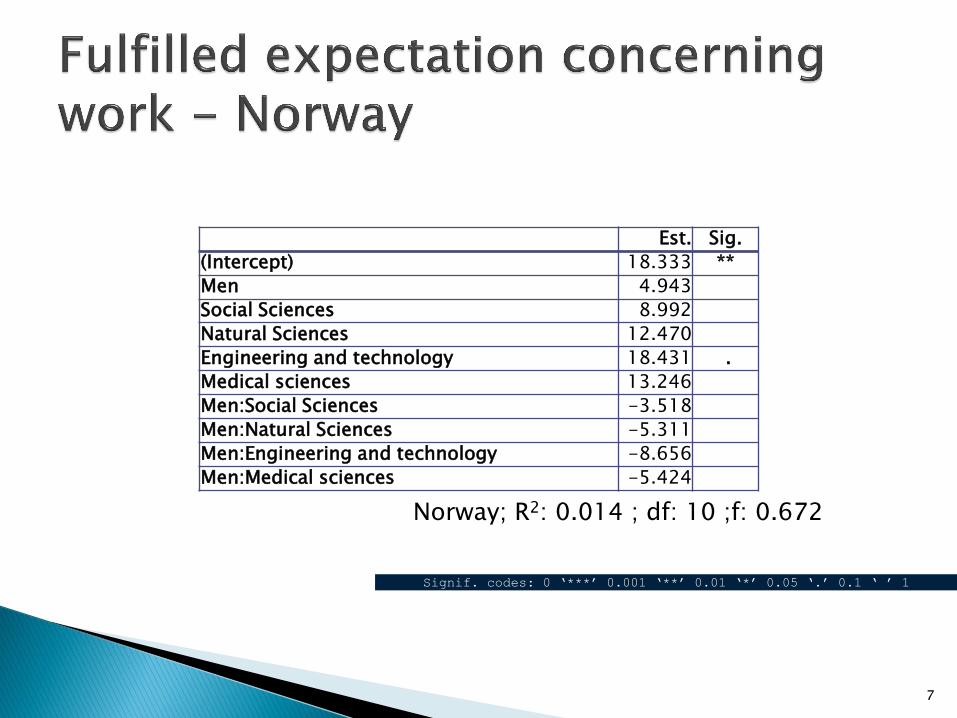
Norway; R2: 0.014 ; df: 10 ;f: 0.672
Est. Sig. (Intercept) 18.333 ** Men 4.943 Social Sciences 8.992 Natural Sciences 12.470 Engineering and technology 18.431 . Medical sciences 13.246 Men:Social Sciences -3.518 Men:Natural Sciences -5.311 Men:Engineering and technology -8.656 Men:Medical sciences -5.424
Signif. codes: 0 ‘***’ 0.001 ‘**’ 0.01 ‘*’ 0.05 ‘.’ 0.1 ‘ ’ 1
7

Poland; R2: 0.045 ; df: 10 ;f: 3.439
Est. Sig. (Intercept) 77.564 *** Men -8.302 * Social Sciences -8.516 * Natural Sciences -12.132 ** Engineering and technology -9.016 . Medical sciences -18.223 *** Men:Social Sciences 10.145 . Men:Natural Sciences 13.182 * Men:Engineering and technology 4.515 Men:Medical sciences 10.271 .
Signif. codes: 0 ‘***’ 0.001 ‘**’ 0.01 ‘*’ 0.05 ‘.’ 0.1 ‘ ’ 1
8

Norway; R2: 0.021 ; df: 10 ;f: 1.045
Est. Sig. (Intercept) 74.265 *** Men 5.046 Social Sciences 0.735 Natural Sciences -4.528 Engineering and technology 3.676 Medical sciences -3.212 Men:Social Sciences -3.826 Men:Natural Sciences -0.572 Men:Engineering and technology -8.397 Men:Medical sciences -4.670
Signif. codes: 0 ‘***’ 0.001 ‘**’ 0.01 ‘*’ 0.05 ‘.’ 0.1 ‘ ’ 1
9

58.8
75.3
0
20
40
60
80
Were your expectations to the doctoral period fulfilled
In retrospect, were your expectations to the doctoral period fulfilied?
Pe
rce
nt o
f ve
ry la
rge
an
d la
rge
de
gre
e a
nsw
ers
Country
Norway
Poland
In retrospect, were your expectations to the doctoral period fulfilled?
10

In retrospect, were your expectations concerning the doctoral period fulfilled?
11

When you started your doctoral period, which career did you see for yourself? (Academic)
12

Do you have a permanent job employment at present?
13

Where is your main workplace? (in the same institution at which I earned my PhD)
14

Where do you have your main position? (Universities/colleges)
15

Have not got a relevant job
16

To what degree have you used the knowledge you obtained during your doctoral period in your present position?
19

gender equality in science
concerning careers and access to funding
24

Women less often applied for grants in general, even in the disciplines where they constitute a large part of employees.
The fact can be due to the lower positions which they occupy.
However, we can argue that the group of women with doctoral degrees working in research, development and higher education is large enough to submit more applications.
We might assume (what we know also from some studies) that women face structural barriers in their academic institutions and also non academic restrains (conflict between work and family etc.).
Women’s situation as grant and stipends receivers is slowly changing. Recently they are more often present among beneficiaries.
It is necessary to remember that there is almost no institution using quota for women grant receivers or criterion of gender to equalize or to favor women.
25

MECHANISMS HAMPERING PRESENCE OF WOMEN IN ACADEMIA IN RECRUITMENT – MENTORING - PROMOTION • Stereotypes shaping candidates’ aspirations and conceptions
of life careers
• Private life of scientists: partnering patterns, careers of academic couples
• Difficulties in reconciliation of work and private life
• Women’s absence in decision-making bodies in science
26

WOMEN IN LEADERSHIP POSITION IN SCIENCE: POLISH CASE
Women are almost absent on the top administration positions in the best higher education institutions.
Women as decision makers in higher education institutions (% of total in each category in the institutions) in 2012
Higher education institutions:
Presidents N=10
Vice-presidents N=42
Deans N=117
Vice-deans N=365
1-10 positions in the national ranking
10.0%
9.5%
15.4%
26.6%
Higher education institutions:
Presidents N=10
Vice-presidents N= 21
Deans N= 37
Vice-deans N= 60
80-90 positions in the national ranking
10.0%
38.1%
18.9%
40.0%
Source: Author’s calculations
27


