1 Comparison of a traditional meta-analysis versus an individual patient data (IPD) meta- analysis to assess the diagnostic accuracy of the Patient Health Questionnaire-9 (PHQ-9) Brooke Levis Department of Epidemiology, Biostatistics and Occupational Health McGill University, Montreal Submitted November 2014 A thesis submitted to McGill University in partial fulfillment of the requirements of the degree of: Master of Science – Epidemiology (Thesis) Brooke Levis 2014
Transcript
1
Comparison of a traditional meta-analysis versus an individual patient data (IPD) meta-
analysis to assess the diagnostic accuracy of the Patient Health Questionnaire-9 (PHQ-9)
Brooke Levis
Department of Epidemiology, Biostatistics and Occupational Health
McGill University, Montreal
Submitted November 2014
A thesis submitted to McGill University in partial fulfillment of the requirements of the degree
of: Master of Science – Epidemiology (Thesis)
Brooke Levis 2014
2
Table of Contents
Title page 1
Table of contents 2
Abstract 5
Résumé 7
Acknowledgements 10
1. Introduction 12
2. Literature review 15
2.1. Depression 15
2.2. Screening 15
2.2.1. What is screening? 15
2.2.2. When is screening appropriate? 15
2.3. Depression screening 16
2.3.1. What is depression screening? 16
2.3.2. Controversy about screening 16
2.4. Diagnostic Accuracy 18
2.4.1. Diagnostic accuracy of depression screening tools 18
2.4.2. Limitations in existing evidence 19
2.4.2.1. Spectrum bias problem 19
2.4.2.2. Small sample sizes, data-driven cutoffs and selective reporting 19
2.5. Traditional meta-analyses 21
2.6. Individual patient data (IPD) meta-analysis 22
2.6.1. General approach 22
3
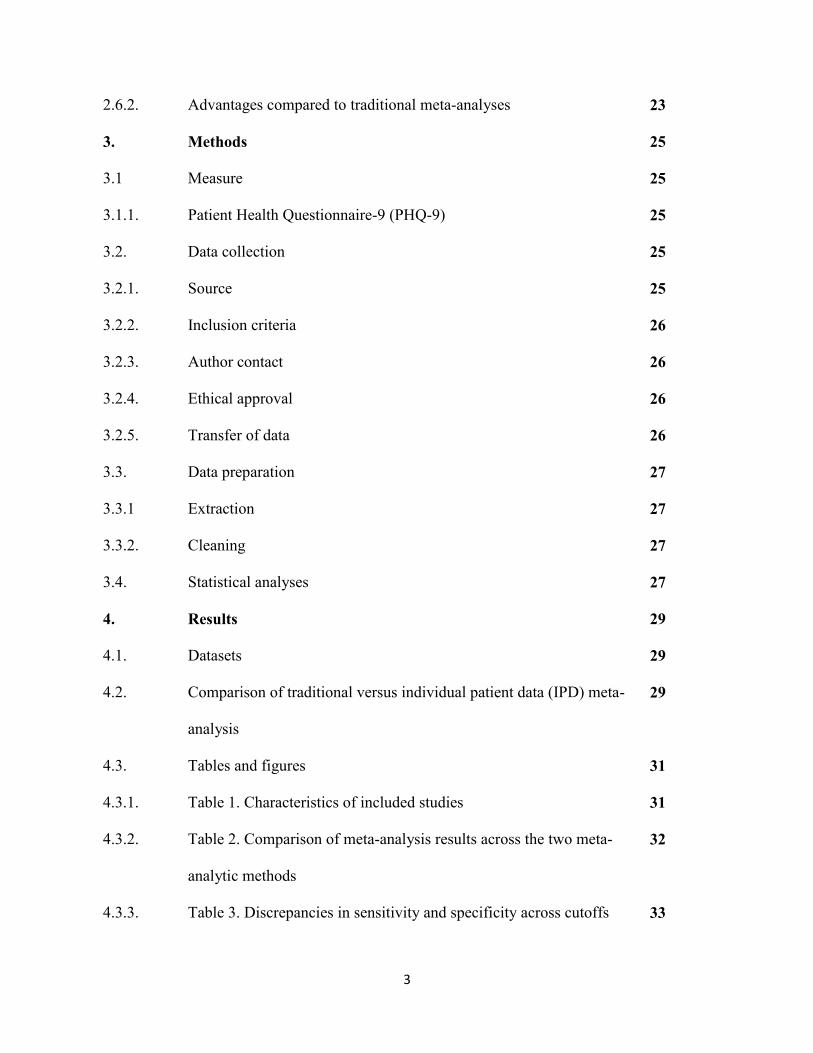
2.6.2. Advantages compared to traditional meta-analyses 23
3. Methods 25
3.1 Measure 25
3.1.1. Patient Health Questionnaire-9 (PHQ-9) 25
3.2. Data collection 25
3.2.1. Source 25
3.2.2. Inclusion criteria 26
3.2.3. Author contact 26
3.2.4. Ethical approval 26
3.2.5. Transfer of data 26
3.3. Data preparation 27
3.3.1 Extraction 27
3.3.2. Cleaning 27
3.4. Statistical analyses 27
4. Results 29
4.1. Datasets 29
4.2. Comparison of traditional versus individual patient data (IPD) meta-
analysis
29
4.3. Tables and figures 31
4.3.1. Table 1. Characteristics of included studies 31
4.3.2. Table 2. Comparison of meta-analysis results across the two meta-
analytic methods
32
4.3.3. Table 3. Discrepancies in sensitivity and specificity across cutoffs 33
4
4.4.4. Figure 1. ROC curves produced by IPD meta-analysis using all data
vs. traditional meta-analysis using published data only
34
5. Discussion 35
5.1. Main Finding 35
5.2. Patterns in selective outcome reporting 36
5.3. Clinical significance and implications 37
5.4. Implications for research 38
5.5. Limitations 39
6. Summary and final conclusion 42
6.1. Summary 42
6.2. Conclusion 43
7. References 44
8. Appendix 56
8.1 Patient Health Questionnaire-9 (PHQ-9) 57
5
Abstract
Background: Depression accounts for more years lived with disability than any other medical
condition. Major depressive disorder (MDD) may be present in 10-20% of patients in medical
settings. Effective interventions to reduce the burden of depression exist, but most patients with
depression do not receive adequate care. Screening for depression has been recommended to
improve access to depression care. However, studies that have examined the diagnostic accuracy
of depression screening tools typically have used data-driven, exploratory methods to select
optimal cutoffs. Most often, these studies report results from a small range of cutoff points
around whichever cutoff score is most accurate in that given study. When data from these
published studies are combined in meta-analyses, estimates of accuracy for different cutoff
points are often based on data from different studies, rather than having data from all studies for
each possible cutoff point. As a result, traditional meta-analyses may generate exaggerated
estimates of accuracy (i.e., sensitivity and specificity). Individual patient data (IPD) meta-
analyses can address this problem by synthesizing data from all studies for each cutoff.
Objective: To assess the degree to which selective reporting of results from well-performing
cutoff thresholds may bias accuracy estimates in meta-analyses of depression screening tools. To
do this, I examined results from studies of the Patient Health Questionnaire-9 (PHQ-9), a
frequently used depression screening tool, comparing results from a traditional meta-analysis of
published accuracy data to results from an IPD meta-analysis using original patient data from the
same studies.
6
Methods: Authors of studies included in a recently published meta-analysis on the PHQ-9 were
invited to contribute patient-level data. For each dataset, we extracted the PHQ-scores and MDD
diagnoses for each patient. Two sets of statistical analyses were performed: (1) a traditional
meta-analysis where, for each cutoff between 7 and 15, we included data from the studies that
reported accuracy results for the cutoff in the original publication; and (2) an IPD meta-analysis
where, for each cutoff between 7 and 15, we included data from all studies.
Results: We obtained data from 13 of 16 eligible datasets that were included in the original
meta-analysis. Of the 13 studies, 11 (83% of patients) published accuracy results for the
recommended cutoff score of 10 in the original report; accuracy results using traditional meta-
analysis (sensitivity = 0.85, specificity = 0.88) were similar to those using IPD meta-analysis
(sensitivity = 0.87, specificity = 0.88). For other cutoffs, the number of studies that published
accuracy results for the particular cutoff ranged from 3 to 6 (21-46% of all patients) and results
using the two different meta-analytic methods were more discrepant. Cutoffs below the standard
cutoff of 10 tended to underestimate sensitivity in the traditional meta-analysis, whereas cutoffs
above 10 tended to overestimate sensitivity. For instance, for a cutoff of 9, sensitivity was 0.78 in
traditional meta-analysis versus 0.89 using IPD, whereas for a cutoff of 11, sensitivity was 0.92
in traditional meta-analysis versus 0.83 using IPD. For all cutoffs, specificity was similar across
the two meta-analytic methods.
Conclusions: Traditional meta-analyses may exaggerate the diagnostic accuracy of depression
screening tools, especially for cutoffs that are not standard or recommended. IPD meta-analysis
provides a mechanism to obtain unbiased estimates of accuracy.
7
Résumé
Contexte: La dépression provoque plus d’années vécues avec incapacité que toute autre
condition médicale. Un trouble dépressif majeur peut être présent dans 10-20% des patients en
milieu médical. Des interventions efficaces pour réduire le fardeau de la dépression existent,
mais la majorité des patients souffrant de dépression ne reçoivent pas de soins adéquats. Le
dépistage de la dépression a été recommandé pour améliorer l'accès aux soins de la dépression.
Cependant, les études qui ont examiné la précision du diagnostic des outils de dépistage ont
généralement utilisé des méthodes exploratoires axées sur les données pour sélectionner les
seuils optimaux. Souvent, ces études présentent les résultats pour un petit nombre de seuils
autour de celui qui est le plus précis dans l'étude donnée. Lorsque les données de ces études
publiées sont combinées dans les méta-analyses, les estimations de précision pour différents
seuils sont souvent basées sur des données provenant de différentes études, plutôt que d'utiliser
des données de toutes les études pour chaque seuil possible. En conséquence, les méta-analyses
traditionnelles peuvent générer des estimations de précision exagérées. Des méta-analyses sur
données individuelles peuvent améliorer ce problème en synthétisant les données de toutes les
études pour chaque seuil.
Objectif: Évaluer à quel point la publication sélective des résultats de seuils performants peut
biaiser les estimations de la précision du diagnostic dans les méta-analyses des outils de
dépistage de la dépression. Pour ce faire, j’ai examiné les résultats des études du questionnaire
sur la santé du patient-9 (PHQ-9), un outil de dépistage de la dépression fréquemment utilisé, en
comparant les résultats d’une méta-analyse traditionnelle des données de précision publiées aux
8
résultats d’une méta-analyse sur données individuelles en utilisant les données originales des
patients des mêmes études.
Méthodes: Les auteurs des études incluses dans une méta-analyse récemment publiée sur le
PHQ-9 ont été invités à fournir des données au niveau du patient. Pour chaque ensemble de
données, nous avons extrait les scores du PHQ et le diagnostic de trouble dépressif majeur pour
chaque patient. Deux séries d'analyses statistiques ont été réalisées: (1) une méta-analyse
traditionnelle où, pour chaque seuil entre 7 et 15, nous avons inclus les données des études qui
ont publié des résultats de précision pour ce seuil dans la publication originale; et (2) une méta-
analyse sur données individuelles où, pour chaque seuil entre 7 et 15, nous avons inclus les
données de toutes les études.
Résultats: Nous avons obtenu les données de 13 des 16 ensembles de données admissibles de la
méta-analyse originale. Pour le seuil recommandé de 10, 11 des 13 études (83% des patients) ont
publié les résultats de précision du diagnostic dans le rapport initial; les résultats de la précision
utilisant une méta-analyse traditionnelle (sensibilité = 0,85, spécificité = 0,88) étaient semblables
à celles utilisant une méta-analyse sur données individuelles (sensibilité = 0,87, spécificité =
0,88). Pour les autres seuils, le nombre d'études ayant publié des résultats de précision pour le
seuil particulier variait de 3 à 6 (21-46% des patients) et les résultats en utilisant les deux
méthodes de méta-analyse étaient plus discordants. Les seuils inferieures du seuil recommandé
de 10 avaient tendance à sous-estimer la sensibilité dans la méta-analyse traditionnelle tandis que
les seuils supérieurs de 10 avaient tendance à surestimer la sensibilité. Pour tous les seuils, la
spécificité était similaire dans les deux méthodes de méta-analyse.
9
Conclusions: Les méta-analyses traditionnelles peuvent exagérer la précision du diagnostic des
outils de dépistage de la dépression, en particulier pour les seuils qui ne sont pas standard ou
recommandé. Les méta-analyses sur données individuelles fournissent un mécanisme pour
obtenir des estimations de précision non biaisées.
10
Acknowledgements
I would like to acknowledge the tremendous help, support, and guidance that my
supervisor, Dr. Brett Thombs, has provided me with over the past 5 years, and especially during
my Masters training the past 2 years. Amongst so many other things, you have made me an
extremely critical thinker and have taught me the importance of transparency. You are a fabulous
mentor who shows great interest in all of your trainees. I truly appreciate all of the time and
effort you have put into helping me become an independent epidemiologist, and I am thankful
for all of the opportunities you have provided me with to help me develop my career.
I would also like to acknowledge my co-supervisor, Dr. Andrea Benedetti. Thank you for
all of your help in developing my analysis plan and interpreting the results, and for all of your
support and feedback in preparing my manuscript and thesis for submission.
I would like to express my gratitude to McGill University and to the Department of
Epidemiology, Biostatistics and Occupational Health for providing me with a first-class
education. Thank you as well to the staff at the Student Affairs Office for answering all my
questions and for assuring I met all deadlines.
I would also like to thank the external reviewer for their time and effort in evaluating my
thesis. I appreciate the time you have taken away from your schedule to review my thesis and
share your expertise.
Thank you as well to all of the investigators who provided me with their patient-level
data from around the globe. This study would not have been possible without the rich data that
you supplied.
11
I would like to give many thanks to my family and friends for their support, as well as all
my colleagues as the Behavioural Health Research Group. A special thank you to my brother and
colleague Alex; you were extremely helpful in R programming and debugging.
Last, but definitely not least, my most heartfelt thanks go out to my friend, colleague and
roommate, Dr. Linda Kwakkenbos, for her help and support both in and out of the lab. I am
eternally grateful for all of the time you took to answer my many questions, and to proofread just
about anything important, as well as for all the coffee, lunches, and late night work sessions. I
could not have done this without you.
12
1. Introduction
Depression accounts for more years lived with disability than any other medical condition
(Lopez et al., 2006; Mathers et al., 2006; Moussavi et al., 2007; Whiteford et al., 2013). In
medical settings, major depressive disorder (MDD) is present in 5-10% of primary care patients,
including 10-20% of patients with chronic diseases (Evans et al., 2005). There are effective
interventions available to reduce the burden of depression, but most patients with depression do
not receive adequate care (Duhoux et al., 2009; Duhoux et al., 2013). Routine depression
screening has been recommended to improve access to depression care, but is controversial
(Thombs et al., 2012).
Depression screening refers to the use of depression screening tools to identify patients
who may have depression, but who are not seeking treatment for symptoms and whose
depression is not otherwise recognized by their physicians, so that they can be further assessed
and, if appropriate, treated (Raffle & Gray, 2007; UK National Screening Committee, 2000).
For depression screening to be effective, screening tools must be able to accurately distinguish
between patients with and without MDD. There is concern, however, that the diagnostic
accuracy of commonly-used depression screening tools is poorly understood and that existing
evidence on depression screening may overstate what would occur in actual clinical practice
(Thombs et al., 2011; Thombs et al., 2012).
One concern is that selective reporting of results from cutoff thresholds that perform well
in a given study, but not from cutoff thresholds that perform poorly, may be common and may
further inflate estimates of the diagnostic accuracy of depression screening tools. Studies that
have examined the diagnostic accuracy of depression screening tools typically use data-driven,
exploratory methods to select optimal cutoffs, and tend to report results only from a range of
13
cutoff points around whatever cutoff score worked best. When data from these published studies
are combined in traditional meta-analyses, which depend on sample-level results available in
published studies or unpublished reports, estimates of accuracy for different cutoff points are
often based on data from different studies, rather than having data from all studies for each
possible cutoff point. The problem with this is illustrated in a recent meta-analysis of the
diagnostic accuracy of the Patient Health Questionnaire-9 (PHQ-9), (Manea et al., 2012) an
instrument commonly used to screen for MDD in medical settings. In that meta-analysis, for
each possible cutoff score on the PHQ-9, the meta-analysis synthesized sample-level data from
all studies that had published data on sensitivity and specificity for that cutoff score. The
limitations of this method of meta-analyzing are highlighted by the finding that estimates of
sensitivity actually tended to improve as cutoff scores increased, which is a mathematically
impossible result if complete data were used, since as the cutoff score increases, fewer patients
are classified as cases, thus a lower proportion of true cases score above the threshold.
Individual patient data (IPD) meta-analyses (Riley et al., 2010) which synthesize actual
line-by-line patient data from primary studies, rather than only published summary results, is one
way to address the problem of selective reporting of results from only well-performing cutoffs.
This is because in IPD meta-analyses, data can be synthesized for all possible cutoff thresholds
for all included studies. When implemented effectively, IPD meta-analyses are considered by the
Cochrane Collaboration to be the ‘gold standard’ of evidence synthesis (Stewart et al., 2011).
No studies have systematically evaluated how and to what degree the selective reporting
of data from some thresholds, but not others, may bias accuracy estimates of depression
screening tools. Thus, the objective of this study was to systematically assess the manner and
degree to which selective reporting of results from well-performing cutoff thresholds may bias
14
accuracy estimates in meta-analyses of depressing screening tools. To do this, we compared
results produced by conducting a traditional meta-analysis of published accuracy data to results
produced by conducting an IPD meta-analysis using original patient data from the same studies,
using data from the recent meta-analysis on the diagnostic accuracy of the PHQ-9 (Manea et al.,
2012).
15
2. Literature Review
2.1. Depression
Depression accounts for more years lived with disability than any other medical condition
(Lopez et al., 2006; Mathers et al., 2006; Moussavi et al., 2007; Whiteford et al., 2013). In
medical settings, major depressive disorder (MDD) is present in 5-10% of primary care patients,
including 10-20% of patients with chronic diseases (Evans et al., 2005). There are effective
interventions available to reduce the burden of depression, but most patients with depression do
not receive adequate care (Duhoux et al., 2009; Duhoux et al., 2013). Screening for depression
has been recommended to address depression in medical settings.
2.2. Screening
2.2.1. What is screening?
Screening is “the presumptive identification of unrecognised disease or defect by the
application of tests, examinations, or other procedures which can be applied rapidly. Screening
tests sort out apparently well persons who probably have a disease from those who probably do
not. A screening test is not intended to be diagnostic. Persons with positive or suspicious
findings must be referred to their physicians for diagnosis and necessary treatment”
(Commission on Chronic Illness, 1957). Essentially, the purpose of screening is to detect
previously unrecognized cases so that they can be referred for diagnoses and treatment.
2.2.2. When is screening appropriate?
According to the World Health Organization (WHO), screening is appropriate when there
is an important health problem that is prevalent in the population and whose presence would not
likely be detected without screening. The screening tools used must perform well, and there must
16
be effective interventions available to benefit those with the condition. Finally, there needs to be
evidence from randomized controlled trials demonstrating that the benefits of screening
outweigh the harms (Wilson & Jungner, 1968).
2.3. Depression screening
2.3.1. What is depression screening?
Depression screening refers to the use of depression screening tools to identify patients
who may have depression, but who are not seeking treatment for symptoms and whose
depression is not otherwise recognized by their physicians, so that they can be further assessed
and, if appropriate, treated (Raffle & Gray, 2007; UK National Screening Committee, 2000).
Depression screening involves systematically assessing for depression among all individuals in a
given risk group using a standardized test. It is not probing specifically for depression on an
individual level or using depression symptom questionnaires to monitor treatment and relapse.
For depression screening to be effective, screening tools must be able to accurately distinguish
between patients with and without MDD. Accurate assessment of the performance of depression
screening tools, however, requires a large number of patients with and without MDD in order to
accurately estimate sensitivity (percent of patients with MDD correctly identified as likely
depressed) and specificity (percent of patients without MDD correctly identified as likely not
depressed).
2.3.2. Controversy about screening
There is no universally accepted recommendation for depression screening in medical
settings; different countries and groups have made varying and contradicting recommendations
over the years. In 2002, the first major recommendation came out. The United States Preventive
17
Services Task Force (USPSTF) made a recommendation for routine depression screening in
primary care settings where there is enhanced collaborative care available, but not in the absence
of such programs (Pignone et al., 2002). In 2009, the USPSTF updated their evidence review
and, based on evidence from 9 RCTs, recommended screening adults for depression in primary
care settings when staff-assisted depression management programs are available (Grade B
recommendation) (U.S. Preventive Services Task Force, 2009). In 2010, the UK National
Institute for Health and Care Excellence (NICE) put out a guideline on depression management
in primary care stating that there is no evidence that depression screening benefits patients.
Rather than routine screening, they recommended that primary care physicians be alert to
possible depression during encounters with patients (National Collaborating Center for Mental
Health, 2010). In 2013, the Canadian Task Force on Preventive Health Care (CTFPHC) similarly
recommended that physicians be alert, but not routinely screen, for depression in primary care
(Joffres et al., 2013). This recommendation actually reversed a 2005 recommendation to screen
for depression in the context of integrated staff-assisted depression management systems
(MacMillan et al., 2005). A major concern raised by the CTFPHC was that published reports of
the diagnostic accuracy of depression screening tools appear to overstate diagnostic accuracy
compared to what would occur in clinical practice.
In addition to the varying recommendations, a recent systematic review attempted to
evaluate whether there is evidence from randomized controlled trials (RCTs) that depression
screening benefits patients in primary care, using an explicit definition of screening (Thombs et
al., 2014). To be included in the review, a trial needed to compare depression outcomes between
screened and non-screened patients and meet the following 3 criteria: (1) randomize patients
prior to screening, (2) exclude patients that have already been diagnosed or who are already
18
being treated, and (3) offer the same services for depression treatment for patients identified as
depressed from the screener as well as patients identified without using the screener. Based on
these criteria, no screening trials were identified.
2.4. Diagnostic Accuracy
2.4.1. Diagnostic accuracy of depression screening tools
In studies on the diagnostic accuracy of depression screening tools, patient scores from
self-report depression symptom questionnaires are compared to diagnostic status (MDD versus
no MDD) based on a validated diagnostic interview that was designed to reflect Diagnostic and
Statistical Manual of Mental Disorders (DSM) or International Classification of Disease (ICD)
criteria for MDD. To be effective, depression screening tools must be able to accurately
distinguish between patients with and without MDD. Accurate assessment of the performance of
depression screening tools requires a large number of patients with and without MDD in order to
accurately estimate sensitivity and specificity. Sensitivity is the probability that patients with
MDD will be correctly identified as likely depressed by the screener, while specificity is the
probability that patients without MDD will be correctly identified as likely not depressed by the
screener (Altman & Bland, 1994). Sensitivity and specificity are generally regarded as intrinsic
characteristics of a test and are independent of disease prevalence (Brenner & Gefeller, 1997; Li
& Fine, 2011).
Studies of diagnostic accuracy typically seek to identify an optimal cutoff score using
receiver operating characteristic (ROC) curve analysis, by which sensitivity and specificity
associated with all possible cutoff scores are calculated and plotted (Hanley & McNeil, 1982;
19
Swets, 1988). As the required cutoff score for a positive screen increases, sensitivity decreases
(fewer cases reach the necessary threshold), but specificity increases.
2.4.2. Limitations in existing evidence
There is evidence suggesting that the diagnostic accuracy rates that are currently being
reported are exaggerated due to problems such as spectrum bias and the selective reporting of
data driven cutoffs.
2.4.2.1. Spectrum bias problem
Screening tools should detect non-recognized cases. Most existing studies of screening
accuracy, however, include large numbers of patients already being treated for depression. Those
patients were recognized as depressed without screening and would not be screened in clinical
practice, since screening is done to identify undetected cases. A recent review found that only
4% of 197 studies on the diagnostic accuracy of depression screening tools appropriately
excluded patients who were already diagnosed or already undergoing depression treatment
(Thombs et al., 2011). Inclusion of these patients in diagnostic accuracy studies would be
expected to inflate estimates of the number of new cases that would be identified through
screening and estimates of accuracy, since already recognized and treated patients are typically
more easily identified than those who would only be detected via screening.
2.4.2.2. Small sample sizes, data-driven cutoffs and selective reporting
Most existing primary studies are limited by small sample sizes and do not generate
precise estimates. As a result, different studies often generate substantially different ‘optimal’
cutoff scores for the same screening tool. For instance, one review examined 9 small studies that
used the Hospital Anxiety and Depression Scale (HADS) depression screener to detect
20
depression (Meijer et al., 2011). These studies identified optimal cutoff scores ranging from 5-
11, which is a range that is far too wide to be useful in clinical practice.
Selective reporting of results from cutoff thresholds that perform well in a given study,
but not from cutoff thresholds that perform poorly, may be common and may inflate estimates of
the diagnostic accuracy of depression screening tools. Most researchers report accuracy results
for the cutoffs that performed best in the particular studies, and do not report the results for the
cutoffs that did not work well. Because of this, synthesizing results across possible cutoff scores
in traditional meta-analyses, which combine summary results from primary studies, can generate
biased estimates of accuracy. For instance, a recent meta-analysis on the diagnostic accuracy of
the Patient Health Questionnaire-9 (PHQ-9), which is one of the most commonly used
depression screeners, included 18 diagnostic accuracy studies, and, for each possible cutoff, the
authors analyzed all the data available from the publications (Manea et al., 2012). In this paper,
a mathematically impossible result was obtained if all data from the included publications were
considered: as the cutoff increased, sensitivity appeared to increase, which is impossible since
fewer people are being classified as cases. The problem was that because some studies only
reported a small range of cutoffs around the best cutoff, the authors were only able to meta-
analyze a portion of the 18 studies for each cutoff.
Studies in areas outside of mental health have demonstrated that using data-driven cutoff
thresholds to estimate diagnostic accuracy generates overly optimistic estimates, particularly
when sample sizes are small (Ewald, 2006; Goodacre et al., 2005; Leeflang et al., 2008;
Thompson et al., 2006; Whiting et al., 2013). Generally, using the same sample to select an
optimal cutoff score and simultaneously estimate the diagnostic accuracy would be expected to
produce estimates that would not be replicated in actual practice (Rutjes et al., 2006; Whiting et
21
al., 2004). This suggests a high risk of bias when this is done in studies of depression screening
tools, especially since most existing primary studies have been limited by small sample sizes,
specifically by small numbers of cases of MDD.
2.5. Traditional meta-analyses
Traditional meta-analyses have been used to assess the diagnostic accuracy of depression
screening tools. Meta-analyses can overcome problems associated with small sample sizes in
primary studies by combining data across studies. This can be done without bias, however, only
if all relevant outcome data are reported in primary studies (e.g., accuracy data for all relevant
cutoff scores).
There are only a few examples of meta-analyses of depression screening tool accuracy
(Brennan et al., 2010; Gilbody et al., 2007; Hewitt et al., 2009; Manea et al., 2012; Meader et al.,
2014; Mitchell & Coyne, 2007; Mitchell, 2008; Mitchell et al., 2010; Mitchell et al., 2012;
Vodermaier & Millman, 2011; Wancata et al., 2006; Wittkampf et al., 2007). Existing meta-
analyses have handled the issue of selective threshold reporting in 3 different ways: (1) In some
meta-analyses, the authors have explicitly indicated that they have only included one cutoff from
each study. They have used either the cutoff the primary study authors indicated was optimal or a
cutoff that they deemed was most accurate using some alternative method when the primary
study authors did not clearly indicate an optimal cutoff. For instance, in a systematic review by
Wancata et al. (2006), when the primary study authors did not clearly recommend a particular
cutoff, the meta-analysis authors used the cutoff where sensitivity and specificity were closest
together. (2) In other meta-analyses, the authors have stated that they synthesized standard
cutoffs, but have substituted “optimal cutoffs” when standards were not reported in the original
22
studies. This substitution method may be indicated explicitly, or may not have been stated but
was reported to us by the authors of the meta-analysis. For instance, in a meta-analysis by
Meader et al. (2011), the authors attempted to synthesize accuracy data for the standard cutoff
score of 8, when available. However, they were only able to include results from this cutoff for
12 of 27 studies (44% of patients) included in the meta-analysis. Results for the standard cutoff
were not reported in the other included studies, presumably because the standard cutoff had not
performed well. For those studies, the authors used accuracy data from other, better performing
cutoffs instead and combined results quantitatively, even though the studies did not use the same
cutoff threshold. (3) In other meta-analyses, the authors have analyzed outcomes at each cutoff
separately, and for each cutoff, they included studies that reported results for the particular study.
For instance, in the meta-analysis by Manea et al. (2012), the authors included 18 primary
studies in their analyses, and for each cutoff of the Patient Health Questionnaire-9 (PHQ-9), they
included the subset of studies that had reported results for the respective cutoff.
2.6. Individual patient data (IPD) meta-analysis
Individual patient data (IPD) meta-analyses (Riley et al., 2010) which synthesize actual
line-by-line patient data from primary studies, rather than only published summary results, is one
way to address the problem of selective reporting of results from only well-performing cutoffs.
This is because in IPD meta-analyses, data can be synthesized for all possible cutoff thresholds
for all included studies.
2.6.1. General approach
The general approach of an IPD meta-analysis does not differ from a traditional meta-
analysis in terms of defining a research question, establishing study inclusion and exclusion
23
criteria, identifying and screening studies, and analyzing data (Stewart et al., 2011). IPD meta-
analyses are resource intensive in that they require a substantial amount of time to identify and
obtain original data, clarify data-related issues with data providers, and generate a consistent data
format across studies (Ahmed et al., 2012; Riley et al., 2010; Stewart et al., 2011). The quality of
IPD meta-analyses depends on the ability to obtain primary data (Riley et al., 2010).
2.6.2. Advantages compared to traditional meta-analyses
Individual patient data (IPD) meta-analysis (Riley et al., 2010) has the potential to
address shortcomings in existing depression screening research. IPD meta-analyses synthesize
original patient data obtained from researchers responsible for the primary studies, thus allowing
for the analysis of data from all cutoffs for all studies. IPD meta-analyses have particular benefits
when there are limitations in published information or where subgroup analyses are needed, but
cannot be performed from study-level data available in original reports; this is often the case
with depression screening accuracy studies. Because of these advantages, IPD meta-analyses,
when they can be implemented effectively, are considered by the Cochrane Collaboration to be
the ‘gold standard’ of evidence synthesis (Stewart et al., 2011).
In the context of evaluating the diagnostic accuracy of depression screening tools,
assessing all relevant cutoff scores for all studies can eliminate biases in traditional meta-
analyses because either large numbers of datasets are excluded, presumably due to poor accuracy
at standard cutoffs, or because some datasets are used to estimate diagnostic accuracy at some
cutoff scores, whereas other datasets are used at other cutoff scores. In addition, since virtually
all primary studies collect data on current depression treatment (e.g., antidepressant use), IPD
meta-analyses can appropriately exclude already-treated patients. Furthermore, IPD meta-
analyses with large numbers of patients and large numbers of MDD cases can potentially
24
incorporate individual risk factors for depression (e.g., age, sex, medical comorbidity) and study
variables (e.g., study setting, risk of bias factors) that may influence accuracy and clinical
decision-making, but have not been included in traditional meta-analyses, as has been noted by
the CTFPHC (Joffres et al., 2013).
25
3. Methods
3.1. Measure
3.1.1. Patient Health Questionnaire-9 (PHQ-9)
The PHQ-9 (Kroenke & Spitzer, 2002) (see Appendix) is a 9-item measure of depressive
symptoms that is commonly used in medical populations (Gilbody et al., 2007; Wittkampf et al.,
2007). The maximum total score is 27, and higher scores represent increased severity of
depressive symptoms. The standard cutoff score to identify possible depression is 10 (Gilbody et
al., 2007; Kroenke et al., 2001; Wittkampf et al., 2007).
3.2. Data collection
3.2.1. Source
This study was conducted using the set of studies included in the recent Manea et al.
meta-analysis of the PHQ-9 (Manea et al., 2012). We attempted to obtain the original patient
data from all studies included in the meta-analysis in order to re-analyze the data to compare
results produced by traditional meta-analysis versus results of an IPD meta-analysis.
In the meta-analysis by Manea et al., the authors searched electronic databases (Embase,
MEDLINE and PsycInfo) from 1999 to August 2010 for studies that evaluated and reported the
diagnostic accuracy of the PHQ-9 for diagnosing major depressive disorder. The authors
included studies that (1) defined MDD according to standard classification systems (e.g.,
International Classification of Diseases [ICD] or the Diagnostic and Statistical Manual of Mental
Disorders [DSM]), (2) used a standardized diagnostic interview (e.g., Mini International
Neuropsychiatric Interview [MINI], Structured Clinical Interview for DSM Disorders [SCID],
Composite International Diagnostic Interview [CIDI], Diagnostic Interview Schedule [DIS] or
26
Revised Clinical Interview Schedule [CIS-R]), and (3) provided sufficient data to calculate
contingency tables.
3.2.2. Inclusion criteria
We included studies that were comprised of unique patient samples and that published
diagnostic accuracy for MDD for at least one PHQ-9 cutoff.
3.2.3. Author contact
We contacted the authors of the eligible studies and invited them to contribute de-
identified primary data for an individual patient data (IPD) meta-analysis. When we could not
reach an author, we approached co-authors, or others who have worked recently with them.
3.2.4. Ethical approval
Per our approved ethics protocol, when an investigator agreed to contribute primary data,
ethical approval for the inclusion of the dataset was sought from the Research Ethics Committee
of Jewish General Hospital in Montreal. In order to obtain ethical approval, we provided the
Research Ethics Committee with the following documents: (1) a signed copy of a letter of
agreement for participation, (2) a copy of the ethics approval from the original study, (3) a copy
of the consent form used in the original study, and (4) a letter or e-mail from the contributing
author’s research ethics committee stating that IRB approval is not needed for this transfer or, if
necessary, research ethics committee approval of the transfer. In cases where documentation of
the original ethics approval and patient consent forms were not retrievable, ethics approval was
granted if there was other documentation that these documents exist (e.g., publications that
document ethics approval and patient consent).
3.2.5. Transfer of data
27
Once ethical approval for inclusion of a dataset was obtained, original patient data was
sought. Data to be transferred was required to be properly de-identified prior to transfer.
3.3. Data preparation
3.3.1. Extraction
For each included dataset, we extracted the PHQ-scores and MDD diagnoses for each
patient, and information pertaining to weighting. We also extracted study country,
setting/population, and the diagnostic standard used from the original publications.
3.3.2. Cleaning
We reviewed all original publications and compared diagnostic accuracy reported in the
original publications to the accuracy we calculated using the raw datasets. When data and
original publications were discrepant, we resolved discrepancies in consultation with the original
investigators. When 2x2 tables in the primary studies could not be reproduced using the data
provided, we corrected based on the raw data, and confirmed with the authors. For studies where
the original analyses included weights, we replicated the original weighting scheme (Fann et al.,
2005; Lamers et al., 2008; Wittkampf et al., 2009). For studies where the original analyses did
not include weights, but the sample selection method merited weighting, we constructed
appropriate weights (Azah et al., 2005; Yeung et al., 2008). For our analyses, we used the
primary data that was cleaned and verified in collaboration with the primary authors.
3.4. Statistical analyses
Two sets of statistical analyses were performed. First, we performed traditional meta-
analyses where for each PHQ-9 cutoff between 7 and 15 we included data from the studies that
28
included accuracy results for the respective cutoff in the original publication. For instance, if a
study published results for cutoffs 9 through 13, data from this study were included in the meta-
analyses of cutoffs 9 through 13, but not included in the meta-analyses of cutoffs 7,8,14 or 15.
Second, we performed IPD meta-analyses where for each PHQ-9 cutoff between 7 and 15, we
included data from all studies.
For both sets of analyses, bivariate random-effects models were used to identify the
“optimal” cutoff score. Bivariate random-effects meta-analysis models were estimated via
Gaussian Hermite adaptive quadrature, as described in Riley et al., (2008) for each PHQ-9 cutoff
between 7 and 15. This approach models sensitivity and specificity at the same time, accounting
for the inherent correlation between them, and accounts for the precision of estimates within
studies. A random-effects model was used so that sensitivity and specificity were assumed to
vary across primary studies. This model provided us with overall pooled sensitivity and
specificity for each cutoff for the two sets of analyses. By combining information across a range
of cutoffs, we constructed a pooled ROC curve for each set of analyses and show differences in
the results produced by the two methods of meta-analysis (i.e. traditional vs. IPD).
As we were interested in the differences in results produced by including all cutoffs versus only
including just published cutoffs, we used the cleaned raw data for both sets of analysis rather
than using the raw data for the IPD meta-analysis and published summary results for the
traditional meta-analysis. Similarly, since the objective of our study was to examine bias, and not
determine the true diagnostic accuracy of the screening tool, we analyzed the entire IPD dataset
as a whole, and consistent with the original meta-analysis, did not conduct any moderator
analyses. Furthermore, because the focus of this project was to examine the effects of selective
outcome reporting by comparing traditional meta-analysis with IPD meta-analysis, we did not
29
remove patients who were already diagnosed with depression and/or who were currently being
treated for depression, since we would have only been able to do this in the IPD meta-analysis.
30
4. Results
4.1. Datasets
The meta-analysis by Manea et al. included 18 original studies. Of these 18 studies, there
were 17 unique patient samples, 16 of which published diagnostic accuracy results for MDD for
at least one PHQ-9 cutoff and were thus eligible for the current study.
Authors were first invited to contribute data between May and July of 2012. Datasets
were obtained between August 2012 and September 2013, and all discrepancies were resolved in
consultation with the original investigators by March of 2014.
Of the 16 eligible datasets, 13 (80% of all eligible patients; 94% of all eligible MDD
cases) were successfully obtained, for a total sample size of 4589 patients. One of the missing
datasets (Adewuya et al., 2006) was reported by the study’s principal investigator to be lost in a
fire (personal communication, Abiodun Adewuya, October 16, 2012). Another missing dataset
(Kroenke et al., 2001) belonged to a researcher who is deceased. The third and final missing
dataset (Watnick et al., 2005) could not be provided by the principal investigator. Characteristics
of the included datasets can be found in Table 1.
4.2. Comparison of traditional versus individual patient data (IPD) meta-analysis
Of the 13 studies, 11 (83% of patients; 70% of MDD cases) published accuracy results
for the recommended PHQ-9 cutoff score of 10 in the original report; accuracy results using
traditional meta-analysis (sensitivity = 0.85, specificity = 0.88) were similar to those using IPD