Page 1
© 2019. This is the peer reviewed version of the following article: L. Jahn, K. Svardal, J. Krampe, 2019. Comparison of aerobic granulation in SBR and continuous-flow plant. Journal of Environmental Management 231, 953-961, which has been published in final form at https://doi.org/10.1016/j.jenvman.2018.10.101. This manuscript version is made available under the CC-BY-NC-ND 4.0 license http://creativecommons.org/licenses/by-nc-nd/4.0/.
1
Comparison of aerobic granulation in SBR and continuous-flow plants 1
L. Jahn, K. Svardal, J. Krampe 2
Institute for Water Quality and Resource Management, TU Wien, Karlsplatz 13/226-1, 1040 Vienna, 3
Austria 4
Keywords aerobic granulation, continuous-flow, SBR, SVI 5
Abstract 6
Up to now, aerobic granulation of activated sludge is only realized in SBRs, where the discontinuous feed 7
and sedimentation allow the formation of dense granules with excellent settling properties. However, 8
aerobic granulation in continuous-flow plants (CFP) is gaining more and more interest in order to exploit 9
the advantages of these excellent sludge properties to construct compact and efficient WWTP. Within the 10
scope of this project, a SBR and CFP were operated in parallel to investigate the aerobic granulation of 11
activated sludge and to compare the biomass in terms of their structure and settling behavior. CFP operation 12
included two experimental phases with different reactor designs. The use of synthetic wastewater during 13
phase I led to a biomass with a SVI of 42 ml g-1, whereby the SVI declined only to 85 ml g-1 in the second 14
phase and the use of municipal sewage. After the start-up period, microscopic images of the biomass from 15
CFP comprised small compact granules with a high flocculent fraction. Particle size distribution for phase 16
II confirm, that 72% of the particles had a size over 200 µm. A strong correlation was observed between the 17
appearance of NOx-N in the first reactor and the SVI. The results illustrate, that the anaerobic conditions 18
during feeding are essential to keep stable granules. 19
1. Introduction 20
Aerobic granular sludge (AGS) is an innovative technology for the biological wastewater treatment 21
worldwide. AGS is characterised as compact and dense biomass which settles much faster than flocculent 22
sludge. Up to now, AGS is only realised in sequencing batch reactors (SBR). These systems offer an easy 23
handling and the adjustment of individual phases within one single reactor. Hereby, the cycle operation 24
consists of an anaerobic feeding, aeration and sedimentation phases. In recent years, a lot of research has 25
Page 2
© 2019. This is the peer reviewed version of the following article: L. Jahn, K. Svardal, J. Krampe, 2019. Comparison of aerobic granulation in SBR and continuous-flow plant. Journal of Environmental Management 231, 953-961, which has been published in final form at https://doi.org/10.1016/j.jenvman.2018.10.101. This manuscript version is made available under the CC-BY-NC-ND 4.0 license http://creativecommons.org/licenses/by-nc-nd/4.0/.
2
been undertaken to understand the requirements for the aerobic granulation, whereby initially SBR systems 26
were considered. Especially, the anaerobic feed was found to improve the stability of the granules by 27
maintaining substrate-storing organism with slow growth rates (de Kreuk and van Loosdrecht, 2004). These 28
organisms are promoted by a batch-wise feeding strategy, which ensures feast and famine conditions and 29
subsequently oppress the growth of filaments. Beside a well-described plug-flow feed into the settled 30
biomass at the bottom of the reactor and a subsequently high F/M ratio, some studies relate to mixed 31
anaerobic conditions during the feed. Rocktäschel et al. (2013) found that this steep substrate gradient 32
between bulk phase and biomass is not absolutely necessary to form stable granules. Compact and dense 33
granules with excellent settling properties were hereby achieved with a fast influent pumping and a 34
subsequently anaerobic mixing phase, although the granules were overall smaller compared to the non-35
mixed feeding strategy. The results of this study indicate that aerobic granulation is also possible under 36
mixed anaerobic conditions (Rocktäschel et al., 2013), which is important for the continuous-flow operation. 37
Beside the anaerobic feed, an increased hydraulic pressure can be set to washout fine sludge flocs and to 38
promote aerobic granulation. The discharge of flocculent biomass during the start-up of an AGS lab scale 39
reactor is often desired in order to enrich a biomass which settles much faster and owns already a dense and 40
compact structure. Hereby, the minimum settling velocity, defined as vs,min, influences the extent of sludge 41
particles that is discharged during the decant phase. The parameter vs,min is calculated as quotient of the 42
sedimentation height L and the settling time t [Unit: m h-1] and can be either enhanced by increasing the 43
settling height inside the reactor or by reducing the settling time. In order to achieve a rapid granulation, 44
vs,min should be higher than the settling velocity of the flocculent sludge. 45
First full scale plants based on aerobic granular sludge were constructed as Nereda process. Pronk et al. 46
(2015b) summarize some first operating data from an aerobic granular sludge plant treating domestic 47
wastewater. The authors report a sludge and volumetric loading rate of 0.1 kgCOD kgTSS-1 d-1 and 48
1.5 kgCOD m-³ d-1. Hydraulic retention time was 17 h. The dry and rain weather cycle comprised 390 and 49
180 min with an anaerobic plug-flow feed of 60 to 90 min. Hereby, the plug-flow feed under non-mixed 50
conditions creates high substrate concentrations which promotes the formation of large granules due to an 51
increased diffusion. The desired biomass concentration of 8 gTSS L-1 was reached after 9 months (Pronk et 52
al., 2015b). 53
Page 3
© 2019. This is the peer reviewed version of the following article: L. Jahn, K. Svardal, J. Krampe, 2019. Comparison of aerobic granulation in SBR and continuous-flow plant. Journal of Environmental Management 231, 953-961, which has been published in final form at https://doi.org/10.1016/j.jenvman.2018.10.101. This manuscript version is made available under the CC-BY-NC-ND 4.0 license http://creativecommons.org/licenses/by-nc-nd/4.0/.
3
Beside this suitable handling of SBR systems for an aerobic granulation, in which an anaerobic plug-flow 54
is easy to realise and vs,min can be controlled over the sedimentation time, most of the large scale WWTP are 55
designed as continuous-flow plants (CFP). It is essential to have well-mixed conditions in these systems in 56
order to avoid sludge deposits on the bottom of the tanks. Moreover, the clarification takes place 57
continuously in a separate tank, which makes the sludge separation difficult to control. However, the 58
implementation of AGS in existing CFP would offer the opportunity to retrofit existing plants and to 59
increase the hydraulic treatment capacity without the need to build additional tank volume. The successful 60
transfer of AGS in a CFP operation would allow constructing compact WWTP with smaller sedimentation 61
tanks. Moreover, there are publications reporting a reduced energy demand for the activated sludge tank 62
(Giesen and Thompson, 2013; Niermans et al., 2009). With regard to the several advantages of the AGS 63
process, a current research question is, under which conditions is it possible to realise an aerobic granulation 64
in a continuous-flow operation. 65
Until now, there are only few publications reporting about AGS in continuous-flow systems. For example, 66
Liu et al. (2012) used a continuous-flow setup with a SBAR (sequencing batch airlift reactor), a settling 67
tank and a tank with a dynamic membrane, which was used to ensure good effluent quality. The sludge 68
separation was realised over a sieve with a mesh size of 600 µm. Sieving methods are accepted to separate 69
granules from floccelent sludge since the second granular sludge workshop (de Kreuk et al., 2007). The 70
plant was inoculated with granules from a SBR and fed with synthetic wastewater. The retained biomass 71
had a loose structure with particle sizes in a range of 0.1 to 1.0 mm and settling velocities between 15 and 72
25 m h-1. The authors report, that the granules had an overall smaller diameter, because under continuous 73
feeding conditions, the diffusion of nutrients is limited by the lower substrate gradient. Li et al. (2015) 74
investigated the aerobic granulation in a reverse-flow baffled reactor (RFBR), where the feed of raw 75
wastewater (30% municipal and 70% industrial) was periodically switched between the two ends of the 76
reactor via control valves. During the first half of the cycle (2 h), the flow direction was from right to left 77
through the reactor and was switched from left to right in the second phase. A main advantage of this 78
operation is, that the need of sludge pumping is minimised. The seed sludge was from an anaerobic-aerobic 79
tank of a WWTP with a sludge volume index (SVI) of 66 ml g-1. The operation resulted in periodic feast 80
and famine conditions, which allowed the formation of granules after 21 days and finally a SVI of 33 ml g-1. 81
However, the granules from the RFBR had a small mean diameter of 130 µm and the raw wastewater 82
obtained a high amount of inorganic compounds (metal ions and salts), which probably affected the settling 83
Page 4
© 2019. This is the peer reviewed version of the following article: L. Jahn, K. Svardal, J. Krampe, 2019. Comparison of aerobic granulation in SBR and continuous-flow plant. Journal of Environmental Management 231, 953-961, which has been published in final form at https://doi.org/10.1016/j.jenvman.2018.10.101. This manuscript version is made available under the CC-BY-NC-ND 4.0 license http://creativecommons.org/licenses/by-nc-nd/4.0/.
4
behavior. Another study from Li et al. (2016) relates to the operation of a CFP, where the setup included an 84
anaerobic reactor with 6 L and an aerobic reactor with 9 L. The sludge separation was realised in a secondary 85
clarifier constructed as a tube with 0.125 L. HRT was 6 h and compromised an anaerobic time of 2.4 h and 86
an aerobic time of 3.6 h. The granules were distinguished by particle sizes of 600 μm and a loose structure 87
with a SVI of about 20 ml g-1. However, the plant was inoculated with AGS from a SBR and synthetic 88
wastewater was used as feed, which is known to favor for regular granules. More references of aerobic 89
granulation in CFPs are summarized below in Table 1. 90
The few studies to aerobic granulation in CFPs illustrate, that there is still research demand in order to 91
establish aerobic granulation in continuous-flow systems with the use of municipal wastewater. Especially, 92
the implementation of the anaerobic feed and the sludge separation are important for the large scale 93
application. In this study, two experimental setups for SBR and CFP were operated to investigate the aerobic 94
granulation and settling properties of the activated sludge. The main objective of the SBR was to investigate 95
the influence of the anaerobic feeding and settling time on the granules structure. AGS cultivated in the SBR 96
served as reference to compare the sludge properties of the biomass cultivated in the CFP. Hereby, the 97
known conditions required for the aerobic granulation in SBRs were set to individual compartments of the 98
CFP. For the experiments municipal wastewater was used to set a representative feed composition. The 99
focus of this study was to test operational conditions under which AGS could be established in a CFP. 100
Furthermore, the study was used to earn general operational experiences for the handling of AGS. 101
102
Page 5
© 2019. This is the peer reviewed version of the following article: L. Jahn, K. Svardal, J. Krampe, 2019. Comparison of aerobic granulation in SBR and continuous-flow plant. Journal of Environmental Management 231, 953-961, which has been published in final form at https://doi.org/10.1016/j.jenvman.2018.10.101. This manuscript version is made available under the CC-BY-NC-ND 4.0 license http://creativecommons.org/licenses/by-nc-nd/4.0/.
5
Table 1. Literature overview to continuous flow-operation with aerobic granular sludge 103
Author Setup (reactor type, media) Results Information Liu et al. (2012) SBAR, settling tank, DMBR (dynamic
membrane) tank and a sludge selection tank (sieve with 600 µm mesh size) AGS as inoculum, synthetic wastewater
0.1- 1.0 mm, 15- 25 m h-1 No data for SVI
Continuous feeding conditions and limited diffusion lead to overall smaller granules.
Chen et al. (2013) Two CFP with a completely stirred reactor (18 L), clarifier: 4.5 L, DO: 4.2 mg/L, synthetic wastewater, no anaerobic conditions R1: seed sludge with filaments R2: seed sludge without filaments
Seed sludge from a WWTP SVI between 50 and 90 ml g-1 Size in a range of 0.18 to 1.25 mm
Granules could form with a sufficient number of filaments and high shear force. High H/D ratio of the reactor and short settling times were not essential for the formation of AGS.
Li et al. (2015) Reverse Flow Baffled Reactor (RFBR), feed switched periodically between the two reactors endings, sewage from WWTP with some metal compounds, seed sludge SVI: 66 ml g-1
AGS with a mean diameter of 130 µm and SVI of 33 ml g-1, high inorganic compounds (VSS/TSS of 0.55)
Higher EPS content, PN/PS ratio in the EPS was about 10:1, precipitation inside the granules, Gamma proteobacteria and Nitrospira sp. dominate in RFBR.
Li et al. (2016) Anaerobic zone: 6 L, Aerobic zone: 9 L Settling tank: 0.125 L, HRT of 6 h with 2.4 h anaerobic and 3.6 h aerobic HRT
AGS as inoculum, synthetic wastewater, 900 µm diameter SVI of 20 ml g-1
Granules with large size were more influenced by the inoculation than those with smaller sizes.
Corsino et al. (2016) Reactor of 7.5 L was divided into five compartements with risers/downcomers, high loaded and low loaded zones to ensure feast and famine conditions, ultrafiltration membrane
Granules with loose structure, improved structure with an intermittent feed.
Feast/famine conditions and the hydraulic selection pressure are essential to washout flocculent sludge.
Zou et al. (2018) Two-zone sedimentation tank, with 26.8 L, real and low-strength wastewater, micropowder with metal ions, seed sludge from a WWTP
Mean diameter of 105 µm, SVI 26 ml g-1
Micropowder served as nuclei for the microbial attachment.
104
Page 6
© 2019. This is the peer reviewed version of the following article: L. Jahn, K. Svardal, J. Krampe, 2019. Comparison of aerobic granulation in SBR and continuous-flow plant. Journal of Environmental Management 231, 953-961, which has been published in final form at https://doi.org/10.1016/j.jenvman.2018.10.101. This manuscript version is made available under the CC-BY-NC-ND 4.0 license http://creativecommons.org/licenses/by-nc-nd/4.0/.
6
2. Material and Methods 105
2.1 Experimental setup 106
2.1.1 SBR 107
Aerobic granules were cultivated in a lab scale SBR with a reactor volume of 8 L. H/D ratio of the reactor 108
was 5.7. The experiments lasted 200 days, whereby the reactor was fed with wastewater from a municipal 109
WWTP. Cycle time was 3 h including an anoxic-anaerobic plug-flow feed of 60 min. Settling times were 110
set in a range of 5 to 1 min to vary the selection pressure during the startup. Stirrers were not used throughout 111
the experiments. Exchange ratios were between 30 and 40% and thus within a common range for SBR plants 112
(DWA, 2010). HRT was on average 8.9 h. During the experiments, an alternate aeration strategy was applied 113
with aeration intervals of 5 min. DO was not controlled during the aeration and reached concentrations up 114
to 5 mg L-1. Figure 3 shows a typical DO profile as well as N and P concentrations during the feeding phase 115
and aeration. Since there was NOx-N left over from the earlier cycle, the first minutes during the feeding 116
included denitrification. However, anaerobic conditions were reached about 20 to 30 min after the start of 117
the feed. 118
119 Figure 1. DO profile of the SBR with phases (left), N and P during feeding and the aerated phase (right) 120
2.1.2 CFP 121
The CFP setup included a first reactor (selector), which was operated in order to ensure anaerobic conditions 122
similar to the anaerobic feed of the SBR. The reactor volume and layout of this anaerobic tank was changed 123
Page 7
© 2019. This is the peer reviewed version of the following article: L. Jahn, K. Svardal, J. Krampe, 2019. Comparison of aerobic granulation in SBR and continuous-flow plant. Journal of Environmental Management 231, 953-961, which has been published in final form at https://doi.org/10.1016/j.jenvman.2018.10.101. This manuscript version is made available under the CC-BY-NC-ND 4.0 license http://creativecommons.org/licenses/by-nc-nd/4.0/.
7
between the two phases. The relevant operational data of the two experimental phases for the CFP are 124
summarized in Table 2. Figure 2 shows a schematic chart of the CFP. 125
126
Table 2. Settings and approaches during the experimental phase I and II 127
Phase Medium Approach Vanaerob VBB qA OLR
[L] [L] [m h-1] [gCOD (L d)-1]
Phase I synthetic complete mixed anaerobic recator
9.7 39.3 0.23 0.19
Phase II sewage plug-flow and mixed
anaerobic reactor 2.4/6.4 39.3 0.23 0.36
Phase I lasted 65 days, whereby the CFP was inoculated with activated sludge from a municipal WWTP 128
and the feed was synthetic media containing C12H22O11, C6H8O7, CH4N2O and K2HPO4. An additional trace 129
element solution was dosed in regular periods to avoid limitations. The setup comprised a completely mixed 130
anaerobic reactor with 9.7 L and a mixed aerobic-anoxic reactor with 39.3 L. Thus, the ratio between 131
anaerobic and total volume was 20%. The return sludge ratio was 2.2 until day 39 and was reduced on day 132
46 to 1.3. The mean surface and sludge loading of the clarifier was 0.23 m h-1 and 51.3 L m-2 h-1 respectively. 133
Phase II comprised a period of 120 days. Hereby municipal sewage from a nearby WWTP was feed to the 134
plant. The anaerobic part was divided in two sections, a tube reactor with 2.4 L and a completely mixed 135
reactor with 6.4 L. The aerobic-anoxic reactor was continuously stirred. The tube reactor was operated in a 136
horizontal plug-flow to achieve high substrate concentrations as usually realized in SBRs. Twice a week the 137
walls inside the tube were cleaned to avoid a biofilm growth. The ratio between anaerobic to the total volume 138
was 18% and thus similar to the anaerobic volume in phase I. HRT was 3.0 h in the anaerobic part. The 139
return sludge ratio was set to 1.6. The mean sludge volume loading was 49.1 L m-2 h-1 with a mean surface 140
loading of 0.23 m h-1. 141
Page 8
© 2019. This is the peer reviewed version of the following article: L. Jahn, K. Svardal, J. Krampe, 2019. Comparison of aerobic granulation in SBR and continuous-flow plant. Journal of Environmental Management 231, 953-961, which has been published in final form at https://doi.org/10.1016/j.jenvman.2018.10.101. This manuscript version is made available under the CC-BY-NC-ND 4.0 license http://creativecommons.org/licenses/by-nc-nd/4.0/.
8
142 Figure 2. Schematic chart of the setup of the continuous-flow plant 143
The aerated reactor was equipped with a combined pH/redox sensor (Endress und Hauser, Memosens, 144
Model CPS16D) and a DO sensor (Endress und Hauser, Oxymax COS61D). Figure 3 shows typical DO 145
profils for the CFP during phases I and II. The aeration was set between 2 and 3 mg L-1 for a period of 40 146
(30) min. In the subsequent non-aerated phase of 20 (30) min, the DO decreased to zero which allowed 147
denitrification. Moreover, a siemens logo control tool was used to set the sequential arrangement of pumps, 148
valves and aeration modes. Suspended solids were accumulated in a downstream collecting tank and 149
analysed once a week to calculate the biomass washout and sludge age. 150
Page 9
© 2019. This is the peer reviewed version of the following article: L. Jahn, K. Svardal, J. Krampe, 2019. Comparison of aerobic granulation in SBR and continuous-flow plant. Journal of Environmental Management 231, 953-961, which has been published in final form at https://doi.org/10.1016/j.jenvman.2018.10.101. This manuscript version is made available under the CC-BY-NC-ND 4.0 license http://creativecommons.org/licenses/by-nc-nd/4.0/.
9
151 Figure 3. Typical DO profils in the aerated tank for the CFP during phase I and II (lines show DO, columns 152
show aeration mode ON/OFF) 153
2.2 Sampling 154
Each charge of wastewater used for the CFP and SBR was sampled and analysed for COD (chemical oxygen 155
demand), TN (total nitrogen), TP (total phosphorous), NH4-N and PO4-P. Effluent samples were taken twice 156
a week from both plants and analysed for COD, NH4-N and PO4-P. Additional samples were taken from the 157
effluent of the anaerobic reactor of the CFP. MLSS (mixed liquor suspended solids) were sampled during 158
aerated conditions twice a week. SVI as well as SV5/SV30 and SV10/SV30 ratio and pH value were measured 159
daily. Table 3 shows the mean analytical data of the wastewater fed to the CFP and SBR. Mircoscopic 160
images were prepared weekly by a Leica microscope to track changes in the sludge structure. Particle size 161
distributions were measured by a Malvern Mastersizer 2000 to compare the sizes of the AGS from the SBR 162
and CFP with seed sludge from a WWTP. This technology allows to identify the granulation grade and a 163
percental amount of particles in a defined size range. 164
Table 3. Number of samples, mean composition of the wastewater for the plants and OLR 165
Plant Nr. COD TN TP OLR OLR [-] [mg L-1] [mg L-1] [mg L-1] [gCOD L-1 d-1 ] [gCOD gTSS-1 d-1 ]
CFP (Phase I) 23 457 46.3 18.6 0.5 0.19 CFP (Phase II) 38 560 59.1 11.8 0.7 0.36 SBR 65 388 44.7 9.4 1.0 0.36
Page 10
© 2019. This is the peer reviewed version of the following article: L. Jahn, K. Svardal, J. Krampe, 2019. Comparison of aerobic granulation in SBR and continuous-flow plant. Journal of Environmental Management 231, 953-961, which has been published in final form at https://doi.org/10.1016/j.jenvman.2018.10.101. This manuscript version is made available under the CC-BY-NC-ND 4.0 license http://creativecommons.org/licenses/by-nc-nd/4.0/.
10
3. Results 166
3.1 SBR 167
Aerobic granulation in the SBR was achieved within 28 days, whereby first small granules were detected 168
via microscopic images. Figure 4 shows the measured SVI and vs,min. During the startup, the settling time 169
was decreased to 3 min and thus vs,min was changed to 3 m h-1. With these settings, SVI decreased from 120 170
to 60 ml g-1 within 42 days. The further increase of vs,min to 4 m h-1 lead to a even lower SVI of 40 ml g-1. 171
The settling time was afterwards reduced to 1 min, which resulted in vs,min of 8.5 m h-1 and consequently in 172
a strong washout of biomass. SVI was not affected by this increased washout and was stable at 40 ml g-1 but 173
climbed afterwards to 64 ml g-1 (day 126). The higher SVI was probably caused by an increased sludge 174
loading (0.5 g COD gTSS-1 d-1) due to the intensive biomass washout. Settling time was set back to 2 and 175
3 min and vs,min was again between 3.0 and 4.7 m h-1. However, with these settings, it was not possible to 176
return to this low SVI of 40 ml g-1. SVI was mainly between 50 and 60 ml g-1 till the end of the experiments. 177
SV10/SV30 ratio of the AGS was 1.0 to 1.1; while the ratio of the inoculated activated sludge was about 1.5 178
to 1.8. Settling velocity of individual granules were determined with 23 m h-1, whereas for activated sludge 179
a range of 7 to 10 m h-1 is reported (Qin et al., 2004). 180
181 Figure 4. SVI, settling time and vs,min of the SBR (left) and COD, TN and TP removal of the SBR (right) 182
Page 11
© 2019. This is the peer reviewed version of the following article: L. Jahn, K. Svardal, J. Krampe, 2019. Comparison of aerobic granulation in SBR and continuous-flow plant. Journal of Environmental Management 231, 953-961, which has been published in final form at https://doi.org/10.1016/j.jenvman.2018.10.101. This manuscript version is made available under the CC-BY-NC-ND 4.0 license http://creativecommons.org/licenses/by-nc-nd/4.0/.
11
Additionally, the particle size distributions of the flocculent seed sludge and the AGS from the SBR were 183
measured and compared. The analysed granules were removed from the SBR on day 186 and had a SVI of 184
63 ml g-1 and a SV10/SV30 ratio of 1.14. The particle size distribution indicates that approx. 50% of the 185
particles of the flocculent activated sludge were smaller than 235 μm, while the AGS obtained 50% of the 186
particles larger than 548 μm and only 10% being smaller than 143 μm. The measurement illustrates the 187
change of the particle sizes within the granulation from a flocculent to a granular structure. Beside the high 188
amount of large granules, there was a significant proportion of flocculent biomass present in the AGS. This 189
observation is in line with earlier reports from Pronk et al. (2015b) and Wagner et al. (2015). There is usually 190
a flocculent proportion present in a granular sludge suspension especially when real wastewater is used as 191
feed. Reasons for the flocs are suspended particular matter from the sewage, separated particles from the 192
granules and biomass growth on the supplied polymeric substrate (Pronk et al., 2015b). Overall, there was 193
a good removal performance observed with the SBR operation. Figure 4 shows the COD, TN and TP 194
removal calculated per week. COD and NH4-N removal were on average 88.3% and 82.6% respectively. 195
Nitrification rate was between 3.3 and 3.7 mgNH4-N gTSS-1 h-1. The maximum respiration rate at the 196
beginning of the aerated phase was between 24 and 36 mgO2 h-1. A continuous improvement of the TN 197
removal was observed from day 100 on. TN removal depends beside the nitrogen load, from the DO 198
concentration and the diameter of the granules. Thus, the oxygen diffusion determines the distribution of 199
aerobic and anoxic zones inside the granules. The larger particle sizes are responsible for the increased 200
anoxic zones within the granules and explain the increased TN removal. 201
Moreover, the results of this study show a strong correlation between TN and TP removal. TP removal 202
reached up to 83.6%. The extent of biological phosphate removal depends on several factors, such as sludge 203
age, temperature, wastewater composition and content of phosphate accumulating organisms (PAO). Bassin 204
et al. (2012) investigated the TP removal at different temperatures and found a higher removal of 90% with 205
20 °C compared to an operation with 30 °C (TP removal of 70%). Similar observations were reported by 206
Winkler et al. (2011), whereby the lower TP removal at higher temperatures was explained with growth 207
advantages for GAOs (glycogen accumulating organisms). Since PAOs and GAOs compete for the same 208
substrate and GAOs are not able to remove phosphate, the growth of GAOs is not desired. Since PAOs are 209
more present in granules of the lower sludge bed, a suitable method to increase the growth of PAOs was 210
found in a selective removal of granules from the top of the sludge bed (Winkler et al., 2011). This strategy 211
Page 12
© 2019. This is the peer reviewed version of the following article: L. Jahn, K. Svardal, J. Krampe, 2019. Comparison of aerobic granulation in SBR and continuous-flow plant. Journal of Environmental Management 231, 953-961, which has been published in final form at https://doi.org/10.1016/j.jenvman.2018.10.101. This manuscript version is made available under the CC-BY-NC-ND 4.0 license http://creativecommons.org/licenses/by-nc-nd/4.0/.
12
resulted in a complete TP removal. However, in the present study, waste sludge was removed under mixed 212
conditions during the aerated phase to remove also older and larger granules. Probably, this sludge wasting 213
strategy caused a lower TP removal compared to results from literature. The average pH value in the reactor 214
was 7.56. 215
3.2 CFP 216
The following section describes the experiments of the CFP during the two experimental phases. In both 217
phases the plant was inoculated with activated sludge from a municipal WWTP. The main focus was to 218
describe changes in the sludge structure and settling behavior. Figure 5 shows the course of the SVI, 219
SV5/SV30 and SV10/SV30 ratios of the CFP for phase I and II. 220
The SVI of the seed sludge at the beginning of phase I was about 130 ml g-1 and decreased to 66 ml g-1 221
within 11 days. Over the same period, the SV10/SV30 ratio dropped from 1.8 to 1.5. NOx-N and DO measured 222
in the effluent of the first tank (selector) was 0 mg L-1 till day 44. Suspended solids (SS) in the effluent were 223
between 32 and 200 mg L-1 up to the day 18. As a result of the better settling properties, the washout of SS 224
decreased, thus the effluent concentrations fluctuated between 8 and 25 mg L-1 until the end of phase I. By 225
day 32, the SVI remained between 60 and 80 ml g-1 with a SV10/SV30 ratio of approximately 1.4. A further 226
decrease of the SVI to 42 ml g-1 was recorded until day 46 and was probably caused by a massive growth 227
of Arcella (microscopic images below). In the further operation, the SVI increased again to 70 ml g-1 caused 228
by the growth of filaments. Anaerobic conditions were not longer ensured from day 45 on, thus there is 229
probable reason for the increased SVI. MLSS concentration during phase I ranged between 1.8 and 4.0 g L-1. 230
During the startup of phase II, there was an intensive washout of flocculent biomass with SS in the effluent 231
in a range of 35 to 227 mg L-1. While the SV5/SV30 ratio was approximately 2.5 at the beginning of the 232
experiments, the ratio declined to 1.5 till day 100. A similar trend was observed for the SV10/SV30 ratio with 233
a steady decrease from 1.6 to 1.2. MLSS was between 1.2 and 3.2 g L-1. At the beginning of the experiments, 234
the SVI was approx. 140 ml g-1 and declined to 90 and 80 ml g-1 between the days 44 and 74. During phase II 235
(till day 74), NOx-N and DO was 0 mg L-1 in the effluent of the first tank and confirm anaerobic conditions 236
in the first reactor. Between the days 74 and 79, a sudden increase of the SVI from 85 to 102 ml g-1 was 237
recorded, while simultaneously NOx-N concentrations up to 6.4 mg L-1 appeared in the effluent of the 238
anaerobic reactor. A similar correlation was seen between days 109 and 114, where NOx-N concentrations 239
Page 13
© 2019. This is the peer reviewed version of the following article: L. Jahn, K. Svardal, J. Krampe, 2019. Comparison of aerobic granulation in SBR and continuous-flow plant. Journal of Environmental Management 231, 953-961, which has been published in final form at https://doi.org/10.1016/j.jenvman.2018.10.101. This manuscript version is made available under the CC-BY-NC-ND 4.0 license http://creativecommons.org/licenses/by-nc-nd/4.0/.
13
of 7.6 and 9.0 mg L-1 led to an increase of the SVI to 100 ml g-1. Form these findings, it seems that the 240
presence of NOx-N and subsequently anoxic instead of anaerobic conditions in the first reactor (selector) 241
are responsible for higher SVI. A tight control of the nitrogen removal is necessary to ensure anaerobic 242
conditions in the selector and to allows a stable granules formation. 243
244
245
Figure 5. SVI, SV5/SV30 and SV10/SV30 ratio for the CFP during phase I and II 246
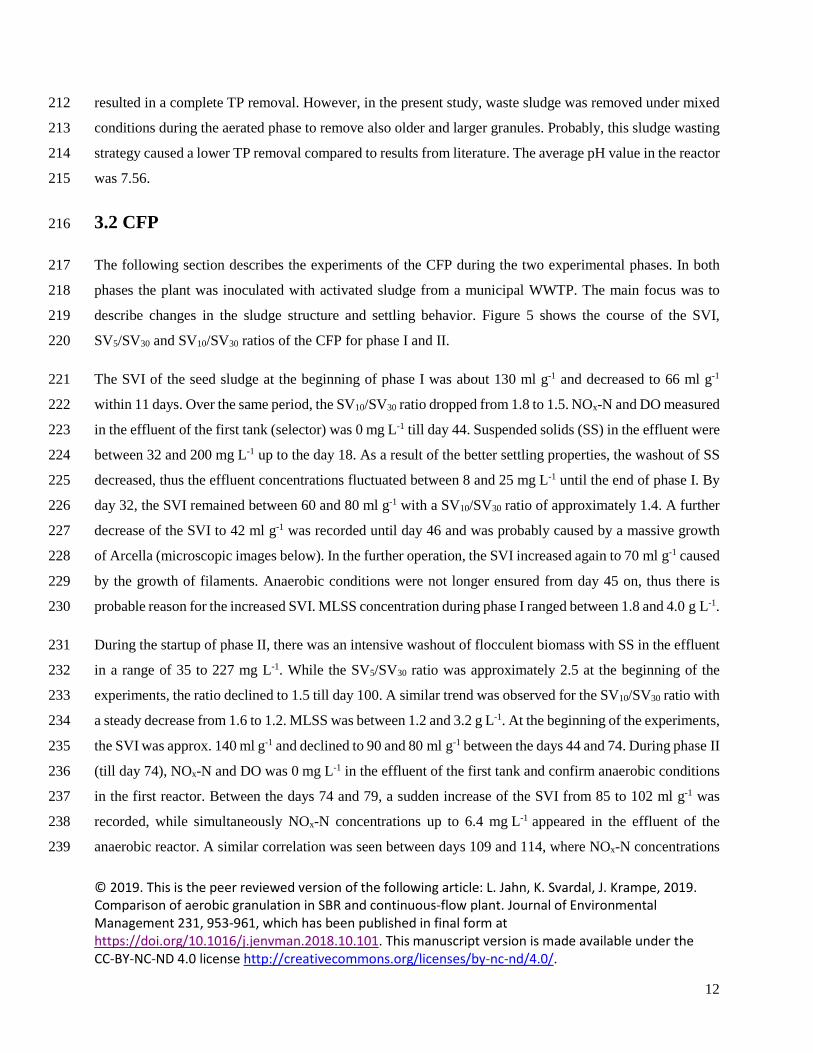
Figure 6 shows microscopic images of the sludge during phase I and II. Hereby, significant larger and more 247
compact structures of the biomass were observed during the startup. An increased growth of sessile ciliates, 248
especially vorticella-like organism, as it is often postulated for AGS in GSBR, did not appear during phase I 249
Page 14
© 2019. This is the peer reviewed version of the following article: L. Jahn, K. Svardal, J. Krampe, 2019. Comparison of aerobic granulation in SBR and continuous-flow plant. Journal of Environmental Management 231, 953-961, which has been published in final form at https://doi.org/10.1016/j.jenvman.2018.10.101. This manuscript version is made available under the CC-BY-NC-ND 4.0 license http://creativecommons.org/licenses/by-nc-nd/4.0/.
14
using synthetic wastewater. Unfortunately, there was a massive growth of arcella from day 40. The 250
occurrence of arcella is characteristic for good oxygen supply and high SRT. It can be assumed, that the 251
round shape of these organisms with sizes up to 200 µm probably caused an increased settling velocity. 252
Thus, a further decrease of the SVI to 42 ml g-1 could be linked to the appearance of these organisms. From 253
day 55 onwards, an increase in filamentous organisms was observed, leading to a rising SVI. The operation 254
was stopped at this point. During phase II, an increased occurrence of zoogloea was observed, which is often 255
postulated for AGS (Adav et al., 2009; Li et al., 2008; Sheng et al., 2010). The presence of fixed ciliates 256
was less pronounced compared to the granules from the SBR. Nevertheless, isolated colonies of vorticella 257
and also rotaria were observed on the surface of the granules. 258
259
Figure 6. Microscopic images of granules (first line: CFP – phase I , second line: CFP – phase II) 260
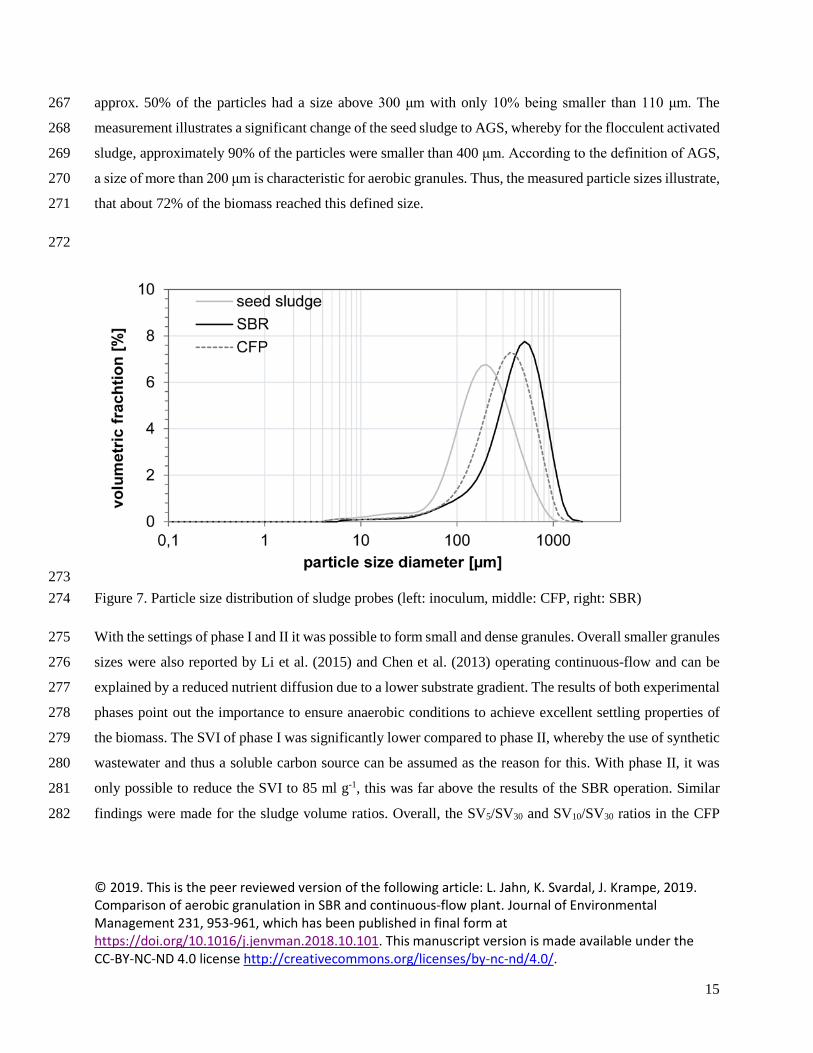
Microscopic images show that in both CFP phases there were large fractions of flocculent biomass in a 261
coexistence with granules, which appeared similar to the AGS of the SBR. To describe the ratio between 262
flocculent and AGS, particle size distributions were prepared for the sludge from the CFP (phase II), from 263
the SBR as well as from the flocculent seed sludge. Figure 7 shows the distribution for the analysed sludge 264
samples. Overall, larger structures were found for the AGS from the SBR. Here, about 50% of the particles 265
had a size of more than 450 μm and only 10% were smaller than 146 μm. For the AGS from the CFP, 266
Page 15
© 2019. This is the peer reviewed version of the following article: L. Jahn, K. Svardal, J. Krampe, 2019. Comparison of aerobic granulation in SBR and continuous-flow plant. Journal of Environmental Management 231, 953-961, which has been published in final form at https://doi.org/10.1016/j.jenvman.2018.10.101. This manuscript version is made available under the CC-BY-NC-ND 4.0 license http://creativecommons.org/licenses/by-nc-nd/4.0/.
15
approx. 50% of the particles had a size above 300 μm with only 10% being smaller than 110 μm. The 267
measurement illustrates a significant change of the seed sludge to AGS, whereby for the flocculent activated 268
sludge, approximately 90% of the particles were smaller than 400 μm. According to the definition of AGS, 269
a size of more than 200 μm is characteristic for aerobic granules. Thus, the measured particle sizes illustrate, 270
that about 72% of the biomass reached this defined size. 271
272
273 Figure 7. Particle size distribution of sludge probes (left: inoculum, middle: CFP, right: SBR) 274
With the settings of phase I and II it was possible to form small and dense granules. Overall smaller granules 275
sizes were also reported by Li et al. (2015) and Chen et al. (2013) operating continuous-flow and can be 276
explained by a reduced nutrient diffusion due to a lower substrate gradient. The results of both experimental 277
phases point out the importance to ensure anaerobic conditions to achieve excellent settling properties of 278
the biomass. The SVI of phase I was significantly lower compared to phase II, whereby the use of synthetic 279
wastewater and thus a soluble carbon source can be assumed as the reason for this. With phase II, it was 280
only possible to reduce the SVI to 85 ml g-1, this was far above the results of the SBR operation. Similar 281
findings were made for the sludge volume ratios. Overall, the SV5/SV30 and SV10/SV30 ratios in the CFP 282
Page 16
© 2019. This is the peer reviewed version of the following article: L. Jahn, K. Svardal, J. Krampe, 2019. Comparison of aerobic granulation in SBR and continuous-flow plant. Journal of Environmental Management 231, 953-961, which has been published in final form at https://doi.org/10.1016/j.jenvman.2018.10.101. This manuscript version is made available under the CC-BY-NC-ND 4.0 license http://creativecommons.org/licenses/by-nc-nd/4.0/.
16
were higher compared to the AGS cultivated in the reference SBR, where SV10/SV30 ratios between 1.05 283
and 1.1 were measured. 284
3.2.2 Removal performance 285
The anaerobic reactor is essential to provide growth conditions for substrate-storing organisms, which are 286
necessary to form stable granules. During anaerobic conditions, the supplied COD is taken up by these 287
organisms and stored as internal products. Some studies report that COD should be extensivley stored in 288
order to avoid an irregular growth during the aerated periods (Pronk et al., 2015a). Moreover, the 289
breakthrough of substrate into the aerobic reactor can lead to the development of filaments (van den Akker 290
et al., 2015). During phase I, the average COD effluent concentration of the anaerobic reactors was 291
47 mg L-1 and was related to a mean COD reduction of 76%. TP concentrations in the effluent were mostly 292
increased (up to 24 mg L-1) compared to the influent concentrations, which indicates that there were PAO 293
present in the sludge and responsible for a phosphate release. However, on individual days it was not 294
possible to ensure complete anaerobic conditions due to inefficient TN removal in the aerobic-anoxic 295
reactor, subsequently there was no phosphate release in the anaerobic reactor. 296
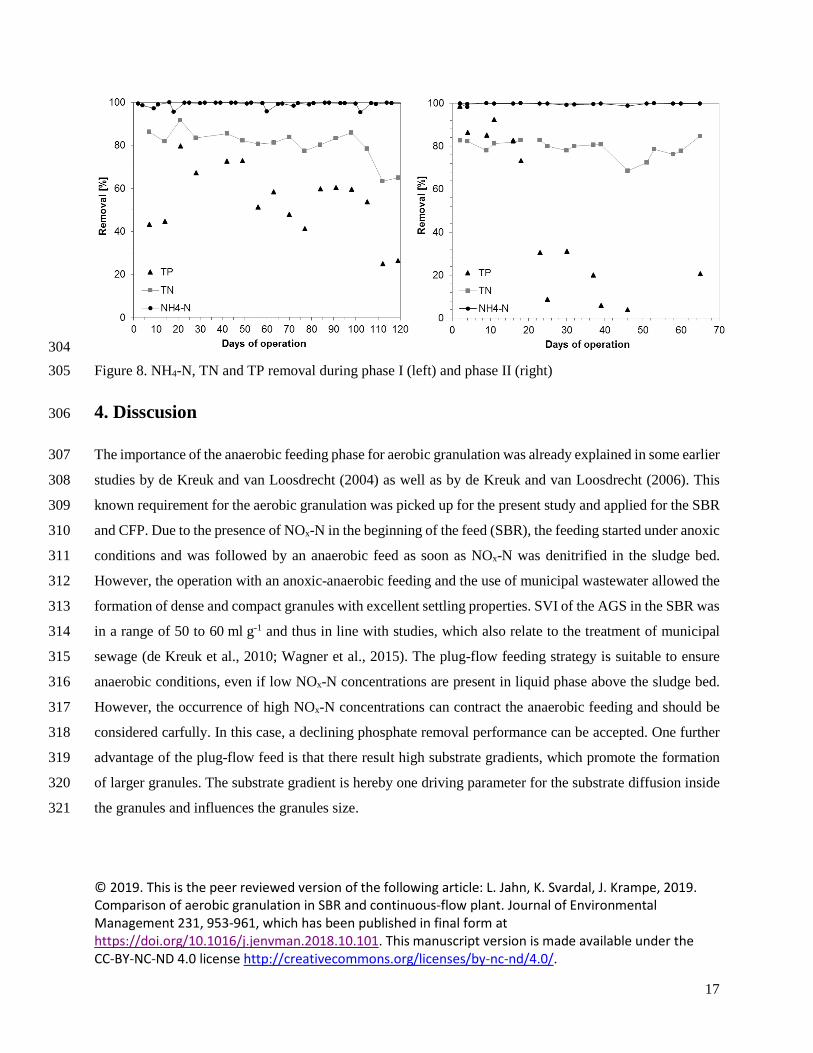
Figure 8 shows the NH4-N, TN and TP removal during the phases I and II. During phase I, COD was almost 297
completely eliminated with an average removal of 92.1%. Similar results were observed with phase II, while 298
the COD removal was between 87.1 and 97.8% and reached a mean COD removal of 95.3%. The average 299
NH4-N removal was 99.6% (phase I) and 99.1% (phase II). With a few exceptions, the TN removal reached 300
about 80%. TP removal during phase I declined within the startup. This observation can be explained by the 301
use of synthetic media as feed. Similar effects were reported in earlier studies from Wang et al. (2010), 302
where the dosage of glucose lead to an advanced GAO metabolism with a worsened TP removal. 303
Page 17
© 2019. This is the peer reviewed version of the following article: L. Jahn, K. Svardal, J. Krampe, 2019. Comparison of aerobic granulation in SBR and continuous-flow plant. Journal of Environmental Management 231, 953-961, which has been published in final form at https://doi.org/10.1016/j.jenvman.2018.10.101. This manuscript version is made available under the CC-BY-NC-ND 4.0 license http://creativecommons.org/licenses/by-nc-nd/4.0/.
17
304 Figure 8. NH4-N, TN and TP removal during phase I (left) and phase II (right) 305
4. Disscusion 306
The importance of the anaerobic feeding phase for aerobic granulation was already explained in some earlier 307
studies by de Kreuk and van Loosdrecht (2004) as well as by de Kreuk and van Loosdrecht (2006). This 308
known requirement for the aerobic granulation was picked up for the present study and applied for the SBR 309
and CFP. Due to the presence of NOx-N in the beginning of the feed (SBR), the feeding started under anoxic 310
conditions and was followed by an anaerobic feed as soon as NOx-N was denitrified in the sludge bed. 311
However, the operation with an anoxic-anaerobic feeding and the use of municipal wastewater allowed the 312
formation of dense and compact granules with excellent settling properties. SVI of the AGS in the SBR was 313
in a range of 50 to 60 ml g-1 and thus in line with studies, which also relate to the treatment of municipal 314
sewage (de Kreuk et al., 2010; Wagner et al., 2015). The plug-flow feeding strategy is suitable to ensure 315
anaerobic conditions, even if low NOx-N concentrations are present in liquid phase above the sludge bed. 316
However, the occurrence of high NOx-N concentrations can contract the anaerobic feeding and should be 317
considered carfully. In this case, a declining phosphate removal performance can be accepted. One further 318
advantage of the plug-flow feed is that there result high substrate gradients, which promote the formation 319
of larger granules. The substrate gradient is hereby one driving parameter for the substrate diffusion inside 320
the granules and influences the granules size. 321
Page 18
© 2019. This is the peer reviewed version of the following article: L. Jahn, K. Svardal, J. Krampe, 2019. Comparison of aerobic granulation in SBR and continuous-flow plant. Journal of Environmental Management 231, 953-961, which has been published in final form at https://doi.org/10.1016/j.jenvman.2018.10.101. This manuscript version is made available under the CC-BY-NC-ND 4.0 license http://creativecommons.org/licenses/by-nc-nd/4.0/.
18
For the startup of the CFP, activated sludge from a municipal WWTP was inoculated to the plant. The first 322
phase of the CFP is not considered in detail due to the massive growth arcella and a potential impact on the 323
SVI. Furthermore, phase I lasted only 65 d and was not long enough under stable operation. Beside 324
anaerobic conditions for aerobic granulation, the substrate gradient should be considered for the design and 325
setup of continuous-flow reactors too. In this study, the tube reactor of the anaerobic part of the CFP (phase 326
II) was one possibility to build up increased substrate gradients compared to mixed conditions. Low 327
substrate gradients on the surface of the biomass can limit the diffusion into the granules and thus the overall 328
granules size. In the course of the first weeks, the sludge structure and settling performance of the inoculated 329
seed sludges (CFP II) changed clearly to larger particles with a compact structure (particle size distribution, 330
microscopic images). According to the granular sludge definition, the measured particle size distribution 331
indicates the shift of the flocculent seed sludge towards larger granules, while only 28% of the particles had 332
a size less than 200 μm. SVI was successfully reduced to 85 ml g-1 during phase II (CFP). However, the 333
settling properties were not as good as like the AGS from the SBR. SV5/SV30 and SV10/SV30 ratio were 334
reduced only to about 1.5 and 1.2 and were clear higher than in the SBR. Since the settling velocity relates 335
to the size of a settling particle (Stokes Law), the overall smaller granules can be named as one reason for 336
the different settling properties. Moreover, a negative effect on the SVI was observed when no anaerobic 337
conditions were realized in the first reactor (selector), which confirms the fact that anaerobic conditions are 338
necessary to form stable granules with excellent settling performance. 339
Furthermore, the higher SVI and SV ratios were probably a result of an overall larger fraction of flocs, 340
which was additionally caused by a lower selection pressure in the clarifier. The sludge volume feed qSV is 341
a parameter to characterize the hydraulic load to the clarifier. For the experiments, qSV was only about 342
51.3 L m-2 h-1 and the sufarce loading qA was calculated with 0.23 m h-1. It can be assumed, that the lower 343
qA leads to a higher retention of floccuelent biomass. From the results it is clear, that there is a further 344
research demand, how the sludge separation can be optimised and adjusted to the granulation process. A 345
possible approach would be the use of hydrocyclones, however this could not be tested in the presented 346
study. Another reason for smaller granules and higher SVI can be the shear forces caused by the use of 347
stirrers in the anaerobic as well as in the aerobic reactor. For example, Rocktäschel et al. (2013) reported 348
smaller granules in a SBR, in which the feed was followed by an anaerobic mixing compared to a reactor 349
with plug-flow feed without stirrers. Nor Anuar et al. (2007) examined in a study the effect of mechanical 350
Page 19
© 2019. This is the peer reviewed version of the following article: L. Jahn, K. Svardal, J. Krampe, 2019. Comparison of aerobic granulation in SBR and continuous-flow plant. Journal of Environmental Management 231, 953-961, which has been published in final form at https://doi.org/10.1016/j.jenvman.2018.10.101. This manuscript version is made available under the CC-BY-NC-ND 4.0 license http://creativecommons.org/licenses/by-nc-nd/4.0/.
19
mixers on the settleability of AGS and found an insignificant effect of the shear stress, however there was 351
a slightly decreased settling velocity with an increased stirrer speed. The results demonstrate, that the 352
turbulence and shear stress caused by mixing systems can have an influence on the settling properties of 353
AGS, also when the effect of these advices on the sludge structure is not clearly described at the moment. 354
Similarly, a further negative effect can be seen in the return sludge pump (peristaltic pump), which was used 355
to recycle the biomass from the secondary clarifier to the first reactor. Since there is no need for stirrers or 356
pumps in full scale SBR like in Nereda plants, the effects on the structure is up to now less investigated. 357
However, in the CFP it is essential to have mixed conditions in the tanks, so that the use of technical devices 358
such as pumps and stirrers for AGS should be given careful consideration. Further research work is needed 359
to optimize the continuous-flow systems in order to achieve similar settling properties compared to the 360
granules from GSBR. 361
5. Conclusion 362
With the experimental setup and operation of the CFP, it was possible to achieve changes of flocculent 363
activated sludge structure towards a compact and dense biomass. With the use of municipal sewage and an 364
anaerobic plug-flow, the SVI of a flocculent activated sludge declined up to 85 ml g-1, while for 72% of the 365
particles a size of 200 µm was realised. The use of a synthetic wastewater and completely mixed conditions 366
lead to a SVI of 42 ml g-1, which was probably caused by the soluble carbon source and a growth of Arcella. 367
A direct link was seen between NOx-N in the effluent of the first reactor and an increase of the SVI. The 368
results indicate the importance of anaerobic conditions for good settling properties. Particular attention 369
should be paid to the implementation of a continuous sludge separation and the use of technical devices 370
such as pumps and stirrers. Moreover, high substrate gradients should be considered in order to enrich large 371
granules. There is a further research demand for the application of AGS in CFP. 372
ACKNOWLEDGEMENTS 373
This work was carried out as part of the research project “KontiGran” which was fincanced by the Austrian 374
Federal Ministry of Sustainability and Tourism and adminsitrated by Communal Credit Public Consulting 375
(KPC). 376
Page 20
© 2019. This is the peer reviewed version of the following article: L. Jahn, K. Svardal, J. Krampe, 2019. Comparison of aerobic granulation in SBR and continuous-flow plant. Journal of Environmental Management 231, 953-961, which has been published in final form at https://doi.org/10.1016/j.jenvman.2018.10.101. This manuscript version is made available under the CC-BY-NC-ND 4.0 license http://creativecommons.org/licenses/by-nc-nd/4.0/.
20
References 377
Adav, S.S., Lee, D.J., Lai, J.Y., 2009. Functional consortium from aerobic granules under high organic loading 378 rates. Bioresour Technol 100, 3465-3470. 379
Bassin, J.P., Kleerebezem, R., Dezotti, M., van Loosdrecht, M.C., 2012. Simultaneous nitrogen and 380 phosphate removal in aerobic granular sludge reactors operated at different temperatures. Water Res 46, 381 3805-3816. 382
Chen, X., Yuan, L., Lu, W., Li, Y., Liu, P., Nie, K., 2013. Cultivation of aerobic granular sludge in a 383 conventional, continuous flow, completely mixed activated sludge system. Frontiers of Environmental 384 Science & Engineering 9, 324-333. 385
Corsino, S.F., Campo, R., Di Bella, G., Torregrossa, M., Viviani, G., 2016. Study of aerobic granular sludge 386 stability in a continuous-flow membrane bioreactor. Bioresour Technol 200, 1055-1059. 387
de Kreuk, M.K., Kishida, N., Tsuneda, S., Loosdrecht, M.C.M., 2010. Behavior of polymeric substrates in an 388 aerobic granular sludge system. Water Res 44, 5929-5938. 389
de Kreuk, M.K., Kishida, N., van Loosdrecht, M.C.M., 2007. Aerobic granular sludge – state of the art. Water 390 Science & Technology 55, 75. 391
de Kreuk, M.K., van Loosdrecht, M.C.M., 2004. Selection of slow growing organisms as a means for 392 improving aerobic granular sludge stability. Water Sci Technol 49, 9-17. 393
de Kreuk, M.K., van Loosdrecht, M.C.M., 2006. Formation of aerobic granules with domestic sewage. J 394 Environ Eng 132, 694-697. 395
Giesen, A., Thompson, A., 2013. Aerobic granular biomass for cost-effective, energy efficient and 396 sustainable wastewater treatment 7th European Waste Water Management Conference. 397
Li, A.J., Yang, S.F., Li, X.Y., Gu, J.D., 2008. Microbial population dynamics during aerobic sludge granulation 398 at different organic loading rates. Water Res 42, 3552-3560. 399
Li, D., Lv, Y., Zeng, H., Zhang, J., 2016. Enhanced biological phosphorus removal using granules in 400 continuous-flow reactor. Chemical Engineering Journal 298, 107-116. 401
Li, J., Cai, A., Ding, L., Sellamuthu, B., Perreault, J., 2015. Aerobic sludge granulation in a Reverse Flow 402 Baffled Reactor (RFBR) operated in continuous-flow mode for wastewater treatment. Separation and 403 Purification Technology 149, 437-444. 404
Liu, H., Li, Y., Yang, C., Pu, W., He, L., Bo, F., 2012. Stable aerobic granules in continuous-flow bioreactor 405 with self-forming dynamic membrane. Bioresour Technol 121, 111-118. 406
Page 21
© 2019. This is the peer reviewed version of the following article: L. Jahn, K. Svardal, J. Krampe, 2019. Comparison of aerobic granulation in SBR and continuous-flow plant. Journal of Environmental Management 231, 953-961, which has been published in final form at https://doi.org/10.1016/j.jenvman.2018.10.101. This manuscript version is made available under the CC-BY-NC-ND 4.0 license http://creativecommons.org/licenses/by-nc-nd/4.0/.
21
Niermans, R., Giesen, A., Loosdrecht, M.v., Buin, B.d., 2009. Full-scale Experiences with Aerobic Granular 407 Biomass Technology for Treatment of Urban and Industrial Wastewater WEFTEC 2014: Session 202 408 through Session 209. 409
Nor Anuar, A., Ujang, Z., van Loosdrecht, M.C., de Kreuk, M.K., 2007. Settling behaviour of aerobic granular 410 sludge. Water Sci Technol 56, 55-63. 411
Pronk, M., Abbas, B., Al-zuhairy, S.H.K., Kraan, R., Kleerebezem, R., van Loosdrecht, M., 2015a. Effect and 412 behaviour of different substrates in relation to the formation of aerobic granular sludge. Appl Microbiol 413 Biotechnol 99, 5257-5268. 414
Pronk, M., de Kreuk, M.K., de Bruin, B., Kamminga, P., Kleerebezem, R., van Loosdrecht, M.C., 2015b. Full 415 scale performance of the aerobic granular sludge process for sewage treatment. Water Res 84, 207-217. 416
Qin, L., Liu, Y., Tay, J.H., 2004. Effect of settling time on aerobic granulation in sequencing batch reactor. 417 Biochem Eng J 21, 47-52. 418
Rocktäschel, T., Klarmann, C., Helmreich, B., Ochoa, J., Boisson, P., Sorensen, K.H., Horn, H., 2013. 419 Comparison of two different anaerobic feeding strategies to establish a stable aerobic granulated sludge 420 bed. Water Res 47, 6423-6431. 421
Sheng, G.-p., Li, A.-j., Li, X.-y., Yu, H.-q., 2010. Effects of seed sludge properties and selective biomass 422 discharge on aerobic sludge granulation. Chemical Engineering Journal 160, 108-114. 423
van den Akker, B., Reid, K., Middlemiss, K., Krampe, J., 2015. Evaluation of granular sludge for secondary 424 treatment of saline municipal sewage. J Environ Manage 157, 139-145. 425
Wagner, J., Weissbrodt, D.G., Manguin, V., da Costa, R.H., Morgenroth, E., Derlon, N., 2015. Effect of 426 particulate organic substrate on aerobic granulation and operating conditions of sequencing batch 427 reactors. Water Res 85, 158-166. 428
Wang, Y., Jiang, F., Zhang, Z., Xing, M., Lu, Z., Wu, M., Yang, J., Peng, Y., 2010. The long-term effect of 429 carbon source on the competition between polyphosphorus accumulating organisms and glycogen 430 accumulating organism in a continuous plug-flow anaerobic/aerobic (A/O) process. Bioresour Technol 101, 431 98-104. 432
Winkler, M.K., Bassin, J.P., Kleerebezem, R., de Bruin, L.M., van den Brand, T.P., van Loosdrecht, M.C., 433 2011. Selective sludge removal in a segregated aerobic granular biomass system as a strategy to control 434 PAO-GAO competition at high temperatures. Water Res 45, 3291-3299. 435
Zou, J., Tao, Y., Li, J., Wu, S., Ni, Y., 2018. Cultivating aerobic granular sludge in a developed continuous-436 flow reactor with two-zone sedimentation tank treating real and low-strength wastewater. Bioresource 437 Technology 247, 776-783. 438
439


![Aerobic sludge granulation facilitated by activated carbon ...hub.hku.hk/bitstream/10722/202687/1/Content.pdf · (anammox) or other similar processes [3,4]. Partial nitrification](https://static.documents.pub/doc/80x56/5e39f269c9f5a25fcb5be0fc/aerobic-sludge-granulation-facilitated-by-activated-carbon-hubhkuhkbitstream107222026871.jpg)


