East Tennessee State University Digital Commons @ East Tennessee State University Electronic eses and Dissertations Student Works 8-2009 Comparison of Artificial Flavors in Commercial Products and Actual Natural Flavor via Gas Chromatography Mass Spectroscopy Data. Randi Jasmine Sluss East Tennessee State University Follow this and additional works at: hps://dc.etsu.edu/etd Part of the Food Chemistry Commons is esis - Open Access is brought to you for free and open access by the Student Works at Digital Commons @ East Tennessee State University. It has been accepted for inclusion in Electronic eses and Dissertations by an authorized administrator of Digital Commons @ East Tennessee State University. For more information, please contact [email protected]. Recommended Citation Sluss, Randi Jasmine, "Comparison of Artificial Flavors in Commercial Products and Actual Natural Flavor via Gas Chromatography Mass Spectroscopy Data." (2009). Electronic eses and Dissertations. Paper 1804. hps://dc.etsu.edu/etd/1804
Transcript
East Tennessee State UniversityDigital Commons @ East
Tennessee State University
Electronic Theses and Dissertations Student Works
8-2009
Comparison of Artificial Flavors in CommercialProducts and Actual Natural Flavor via GasChromatography Mass Spectroscopy Data.Randi Jasmine SlussEast Tennessee State University
Follow this and additional works at: https://dc.etsu.edu/etd
Part of the Food Chemistry Commons
This Thesis - Open Access is brought to you for free and open access by the Student Works at Digital Commons @ East Tennessee State University. Ithas been accepted for inclusion in Electronic Theses and Dissertations by an authorized administrator of Digital Commons @ East Tennessee StateUniversity. For more information, please contact [email protected].
Recommended CitationSluss, Randi Jasmine, "Comparison of Artificial Flavors in Commercial Products and Actual Natural Flavor via Gas ChromatographyMass Spectroscopy Data." (2009). Electronic Theses and Dissertations. Paper 1804. https://dc.etsu.edu/etd/1804
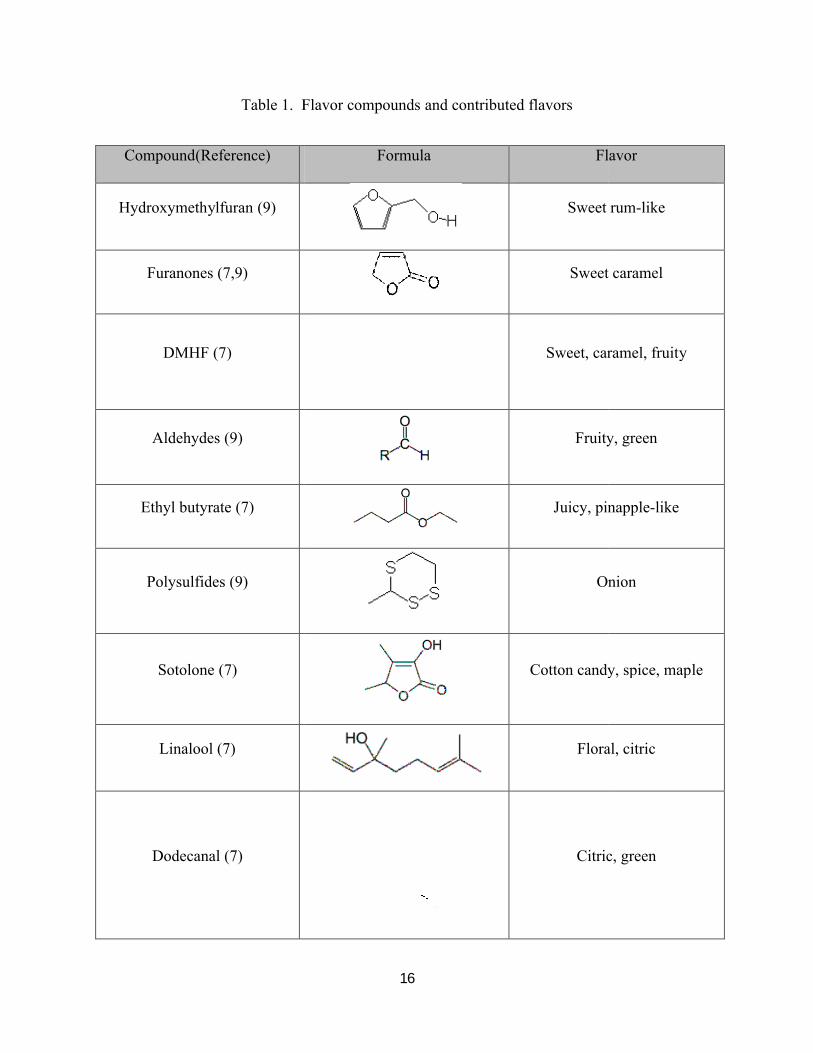
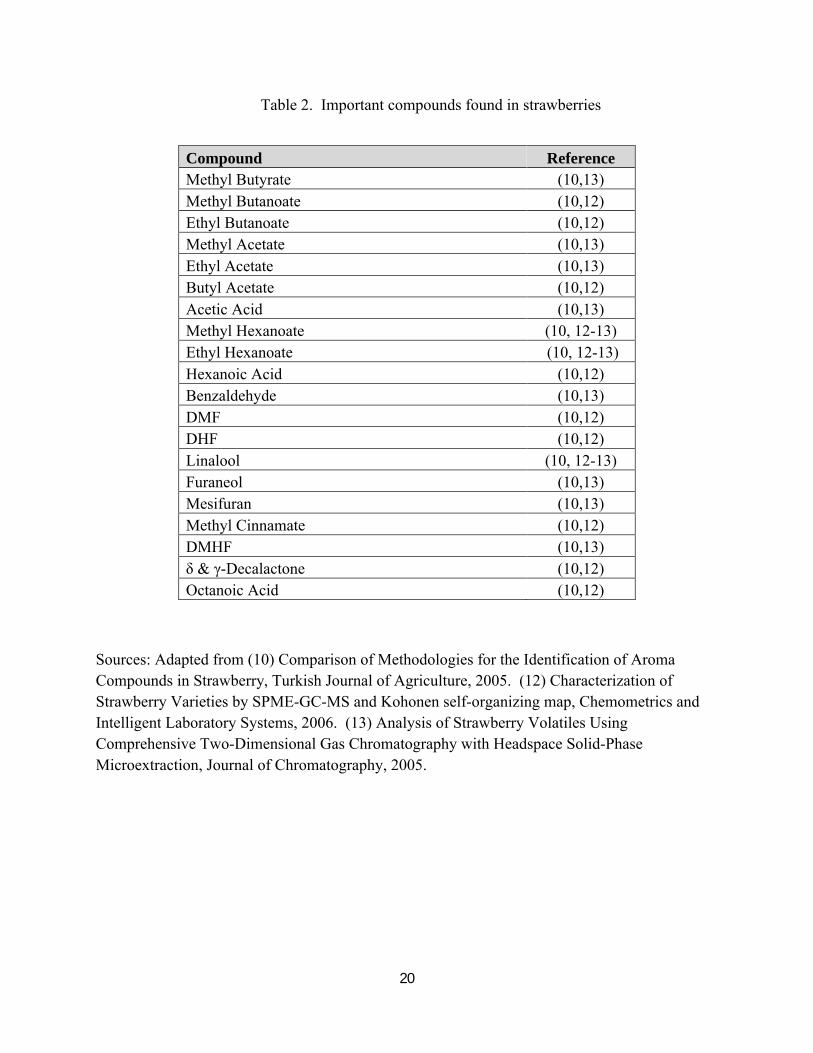
Sources: Adapted from (10) Comparison of Methodologies for the Identification of Aroma Compounds in Strawberry, Turkish Journal of Agriculture, 2005. (12) Characterization of Strawberry Varieties by SPME-GC-MS and Kohonen self-organizing map, Chemometrics and Intelligent Laboratory Systems, 2006. (13) Analysis of Strawberry Volatiles Using Comprehensive Two-Dimensional Gas Chromatography with Headspace Solid-Phase Microextraction, Journal of Chromatography, 2005.
21
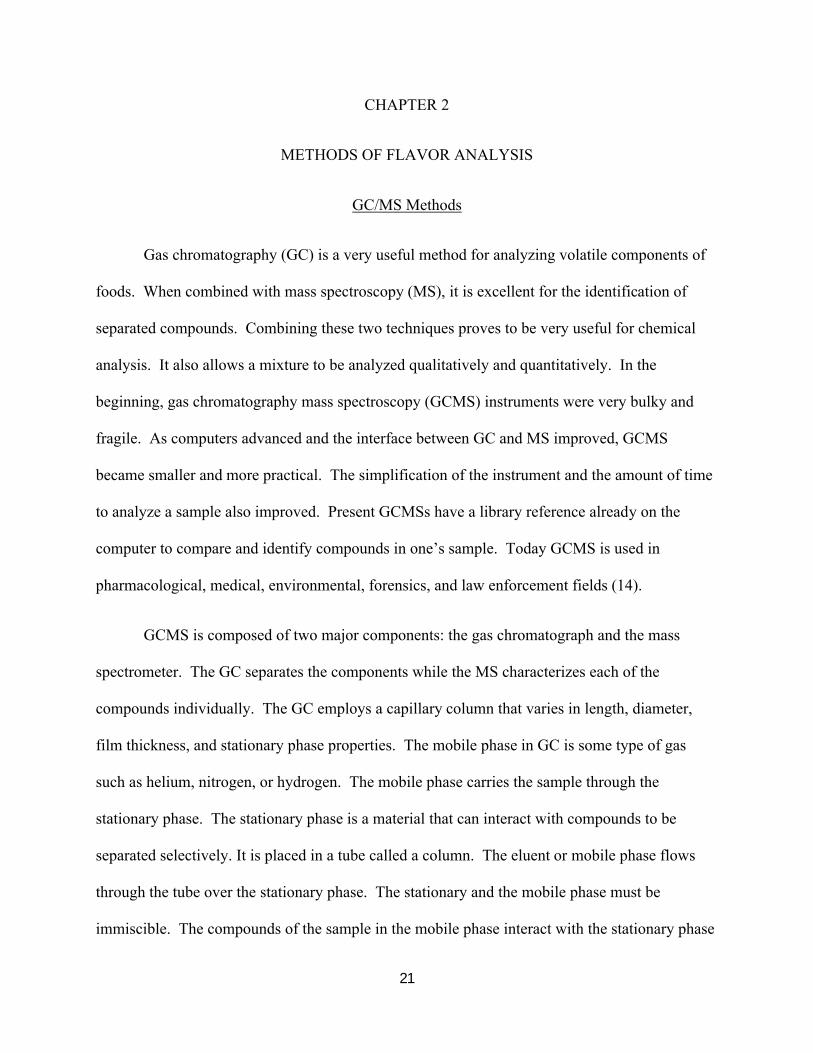
CHAPTER 2
METHODS OF FLAVOR ANALYSIS
GC/MS Methods
Gas chromatography (GC) is a very useful method for analyzing volatile components of
foods. When combined with mass spectroscopy (MS), it is excellent for the identification of
separated compounds. Combining these two techniques proves to be very useful for chemical
analysis. It also allows a mixture to be analyzed qualitatively and quantitatively. In the
beginning, gas chromatography mass spectroscopy (GCMS) instruments were very bulky and
fragile. As computers advanced and the interface between GC and MS improved, GCMS
became smaller and more practical. The simplification of the instrument and the amount of time
to analyze a sample also improved. Present GCMSs have a library reference already on the
computer to compare and identify compounds in one’s sample. Today GCMS is used in
pharmacological, medical, environmental, forensics, and law enforcement fields (14).
GCMS is composed of two major components: the gas chromatograph and the mass
spectrometer. The GC separates the components while the MS characterizes each of the
compounds individually. The GC employs a capillary column that varies in length, diameter,
film thickness, and stationary phase properties. The mobile phase in GC is some type of gas
such as helium, nitrogen, or hydrogen. The mobile phase carries the sample through the
stationary phase. The stationary phase is a material that can interact with compounds to be
separated selectively. It is placed in a tube called a column. The eluent or mobile phase flows
through the tube over the stationary phase. The stationary and the mobile phase must be
immiscible. The compounds of the sample in the mobile phase interact with the stationary phase
22
and each compound interacts at a different rate. The compounds that interact fast with the
stationary phase elute or exit the column earliest. Usually, the compounds with lower molecular
weights exit first and heavier ones last. Different stationary phases interact with the compounds
differently according to such factors as polarity, chirality, and others. Also, changing the
physical properties (i.e. temperature or pressure) affects how the compounds interact with the
stationary phase. Temperature can affect how fast compounds elute the column. GCMS
instruments house the column in an oven in which you can gradually increase the temperature
(14). Figure 1 is a simplified schematic diagram of a GCMS.
Figure 1. GCMS a simple schematic of a gas chromatograph mass spectrometer. Helium gas is the mobile phase. The injection is a manual injection.
23
Flavor Compounds Extraction Methods
There are many extraction methods available to extract flavors from fruits. Fruits have
trace amounts of flavor constituents. The flavor components are found among the proteins,
water, salts, and carbohydrates. For these reasons, a specific extraction technique is needed for
the particular type of fruit being analyzed. There are many different methods available for flavor
1-butanol, and butyl isocalerate. Analysis of variance (ANOVA) statistical calculation and
cross-validation were used to confirm the results.
GCMS was used by Kaskoniene et al. (21) to study the volatile compounds in different
varieties of honey. SPME was used to collect the volatiles. Honey has a very complex
composition of volatile compounds. They found that about 100 different compounds could be
detected from the different varieties of honey. Alcohols, ketones, aldehydes, acids, terpenes,
hydrocardons, benzene, and furan compounds were all found in honey. However, only
benzaldehyde and benzenacetaldehyde were found in all 15 varieties. ANOVA statistical
calculation and standard deviations were also applied to compare similarity of the results.
31
SPME and GCMS were used by Riu-Aumatell et al. (22) to analyze volatile compounds
in different fruit juices. A flame ionization dectector (FID) was also used to complete
semiquantitative measurements. Three different types of fruit juices analyzed are apricot, pear,
and peach juice. Apricot juice contained compounds such as ethyl, acetate, and hexyl esters.
Terpeniods, alcohols, and aldehydes were also founds in apricot juices. Hexyl isovalerate,
cinnamaldehyde, α-terpinolene, and α-farnesene were detected in all of the apricot juice samples.
Peach juices contained esters, lactones, terpenoids, and norisoprenoids. However, γ-decalactone
was found in all peach juice samples. Pear juices also contained methyl, ethyl, and acetate
esters, along with alcohols and aldehydes. Hexyl acetate and ethyl 2, 4 (E,Z)-decadienoate were
found in all pear juice samples.
Yang et al. (23) analyzed grape berries by SPME method and GCMS. The grape berries
also had volatile compounds similar to strawberries such as ethyl acetate, ethyl butanoate,
linalool, ethyl benzoate, and other esters. The preparation methods, sample extraction, and
GCMS parameters are also similar to the studies presented by Kafkas et al. and De Boishebert et
al. Yang et al. used different statistical methods from the research by De Boishebert et al. and
Williams et al. They used a one-way ANOVA analysis to compare the volatile concentrations in
different varieties of grapes. Principal component analysis (PCA) was also completed to
compare the clustering in formations of different grape genotypes. Covariance matrixes were
also used to compare differences in the grape varieties. About 60 different volatiles were found
in the grape germplasm including esters, alcohols, aldehydes, carbonyl compounds, and
terpenoids. The main flavor compounds varied from varieties of grape berries.
GC analysis of simultaneous micro steam distillation/solvent extraction for flavor
compounds of cinnamon was studied by Jayatilaka et al. (24). Some of the main component
32
compounds found in cinnamon were linalool, cinnamaldehyde, 3-phenylpropanal, cinnamyl
alcohol, eugenol, benzyl benzoate, α-humulene, calamenene, and coumarin. This study focused
mainly on identifying the compounds present in cinnamon.
Zabetakis et al. (25) studied the biosynthesis of strawberry flavor. They stated that sugar
is the main soluble compound found in strawberries. Sugars are precursors for flavor
compounds and an energy source for the growth of the strawberry. Different types of sugars
such as sucrose, glucose, and fructose are 99 % of the total sugar found in strawberries.
Zabetakis et al. discovered as a strawberry ripens the levels of sugars increase. This increase in
sugars help develops more furanones and other metabolites. Acids can affect the formation of
strawberry flavor. Acids affect the formation of off-flavors that provide some individuality to
strawberry flavor.
Bood et al. (26) also focused on the biosynthesis of strawberry flavor and literature
reviews of present research in their study. This study mentions sugars, esters, and furanones.
Sugars help to balance the amount of acids during the ripening stages. They also tend to increase
as ripening occurs, which can account for the sweet pleasant taste. Esters are one of the main
groups of flavor compounds in strawberries. Bood and co-workers state some of the main esters
identified by GCMS are methyl and ethyl butanoates, ethyl hexanoate, hexyl acetate, and trans-2-
hexenyl acetate. DMHF is a furanone found in strawberry flavor. It is only in trace amounts but
has a large impact on the flavor. It can be found in four different forms such as DMHF-glucose,
mesifuran, DMHF-malonyl-glucoside, and aglycone DMHF.
Modise (27) studied the effect of freezing and thawing on the flavor of strawberries.
Various strawberries were frozen and allowed to thaw for an allotted amount of time. These
samples were analyzed using headspace microextraction. The results show flavor compounds
33
alter significantly after freezing and thawing. Levels of volatile compounds such as
acetaldehyde, hexanal, ethyl acetate, methyl acetate, methyl hexanoate, and hexyl acetate are
increased.
Pfannkoch et al. (28) used a technique that is not commonly employed. They used stir
bar sorptive extraction (SBSE) to extract flavor and fragrance compounds. They aim to
eliminate problems from matrix effects. A Gerstel Twister was used to extract volatile
compounds. This method was a very economical and fast technique. In whiskey analysis, they
eliminated interference from ethanol, surfactants, and emulsifiers. This method proved to be
very useful in extracting volatile compounds.
Hamilton-Kemp et al. (29) focused their studies on identifying compounds found in
strawberry flowers. Strawberry flowers are the leaves attached to the top of the strawberry. This
study employed GCMS to extract the volatile compounds. They employed headspace extraction
to identify volatile compounds. Volatile compounds identified include, but are not limited to,
limonene, benzaldehyde, methyl salicylate, and hexyl acetate.
Wilkes et al. (30) provides different sample preparation techniques for the analysis of
foods. This study provides many sample preparation methods for different analysis techniques
such as direct injection GC, HPLC, headspace GC, distillation GC, and SPME GC analysis. This
study provides many different methods and the most suitable analysis methods for analyzing
different foods.
In conclusion, there are many methods available to extract flavor compounds. Past
research has shown many different extraction and analysis methods. This research focuses on
comparison of flavor compounds between real natural flavor and artificially flavored commercial
products. This proposed research will also focus on scatter plot comparison, correlation
34
coefficients, and Mann-Whitney U Test statistics. One needs to be knowledgeable as to what
type of compound to be extracted, whether it has low or high volatility. Once all the variables
are determined, one can choose the method most suitable for the flavor sample to be extracted.
While solvent extraction and simultaneous steam distillation/extraction are the most commonly
used methods, molecular distillation, dynamic headspace sampling, and static headspace
sampling are good for extracting volatiles. Strawberries have many volatiles; the best method
available is dynamic headspace sampling, static headspace sampling, or solid phase micro-
extraction.
Proposed Research
In Chapter 1, the origins and facts about food and food additives were discussed. Food
additives, mainly flavors, have advanced throughout history. Scientists began to create flavors in
labs and discovered just how each compound contributes to the flavor. Strawberries have over
100 compounds that contribute to their flavor. Commercial products can also include natural or
artificial strawberry flavor. The literature mentions several different methods of extraction
techniques. A simpler flavor extraction method is needed. The cost and availability of the
materials should be within one’s resources. Currently, environmental concerns are also to be
considered. The “greenness” of the analytical procedures and material also become paramount.
Accuracy, precision, relevance to the desired analyte, and the reproducibility of analysis are the
analytical merits one used to assess the usefulness of the method. This research project seeks to
accomplish the following objectives:
1. To establish an economical extraction method.
2. Propose GCMS parameters that best suit the detection of volatile constituents in
strawberries.
35
3. Compare artificial flavored commercial products to real natural strawberry flavor.
4. Apply statistical methodologies for the comparative studies of the natural
strawberry flavor and artificial flavored commercial products.
5. Conclude how similar or dissimilar the natural strawberry flavor and artificial
flavored commercial products are and their value in purchase.
36
CHAPTER 3
EXPERIMENTAL PROCEDURES
Chapter 3 presents all the reagents, samples, standard solutions, instrumentation, and data
analysis used in this project. The preparation of the samples is explained in detail along with the
experimental procedure carried out to analyze them. The parameters of the GCMS along with
the statistical methodologies are explained.
Reagents:
The following reagents are all ACS certified and obtained from Fisher Scientific in
Fairlawn, NJ.
1. Methanol
2. DMHF
3. Ethyl butyrate
4. Ethyl acetate
5. Furfural
Samples Obtained:
1. Fresh California Strawberries distributed by Andrew and Williamson Fresh Produce
in San Diego, CA and bought at Kroger in Johnson City, TN.
2. Driscoll’s Strawberries distributed by Driscoll Strawberry Associates in Dover, FL
and bought at Earth Fare Grocery in Johnson City, TN.
3. Strawberry Fraises distributed by Classy Berry Farms in Plant City, FL and bought at
Food City in Johnson City, TN.
4. Strawberry Gatorade® purchased from Kroger in Johnson City, TN.
37
5. Strawberry Milkshake purchased from Burger King® in Johnson City, TN.
6. Strawberry flavored Aquacal® purchased from Food City in Johnson City, TN.
7. JELL-O® Gelatin Dessert purchased from Kroger in Johnson City, TN.
8. Cool SpashersTM Strawberry Drink Mix purchased from Kroger in Johnson City, TN.
9. Hi-C® Strawberry Drink Box purchased from Food City in Johnson City, TN.
Preparations of Standard Solutions
The following standard solutions were made:
1. DMHF standard solution: 1.0 grams of DMHF was diluted in a 10-mL volumetric flask
with methanol. Then 50 μL of this solution was diluted further in 10-mL volumetric
flask with methanol.
2. Ethyl Butyrate standard solution: 50 μL of ethyl butyrate was diluted using a 10-mL
volumetric flask with methanol.
3. Ethyl Acetate standard solution: 50 μL of ethyl acetate was diluted using 10-mL
volumetric flask with methanol.
4. Furfural standard solution: 50 μL of furfural was diluted using a 10-mL volumetric flask
with methanol.
5. A mixture of the standards was prepared by adding 20 μL of each sample and diluted in a
10-mL volumetric flask with methanol.
6. Each of the standard solutions was prepared and run in the GCMS individually before
running them as a mixture of four standards.
38
Preparation of Natural Strawberry Samples
The available solvents for extraction were hexane, methanol, and acetone. Acetone and
hexane are non-polar and strawberries do not readily dissolve in either. The volatile compounds
found in strawberries are often polar, which dissolve better in methanol. The extraction of
strawberry flavor was carried out as follows:
A few strawberries from each sample (California, Discroll’s, and Fraises) were cleaned of
all contaminants.
Any ruined or damaged sections of the strawberry were cut off.
The strawberries were then strained by a fine mesh strainer and put into separate
containers according to the sample.
About 1.0 g of each strained strawberry sample was weighed out accurately and put into
separate sample beakers.
10 mL of methanol was added to each beaker and stirred on a magnetic stirrer for 30 min.
This mixture was then gravity filtered three times to insure the absence of particles in the
solution.
Preparation of Commercial Product Samples
The preparation of the artificial strawberry flavored commercial products needs to be
similar to that of the natural strawberry samples. This is done to allow valid comparative study.
The commercial products are not of the same composition; therefore, some modification of the
procedure is needed.
39
The Burger King® milkshake was prepared by weighing out 1.116 g of the milkshake
accurately on a balance. This was added to 10 mL of methanol. The mixture was stirred on a
magnetic stirrer for 15 min then gravity filtered three times to ensure the solution was completely
homogeneous and did not contain any small particles that can cause a problem to the GCMS.
The solution was then diluted to 20 mL of methanol and ran on the GCMS two more times.
The Gatorade® sample was prepared by adding 0.52 grams of Gatorade® to 20 mL of
methanol. This mixture was stirred on a magnetic for 15 min and then gravity filtered three
times.
For the JELLO® sample 0.52 g of gelatin powder was added to 20 mL of methanol and
stirred for 15 min on a magnetic stirrer. This solution was gravity filtered three times to ensure
no particulates were in the solution.
Aquacal® sample was prepared by adding 1.06 g of flavored water to 20 mL of methanol
and stirred for 15 min on a magnetic stirrer. This solution was gravity filtered three times to
ensure no particulates were in the solution.
The Cool SplashersTM drink mix was prepared by adding 20 mL of methanol to 0.48 g of
the drink mix. This mixture was stirred on a magnetic for 15 min and then gravity filtered three
times.
The Hi-C® sample was prepared by adding 2.21 g of Hi-C® to 20 mL of methanol. This
mixture was stirred on a magnetic for 15 min and then gravity filtered three times. All samples
had a final volume of 20 mL.
40
Instrumentation
The analyses of commercial products and volatiles of strawberries were conducted on a
Hewlett Packard A model 5890 Series II Gas Chromatograph equipped with a Series 5971 Mass
Selective Detector. The column was a HP5MS with the dimensions of 30.0 m x 0.25 mm, and
0.25 μm film thickness with the temperature tolerance of up to 350 oC. The polar stationary
phase is made up of 5 % phenyl and 95 % dimethyl polysiloxane. The exact parameters were an
important function to the analysis of strawberry flavor. The majority of the compounds of
interest are volatile. Volatile compounds have low boiling points. If the initial temperature is
too high and the temperature ramp is too high/fast, the volatile compounds will be lost in the
spectrum. The MS chromatographs would be very cluttered with adjacent unresolved
compounds. The molecular weight peaks were hard to distinguish with so many different
compounds. The retention times and the standard solutions chromatographs were the main
source of identifying the eluted compounds. Table 3 states the parameters of the GC. Table 4
provides the parameters for the MS.
Each of the standards was chromatographed on the GCMS individually before
analyzed as a mixture of the four standards. The chromatograph with the four standards was
used to identify some compound peaks in the samples. All of the natural strawberry samples and
the artificially flavored commercial products samples to be analyzed were injected in the GCMS
individually. The amount of sample that was injected in the GCMS was 1 μL. All the samples
were run in triplicates.
41
Table 3. HP 5890 GC parameters
Oven
Initial Temperature: 40 oC hold 10 min
Ramp 1: 9 oC/min to 100 oC
Ramp 2: 12oC/min to 180 oC
Run Time: 25.33 min
INLET
Mode: split
Inlet Temperature: 250 oC
Pressure: 21 kPa
Sample Size: 0.1 μL
CAPILLARY COLUMN
Column Length: 30.0 m
Column Diameter: 0.25 mm
Column Film Thickness: 0.25 μm
Presure: 21 kPa
Carrier Gass: Helium
Flow Rate: 1.0 mL/min
Stationary Phase: 5 % phenyl and
95% dimethyl polysiloxane
42
Table 4. HP 5971 Mass Selective Detector parameters
INTERFACE
Type: Capillary Direct Interface
Temperature: 250 oC
TUNE: Atune.u
DATA ACQUISTION
Mode: TIC scan mode
Mass range: Low Mass: 50 amu
High Mass: 550 amu
SOLVENT DELAY: 2 min
MS ZONES
MS Quadrupole Temp: 150 oC, max 200 oC
MS Source: 250 oC, max 325 oC
43
Data Analysis
All the samples including both the natural strawberry flavor samples and the artificially
flavored commercial products were analyzed on the GCMS. Each sample was injected in
triplicate. The retention times collected from the chromatographs of each sample were then
edited using Microsoft® Office Excel 2007 Software. The retention times were input in Excel in
individual columns per sample. The standard deviation and relative standard deviation of the
correlations were calculated in Excel for each sample column. The retention times of all
compounds of each sample were compared against each other for calculating the correlation
coefficients. The test was performed by highlighting the retentions times of the targeted samples
then clicking MORE FUNCTIONS, STATISTICAL, and then STDEV.
The data input into Excel was copied and pasted into the SPSS Statistical Software.
Scatter plots of the samples were plotted using SPSS Statistical Software. The selected retention
times of the compounds found in all the real strawberry samples were averaged and compared to
those of the commercial products. Each of the averaged retention times of the compounds in the
samples was compared against those of the strawberry standard and plotted. The scatter plots
were plotted by clicking GRAPHS, SCATTER, OVERLAY, and DESIGN. Next, define the X-
Y variable pairs and click OK.
The Pearson’s correlations coefficients of the commercial samples with the real
strawberry samples were calculated also using the SPSS Statistical Software. The correlations
were calculated by clicking ANALYSE, CORRELATE, and then BIVARIATE. In the
correlation window, the next process is to click the Pearson correlation and select the variables to
correlate.
44
The Mann-Whitney U Test was performed in SPSS Statistical Software by using the
same data as the Pearson’s correlation coefficients. This non-parametric test is to examine if two
independent samples do come from the same distribution. Two samples have to be independent
and the observations must be continuous measurements. It is to test if the null hypothesis that
the commercial products are indeed similar to the natural strawberry flavor can be confirmed or
rejected. If α < 0.05 then the null hypothesis can be rejected; i.e. the commercial product is not
similar to the natural strawberry sample. The Mann-Whitney U is calculated by
. For large samples, the U value is approximately normally
distributed. The approximated value is where mU and σU are the mean and standard deviation of U.
The mU and σU are given by , where and
. The retention times of the selected major compounds in the natural
strawberry samples were averaged and used as the referenced retention times of the natural
strawberry sample used for the Mann-Whitney U Test. The significance for the Mann-Whitney
U Test is calculated by clicking ANALYZE, NON-PARAMETRIC TEST, and 2
INDEPENTDENT SAMPLES. In the Mann-Whitney U window, select the variables then click
OK.
45
CHAPTER 4
RESULTS AND DISCUSSION
Visual Inspection of GCMS Chromatograms
The samples extracted were injected into the GCMS to obtain the chromatographic data.
The data of peak areas versus retention times were subjected to different statistical analysis to
obtain results from which conclusions can be drawn to evaluate the attainment of research goals.
Figure 2 presents the chromatogram of the four standard compounds ran on the GCMS.
Figure 2. GCMS spectrum of standards, ethyl acetate, ethyl butyrate, furfural, and DMHF of concentrations of 1.02 x 10⁻⁴ , 7.57 x 10⁻⁵, 1.21 x 10⁻⁴, and 7.80 x 10⁻⁶ mol/L, repectively.
In Figure 2, the four standard compounds were run as the standard chromatogram. The
retention times of these standard compounds are used to identify their presence in the
chromatograms obtained from the real strawberry samples and the artificially flavored
commercial product sample. Ethyl acetate (retention time of 2.922 min) eluted the column first.
Ethyl Acetate
Ethyl Butyrate
Furfural
DMHF
46
Ethyl butyrate, furfural, and DMHF eluted the column next with retention times of 7.855 min,
10.180 min, and 17.713 min, respectively. They eluted almost in the order of molar mass and
polarity. This chromatogram was used as a visual comparison to the peaks in other samples.
Figure 3, 4, and 5 are the GCMS chromatograms of the three real strawberry samples
used in this study.
Figure 3. GCMS spectrum of California strawberry sample of concentration of 0.1 g/mL. The only standard compound found, based on retention time, was ethyl butyrate.
In Figure 3, one can see that in natural strawberry, there are many compounds present.
Some of those compounds are responsible for the unique flavor of the California strawberry.
Some are other compounds which may be vitamins, antioxidants, and so on. Based on the
retention times of the standards, one can only find the probable presence of ethyl butyrate
(retention time of 7.855 min) in this sample. The other peaks are not identifiable. The
deficiency in the standard compounds available, and the shortcoming of the MS library file does
Ethyl Butyrate
47
Figure 4. GCMS spectrum of Driscoll’s strawberry sample of concentration of 0.1 g/mL. No standards were found in the sample.
Figure 5. GCMS spectrum of strawberry Fraises sample of concentration of 0.1 g/mL. Three standard compounds that were found in this sample are ethyl acetate, furfural, and DMHF, based on the retention times.
Ethyl Acetate
Furfural DMHF
48
not allow one to identify any of the peaks unless they have the same retention times as those of
the four standards available.
Figure 4 is the chromatogram of the Driscoll’s Strawberry sample. The Driscoll’s
Strawberry sample has many compounds. However, none of the standard compounds are
positively identified in this sample. Identification of the compounds in the Figure 4
chromatogram, based on the retention times of the standards, proved to be difficult. The
identification of the compounds in the Driscoll’s Strawberry sample may have been possible if
one has an extensive MS library file for the instrument.
In Figure 5, one can see again that the natural strawberry sample chromatogram is
complex and made up of many compounds. In the Strawberry Fraises sample chromatogram,
three of the four standard compounds are found. These are ethyl acetate, furfural, and DMHF.
The retention times of these standards are 2.922 min, 10.180 min, and 17.713 min, respectively.
The peaks identified are prominent single peaks and matched the retention times of the standard
compounds. As one can see, natural flavors are very complex and have many compounds that
make up a flavor.
Figures 6 and 7 are chromatograms of the Burger King® Milkshake sample and the
Gatorade® sample. Artificially flavored commercial products have many compounds present
other than flavoring compounds. Identifying the standard flavoring compounds that are available
proved to be a difficult task.
49
Figure 6. GCMS spectrum of Burger King® Milkshake sample of concentration 0.04 g/mL.Two standard compounds that were found, based on retention times, are ethyl butyrate and furfural.
Figure 7. GCMS spectrum of Gatorade® sample of concentration 0.03 g/mL. Based on the retention times, the two standard compounds that were found were Ethyl Butyrate and Furfural.
Ethyl Butyrate
Furfural
Ethyl Butyrate
Furfural
50
The Burger King® Milkshake sample chromatogram shown in Figure 6 contains many
peaks. A visual comparison proved that this sample in many ways is similar to the real
strawberry. One can see that the Burger King® Milkshake sample and natural strawberry sample
chromatograms have similar numbers of peaks. Based on the retention times, ethyl butyrate
(retention time of 7.855 min) and furfural (retention time of 10.180 min) are found in this
sample. These standards are identified by using the retention times of peaks from the sample and
comparing them against the retention times of the standard compounds. This visual comparison
of the chromatograms obtained shows that the Burger King® Milkshake sample is the closest in
similarity to that of a natural strawberry chromatogram. The result thus indicated that the Burger
King® Milkshake most likely contains the real natural strawberry of some form. Also the taste of
the products by actually eating them seems to collaborate the findings from GCMS. It might
also be due to the nature of the product. It is far easier to mix in the real strawberry or some
version of the real strawberry into the product than to extract flavor compounds.
The chromatogram of Gatorade® sample shown in Figure 7 shows that it is also quite
similar to that of the natural strawberry. Two standards that may be present in this sample, as
indicated by the retention times, are ethyl butyrate (7.855 min) and furfural (10.180 min). With
the availability of compounds spectral library software, the identification of more compounds
may have been possible.
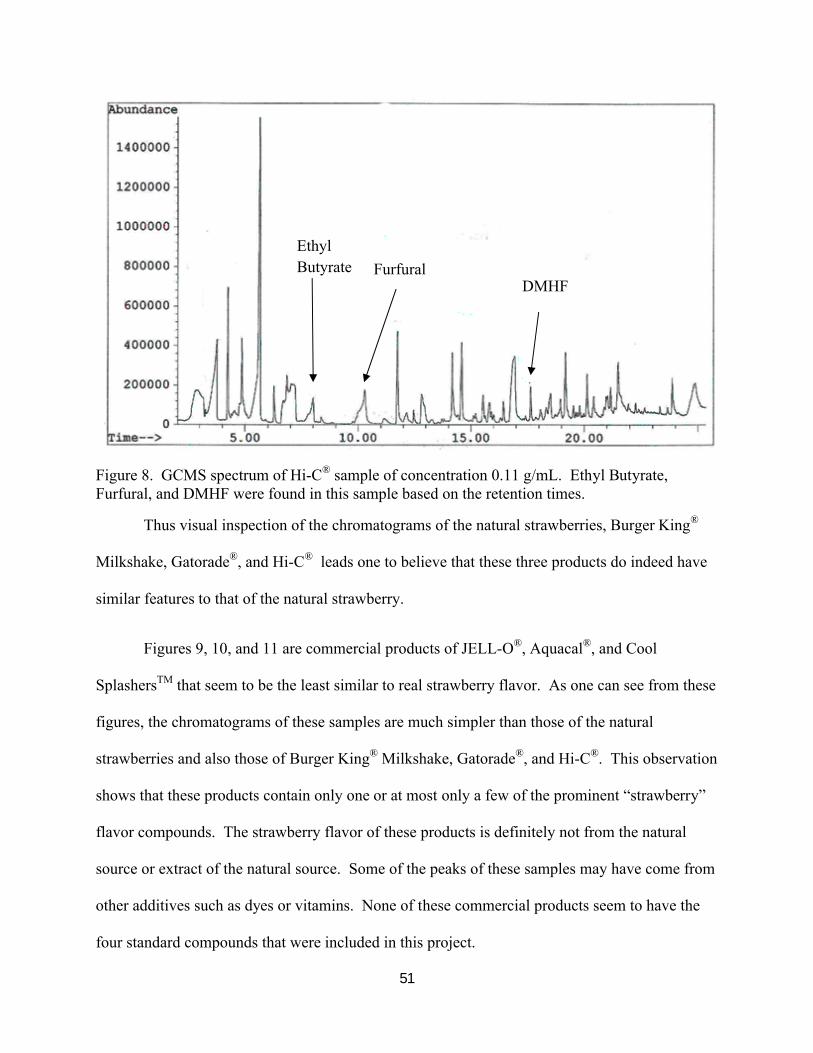
The chromatogram of the Hi-C® sample shown in Figure 8 is found to be also very
similar to the chromatograms of the natural strawberry samples. This commercial product most
likely has the most prominent flavor compounds of the natural strawberries present. The taste
also resembled that of the natural strawberry. In addition, ethyl butyrate (7.855 min), furfural
(10.180 min), and DMHF (17.713 min) seem to be present in the sample.
51
Figure 8. GCMS spectrum of Hi-C® sample of concentration 0.11 g/mL. Ethyl Butyrate, Furfural, and DMHF were found in this sample based on the retention times.
Thus visual inspection of the chromatograms of the natural strawberries, Burger King®
Milkshake, Gatorade®, and Hi-C® leads one to believe that these three products do indeed have
similar features to that of the natural strawberry.
Figures 9, 10, and 11 are commercial products of JELL-O®, Aquacal®, and Cool
SplashersTM that seem to be the least similar to real strawberry flavor. As one can see from these
figures, the chromatograms of these samples are much simpler than those of the natural
strawberries and also those of Burger King® Milkshake, Gatorade®, and Hi-C®. This observation
shows that these products contain only one or at most only a few of the prominent “strawberry”
flavor compounds. The strawberry flavor of these products is definitely not from the natural
source or extract of the natural source. Some of the peaks of these samples may have come from
other additives such as dyes or vitamins. None of these commercial products seem to have the
four standard compounds that were included in this project.
Ethyl Butyrate Furfural
DMHF
52
Figure 9. GCMS spectrum of JELL-O® sample of concentration 0.03 g/mL. No standard compounds were found in this sample.
Figure 10. GCMS spectrum of Aquacal® sample of concentration 0.05 g/mL. No standard compounds were found in this sample.
53
Figure 11. GCMS spectrum of Cool SplashersTM sample of concentration 0.02 g/mL. No standard compounds were found in this sample.
Figure 9 is the chromatogram of the artificially flavored JELL-O® sample. Taste testing
also confirmed it is not characteristic of the natural strawberry flavor but only minimally
resembles it. Flavoring compounds may not be the main components of the sample. Figure 10
represents the chromatogram of the Aquacal® sample. The Aquacal® sample has the fewest
number of compounds as indicated by the very few peaks in the chromatogram. It is the most
remote from the natural strawberry. It only has a couple of peaks showing that its flavor most
likely comes from trace amounts of only one or two of the synthetic form of the main flavor
compound of strawberries. The flavoring components in the Aquacal® sample were not the main
component in this commercial product. The chromatogram of the Cool SplashersTM sample is
represented in Figure 11. One can see, as a visual comparison, the Cool SplashersTM sample
chromatogram is hardly similar to the natural strawberry sample chromatogram. The taste of the
product also supports the findings that the Cool SplashersTM is not the same as that of the natural
54
strawberry. The taste of the sample resembles more of a fruity taste. The compounds in this
sample include other components along with flavoring compounds. The flavoring compounds
may only be present in trace amounts.
Scatter Plot Study
A scatter plot is a good visual aid to compare how similar the samples are to each other.
Figures 12 and 13 are the scatter plots of the averaged retention times of the compounds found in
the artificially flavored commercial products against those of the natural strawberry flavor
samples. Figure 12 is the combined scatter plot showing the Burger King® Milkshake,
Gatorade®, and JELL-O® samples against that of the natural strawberry sample. Figure 12
shows that the Burger King® Milkshake sample pattern is virtually superimposable on top of the
strawberry sample. This means that the milkshake sample is very similar to that of the natural
strawberry. Such also is the case with the Gatorade® sample. It follows very closely along the
natural strawberry pattern. However, the chromatogram of the Gatorade® sample is not as close
as the chromatogram of the Burger King® milkshake sample to that of the natural strawberry
sample as can be discerned from the scatter plot of Figure 12. There are more deviations of its
chromatogram from that of the natural strawberry at the longer averaged retention times.
However, the chromatogram of the JELL-O® sample does not track that of the natural strawberry
well at all. Except for the first few peaks, the rest of the chromatograms deviate greatly from
that of the natural strawberry. The averaged retention times fall to the far right of the scatter
plot. From this scatter plot, one can conclude that the synthetic flavor compounds used in the
JELL-O® are only a very small subset of that of the natural strawberry. Another observation is
that the flavor compounds in strawberries are those with earlier retention times. This is
reasonable as most flavor compounds are quite volatile or of lower boiling points.
55
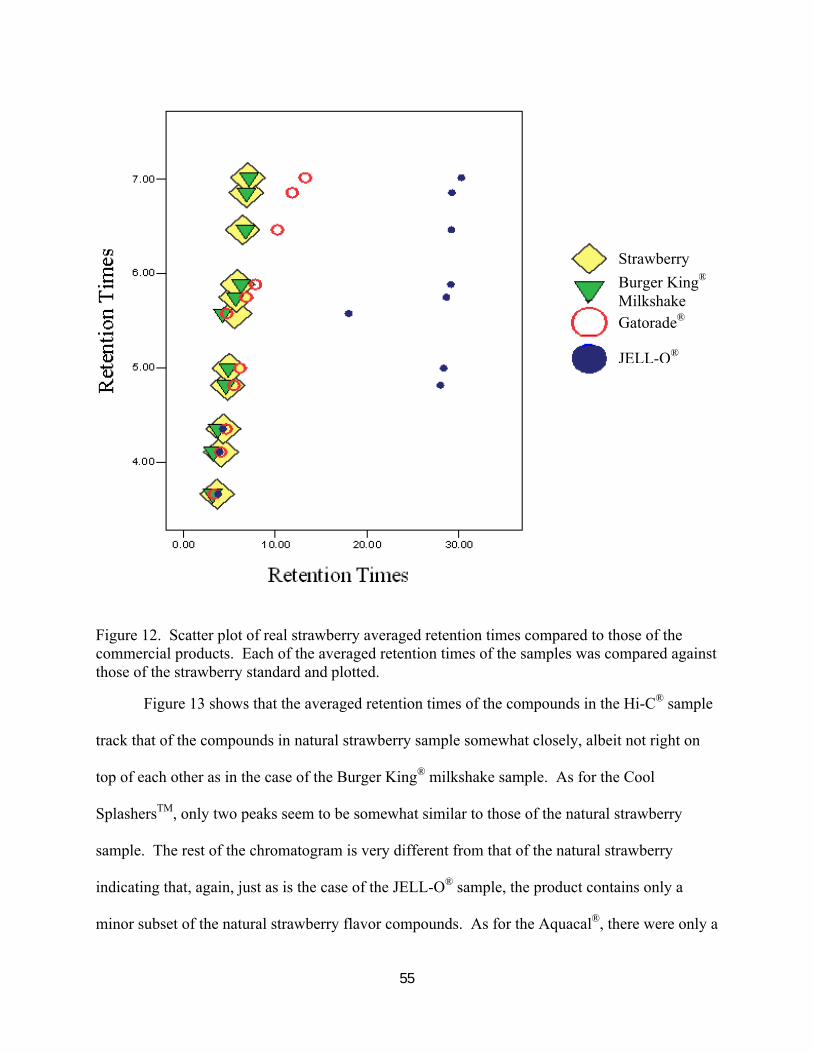
Figure 12. Scatter plot of real strawberry averaged retention times compared to those of the commercial products. Each of the averaged retention times of the samples was compared againstthose of the strawberry standard and plotted.
Figure 13 shows that the averaged retention times of the compounds in the Hi-C® sample
track that of the compounds in natural strawberry sample somewhat closely, albeit not right on
top of each other as in the case of the Burger King® milkshake sample. As for the Cool
SplashersTM, only two peaks seem to be somewhat similar to those of the natural strawberry
sample. The rest of the chromatogram is very different from that of the natural strawberry
indicating that, again, just as is the case of the JELL-O® sample, the product contains only a
minor subset of the natural strawberry flavor compounds. As for the Aquacal®, there were only a
Strawberry
Burger King®
MilkshakeGatorade®
JELL-O®
56
few peaks in its chromatogram, so few in fact, that it is not possible to include its chromatogram
in the scatter plot. This means that Aquacal® does not have much, if any, of the flavor
compounds of the natural strawberry.
Figure 13. Scatter plot of real strawberry averaged retention times compared to those of the commercial products. Each of the averaged retention times of the samples was compared against those of the strawberry standard and plotted.
Strawberry
Hi-C®
Cool SplashersTM
57
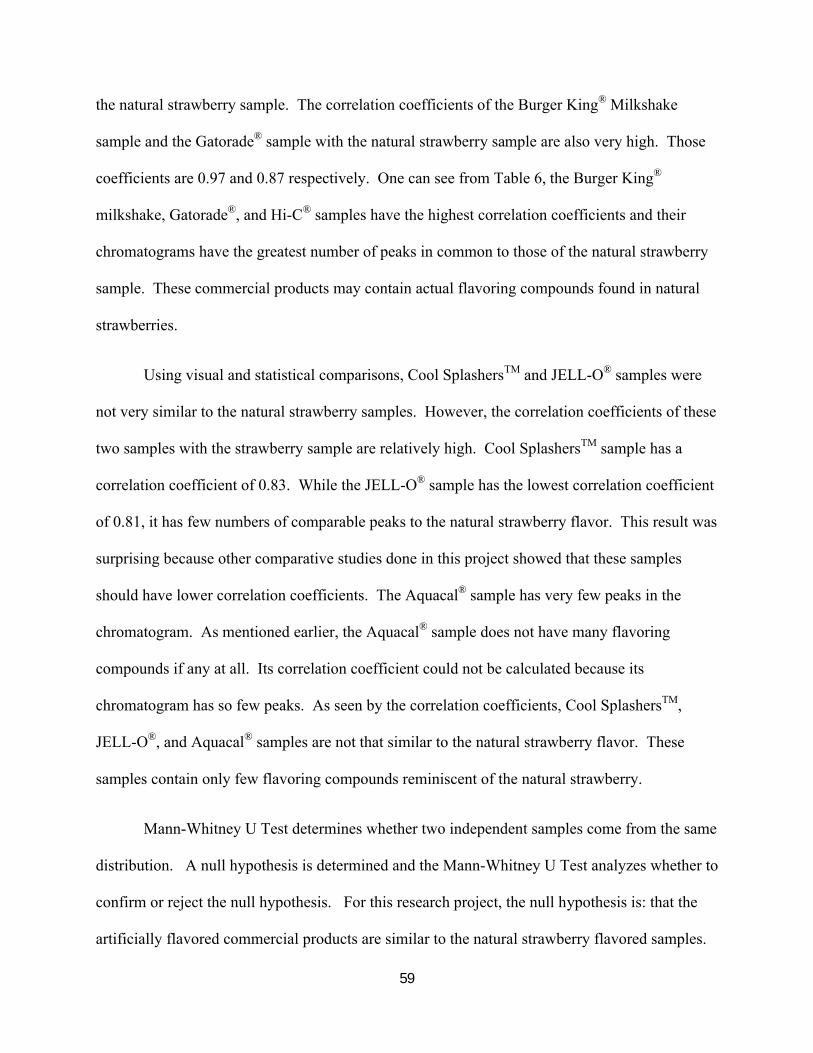
Statistical Methods
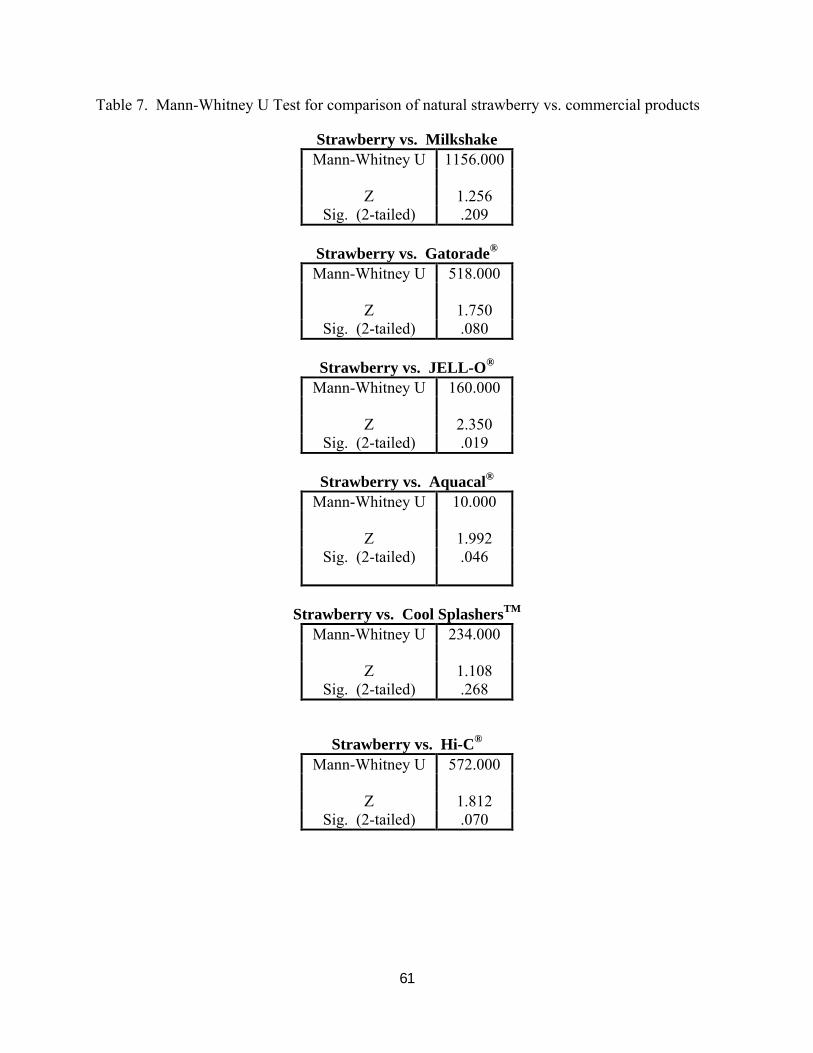
Tables 5 and 6 are the correlation coefficients of the retention times of compounds in the
strawberry samples and those of the commercial products. The coefficients that are closer to
1.00 represent the largest similarity to each other.
Table 5. Correlation coefficients of the different natural strawberry samples obtained from GCMS data


![House Of Flavors, Inc. - Ice Cream Of Flavors, Inc. ... diet. Your daily values ... Sugar], Butter, Modified Cornstarch, Salt, Artificial Flavor, Potassium Sorbate [Preservative],](https://static.documents.pub/doc/80x56/5ae5537c7f8b9acc268be5ee/house-of-flavors-inc-ice-of-flavors-inc-diet-your-daily-values-sugar.jpg)


