annual total energy use, but ignored detailed operational information and correlation in
the hourly time-series data, and therefore lacked a comprehensive data comparison. Thus,
it is necessary to discuss and unify the functions of the system, and define the types of
data for collection. A standard building energy data model should be developed to make
monitoring systems comparable and valuable.
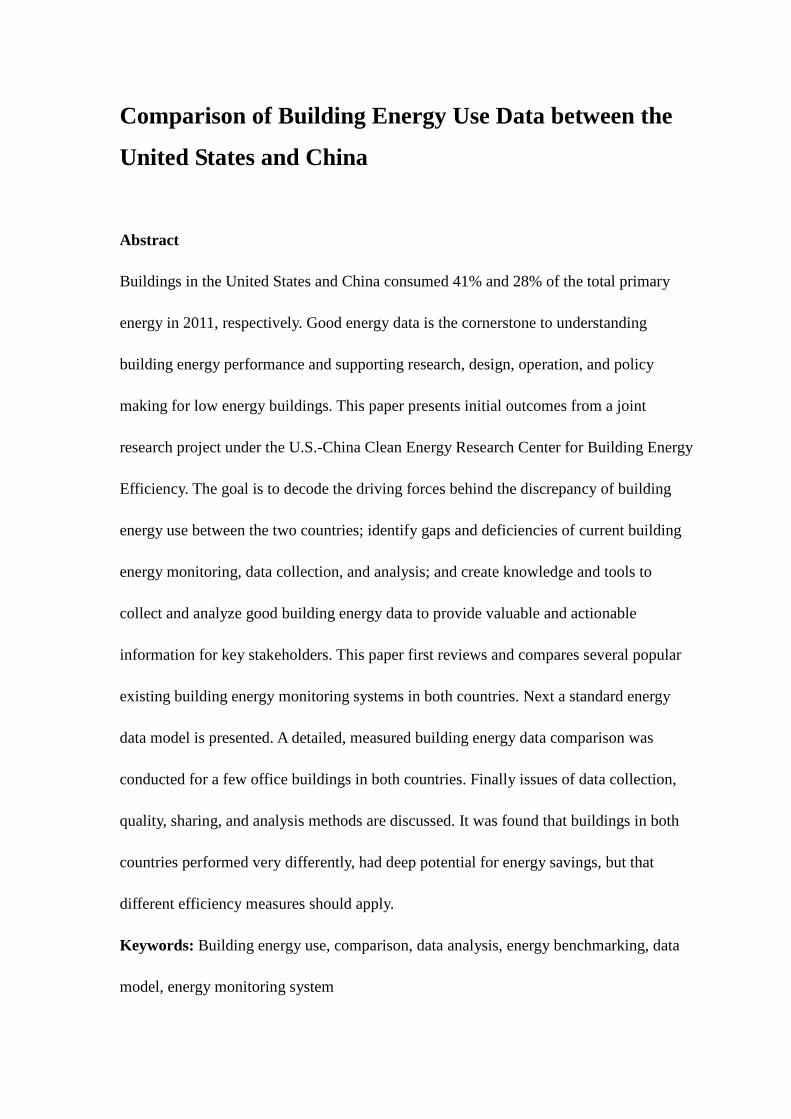
3.2 Basic functions
Data storage, automatic correction, data analysis, visualization, and reporting are basic
functions of a monitoring system (Akihiro & Mitsuhiro, 2012; Noreacuten, 2010; Piette,
Kinney, & Haves, 2001). In particular, visualization and reporting are extensively
discussed in subtask B2 of IEA Annex 53. However, these functions are used for final
analysis and presentation purposes while this paper introduces the fundamental
background function: data processing.
Many studies have looked at operational fault diagnosis and benchmarking, even if they
are independent topics. The energy monitoring system is just a bridge connecting them.
Energy monitoring and comparison are the core of the system; meanwhile this system
also offers auxiliary information and analysis for benchmarking and detailed diagnosis.
Thus, there are three levels of monitoring system function on data processing: (1) audit
and benchmarking, (2) monitoring and management, and (3) energy conservation and
operational performance diagnostics.
The first level is usually available in most existing monitoring systems or benchmarking
databases. The whole building’s annual or monthly data is compared or ordered according
to its climate zone and building type. Statistical methods can be used to analyze the
profile of energy consumption and its correlation with climate parameters. For short- and
medium-term management, the second level mainly includes monthly or weekly energy
auditing, analysis of daily energy consumption by various end uses, characteristics
comparison, and the analysis of a 24-hour curve of various end uses. Comparison
approaches can use common references, be between buildings, or use historical records of
the same building. Comparison at various intervals is a brief but efficient approach to
managing the building’s operational performance. The third level is for preliminary
diagnosis in a microcosmic view. Hourly time-series analysis, correlation analysis, and
efficiency calculation provide more assistance to on-site investigation and diagnosis.
3.3 Standard model
To realize all three basic functions, the collected information and energy data should
cover various types of end uses in a short time interval. This paper’s model structure
generally follows the building energy use model in the ISO Standard 12655 (ISO, 2012).
Considering the wide use of electricity in the buildings studied and the technical difficulty
of gas and water submetering, only electricity is submetered, which distinguishes our
structure slightly from the ISO model approach. Thus the building energy data model is
designed in two parts: (1) basic building information, total energy data, and some
operational parameters listed in Table 3. In this part, energy use is categorized by energy
type and the total energy consumption. (2) An electricity submetering tree model, as
shown in Figure 3. In this submetering model, total building energy use is segregated by
HVAC, lighting and appliance, public service, and special uses. These four major
categories have detailed sub-items. Compared with the ISO model, other ultimate usage is
renamed as public service, and the service hot water item is moved to the public service
category, as only the pump electricity consumption is considered. Furthermore, the
sub-items are designed more meticulously in the HVAC category.
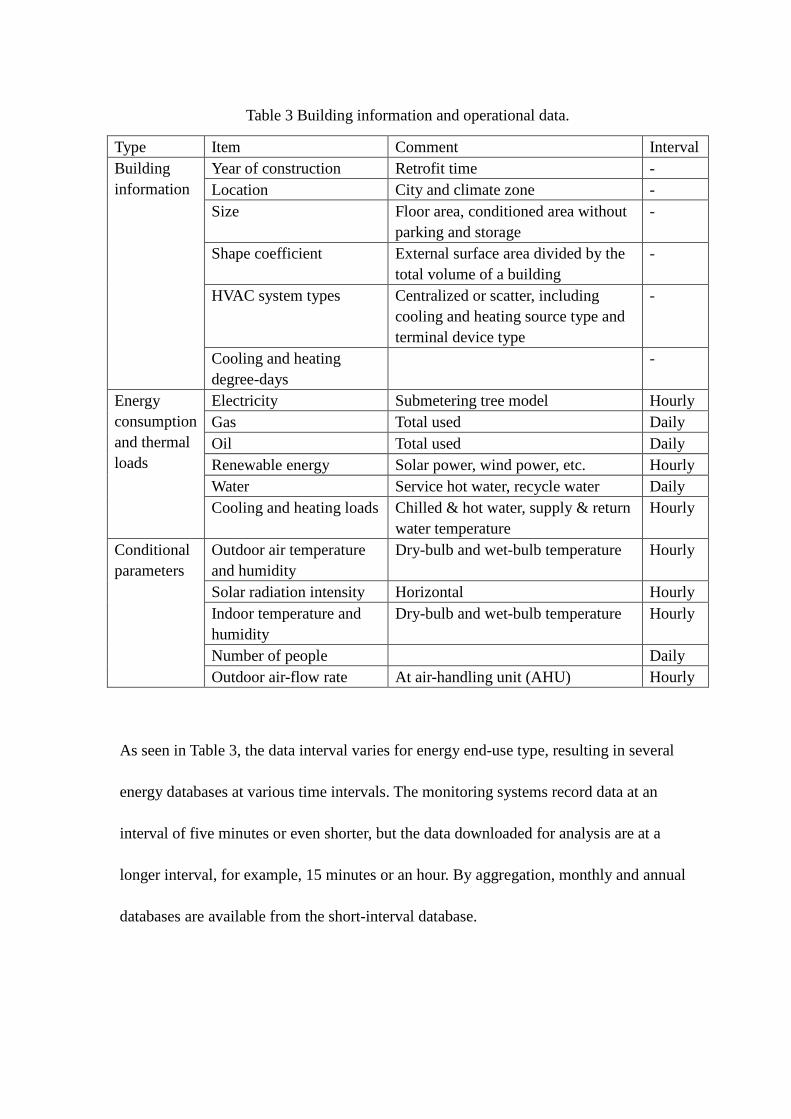
Table 3 Building information and operational data.
Type Item Comment Interval Building information
Year of construction Retrofit time - Location City and climate zone - Size Floor area, conditioned area without
parking and storage -
Shape coefficient External surface area divided by the total volume of a building
-
HVAC system types Centralized or scatter, including cooling and heating source type and terminal device type
-
Cooling and heating degree-days
-
Energy consumption and thermal loads
Electricity Submetering tree model Hourly Gas Total used Daily Oil Total used Daily Renewable energy Solar power, wind power, etc. Hourly Water Service hot water, recycle water Daily Cooling and heating loads Chilled & hot water, supply & return
water temperature Hourly
Conditional parameters
Outdoor air temperature and humidity
Dry-bulb and wet-bulb temperature Hourly
Solar radiation intensity Horizontal Hourly Indoor temperature and humidity
Dry-bulb and wet-bulb temperature Hourly
Number of people Daily Outdoor air-flow rate At air-handling unit (AHU) Hourly
As seen in Table 3, the data interval varies for energy end-use type, resulting in several
energy databases at various time intervals. The monitoring systems record data at an
interval of five minutes or even shorter, but the data downloaded for analysis are at a
longer interval, for example, 15 minutes or an hour. By aggregation, monthly and annual
databases are available from the short-interval database.
HVAC source
Total EC
Lighting
Indoor lighting
Information center
IT equipment
Dedicated HVAC for
IT equipment Kitchen
Cooker
Dedicated HVAC for
kitchen
OutletW
ater supplying and
draining pump
Elevator
Plug appliance
Outdoor lighting
Electricity boiler
Other
Lighting and appliance Public service Special
Exhausted heat
/cold
pump
Exhausted heat
/cold
fan
Water cooled/heated source
Heating/Cooling source
Chilller
/Heat pump
Air cooled
/heated Source
Heat
/Cold transfer pump
Centralized HVAC
Heat
/Cold transfer fan
Scattered HVAC
HVAC
Electricity heating source
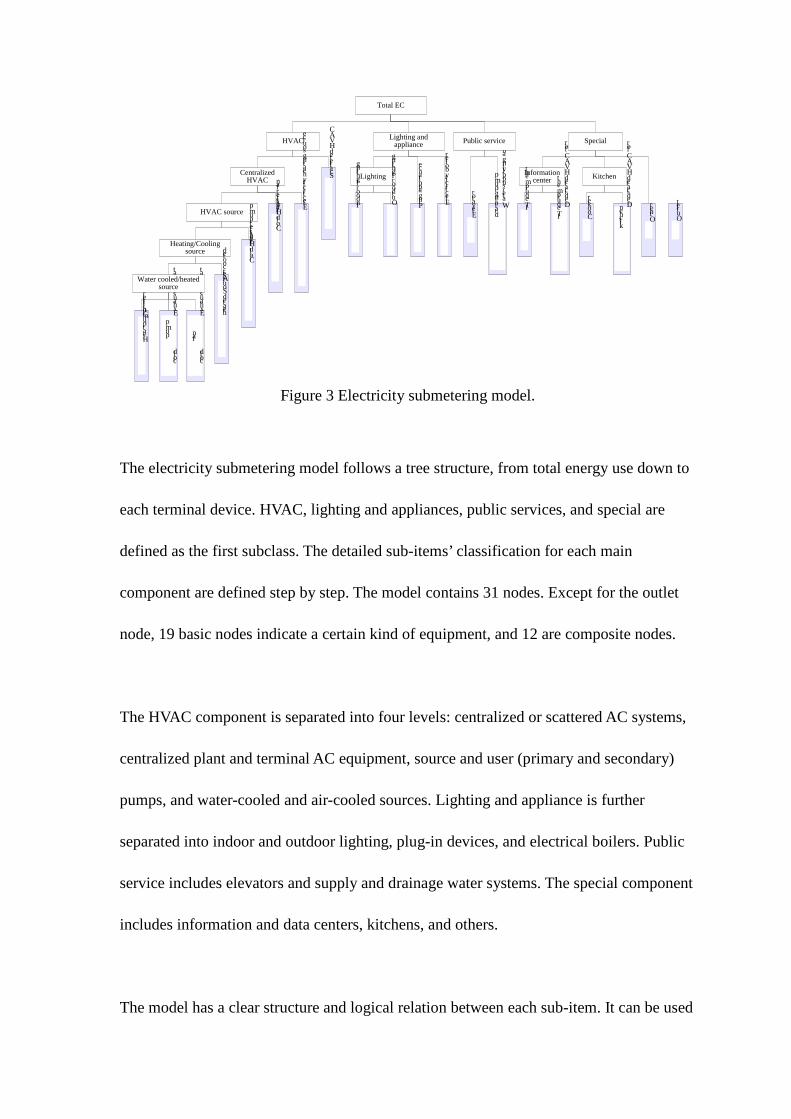
Figure 3 Electricity submetering model.
The electricity submetering model follows a tree structure, from total energy use down to
each terminal device. HVAC, lighting and appliances, public services, and special are
defined as the first subclass. The detailed sub-items’ classification for each main
component are defined step by step. The model contains 31 nodes. Except for the outlet
node, 19 basic nodes indicate a certain kind of equipment, and 12 are composite nodes.
The HVAC component is separated into four levels: centralized or scattered AC systems,
centralized plant and terminal AC equipment, source and user (primary and secondary)
pumps, and water-cooled and air-cooled sources. Lighting and appliance is further
separated into indoor and outdoor lighting, plug-in devices, and electrical boilers. Public
service includes elevators and supply and drainage water systems. The special component
includes information and data centers, kitchens, and others.
The model has a clear structure and logical relation between each sub-item. It can be used
in most types of large-scale commercial buildings, including office towers, hotels, and
shopping malls.
4. Building energy data comparison
4.1 Introduction of case study buildings
To deeply understand the discrepancies of building energy use between the U. S. and
China, identify the drivers to different performances, and then provide guidance and
insights for the retrofit of existing buildings as well as the design and operation of future
low energy buildings, a few typical buildings from both countries were selected for
analysis and comparison. The buildings met most of the major selection criteria and
include the information listed below as much as possible:
1. Medium- to large-size office buildings were preferred, as they are the most
common types of commercial buildings (referred to as “public buildings” in
China). The end uses of such buildings can be more easily clarified as there are
not so many special devices or complicated systems as in other building types,
such as hospitals.
2. Physical characteristics: total floor area, number of stories, vintage, location,
operating hours, number of occupants, description of building energy service
systems.
3. Detailed energy submetering for major end uses, including lighting, plug-loads,
data center if any, elevators, service water heating, and HVAC (chiller, boiler,
cooling tower, fan, pump, any direct expansion [DX] unit and radiators).
4. At least one full year’s valid measured energy use data at one-hour or shorter time
intervals.
5. Overview of the monitoring system showing the hierarchy of submetering.
6. High-level description of BMS, including key data points.
7. Optional but necessary for HVAC analysis and diagnostics: typical HVAC system
and central plant operating conditions. For example, chiller power consumption,
cooling loads, chilled water flow rate, inlet and outlet water temperature; AHU
supply airflow rate, fan power, supply air temperature, etc.
8. Optional but good to have: indoor conditions, including typical space air
temperature and humidity; outdoor conditions, including outdoor air temperature
and humidity, wind speed and direction, solar radiation.
A dozen office buildings, five in the U.S. and seven in China, were selected based on the
above criteria. Four of the buildings, which have completed data collection and initial
analysis, were used in this study for detailed analysis and comparison. Table 4
summarizes key information of the four buildings.
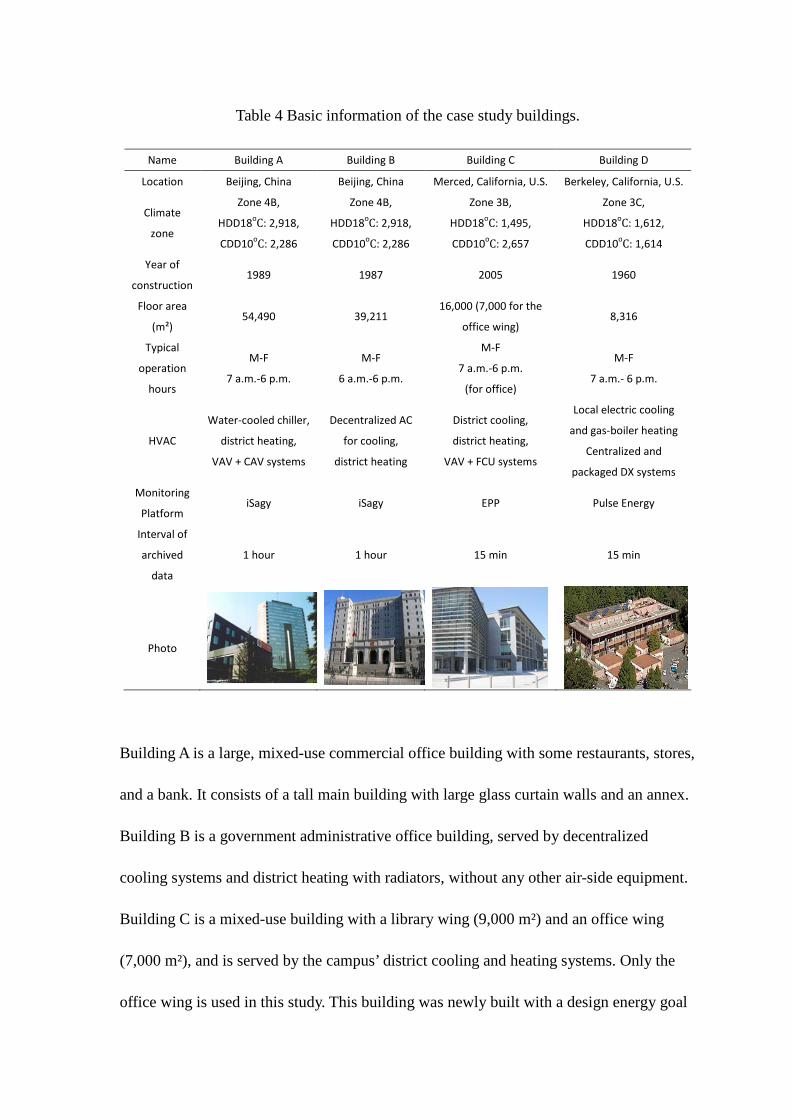
Table 4 Basic information of the case study buildings.
Name Building A Building B Building C Building D
Location Beijing, China Beijing, China Merced, California, U.S. Berkeley, California, U.S.
Climate
zone
Zone 4B,
HDD18oC: 2,918,
CDD10oC: 2,286
Zone 4B,
HDD18oC: 2,918,
CDD10oC: 2,286
Zone 3B,
HDD18oC: 1,495,
CDD10oC: 2,657
Zone 3C,
HDD18oC: 1,612,
CDD10oC: 1,614
Year of
construction 1989 1987 2005 1960
Floor area
(m²) 54,490 39,211
16,000 (7,000 for the
office wing) 8,316
Typical
operation
hours
M-F
7 a.m.-6 p.m.
M-F
6 a.m.-6 p.m.
M-F
7 a.m.-6 p.m.
(for office)
M-F
7 a.m.- 6 p.m.
HVAC
Water-cooled chiller,
district heating,
VAV + CAV systems
Decentralized AC
for cooling,
district heating
District cooling,
district heating,
VAV + FCU systems
Local electric cooling
and gas-boiler heating
Centralized and
packaged DX systems
Monitoring
Platform iSagy iSagy EPP Pulse Energy
Interval of
archived
data
1 hour 1 hour 15 min 15 min
Photo
Building A is a large, mixed-use commercial office building with some restaurants, stores,
and a bank. It consists of a tall main building with large glass curtain walls and an annex.
Building B is a government administrative office building, served by decentralized
cooling systems and district heating with radiators, without any other air-side equipment.
Building C is a mixed-use building with a library wing (9,000 m²) and an office wing
(7,000 m²), and is served by the campus’ district cooling and heating systems. Only the
office wing is used in this study. This building was newly built with a design energy goal
of 38% greater energy efficiency than the 2001 California Title 24 standards (Green
Building Research Center, UC Berkeley, 2008). Building D is the oldest among these four
buildings, with metal-panel walls without insulation; and leaky, single-pane, clear-glass
windows. It is served by various DX HVAC systems.
4.2 Energy data comparison
A whole year of energy use data for each building were selected and compared based on
annual, monthly, weekly, and daily analysis. Since there is no data for space heating in the
selected Chinese buildings, only electricity consumption was compared in this study. The
electricity consumption was normalized by using the gross floor area (not the conditioned
floor area) of each building to obtain the energy use intensity (EUI) for comparison.
When calculating the EUI for Building C, the total area of 16,000 m² was used for
sub-items that involve the whole building, just like the other buildings, while 7,000 m²
was used for sub-items that only involve the office wing. As an exception, while the
elevator is an electricity end-use shared by both wings, the library wing, with more
floating people and a longer operation time, has much higher elevator use rate than the
office wing. Therefore to split the elevator electricity use, the office wing is roughly
considered to account for only 25% of the total. In addition, a ratio based on cooling
tonnage consumed by all campus buildings to cooling tonnage of Building C was used to
roughly estimate the percentage of plant equipment (chillers, pumps, and cooling towers)
energy consumed by Building C.
4.2.1 Annual data analysis
Figures 4 to 7 show a breakdown of annual total electricity use for the four buildings.
Since the submetering systems in these buildings differ significantly in terms of detailed
subcategories, the end-use structure shown in these figures is not exactly the same as the
proposed standard energy data model.
Office Equipment, 12.6, 10%
Lighting, 48.8, 40%
Elevators, 5.0, 4%
Other, 10.3, 8%
AHUs, 29.9, 25%
Chiller, 9.9, 8%
Cooling Tower Fans, 0.3, 0%
Primary/Secondary Pumps, 3.8, 3%
Condensing Water Pumps, 0.7, 1%Decentralized
AC, 1.2, 1%
HVAC, 45.5, 38%
Annual Breakdown of Total Electricty Consumption - Building A
kWh/m2
Figure 4 Building A total annual electricity usage breakdown.
Office Equipment, 10.9, 10%
Lighting, 60.1, 53%
Elevators, 0.6, 1%
Other, 18.6, 16%
Primary/Secondary Pumps,
15.4, 13%
Decentralized HVAC,
8.5, 7%HVAC, 23.9, 20%
Annual Breakdown of Total Electricty Consumption - Building B
kWh/m2
Figure 5 Building B total annual electricity usage breakdown.
Office Equipment, 31.7, 29%
Lighting, 28.5, 26%
Elevators, 6.5, 6% Other, 1.3, 1%
Chiller, 20.1, 18%
AHU, 15.0, 13%
Cooling Tower
Fans, 2.1, 2%
Primary/ Secondary
Pumps, 2.2, 2%
Condensing Water Pumps, 3.6, 3%
HVAC, 43.0, 38%
Annual Breakdown of Total Electricty Consumption - Building C
kWh/m2
Figure 6 Building C total annual electricity usage breakdown.
Office Equipment, 59.9, 44%
Lighting, 24.7, 18%
Elevator, 0.7, 0%
Packaged System, 19.3, 14%
Other HVAC Equipment,
9.1, 7%
Built Up System -Fans,
20.5, 15%
Built Up System -DX units, 3.3, 2%
HVAC, 52.2, 38%
Annual Breakdown of Total Electricty Consumption - Building D
kWh/m2
Figure 7 Building D total annual electricity usage breakdown
As a consequence of the relatively rough submetering system of Building D, the
breakdown for this building is not as specific as that of the other buildings. The sub-item
“Other” shown in the Buildings A, B, and C is included in the “Office Equipment” in
Building D. In terms of HVAC, the packaged systems include rooftop units and ductless
split units, while the built-up system consists of fans and DX units. The DX units
consume a very small amount of electricity mainly because they are usually off when fans
can operate alone with cool outside air due to the airside economizer. Besides, there is a
mixed sub-item containing some other HVAC equipment like a small AHU, service
hot-water pumps, and a fan that can’t be separated.
To compare these buildings and typical office buildings in both countries, the annual total
electricity consumption of each building was broken down into four major subcategories,
as shown in Figure 8. The data source of the typical Chinese office building is the 2007
Beijing Municipal Government Office Buildings and Large Public Building Energy
Consumption Statistical Summary (BECSS, 2007), which is the average of 513 office
buildings in Beijing, including 102 Class 1 large administrative office buildings, 379
Class 2 large commercial office buildings, and 32 Class 3 common office buildings. The
data source of the typical U.S. office building is the California Commercial End-Use
Survey, available from the EnergyIQ website (LBNL, 2012). It is the average of 112
office buildings in California, built after 1940, and with a total floor area of
25,001~150,000 ft2 (about 2,323~13,935 m2).
Data for HVAC in these buildings may include energy consumption on equipment related
to space heating (primary/secondary pumps, AHUs, etc.), though excluding space heating
source energy. The subcategory “other” in the figures can be a mix of things, such as
elevators, data centers, kitchen equipment, sewage drainage pipes, etc.
0
20
40
60
80
100
120
140
160
Building A- China
Building B- China
Building C- U.S.
Building D- U.S.
TypicalOffice
Building- China *
TypicalOffice
Building- U.S.**
kWh/
m2 a
Annual Electricity Consumption Comparison
Other
Office Equipment
Lighting
HVAC (excluding spaceheating source)
* Average of 513office buildings in Beijing, China
** Average of 112 office buildings in California, U.S.
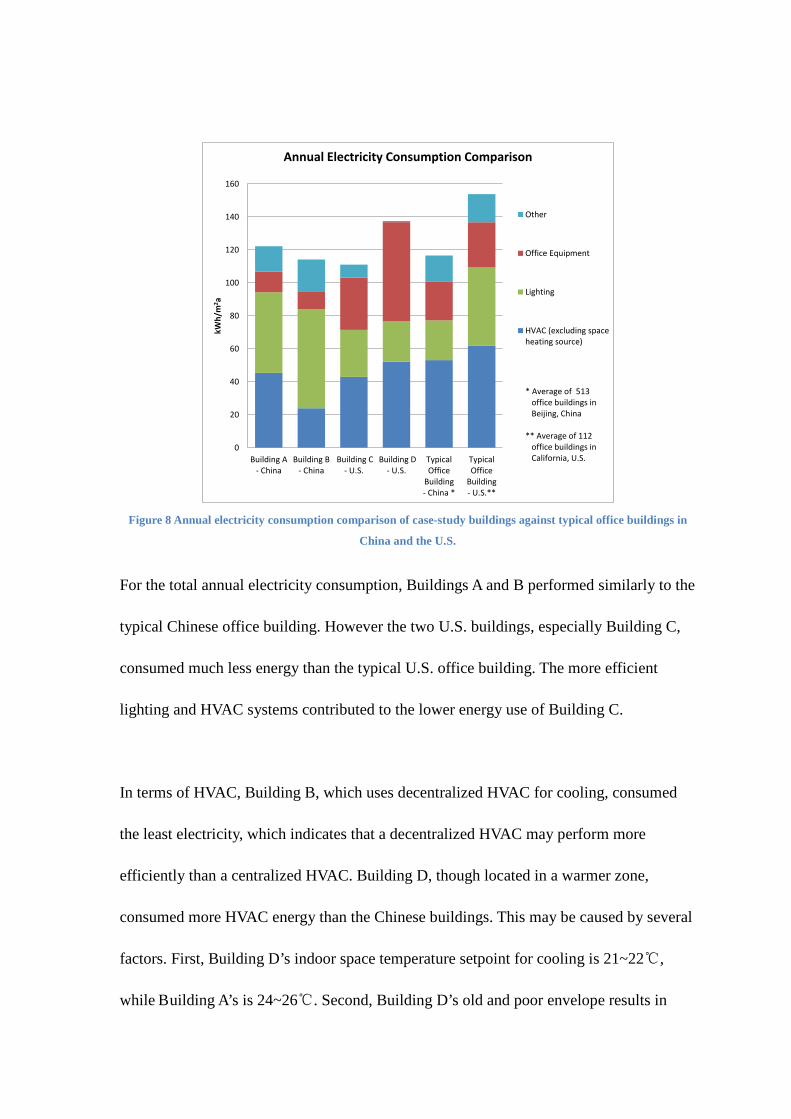
Figure 8 Annual electricity consumption comparison of case-study buildings against typical office buildings in
China and the U.S.
For the total annual electricity consumption, Buildings A and B performed similarly to the
typical Chinese office building. However the two U.S. buildings, especially Building C,
consumed much less energy than the typical U.S. office building. The more efficient
lighting and HVAC systems contributed to the lower energy use of Building C.
In terms of HVAC, Building B, which uses decentralized HVAC for cooling, consumed
the least electricity, which indicates that a decentralized HVAC may perform more
efficiently than a centralized HVAC. Building D, though located in a warmer zone,
consumed more HVAC energy than the Chinese buildings. This may be caused by several
factors. First, Building D’s indoor space temperature setpoint for cooling is 21~22℃,
while Building A’s is 24~26℃. Second, Building D’s old and poor envelope results in
much higher cooling and heating loads. Finally, in general, more outdoor air is provided
in the U.S. buildings, and related U.S. ventilation standards are more stringent than those
in China, leading to more electricity use to condition outdoor air.
As for lighting, the Chinese buildings consume much more energy than do the U.S.
buildings. This may be a combination of design and operation: lighting power, occupant
density, operation mode of lights, and different use of natural light. What’s more,
according to the submetered data, Building B’s lighting system not only consumes more
electricity during the daytime, but also stays high at night, contributing to the greatest
lighting energy use among the buildings. On the other hand, Building D’s single-pane
windows introduce more natural light, and its lighting system has gone through some
retrofit. In addition, occupancy sensors in Buildings C and D turn off lights when
occupants leave the office for longer than five minutes. More information is needed to
decide whether the lighting systems in Buildings A and B need retrofit. However, the
typical office building in the U.S. consumes more lighting energy than that in China. This
may be caused by large variations of lighting electricity use in the survey buildings. In
general, lights in most U.S. office buildings are on during the day and most of the night
and without occupancy sensor control, which lead to more energy use than typical
Chinese office buildings.
Meanwhile, the two U.S. buildings, especially Building D, consume much more
electricity in office equipment than do the two Chinese buildings. Though the office
equipment of Building D is mixed with some other equipment, excluding the elevator, it’s
still much higher than the sum of “Office Equipment” and “Other” of other buildings.
Many computers in Building D are left on or in standby mode at night for various reasons,
including remote access by staff, data backup, and operating system and security software
updates. This building also has more personal fans, heaters, and desktop task lights,
which lead to higher electricity use in this sub-item.
4.2.2 Monthly data analysis
After an overview of annual total electricity consumption, it’s imperative to go further,
into monthly data analysis. The data of these buildings were selected from different time
periods. To make comparison easier, the time series on the horizontal axis is set uniform,
from January to December, but actual data can cross two calendar years.
0
2
4
6
8
10
12
14
Jan Feb Mar Apr May Jun Jul Aug Sep Oct Nov Dec
kWh/
m2
Monthly Comparison of Total Electricity ConsumptionBuilding A - China Building B - China Building C - U.S. Building D - U.S.
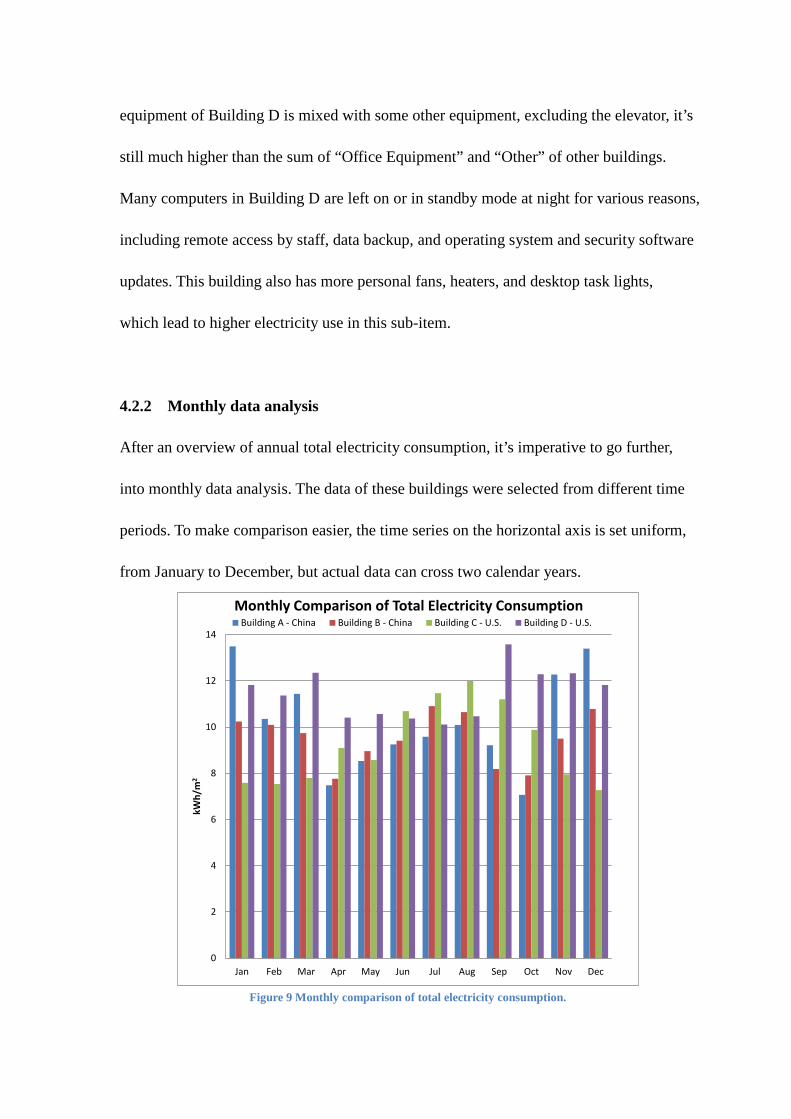
Figure 9 Monthly comparison of total electricity consumption.
It’s clear that the four buildings differ widely in total electricity consumption from month
to month. The discrepancy is much larger in winter than in summer. Buildings A and B
consume more energy than Building C in winter but less in summer, while electricity use
of Building D is always at a relatively high level. To determine the reason for the
differences, a monthly breakdown of total electricity use for each building is shown in
Figures 10 to 13.
0
2
4
6
8
10
12
14
Jan Feb Mar Apr May Jun Jul Aug Sep Oct Nov Dec
kWh/
m2
Monthly Breakdown of Total Electricity Consumption - Building A
Office Equipmentand Others
Lighting
HVAC (excludingspace heatingsource)
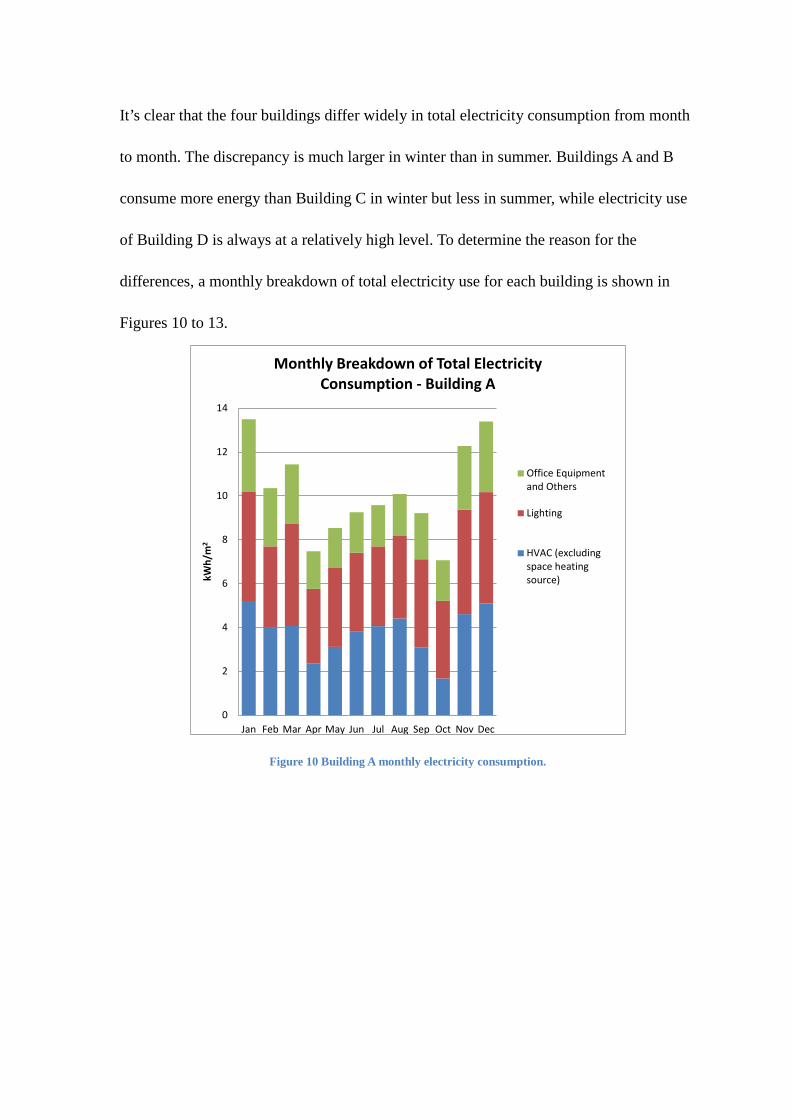
Figure 10 Building A monthly electricity consumption.
0
2
4
6
8
10
12
Jan Feb Mar Apr May Jun Jul Aug Sep Oct Nov Dec
kWh/
m2
Monthly Breakdown of Total Electricity Consumption - Building B
Office Equipmentand Others
Lighting
HVAC (excludingspace heatingsource)
Figure 11 Building B monthly electricity consumption.
0
2
4
6
8
10
12
14
Jan Feb Mar Apr May Jun Jul Aug Sep Oct Nov Dec
kWh/
m2
Monthly Breakdown of Total Electricity Consumption - Building C
Office Equipmentand Others
Lighting
HVAC (excludingspace heatingsource)
Figure 12 Building C monthly electricity consumption.
0
2
4
6
8
10
12
14
Jan Feb Mar Apr May Jun Jul Aug Sep Oct Nov Dec
kWh/
m2
Monthly Breakdown of Total Electricity Consumption - Building D
Office Equipmentand Others
Lighting
HVAC (excludingspace heatingsource)
Figure 13 Building D monthly electricity consumption.
As can be seen, the month-to-month changes in total electricity consumption of these
buildings are mainly due to the changes of electricity consumed by HVAC, while the
other subcategories, which are not weather related, stay relatively constant throughout the
year. For the two Chinese buildings, A and B, district heating is provided from November
15 to March 15 of the following year. As shown in the figures 10 and 11, electricity
consumed by HVAC has a large increase during this period, due to the equipment related
to space heating, such as AHU and pumps. Further investigation of occupant comfort or
measurement of indoor air temperature would help to determine whether the building is
overheated or the heating systems need retrofit. It can also be seen that less electricity is
consumed during the transition season in April and October when heating is shut-down
and little cooling is needed.
For the two U.S. buildings, Building C consumes more electricity in summer and less in
winter, while Building D consumes the most in September, the hottest month of the year
at this location, mainly caused by changes of HVAC energy. Unlike the Chinese buildings,
Buildings C and D have no obvious HVAC increase in winter. In addition, it is curious
that Building D’s electricity use is higher in March than in the previous and following few
months, while electricity use in July and August is much less than in September. This may
be because the fourth floor was under retrofit and unoccupied from April to August in this
year.
4.2.3 Weekly data analysis
Figure 14 is a comparison of total electricity consumption of the four buildings in a
typical summer week. Since the hottest month for Building D is September, different
from the usual summer months of July and August, a typical week was selected from
September for Building D.
Though the data were collected at 15-minute time intervals for Buildings C and D, instead
of the one-hour intervals for Buildings A and B, the latter interval is adopted for uniform
comparison.
0
10
20
30
40
50
60
W/m
2
Comparison of Total Electricity Consumptionin a Typical Summer Week
Building A (Jul 24-30, 2011) Building B (Jul 24-30, 2011)
Building C (Jul 24-30, 2011) Building D (Sep 18-24, 2011)
Figure 14 Typical summer weekly comparison of total electricity consumption.
In terms of total electricity consumption in a typical week of the hottest period for each
building, Building D is much higher than the other buildings in the daytime on weekdays,
and also has a higher base load at night. Unlike the others, Building C consumes more at
night and less during the day. This is a result of its district cooling system, in which the
chillers and cooling towers work at night when electricity is cheaper, and supply chilled
water during daytime on weekdays. The lower peak in daytime is caused by other normal
electricity end uses.
To compare the difference between energy use on weekdays and weekends, it is important
to calculate the ratio of average weekday energy use to the average weekend in the
selected summer week for each building. In such calculations, each weekday or weekend
consists of 24 hours of a whole day. The results are listed in Table 5.
Table 5 Average weekday-weekend energy use ratio in a typical summer week.
Building A B C D
Average weekday-weekend
energy use ratio 2.94 1.36 1.24 2.06
According to these ratios, Buildings A and D consume less electricity on weekends, and
perform more efficiently throughout the whole week, though they may consume more on
weekdays. However, the low ratio of Building C is mainly due to the district cooling
equipment, which operates every night, including on weekends.
4.2.4 Daily data analysis
Further in depth, a typical weekday from each season was selected respectively for each
building, to compare total electricity consumption. Typical weekdays in a same season
were close to each other except for the special summer for Building D.
0
5
10
15
20
25
30
35
W/m
2
Comparison of Total Electricity Consumption on a Typical Spring Weekday
Building A (04/27/2011) Building B (04/25/2012)
Building C (04/25/2012) Building D (04/25/2012)
Figure 15 Comparison of total electricity consumption on a typical spring weekday.
0
5
10
15
20
25
30
35
40
45
50W
/m2
Comparison of Total Electricity Consumption on a Typical Summer Weekday
Building A (07/27/2011) Building B (07/28/2011)
Building C (07/27/2011) Building D (09/21/2011)
Figure 16 Comparison of total electricity consumption on a typical summer weekday.
0
5
10
15
20
25
30
W/m
2
Comparison of Total Electricity Consumption on a Typical Fall Weekday
Building A (10/27/2010) Building B (10/26/2011)
Building C (10/26/2011) Building D (10/26/2011)
Figure 17 Comparison of total electricity consumption on a typical fall weekday.
0
5
10
15
20
25
30
35
40W
/m2
Comparison of Total Electricity Consumption on a Typical Winter Weekday
Building A (01/26/2011) Building B (01/18/2012)
Building C (01/25/2012) Building D (01/25/2012)
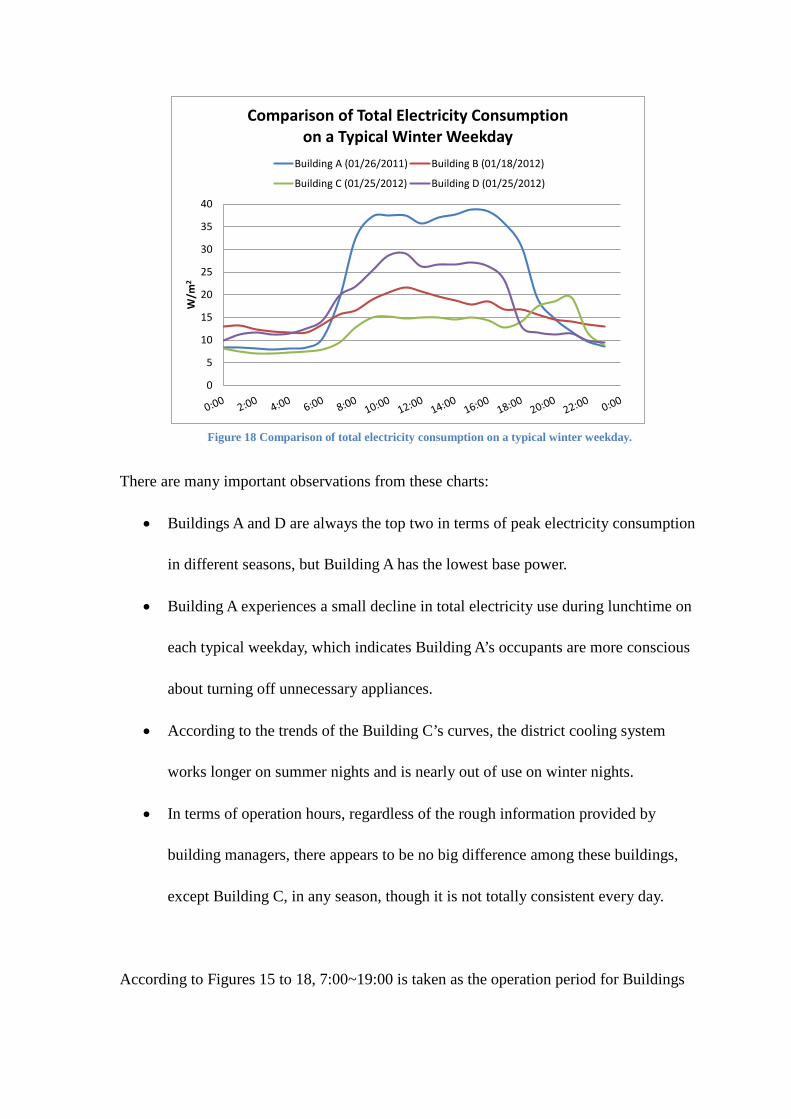
Figure 18 Comparison of total electricity consumption on a typical winter weekday.
There are many important observations from these charts:
• Buildings A and D are always the top two in terms of peak electricity consumption
in different seasons, but Building A has the lowest base power.
• Building A experiences a small decline in total electricity use during lunchtime on
each typical weekday, which indicates Building A’s occupants are more conscious
about turning off unnecessary appliances.
• According to the trends of the Building C’s curves, the district cooling system
works longer on summer nights and is nearly out of use on winter nights.
• In terms of operation hours, regardless of the rough information provided by
building managers, there appears to be no big difference among these buildings,
except Building C, in any season, though it is not totally consistent every day.
According to Figures 15 to 18, 7:00~19:00 is taken as the operation period for Buildings
A, B, and D for calculating peak demand of a day, and the remaining hours are used for
base load calculation. The ratio of average peak load to average base load of these
buildings on typical weekdays in each season was calculated and is shown in Table 6. The
typical days selected here are the same as those in the above figures. Since Building C has
a quite different pattern, it is not included into this comparison.
Table 6 Peak-base energy use ratio on typical weekdays in four seasons.
Spring Summer Fall Winter
Building A 5.35 5.33 4.47 4.20 Building B 1.94 2.22 2.04 1.68 Building D 2.54 2.65 2.11 2.44
Building A clearly has a much higher peak-base energy-use ratio, especially in spring and
summer, which indicates it consumes little electricity when there is no need, and thus it is
more efficient and reasonable in electricity use throughout a whole day. Building B has
the lowest ratio in every season, partly due to the large load of lighting at night. This may
be a good reason for Building A’s lower total electricity consumption than Building B in
some months, although it always consumes much more than Building B during the
daytime.
4.3 Summary
From the above analysis and comparison, buildings may differ a lot in specific sub-items,
yet at times seem similar on total electricity consumption. As for the four case-study
buildings, the Chinese buildings consumed more electricity in lighting than did the U.S.
buildings, contrary to the comparison between typical office buildings in both countries.
More information is needed to determine whether the lighting systems in the Chinese
buildings need retrofit.
For HVAC, the Chinese buildings experience a large increase in electricity use in winter
due to heating-related equipment, while there is no such increase in the U.S. buildings.
This may be a result of different climates, but there is still some need to determine
whether the buildings are overheated or need retrofit. Decentralized HVAC systems
appear to consume less energy than centralized systems. The lower temperature setpoint
for cooling and more outdoor air required in most U.S. buildings may be a cause of their
higher HVAC electricity use. Besides, old buildings with poor envelopes, like Building D,
are more likely to consume more electricity in HVAC in general.
The two U.S. buildings, especially Building D, consume much more electricity in office
equipment than the two Chinese buildings, due to more equipment and longer operation
hours.
The peak-base energy use ratios of the buildings are quite different, probably due to
different operation modes, manual management, and occupants’ energy saving
consciousness. It is clear that Building A performs much better in this aspect, and even
has a small decline during lunchtime, which should be a good model for other buildings.
5. Discussion
Energy benchmarking for commercial buildings has always been difficult. Limiting the
scope and normalizing discrepancies while taking into account case-specific
circumstances are barriers to useful and proper analysis. However, this task can be made
easier with correct data and necessary preparation before data analysis begins.
Some common challenges associated with benchmarking are discussed based on the real
experiences from this study. In addition, some primary suggestions to try to overcome
these challenges in the future are listed and discussed.
5.1 Data collection
A large number of commercial buildings in the U.S. have some kind of monitoring system
installed. The newer buildings with Leadership in Energy and Environmental Design
(LEED) certification require building monitoring as a part of the commissioning process.
End-use-level detailed hourly or subhourly building energy monitoring, however, is rare
and generally is provided only in buildings used for research. The authors investigated a
large number of buildings that claimed to have building energy monitoring systems
installed, and found that most of the buildings lacked component level detailed
measurement; for example, plug-loads and lighting power were not metered separately.
Hourly or subhourly data was unavailable in most of the buildings. Some buildings were
installed with an EMCS that can monitor and/or control the lighting and equipment
energy, heating and cooling energy, and other end uses as well as indoor temperature and
humidity in real time. Unfortunately, some of those systems were not connected to a
monitoring system to store the data for a longer period of time.
Another challenge was estimating the building’s cooling and heating energy from district
cooling and heating systems. Some buildings in this study are located on a large campus
and connected to a district cooling and heating system. For a consistent comparison with
all other buildings, the cooling and heating energy for the selected buildings had to be
separated from the total plant’s energy, but this could only provide a rough estimate of the
building’s cooling and heating energy.
5.2 Data sharing
Once a few buildings with a reasonable amount of detailed measurement data were
selected, a major challenge was data sharing. None of the building owners or facility
managers was willing to share their measured building energy data. This challenge was
overcome by personal discussions with facility managers, site visits, nondisclosure
agreements, and by the promise to share analysis results and identify retrofit measures.
The research team also provided the funding for additional metering, where lacking.
It is vitally important to communicate with building managers before such a project
actually starts, to gain deeper information and let building managers know their
responsibilities throughout the monitoring process.
5.3 Data retrieval
When database access is allowed, it is still a labor-intensive procedure to download and
export data to researchers’ computers. Some systems need certain computer language to
retrieve and export the data of every useful data point, which can take a long time. The
difficulty level of such work depends on the technical features of the energy-monitoring
system. Improvements to data retrieval, downloading, and exporting features would ease
data acquisition and result in fewer manual errors.
Although raw data are sampled at short intervals by the monitoring systems, such as
five-minute or even less, the time intervals of the data available for downloads can be
different, depending on what time intervals are used in the post-processing of the raw
data. In this study, the post-processed 15-minute interval data were downloaded for the
two U.S. buildings, while the one-hour interval data for the two Chinese buildings.
5.4 Naming of data points
The benefits of consistent and useful data point names in BAS are becoming more
apparent as computerized systems containing hundreds or thousands of points are
deployed in commercial buildings. Well-chosen point names can provide useful
information about installed systems and make it easier to monitor, retrieve and download,
analyze, maintain, modify, and interconnect data of various building systems. Software
that performs automated analysis of HVAC system performance may benefit from
consistent application of a point-naming standard (Butler & Veelenturf, 2010).
5.5 Missing data
Generally, obtaining complete sets of data is by far the largest barrier for benchmarking
and analysis of energy use of commercial buildings. Most of the selected buildings have
some missing data, and there seems no pattern to which meters might lose data during
what time periods. The causes of missing data vary. U.S. buildings have a high frequency
of missing energy data around weekends and missing condition data at night, suggesting
the monitoring system is sometimes out of use when no one is in charge.
Chinese buildings’ biggest problems lie in the connectivity between meters, database, and
online system. When connection is lost, all data is lost for all equipment.
Meter instability may cause occasional individual missing data, while large sets of
missing data may be caused by the retrofit of either the monitoring system itself or energy
service system (like HVAC or lighting), or even by power failure in the buildings, during
which the meters don’t measure, the connection is lost, and even the computer is out of
power, leaving missing data in the database. To avoid these problems requires higher
quality meters, sensors, nonstop operation of the monitoring system, and better
emergency measures when power is out and connection is lost.
5.6 Data quality
Even if the data obtained are complete, data quality may suffer, mainly due to the
uncalibrated or broken meters or sensors. Some invalid data — such as negative values
and abnormally mutational findings — can easily be detected, while some seemingly
normal data may actually be inaccurate, considering the error of measurement. Higher
quality meters and sensors, along with more frequent maintenance, would avoid these
problems.
Moreover, it is possible for invalid data to appear during the downloading and exporting
process, especially when exporting a large set of data at one time. A higher quality data
transmission system may avoid this possibility.
5.7 Data correction
To get the data in workable order for calculation, analysis, and benchmarking, the missing
or invalid (mainly negative) data should be replaced with data during time periods or days
that were similar to the invalid points, taking weather condition into account as well. For
example, a few missing data would be replaced by the previous or following few proper
data, or their average. Several hours’ missing data would be replaced by data of the same
time periods on the previous or following day, taking into account weekdays and
weekends. The same goes for missing or invalid data of an even longer period.
5.8 Data analysis
Analyzing and comparing more than a year’s complete and corrected submetered energy
data is a big challenge. Although the importance of data analysis is well acknowledged,
there is still no standard for it. Some methods are used and some charts are presented in
this paper for better and deeper analysis and benchmarking, through which we have
achieved some basic understanding of the difference of energy use between buildings in
the U.S. and China. However, more research is needed to develop a standard and
widespread methodology for building energy data analysis and benchmarking.
6. Conclusions
Existing energy monitoring platforms lack an industry standard in the whole process of
data collection and analysis. Especially, a standard data model is needed to describe the
hierarchy of energy end uses in buildings to support energy profiling, benchmarking, and
diagnostics. Good data is the foundation of building energy research. It requires better
and uniform methods to deal with all the issues involved in data collection, sharing and
retrieval, naming of data points, and handling of missing and poor quality data.
The detailed data analysis and benchmarking of the four office buildings demonstrated
that buildings in the U.S. and China performed very differently, had deep potential for
energy savings, but different efficiency measures should apply.
Ongoing research focuses on: (1) developing new data analytics, especially for energy
diagnostics; (2) benchmarking more office buildings with detailed end uses, and HVAC
operating and environmental conditions data; and (3) proposing retrofit measures to
building owners and energy efficiency guidance to building designers and operators.
Acknowledgements
This work was supported by the U.S.-China Clean Energy Research Center for Building Energy
Efficiency. The authors appreciate the building owners and facility managers for providing


![Jianjun Yuan arXiv:1901.07687v3 [cs.LG] 13 May 2019ONLINE ADAPTIVE PRINCIPAL COMPONENT ANALYSIS AND ITS EXTENSIONS A PREPRINT Jianjun Yuan Department of Electrical and Computer Engineering](https://static.documents.pub/doc/80x56/607037c6e485ac5ae2311e6b/jianjun-yuan-arxiv190107687v3-cslg-13-may-2019-online-adaptive-principal-component.jpg)


