COMPARISON OF CALCULATED A N D MEASURED CHARACTERISTICS OF HORIZONTAL MULTITUBE HEAT EXCHANGER WITH STEAM CONDENSING INSIDE TUBES Lewis Reseurch Center CZeveZund, Ohio , I ., (i-,;,,: ! , ,:I L,--,: ,'.', _, v v NATIONAL AERONAUTICS AND SPACE ADMINISTRATION WASHINGTON, D. C. OCTOBER 1966 I, https://ntrs.nasa.gov/search.jsp?R=19660029128 2020-03-20T22:17:18+00:00Z
Transcript
COMPARISON OF CALCULATED A N D MEASURED CHARACTERISTICS OF HORIZONTAL MULTITUBE HEAT EXCHANGER W I T H STEAM CONDENSING INSIDE TUBES
Lewis Reseurch Center CZeveZund, Ohio
, I . , (i-,;,,: ! , , : I L,--, : , ' . ' , _ ,
v v
N A T I O N A L AERONAUTICS A N D SPACE A D M I N I S T R A T I O N WASHINGTON, D. C . OCTOBER 1966 I,
I llllll I 11111 111 111 llll lllll1lll1111 0330692
NASA TN D-3670
COMPARISON O F CALCULATED AND MEASURED CHARACTERISTICS
O F HORIZONTAL MULTITUBE HEAT EXCHANGER WITH
STEAM CONDENSING INSIDE TUBES
By Harold H. Coe, Orlando A. Gutierrez, and David B. Fenn
Lewis Research Center Cleveland, Ohio
N A T I O N A L AERONAUTICS AND SPACE ADMINISTRATION
For sale by the Clearinghouse for Federal Scientific and Technical Information Springfield, Virginia 22151 - Price $2.00
COMPARISON OF CALCULATED AND MEASURED CHARACTERISTICS
OF HORIZONTAL MULTITUBE HEAT EXCHANGER WITH
STEAM CONDENSING INSIDE TUBES
by Harold H. Coe, Orlando A. Gutierrez, and David B. Fenn
Lewis Research Center
SUMMARY
As part of an overall research program of Rankine space power systems, a test fa- cility using water as the working fluid was constructed. One of the purposes of this facil- ity was to obtain experimental data on a convectively cooled, shell-and-tube condenser and to compare the resulting values with predicted values. all heat-transfer coefficient, the condensing length, and the overall pressure drop were determined over a range of condenser inlet pressures of 8 to 30 pounds per square inch absolute and vapor qualities of 40 to 100 percent with tube inlet vapor Reynolds numbers of 13 000 to 44 000. flow rate in the shell and with two set values of coolant inlet temperature.
The predicted overall coefficients and condensing lengths were calculated by using conventional correlations and equations. The predicted overall pressure drops included a calculation for the two-phase friction pressure drop that utilized an approximating equa- tion (derived in this report) based on the correlation of Lockhart and Martinelli.
Comparisons between the calculated and measured results were presented over a range of overall coefficients from 450 to 650 Btu per hour per square foot per O F , con- densing lengths from 10 to 110 inches, and overall pressure drops from 0.2 to 9 pounds per square inch. were within *20 percent of the measured values. within 50 to -20 percent of the measured data, with the largest deviations at the smaller pressure drops.
Measured values of the over-
The experimental condensing data were taken with a constant coolant
The predicted values of the overall coefficient and condensing length The predicted pressure drops were
INTRODUCTION
Considerable interest has been shown in the Rankine cycle turbogenerator system as a source of electrical power in space (ref. 1). In this system, a heat source, such as a nuclear reactor, is used to boil a working fluid. The vapor thus produced drives a tur- bine, and the turbine drives the generator which produces the electric power. The tur- bine exhaust vapor is then condensed and the working fluid returned to the boiler to com- plete the cycle.
To develop such a system, it became evident that more information was needed on the performance of a complete power system and on the behavior of the individual components. Likewise, it was important to determine how well the performance of these components could be predicted with existing correlations and theories.
power systems, a test facility using water as the working fluid was constructed (ref. 2) as a model of a similar alkali metal facility. The purpose of this water facility was to investigate the steady-state performance of a convectively cooled condenser system and to obtain a comparison of experimental data with predicted performance of the condenser. Results describing the operating characteristics of the complete system are presented in reference 2, and the results of an analysis of the condenser data are contained here- in.
inside the tubes. It was fabricated with small diameter tubes and was installed in a hori- zontal plane in order to minimize effects of gravity on its performance.
the overall heat- transfer coefficients, the condensing lengths, and the overall pressure drops with the corresponding predicted condenser characteristics. A discussion of the methods used to predict these values is also presented.
The experimental data were taken during the system performance tests described in reference 2, with a constant coolant flow rate in the shell, and two set values of coolant inlet temperature. The comparisons are presented over a range of pressure drops from 0.2 to 9.0 pounds per square inch differential, condensing lengths from 10 to 110 inches, and overall heat-transfer coefficients from 450 to 650 Btu per hour per square foot per
As part of the research program at the NASA Lewis Research Center of Rankine space
The condenser was a shell-and-tube heat exchanger with the water vapor condensing
Data a re presented to show the comparisons of experimentally determined values of
OF.
APPARATUS
Facility
The water system (described in detail in ref. 2) was composed of three complete
2
r Nitrogen supply
2 Temperature measurement
H Remotely adjustable’ Pressure pressure regulator measurement
r
I Orifice ?
Water
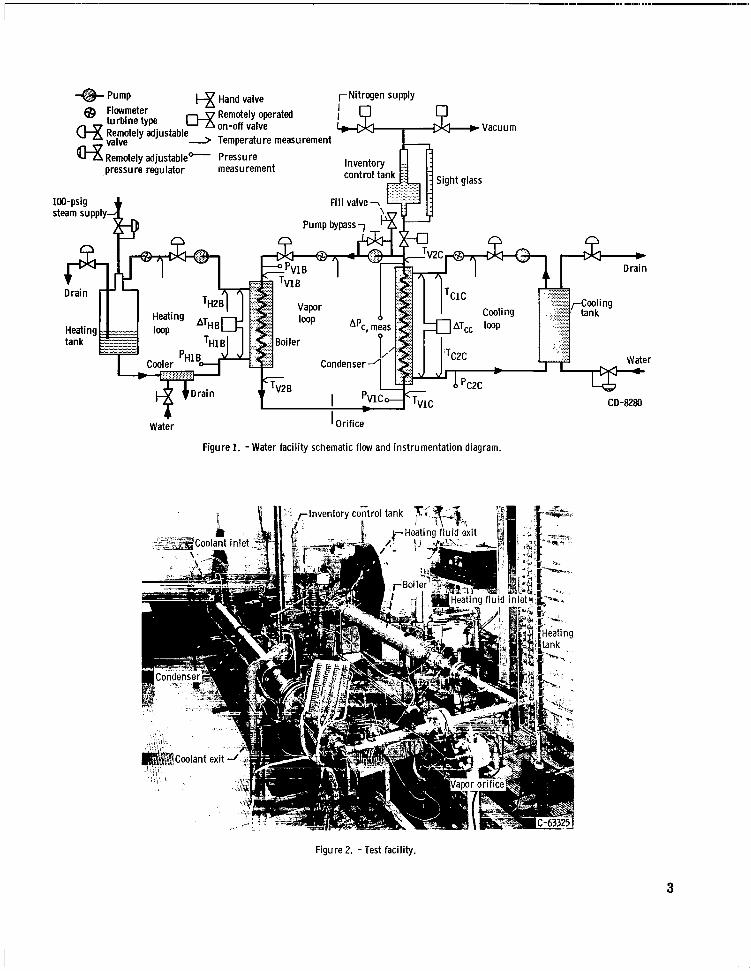
Figure 1. -Water facility schematic flow and instrumentation diagram.
Figure 2. -Test facility.
3
fluid circuits: a heating loop, a cooling loop, and a vapor loop. The heating loop supplied heat to boil the water in the vapor loop, and the cooling loop removed the heat of conden- sation and the necessary condensate subcooling from the vapor loop. A schematic flow diagram of the three loops is presented in figure 1. The symbols used are defined in appendix A. Also included in figure 1 a re the control and instrumentation locations. A photograph of the installation is shown in figure 2.
Condenser
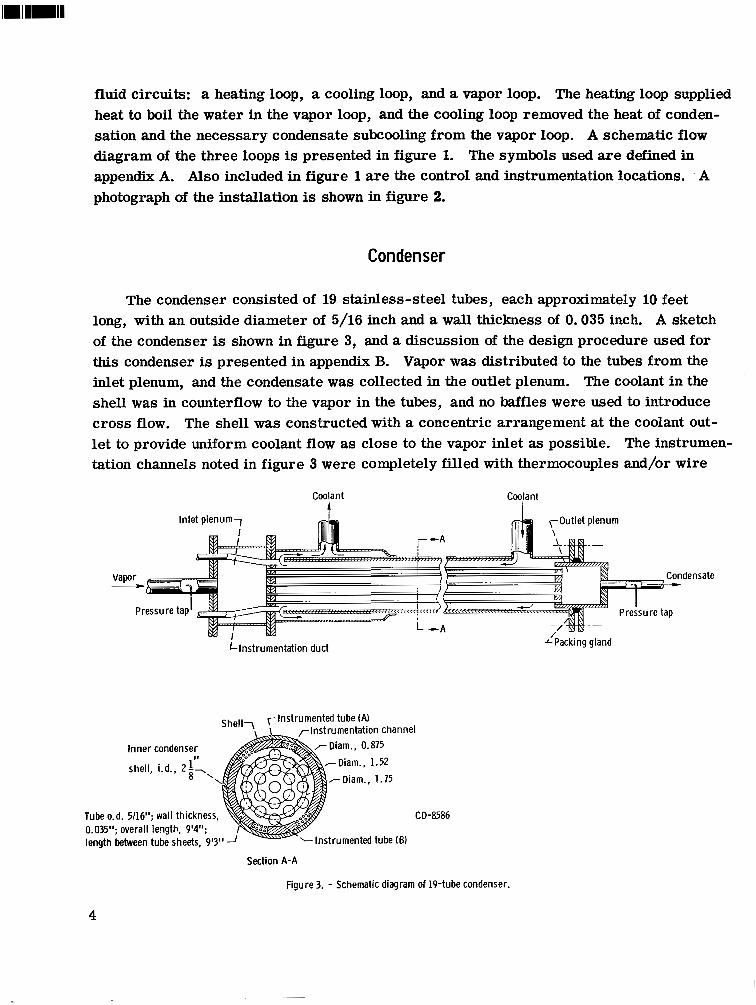
The condenser consisted of 19 stainless-steel tubes, each approximately 10 feet long, with an outside diameter of 5/16 inch and a wall thickness of 0.035 inch. A sketch of the condenser is shown in figure 3, and a discussion of the design procedure used for this condenser is presented in appendix B. Vapor was distributed to the tubes from the inlet plenum, and the condensate was collected in the outlet plenum. The coolant in the shell was in counterflow to the vapor in the tubes, and no baffles were used to introduce cross flow. The shell was constructed with a concentric arrangement at the coolant out- let to provide uniform coolant flow as close to the vapor inlet as possible. The instrumen- tation channels noted in figure 3 were completely filled with thermocouples and/or wire
Figure 3. - Schematic diagram of 19-tube condenser.
4
!mate
rods and soft solder to form a smooth inside diameter for the inner condenser shell.
lnstru mentat ion
The flow rate in each loop was measured with a turbine flowmeter placed near the pump outlet (fig. 1). Temperatures at the inlet and outlet of the boiler in the heating and vapor loops and at the inlet and outlet of the condenser in the vapor and cooling loops were measured with Chromel- Alumel thermocouples. These temperatures were read on a self - balancing potentiometer. The estimated accuracy of the reading was ,tZo F. The tem- perature changes of the heating fluid from the inlet to the outlet of the boiler and of the coolant from the inlet to the outlet of the condenser were also measured directly with dif- ferential Chromel- Alumel thermocouples and a precision potentiometer. The estimated accuracy of the reading was *2O F.
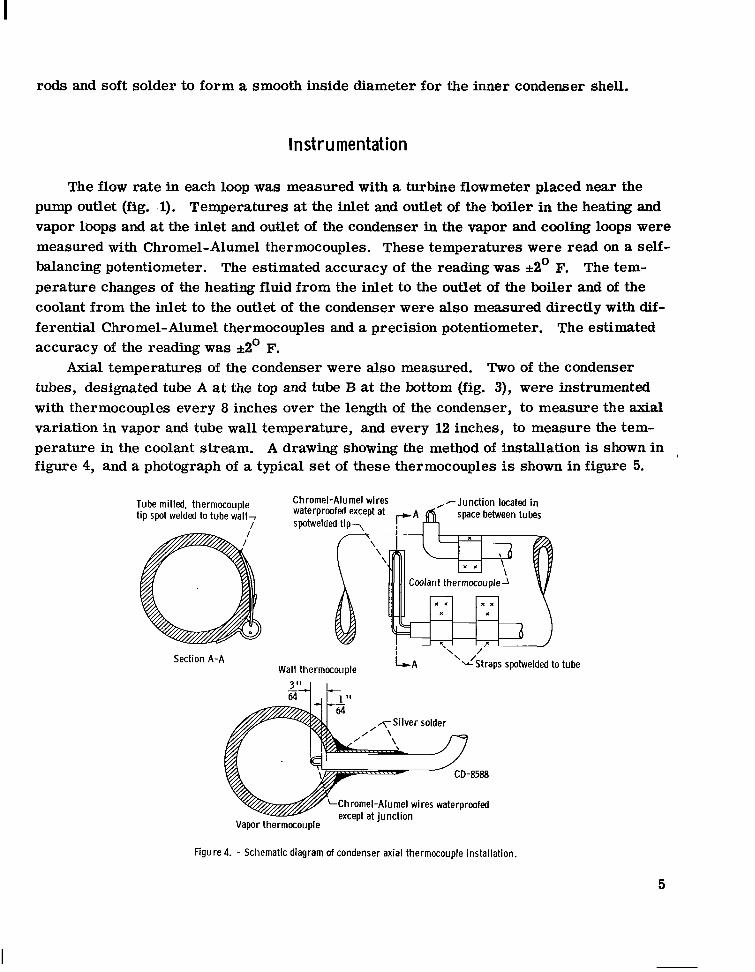
tubes, designated tube A a t the top and tube B a t the bottom (fig. 3), were instrumented with thermocouples every 8 inches over the length of the condenser, to measure the axial variation in vapor and tube wall temperature, and every 12 inches, to measure the tem- perature in the coolant stream. A drawing showing the method of installation is shown in , figure 4, and a photograph of a typical set of these thermocouples is shown in figure 5.
Axial temperatures of the condenser were also measured. Two of the condenser
Chromel-Alu me1 wires r'A &,-Junction located in space between tubes waterproofed except at Tube milled. thermocouple
tip spot welded to tube wall, I spotwelded tip,
Coolant thermocouple
Section A-A Wall thermocouDle
I \ /
L A Straps spotwelded to \ /
Ch romel-Alumel wires waterproofed exceot at iiinction r - . ..
Vapor thermocouple
tube
Figure 4. - Schematic diagram of condenser axial thermocouple installation.
5
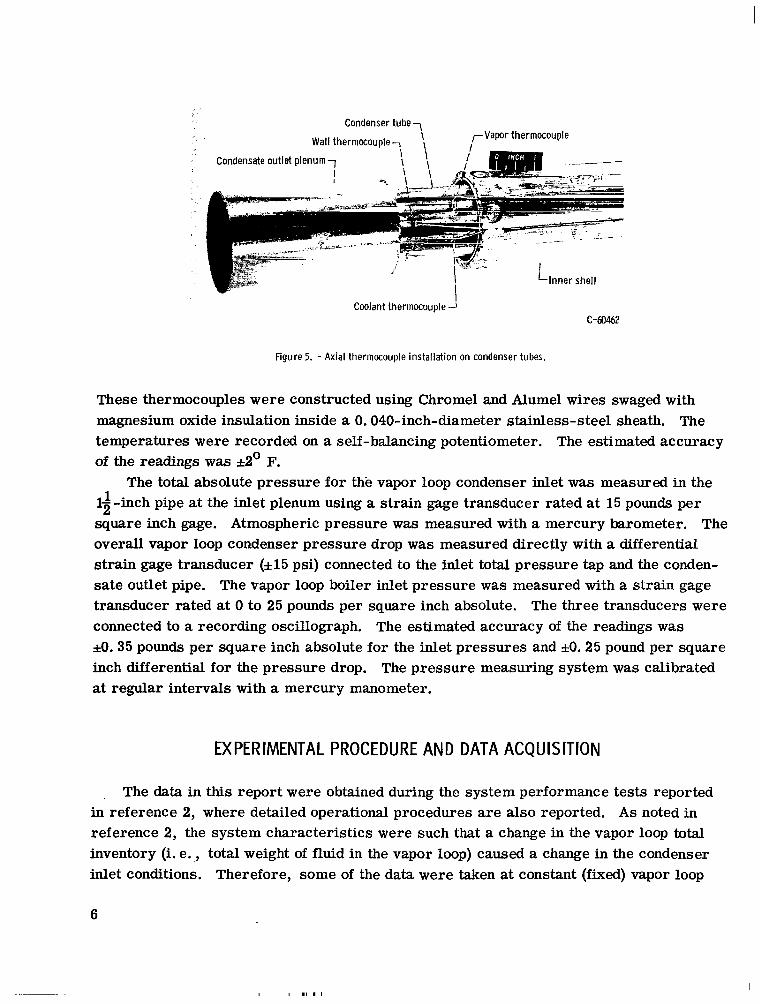
Condenser tube -, ,-Vapor thermocouple Wall thermocouple -, \ I
Coolant thermocouple 1 c-60462
Figure 5. - Axial thermocouple installation on condenser tubes.
These thermocouples were constructed using Chrome1 and Alumel wires swaged with magnesium oxide insulation inside a 0.040-inch-diameter stainless-steel sheath. The temperatures were recorded on a self -balancing potentiometer. The estimated accuracy of the readings was *2O F.
1s-inch pipe at the inlet plenum using a strain gage transducer rated at 15 pounds per square inch gage. Atmospheric pressure was measured with a mercury barometer. The overall vapor loop condenser pressure drop was measured directly with a differential strain gage transducer (i15 psi) connected to the inlet total pressure tap and the conden- sate outlet pipe. The vapor loop boiler inlet pressure was measured with a strain gage transducer rated at 0 to 25 pounds per square inch absolute. The three transducers were connected to a recording oscillograph. The estimated accuracy of the readings was *O. 35 pounds per square inch absolute for the inlet pressures and fO. 25 pound per square inch differential for the pressure drop. The pressure measuring system was calibrated at regular intervals with a mercury manometer.
The total absolute pressure for the vapor loop condenser inlet was measured in the 1
EXPERIMENTAL PROCEDURE AND DATA ACQUISITION
, The data in this report were obtained during the system performance tests reported in reference 2, where detailed operational procedures a re also reported. As noted in reference 2, the system characteristics were such that a change in the vapor loop total inventory (i. e. ,, total weight of fluid in the vapor loop) caused a change in the condenser inlet conditions. Therefore, some of the data were taken at constant (fixed) vapor loop
6
TABLE I. - RANGE O F TEST CONDITIONS
RUn
166 to 283
185 to 298
143 to 247
207 to 212
238 to 242
201 to 204
192 to 196
233 to 237
197 to 200
2 14
2 13
Average low rate,
1 b h
- wV’
.30 to 660
.30 to 650
200
235
280
315
385
470
650
Zondenser inlet
quality,
xO
78 to 100
67 to 100
87 to 100
86 to 100
72 to 100
79 to 100
54 to 100
69 to 88
40 to 61
Vapor loop
Condenser inlet
pressure,
PVlC’ psia
18.8 to 22.4
7 .8 to 18.3
LO. 9 to 30.6
12. 2 to 29.4
15. 2 to 29.9
15.7 to 28.4
18.4 to 30. 1
19.8 to 23.8
12.9 to 27.3
Condenser inlet vapor Reynolh number,
13 300 to 43 700
13 400 to 46 200
17 300 to 20 900
20 300 to 25 200
20 300 to 30 100
24 500 to 33 100
21 500 to 40 300
33 400 to 42 200
26 800 to 40 900
Inventorya (total vapor loop volume,
5.62 gal)
Fixed-number 1
Fixed-number 2
Variable (1. 23 to
Variable (1. 19 to
Variable (1. 31 to
Variable (1. 2 1 to
Variable (1. 21 to
Variable (1. 27 to
Variable (1.44 to
(1. 55 gal)
(1.40 gal)
1 .61 gal)
1.62 gal)
1.67 gal)
1.62 gal)
1.73 gal)
1.64 gal)
1.80 gal)
Cooling loop
Average low rate, -
wcJ lb/hr
6090
6040
6130
6120
6070
6170
6090
6080
5990
Condenser inlet
temperature,
TCIC’ F 0
92
92
120
v aAt room temperature.
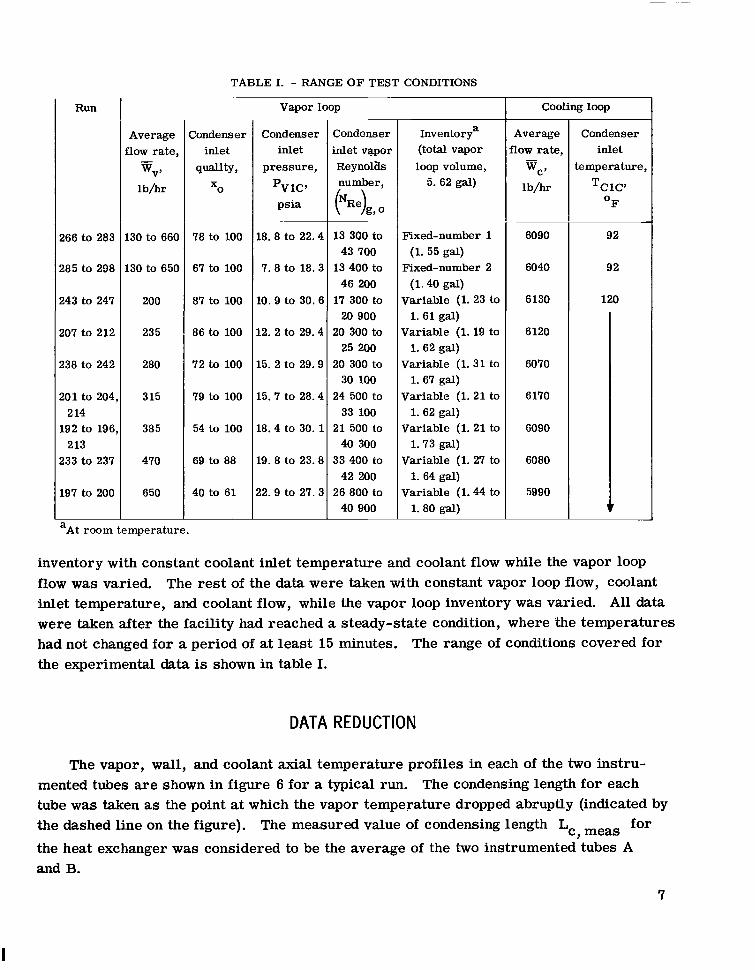
inventory with constant coolant inlet temperature and coolant flow while the vapor loop flow was varied. The rest of the data were taken with constant vapor loop flow, coolant inlet temperature, and coolant flow, while the vapor loop inventory was varied. All data were taken after the facility had reached a steady-state condition, where ‘the temperatures had not changed for a period of at least 15 minutes. The range of conditions covered for the experimental data is shown in table I.
DATA REDUCTION
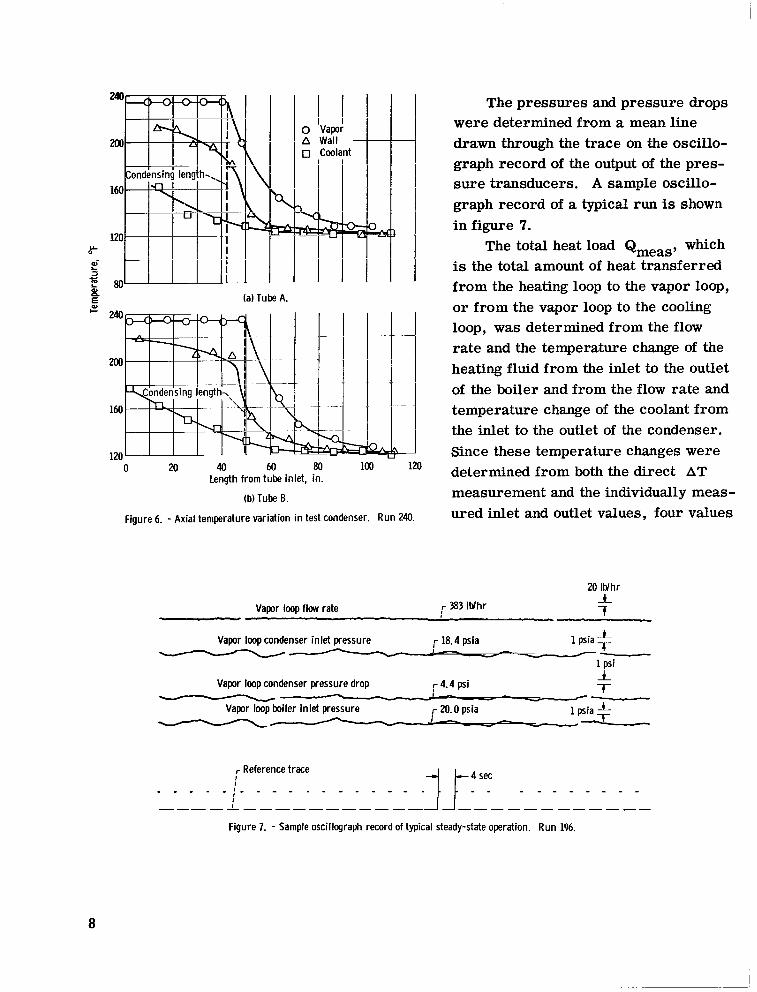
The vapor, wall, and coolant axial temperature profiles in each of the two instru- mented tubes are shown in figure 6 for a typical run. The condensing length for each tube was taken as the point at which the vapor temperature dropped abruptly (indicated by the dashed line on the figure). The measured value of condensing length Lc, meas for the heat exchanger was considered to be the average of the two instrumented tubes A and B.
7
I
E (a) Tube A.
240
200
160
120 0 M 40 60 80 100 120
Length from tube inlet, in.
(b) Tube B.
ti 1 1 1.- J I I
Figure 6. - Axial temperature variation in test condenser. Run 240.
The pressures and pressure drops were determined from a mean line drawn through the trace on the oscillo- graph record of the output of the pres- sure transducers. A sample oscillo- graph record of a typical run is shown in figure 7.
The total heat load QmeaS, which is the total amount of heat transferred from the heating loop to the vapor loop, or from the vapor loop to the cooling loop, was determined from the flow rate and the temperature change of the heating fluid from the inlet to the outlet of the boiler and from the flow rate and temperature change of the coolant from the inlet to the outlet of the condenser. Since these temperature changes were determined from both the direct A T measurement and the individually meas- ured inlet and outlet values, four values
Figure 7. - Sample oscillograph record of typical steady-state operation. Run 1%.
8
of total heat load were computed. Less than 10 percent difference existed among these values, however, and the measured value of the total heat load was taken as the average of the four calculations. The heat losses from the facility were negligible.
The vapor quality at the boiler outlet and at the condenser inlet were computed from heat balances in the boiler and condenser, respectively, using the four values of total heat load. For example, for the condenser, one value of the quality would be
Again, the difference among the values was small (< 10 percent), and the average of the four calculations was taken as the experimental value for the vapor quality at the con- denser inlet xo.
The condensing heat load then was
and the subcooling heat load was
Qsc = Qmeas - Qc (3)
The experimental value of the overall heat-transfer coefficient Ui, Meas (over the condensing portion of the heat exchanger) was computed from the following equation:
Q,
where
and
AT^^,
L - - ui, c, meas
Ahi, cATLM, c
Ahi, c NlrDiLc, meas
(4)
9
Vapor ?:=:,:.? ii+t.-ci..--. Condensate
w,-
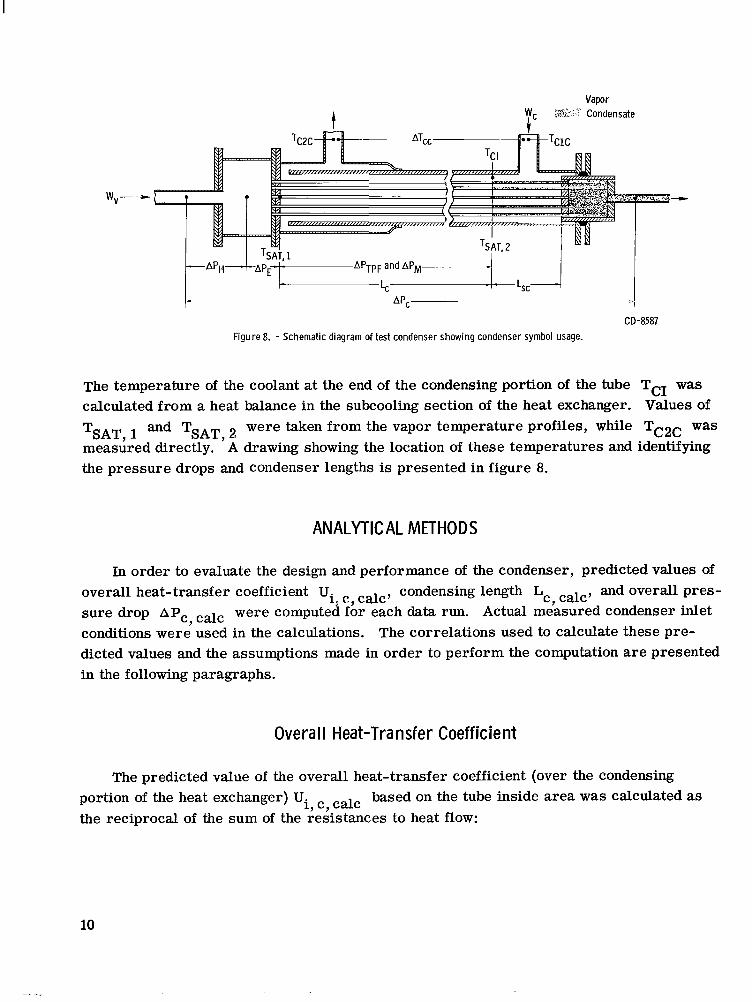
CD-8587 Figure 8. - Schematic diagram of test condenser showing condenser symbol usage.
The temperature of the coolant at the end of the condensing portion of the tube TCI was calculated from a heat balance in the subcooling section of the heat exchanger. Values of
measured directly. A drawing showing the location of these temperatures and identifying the pressure drops and condenser lengths is presented in figure 8.
were taken from the vapor temperature profiles, while TCZC was T ~ ~ ~ , 1 and T ~ ~ ~ , 2
ANALYTICAL METHODS
In order to evaluate the design and performance of the condenser, predicted values of overall heat-transfer coefficient Ui, c., talc, condensing length Lc, calc, and overall pres- sure drop AP,, talc were computed for each data run. Actual measured condenser inlet conditions were used in the calculations. The correlations used to calculate these pre- dicted values and the assumptions made in order to perform the computation are presented in the following paragraphs.
Overa I I Heat-Tra n sfer Coefficient
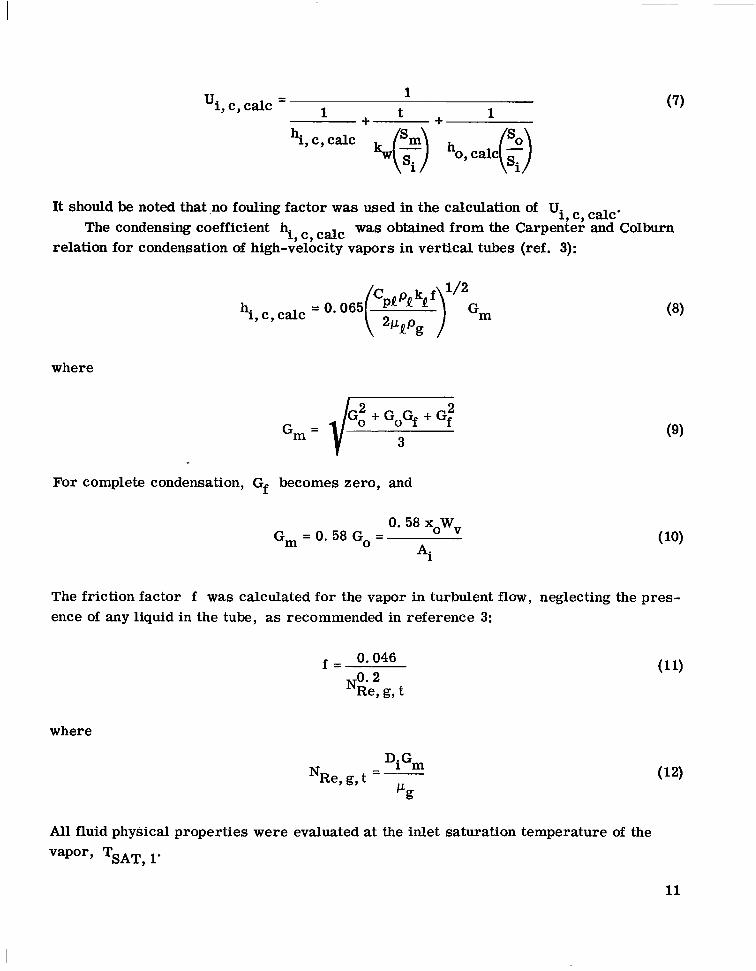
The predicted value of the overall heat-transfer coefficient (over the condensing portion of the heat exchanger) Ui, c, talc based on the tube inside area was calculated as the reciprocal of the sum of the resistances to heat flow:
10
- 1 - 1 ui, c, calc (7)
It should be noted that no fouling factor was used in the calculation of Ui, c, talc.
relation for condensation of high-velocity vapors in vertical tubes (ref. 3): The condensing coefficient hi, c , talc was obtained from the Carpenter and Colburn
where
- - hi, c, calc
Gm =
P + G F + G f 2
For complete condensation, Gf becomes zero, and
0. 58 xoWv
Ai G, = 0.58 Go =
(9)
The friction factor f was calculated for the vapor in turbulent flow, neglecting the pres- ence of any liquid in the tube, as recommended in reference 3:
0.046 0.2
f =
" g, t where
- NRe, g, t -
DiGm
All fluid physical properties were evaluated at the inlet saturation temperature of the vapor, T ~ ~ ~ , 1-
11
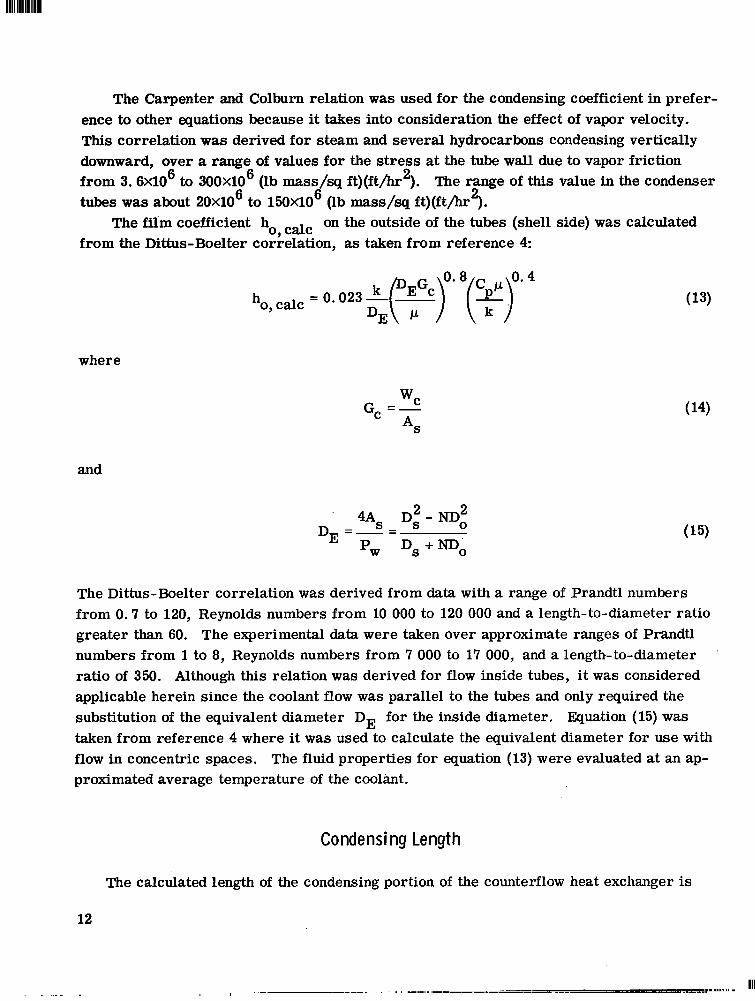
The Carpenter and Colburn relation was used for the condensing coefficient in prefer- ence to other equations because it takes into consideration the effect of vapor velocity. This correlation was derived for steam and several hydrocarbons condensing vertically downward, over a range of values for the stress at the tube wall due to vapor friction from 3. 6X10⁶ to 3O0X1O6 (lb mass/sq ft)(ft/hr2). The range of this value in the condenser tubes was about 20X106 to 1 5 0 ~ 1 0 ~ (lb mass/sq ft)(ft/hrg.
from the Dittus-Boelter correlation, as taken from reference 4: The film coefficient ho, talc on the outside of the tubes (shell side) was calculated
ho, calc = 0.023 - k cF)o*8r<r*4 -
DE
where
wC
AS Gc =-
and
pw Ds+mo -r;
The Dittus-Boelter correlation was derived from data with a range of Prandtl numbers from 0.7 to 120, Reynolds numbers from 10 000 to 120 000 and a length-to-diameter ratio greater than 60. The experimental data were taken over approximate ranges of Prandtl numbers from 1 to 8, Reynolds numbers from 7 000 to 17 000, and a length-to-diameter ratio of 350. Although this relation was derived for flow inside tubes, i t was considered applicable herein since the coolant flow was parallel to the tubes and only required the substitution of the equivalent diameter DE for the inside diameter. Equation (15) was taken from reference 4 where it was used to calculate the equivalent diameter for use with flow in concentric spaces. The fluid properties for equation (13) were evaluated at an ap- proximated average temperature of the coolimt.
Co nde nsi ng Length
The calculated length of the condensing portion of the counterflow heat exchanger is
12
... - .
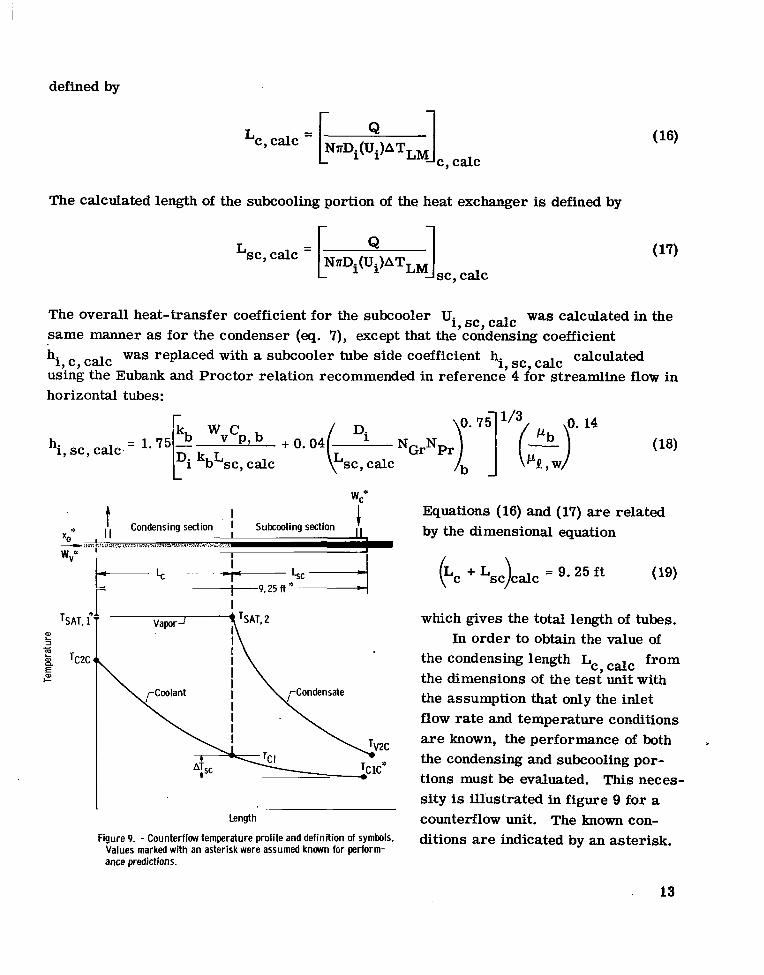
defined by
Lc9 talc NnDi(Ui)ATLM = [ The calculated length of the subcooling portion of the heat exchanger is defined by
Q
sc, calc
The overall heat-transfer coefficient for the subcooler Ui, sc, talc was calculated in the same manner as for the condenser (eq. 7), except that the condensing coefficient hi, c, calc was replaced with a subcooler tube side coefficient hi, sc, talc calculated using the Eubank and Proctor relation recommended in reference 4 for streamline flow in horizontal tubes: -
hi, sc, talc. = '.$ w v C p ~ b +0.04 Di kbLsc, calc L
4 I I Condensing section ' I Subcooling section
X^* I I
i 1 9 . 2 5 ft - r
Length
Figure 9. - Counterflw temperature profile and definition of symbols. Values marked with an asterisk were assumed k n w n for perform- ance predictions.
I
Equations (16) and (17) are related by the dimensional equation
(Lc + Lsc)calc = 9.25 f t ( 19)
which gives the total length of tubes. In order to obtain the value of
the condensing length Lc, talc from the dimensions of the test unit with the assumption that only the inlet flow rate and temperature conditions are known, the performance of both the condensing and subcooling por- tions must be evaluated. This neces- sity is illustrated in figure 9 for a counterflow unit. The known con- ditions are indicated by an asterisk.
_.
13
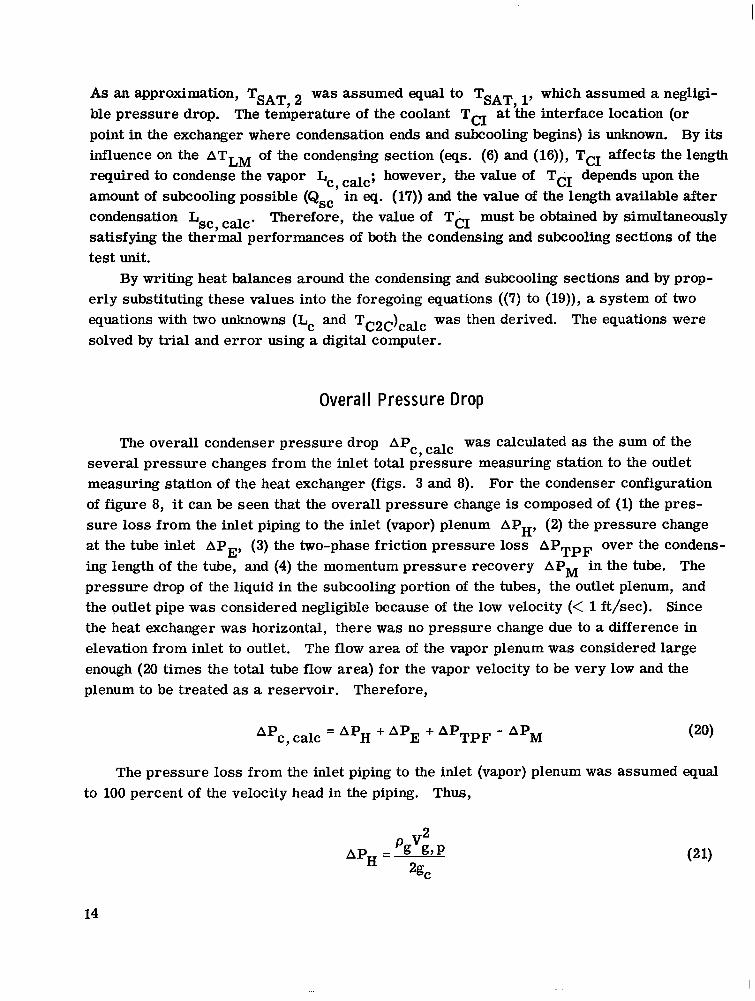
As an approximation, TSAT, was assumed equal to TSAT, 1, which assumed a negligi- ble pressure drop. The temperature of the coolant TCI at the interface location (or point in the exchanger where condensation ends and subcooling begins) is unknown. By its influence on the ATLM of the condensing section (eqs. (6) and (16)), TCI affects the length required to condense the vapor Lc, talc; however, the value of TeI depends upon the amount of subcooling possible (Qsc in eq. (17)) and the value of the length available after condensation Lsc, talc. Therefore, the value of TCI must be obtained by simultaneously satisfying the thermal performances of both the condensing and subcooling sections of the test unit.
By writing heat balances around the condensing and subcooling sections and by prop- erly substituting these values into the foregoing equations ((7) to (19)), a system of two equations with two unknowns (Lc and TC2C)cdc was then derived. The equations were solved by trial and error using a digital computer.
Overall Pressure Drop
The overall condenser pressure drop APc, talc was calculated as the sum of the several pressure changes from the inlet total pressure measuring station to the outlet measuring station of the heat exchanger (figs. 3 and 8). For the condenser configuration of figure 8, it can be seen that the overall pressure change is composed of (1) the pres- sure loss from the inlet piping to the inlet (vapor) plenum APH, (2) the pressure change at the tube inlet APE, (3) the two-phase friction pressure loss APTpF over the condens- ing length of the tube, and (4) the momentum pressure recovery APM in the tube. The pressure drop of the liquid in the subcooling portion of the tubes, the outlet plenum, and the outlet pipe was considered negligible because of the low velocity (< 1 ft/sec). Since the heat exchanger was horizontal, there was no pressure change due to a difference in elevation from inlet to outlet. The flow area of the vapor plenum was considered large enough (20 times the total tube flow area) for the vapor velocity to be very low and the plenum to be treated as a reservoir. Therefore,
= A P + A P E + APTpF - APM "c, calc H
The pressure loss from the inlet piping to the inlet (vapor) plenum was assumed equal to 100 percent of the velocity head in the piping. Thus,
2 A P H - - pgvg, P
2gC
14
.. , ,, ., .-.-.,,.....,,., ....,..,..,. ,,, . ,, . I I , I
The vapor density w a s based on the measured total pressure in the pipe. Since the veloc- i ty head in the piping was very small, the static pressure was very nearly equal to the total pressure in the pipe, and the error in vapor density was considered negligible.
The pressure change at the tube inlet was taken as one velocity head plus an assumed loss of 10 percent of the velocity head in the tube at the inlet due to the entrance configura- tion. Selection of the nominal loss of 10 percent was based on the single-phase pressure loss values of reference 5. velocity head was normally less than 5 percent (6.7 percent maximum) of the static pres- sure at the tube inlet. Thus,
The flow was considered virtually incompressible since the
The vapor density was based on the calculated static pressure in the inlet plenum. (Since the velocity of the vapor in the plenum was negligible, the static pressure was considered equal to the total pressure. )
Several methods have been proposed for the calculation of the friction pressure drop with two-phase flow inside horizontal tubes. The most widely used of these methods are based on the Lockhart-Martinelli correlation for isothermal two-phase, two-component flow (ref. 6). Use of this correlation to calculate the friction pressure drop during con- densing requires a time-consuming, step-by-step solution. An approximating equation based on reference 6 was presented by Coombs, Stone, and Kapus (ref. 7) for the viscous liquid-turbulent gas flow regime. Their equation assumed a vapor quality of 100 percent at the condenser tube inlet. In appendix C of the present report, approximating equations for both the viscous-liquid - turbulent-gas and the turbulent-liquid - turbulent-gas re- gimes, which include the inlet quality as a variable, a r e derived for the friction pressure drop of two-phase condensing flow in a manner similar to that of reference 7.
The two-phase friction pressure loss over the condensing length of the tube was cal- culated by using the derived approximating equations as turbulent-gas regime,
- 'yvsvw;. (.pTpF)VT- N1.7 4.7
Di
which for the condenser used in this report is evaluated
follows: For the viscous-liquid -
LC
as
15
For the turbulent-liquid - turbulent-gas regime,
LC
which for the condenser used in this report is evaluated as
7 LC
8 LC
The fluid properties were based on the calculated tube inlet static pressure. It should be noted that both the measured and calculated values of condensing length Lc, meas and
and two values for the calculated overall pressure drop APc, talc. were used for the calculation of APTpF. This yielded two values for APTpF Lc, calc
The momentum pressure recovery was calculated from the standard relation
3
The vapor density was based on the calculated tube inlet static pressure.
RESULTS AND DISCUSSION
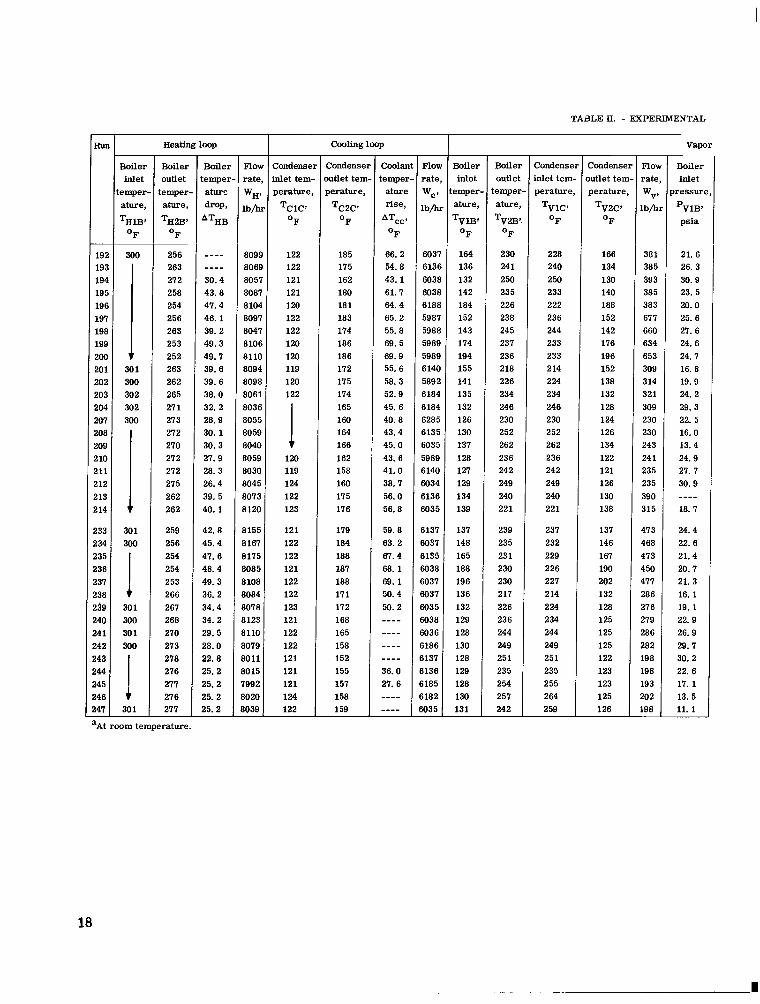
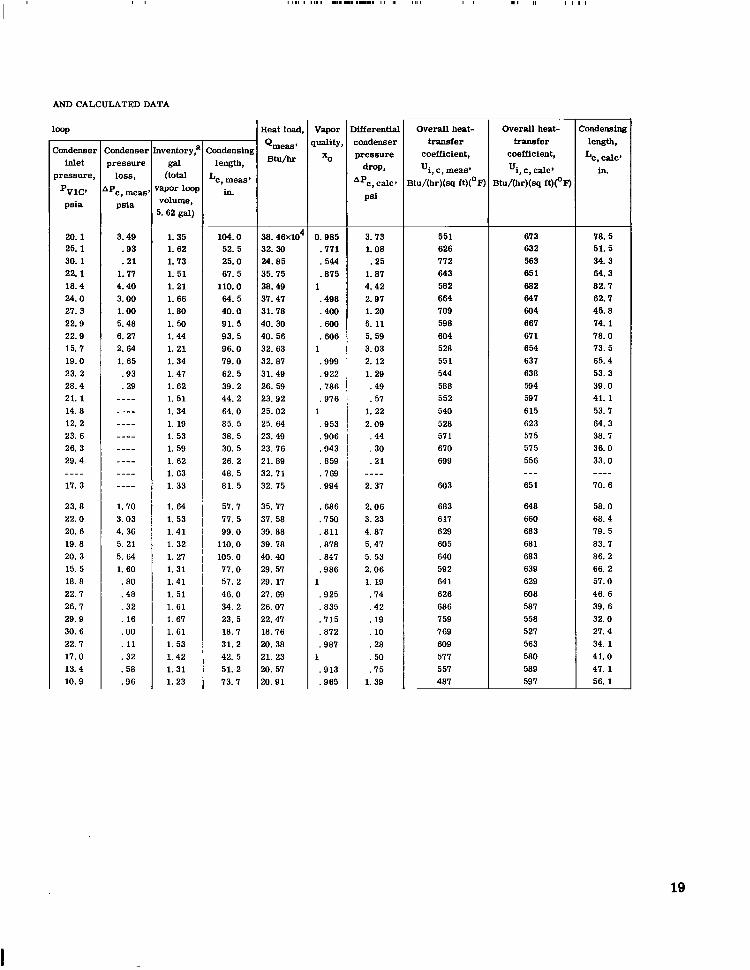
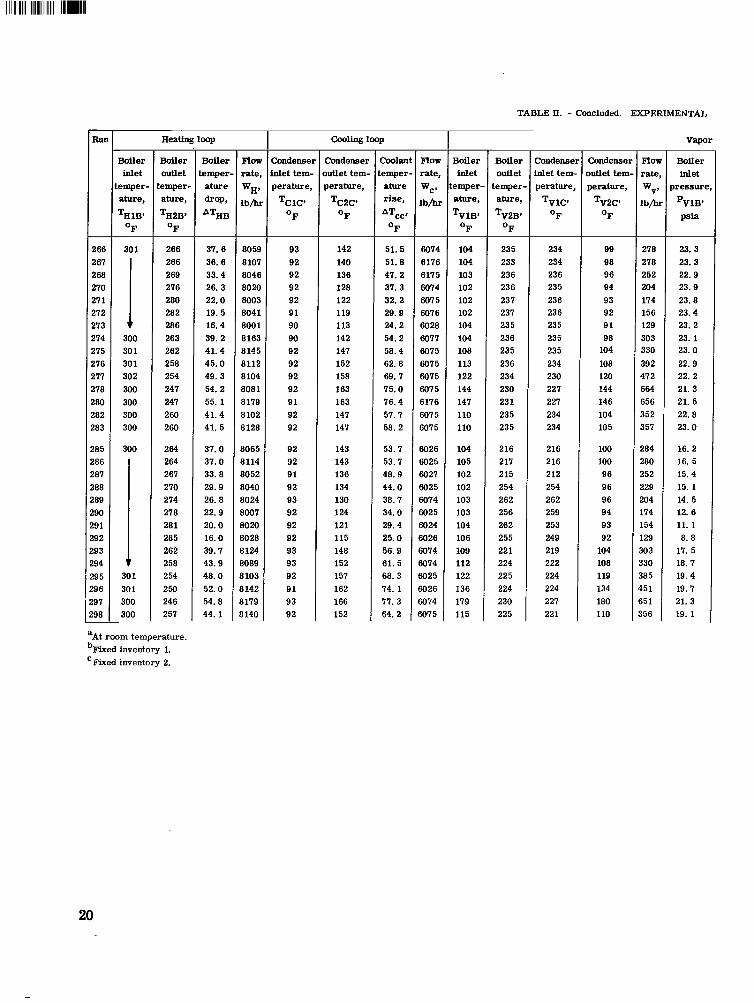
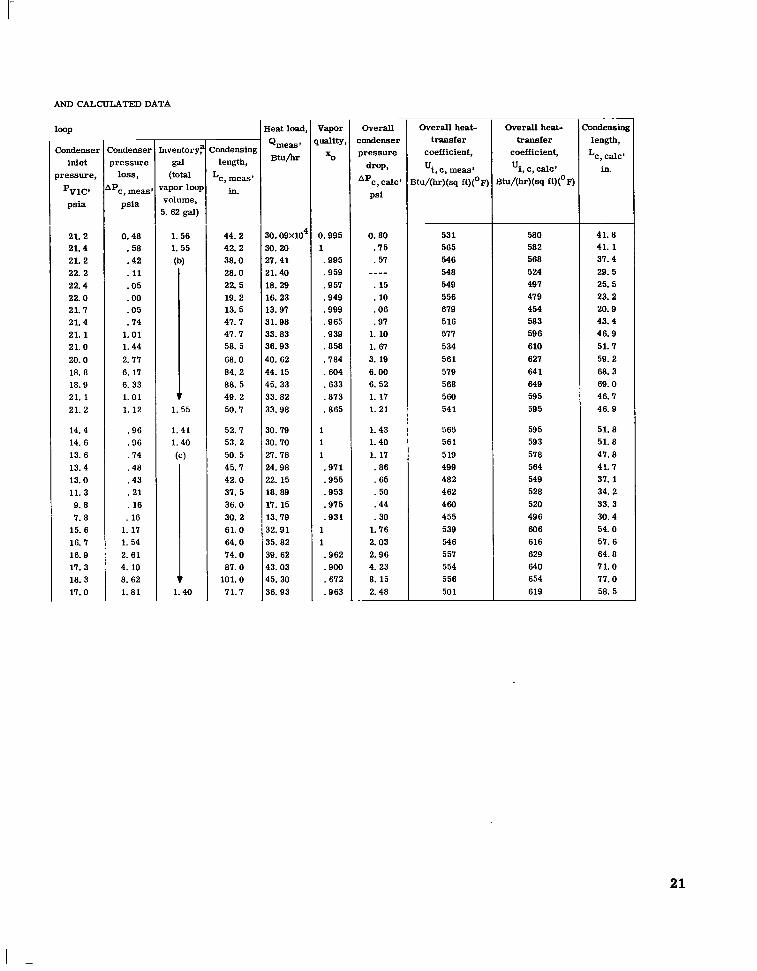
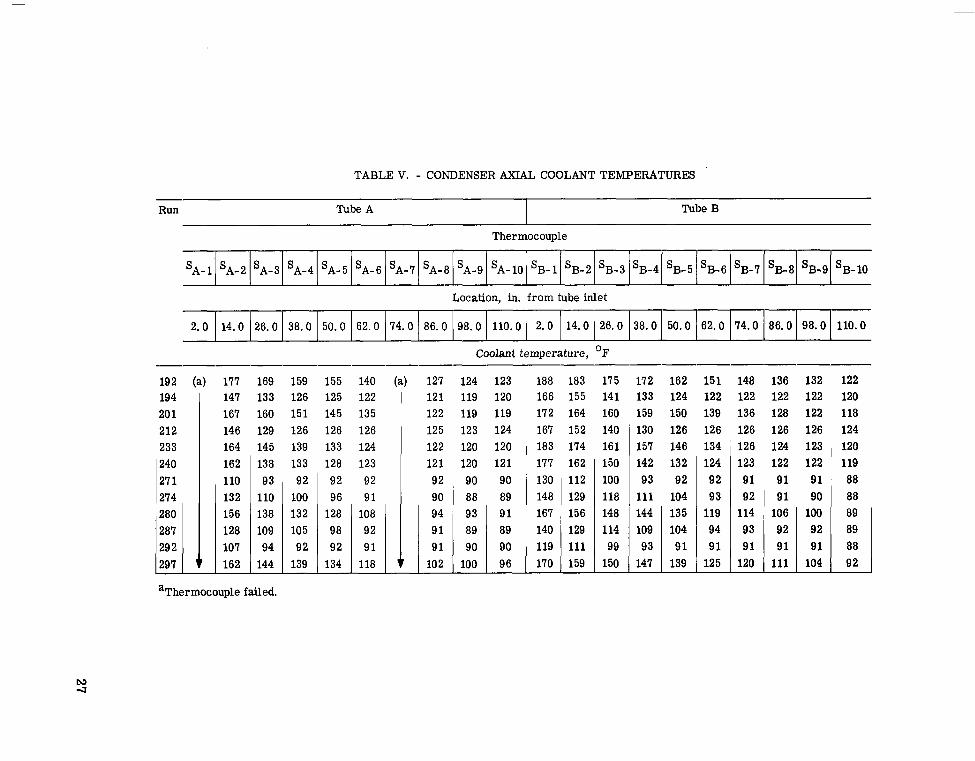
The experimental data consisting of the flow rates, the inlet and outlet temperatures and pressures in the heating, vapor, and coolant loops measured at the locations shown in figure 1 (p. 3) are tabulated in table II. Also shown in table II are the experimental values determined for the condensing length Lc, meas, the heat load QmeaS, the vapor quality xo, and the overall heat-transfer coefficient Ui, c, meas, as well as the predicted
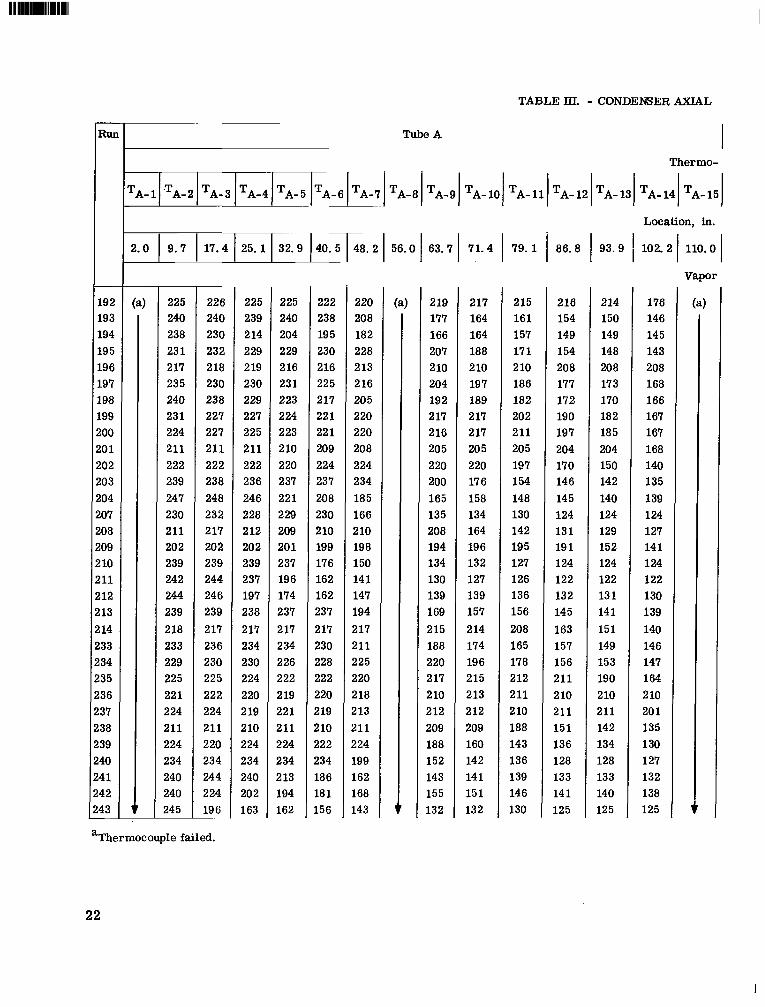
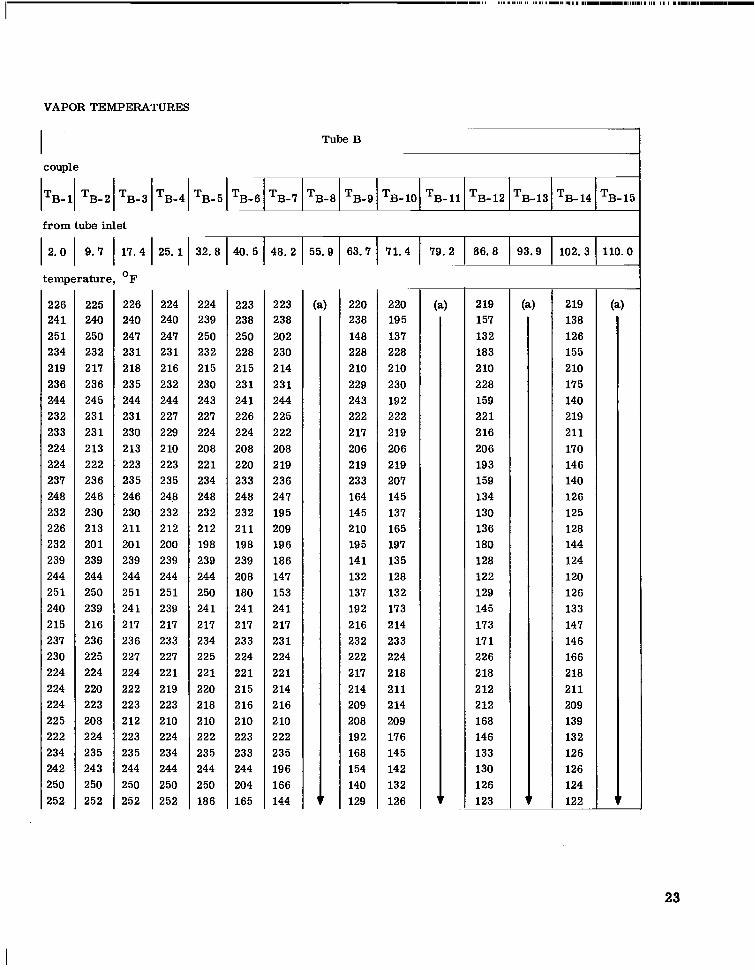
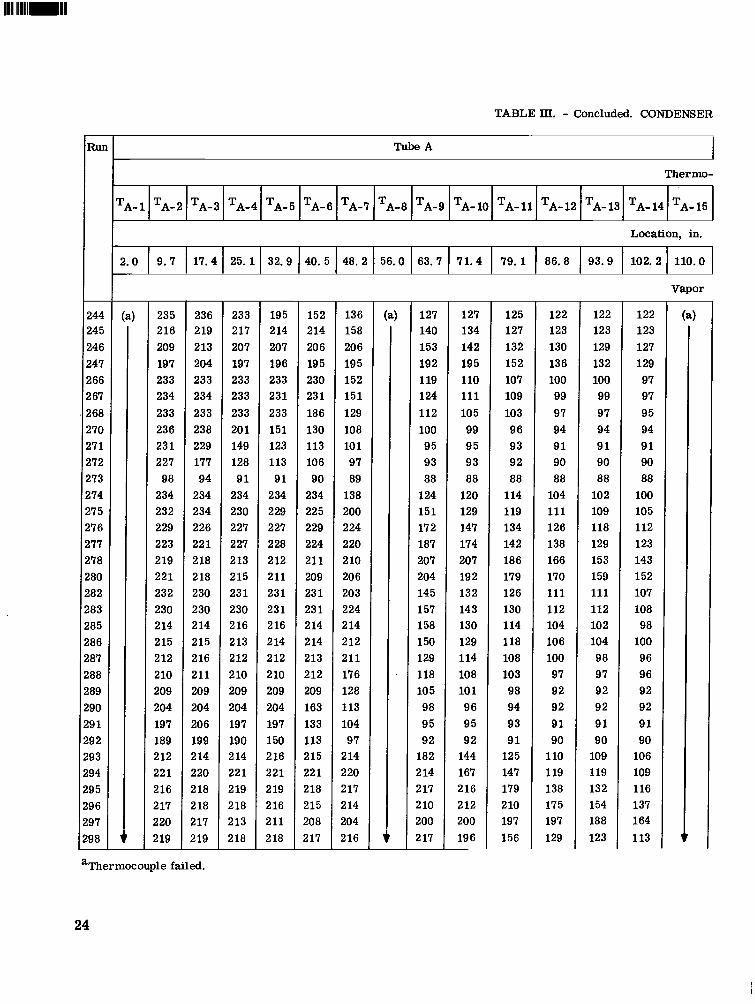
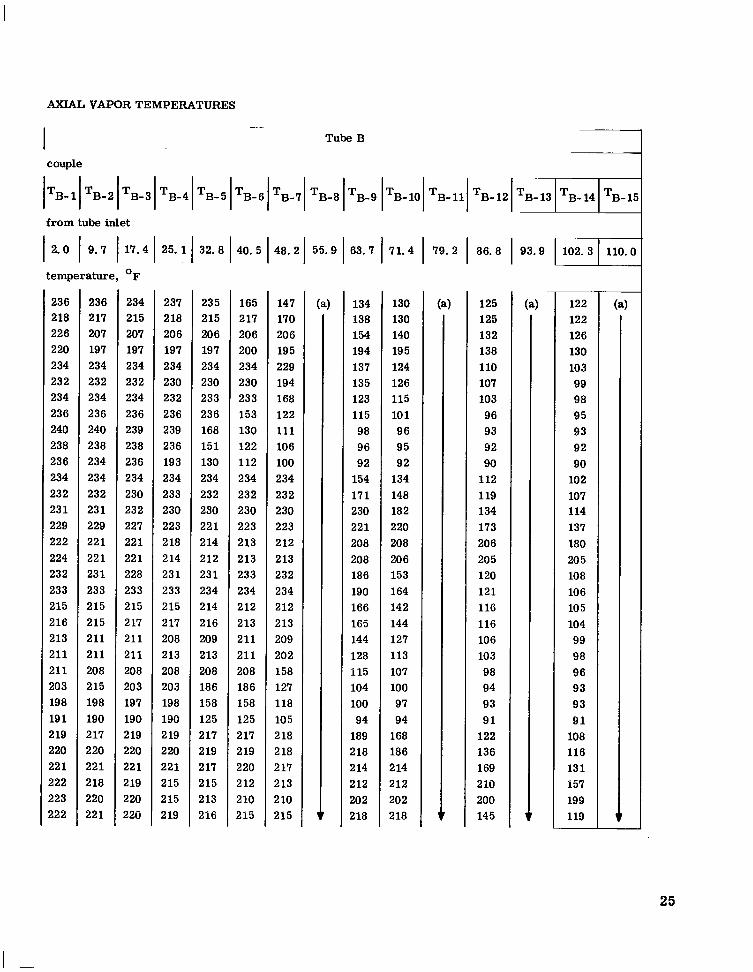
values of Ui, c, talc, Lc,calc' and Apc,calc' The experimental data from the axial temperature profile thermocouples on the two
instrumented tubes (tubes A and B) are tabulated in table III for the vapor temperatures
16
al
8 (a) Inventory l(1.55 gal). Runs 266 to 283. zi -20 percent
value 1 0 Measured (eq. (4)) Calculated (eq. (7))
I I I I I I
Vapor loop vapor flow rate, xoWv, ltihr
-----
200 300 400 500 t Too (b) Inventory 2 (1.40 gal). Runs 285 to 298.
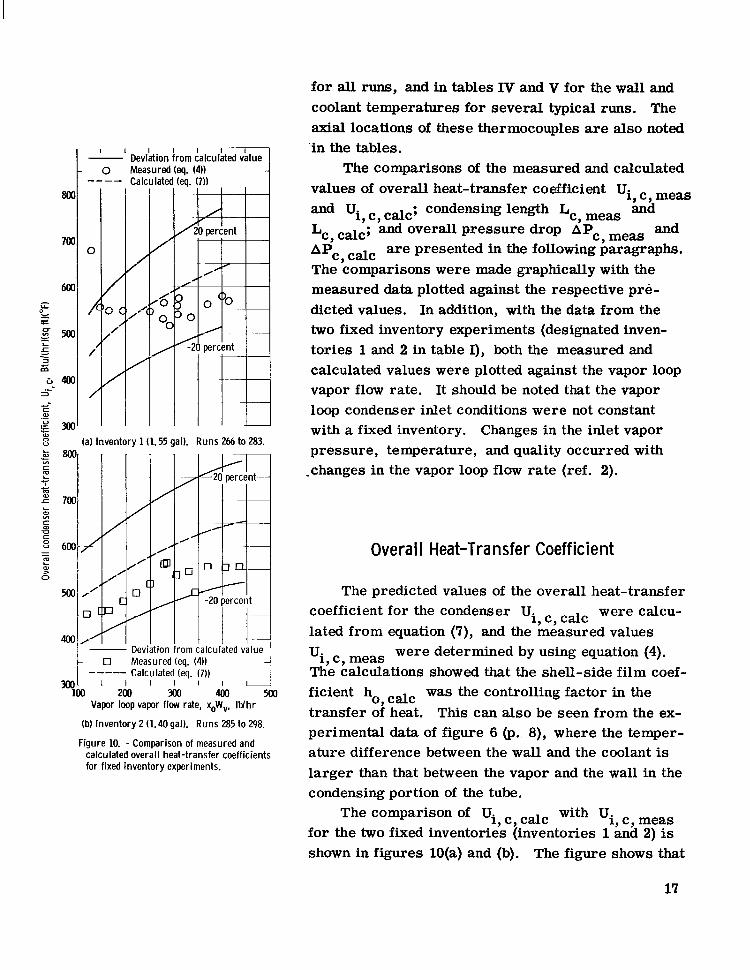
Figure 10. - Comparison of measured and calculated overall heat-transfer coefficients for fixed inventory experiments.
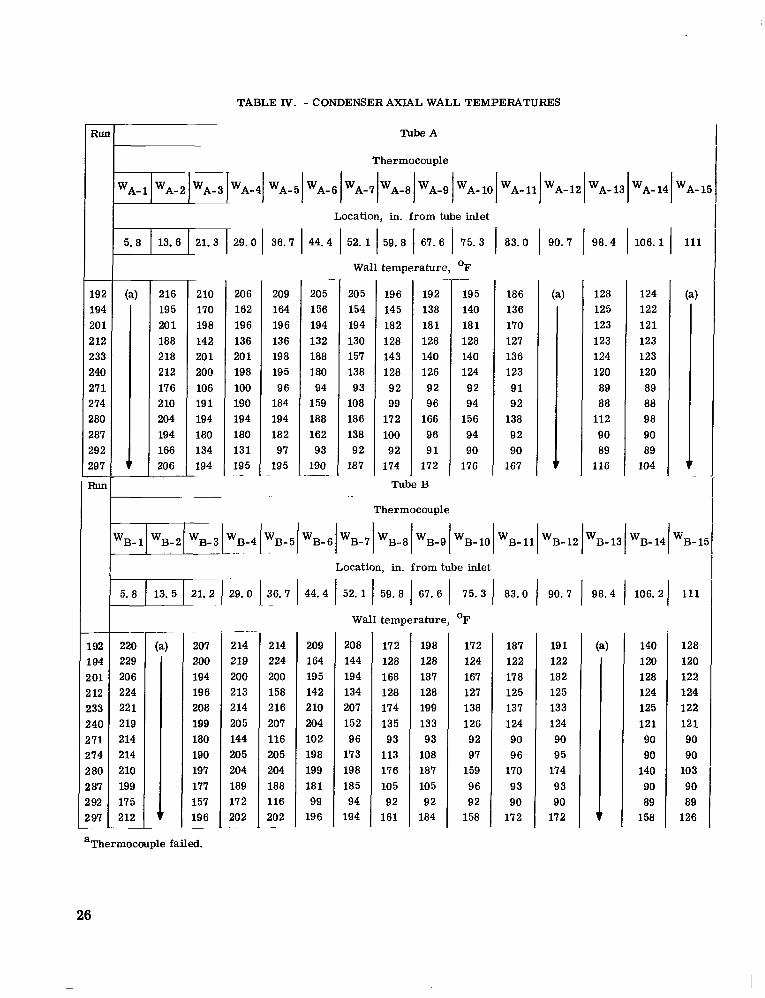
for all runs, and in tables IV and V for the wall and coolant temperatures for several typical runs. The axial locations of these thermocouples are also noted 'in the tables.
The comparisons of the measured and calculated values of overall heat-transfer coefficient Ui, c, meas and Ui, c, talc; condensing length L,, meILs and L,, talc; and overall pressure drop APc, meas and
are presented in the following paragraphs. The comparisons were made graphically with the measured data plotted against the respective pre- dicted values. In addition, with the data from the two fixed inventory experiments (designated inven- tories 1 and 2 in table I), both the measured and calculated values were plotted against the vapor loop vapor flow rate. It should be noted that the vapor loop condenser inlet conditions were not constant with a fixed inventory. Changes in the inlet vapor pressure, temperature, and quality occurred with .changes in the vapor loop flow rate (ref. 2).
A%, calc
Overall Heat-Transfer Coefficient
The predicted values of the overall heat-trans er coefficient for the condenser Ui, c, talc were calcu- lated from equation (7), and the measured values
Ui, c , meas The calculations showed that the shell-side film coef- ficient ho, talc was the controlling factor in the transfer of heat. This can also be seen from the ex- perimental data of figure 6 (p. 8) , where the temper- ature difference between the wall and the coolant is larger than that between the vapor and the wall in the condensing portion of the tube.
with 'i, c, meas for the two fixed inventories (inventories 1 and 2) is shown in figures lO(a) and (b). The figure shows that
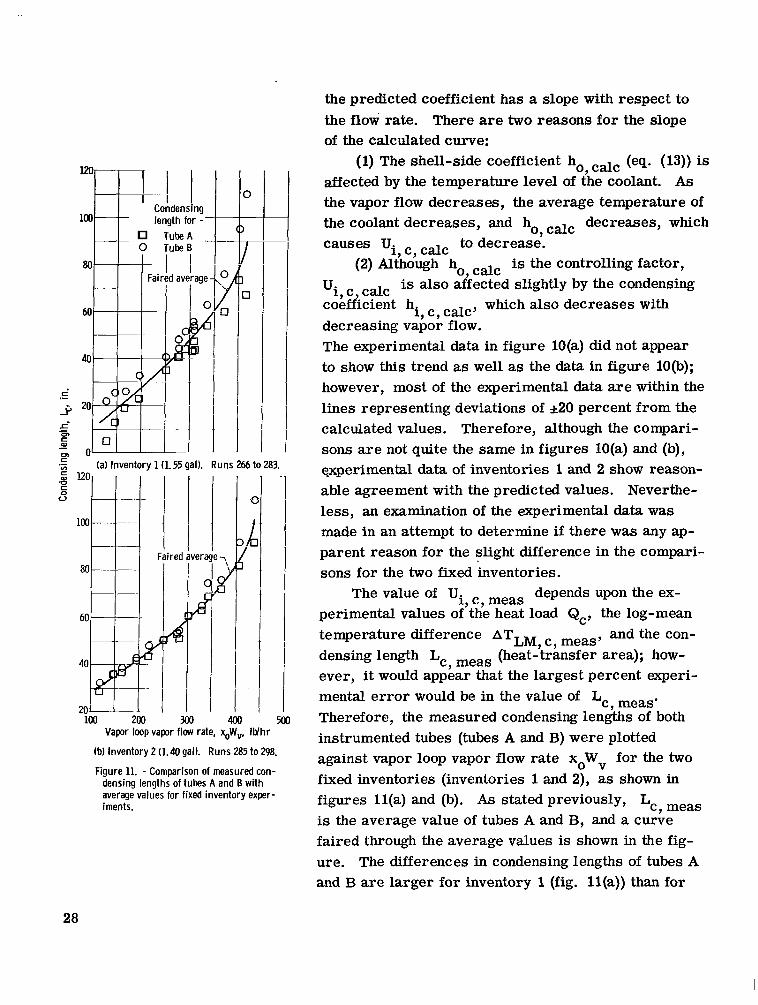
Figure 11. - Comparison of measured con- densing lengths of tubes A and B with average values for fixed inventory exper- iments.
the predicted coefficient has a slope with respect to the flow rate. There are two reasons for the slope of the calculated curve:
(1) The shell-side coefficient hot talc (eq. (13)) is affected by the temperature level of the coolant. As the vapor flow decreases, the average temperature of the coolant decreases, and ho, talc decreases, which
(2) Although ho, talc is the controlling factor, 'i, c, calc to decrease.
is also affected slightly by the condensing 'i,c calc coefficient hi, c, talc, which also decreases with decreasing vapor flow. The experimental data in figure lO(a) did not appear to show this trend as well as the data in figure lO(b); however, most of the experimental data a re within the lines representing deviations of *20 percent from the calculated values. Therefore, although the compari- sons a re not quite the same in figures lO(a) and (b), experimental data of inventories 1 and 2 show reason- able agreement with the predicted values. Neverthe- less, an examination of the experimental data was made in an attempt to determine if there was any ap- parent reason for the slight difference in the compari- sons for the two f ixed inventories.
perimental values of the heat load Qc, the log-mean temperature difference ATLM, c, and the con- densing length Lc, meas (heat- transfer area); how- ever, it would appear that the largest percent experi- mental error would be in the value of L,, me;ts. Therefore, the measured condensing lengths of both instrumented tubes (tubes A and B) were plotted against vapor loop vapor flow rate xoWv for the two fixed inventories (inventories 1 and 2), as shown in figures ll(a) and (b). As stated previously, Lc, meas is the average value of tubes A and B, and a curve faired through the average values is shown in the fig- ure. The differences in condensing lengths of tubes A and B are larger for inventory 1 (fig. ll(a)) than for
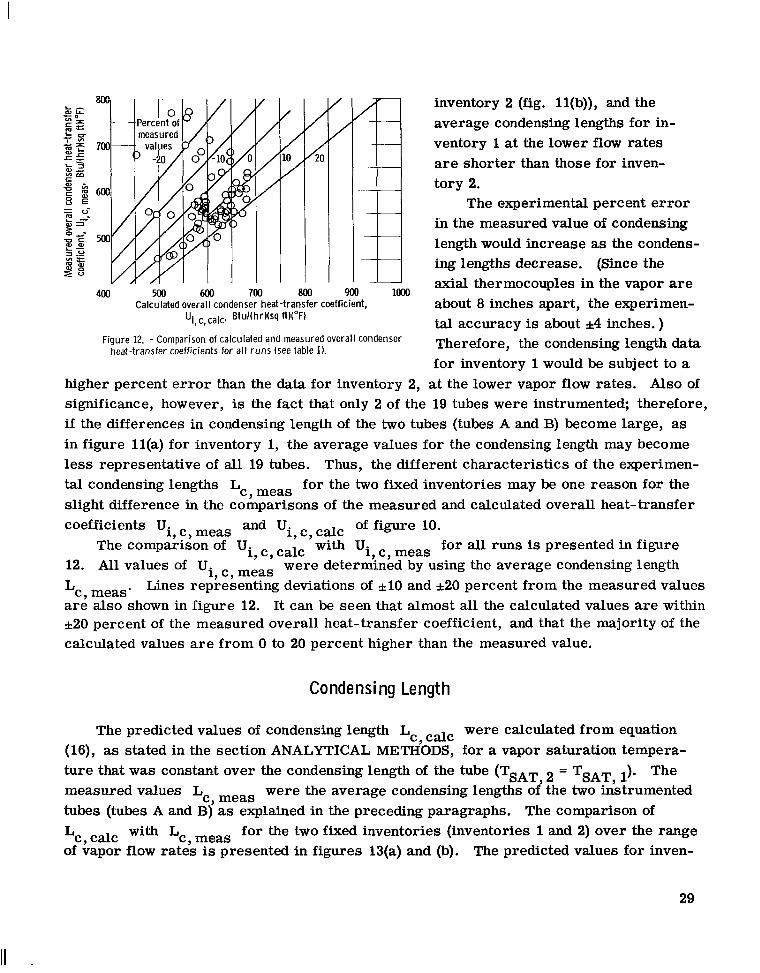
Figure 12. - Comparison of calculated and measured overall condenser heat-transfer coefficients for al l runs (see table I).
inventory 2 (fig. ll(b)), and the average condensing lengths for in- ventory 1 at the lower flow rates are shorter than those for inven- tory 2.
The experimental percent e r ror in the measured value of condensing length would increase as the condens- ing lengths decrease. (Since the axial thermocouples in the vapor are about 8 inches apart, the experimen- tal accuracy is about 4 inches. ) Therefore, the condensing length data for inventory 1 would be subject to a
higher percent e r ror than the data for inventory 2, at the lower vapor flow rates. Also of significance, however, is the fact that only 2 of the 19 tubes were instrumented; therefore, if the differences in condensing length of the two tubes (tubes A and B) become large, as in figure ll(a) for inventory 1, the average values for the condensing length may become less representative of all 19 tubes. Thus, the different characteristics of the experimen- tal condensing lengths Lc, meas for the two fixed inventories may be one reason for the slight difference in the comparisons of the measured and calculated overall heat-transfer coefficients Ui, c, meas and ui,c,calc of figure 10.
for all runs is presented in figure 12. All values of Ui, c, meas were determined by using the average condensing length
. Lines representing deviations of *lo and -+20 percent from the measured values Lc, meas a re also shown in figure 12. It can be seen that almost all the calculated values are within *20 percent of the measured overall heat-transfer coefficient, and that the majority of the calculated values are from 0 to 20 percent higher than the measured value.
ui, c, meas The comparison of Ui, c , talc
Condensing Length
The predicted values of condensing length Lc, talc were calculated from equation
The (16), as stated in the section ANALYTICAL METHODS, for a vapor saturation tempera- ture that was constant over the condensing length of the tube (TsAT = TSAT measured values L,, meas were the average condensing lengths of) the two idstrumented tubes (tubes A and B) as explained in the preceding paragraphs. The comparison of
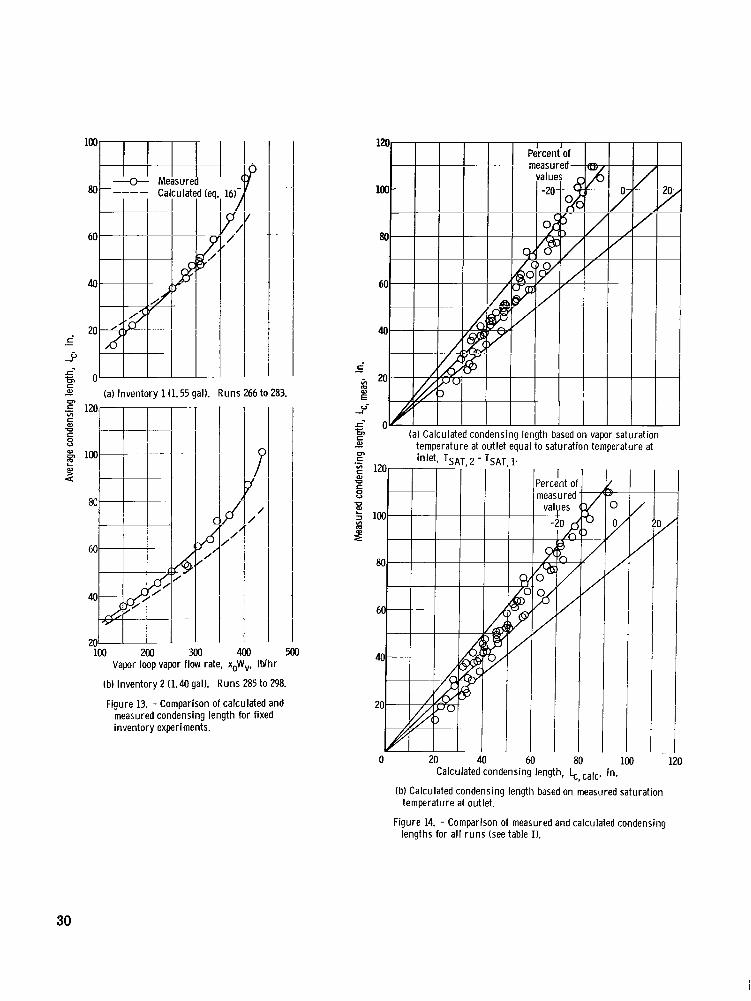
for the two fixed inventories (inventories 1 and 2) over the range Lc, calc with Lc, meas of vapor flow rates is presented in figures 13(a) and (b). The predicted values for inven-
29
1 1 1 Percent of , measured-
L
2 (a) Inventory l(1.55 gal). Runs 266 to 283. m
0 u
~~
vapor saturation temperature at
I Percent o measurec t
3
Y /
a Qr ml d /' I l l 1
60
40
8ot-H 21) L L L I
500 -_ 100 200 m
Vapor loop vapor flow rate, 400 ,Wv, lblhr
(b) Inventory 2 (1.40 gal). Runs 285 to 298.
Figure 13. - Comparison of calculated and measured condensing length for fixed inventory experiments. I 40
0 20 61) 80 100 120 ..
Calculated condensing length, k, talc, in.
(b) Calculated condensing length based on measured saturation
Figure 14. - Comparison of measured and calculated condensing
temperature at outlet.
lengths for al l r u n s (see table I).
30
tory 1 (fig. 13(a)) are within 43 to -20 percent of the values on the curve drawn through the measured data, and the predicted values for inventory 2 (fig. 13(b)) a re from 8 to 24 percent lower than the values on the curve faired through the measured data.
Again, as in the comparison of the overall heat-transfer coefficients, the comparison of the condensing lengths for inventory 1 is not quite the same as for inventory 2. This would be expected, however, because of the close relation between the condensing lengths and these overall.coefficients. As noted in the discussion on Ui, c, the character- istics of the measured condensing lengths for the fixed inventory 1 experiments were slightly different from those for the fixed inventory 2 experiments.
for all runs is presented in figure 14. All values of Lc,meas were the average of tubes A and B. In figure 14(a), the condens- ing length was calculated, as stated in the ANALYTICAL METHODS section, for a con- stant saturation temperature (TsAT = TSAT l). Calculations of condensing length were also made for the actual measured Gapor temp)erature at the interface TSAT, in order to demonstrate the effect of the vapor temperature drop. As the vapor temperature drop became larger, the temperature difference between the vapor and the coolant became smaller, which caused an increase in the calculated value of the condensing length. At the short condensing lengths, the temperature drops were small, and the differences be- tween the two calculated values of condensing length were negligible. At the longer con- densing lengths, however, the temperature drops were larger, due to larger pressure drops, and the differences between the two values of calculated condensing length became noticeable. A plot of the comparison of measured and calculated condensing length based on measured TsAT,2 is shown in figure 14(b). A somewhat better comparison to the experimental data is obtained at the larger lengths by including the effects of vapor tem- perature drop.
on figure 14. It can be seen that almost all the calculated values a re within ~ 2 0 percent of the measured data and that, in general, the calculated condensing lengths tend to be less than the measured values.
with Lc, meas The comparison of L,, talc
Lines representing deviations of *20 percent from the measured values a re also shown
Overall Pressure Drop
The predicted overall pressure drop APc, talc was calculated by using equations (20) to (27). (26), depending upon the flow regime as determined by the Reynolds number of the liquid phase. The vapor phase was always considered to be turbulent (see table I, p. 7). The superficial Reynolds number (ref. 6) of the liquid was calculated at the tube inlet and out- let, and the average value was used to determine the flow regime. The two-phase friction
The two-phase friction drop (APTpF) was calculated from equations (24) or
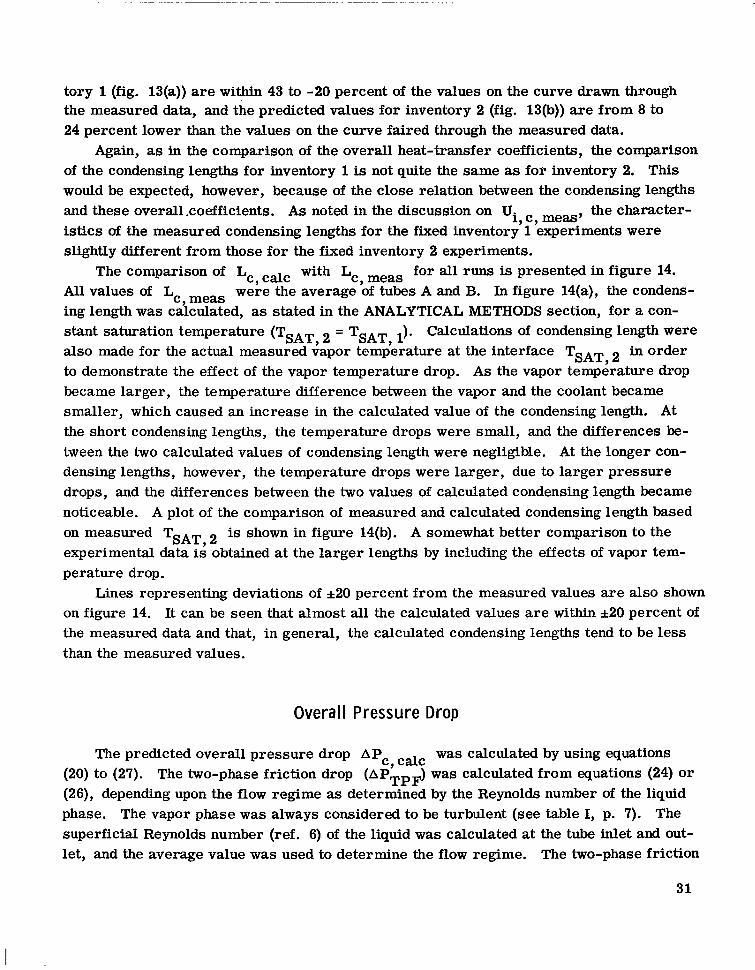
(a) Inventory l(1.55 gal). Runs 266 to 283. (b) Inventory 2 (1.40 gal). Runs 285 to 298.
Figure 15. - Comparison of calculated pressure drop, based on measured condensing length, with measured value for fixed inventory experiments.
drop APTpF was calculated by using both the measured and'the calculated values of con-
densing length Lc, meas and Lc, talc. The measured data Lc, meas was used in order to obtain a better evaluation of the approximation equations (eqs. (24) and (26)), and the predicted values Lc, talc were used in order to present an all-calculated pressure drop
for comparison. Obviously, the accuracy of the predicted pressure drop APc, talc would be affected by the accuracy of the value used for the condensing length. The comparisons
are presented of the measured and calculated pressure drops APc, meas
first for the APc, talc, computed with Lc meas (figs. 15 and 16), and then for the APc, talc, computed with Lc, talc (fig. 1'71.
The comparison of APc, talc ( b a s 4 on Lc, meas 1 with APc, meas for the two fixed inventories (inventories 1 and 2) is shown in figures 15(a) and (b). Although the percent- age differences are very high (100 percent) at the lower pressure drops, most of the cal- culated values are within 0. 5 pounds per square inch differential of the measured data.
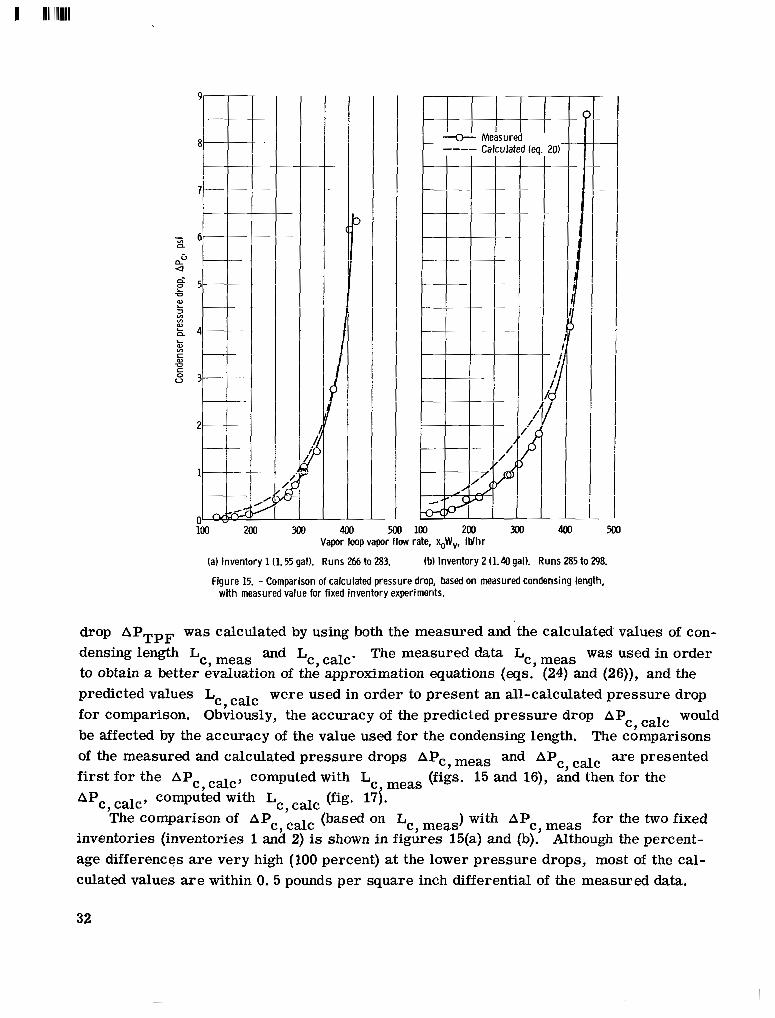
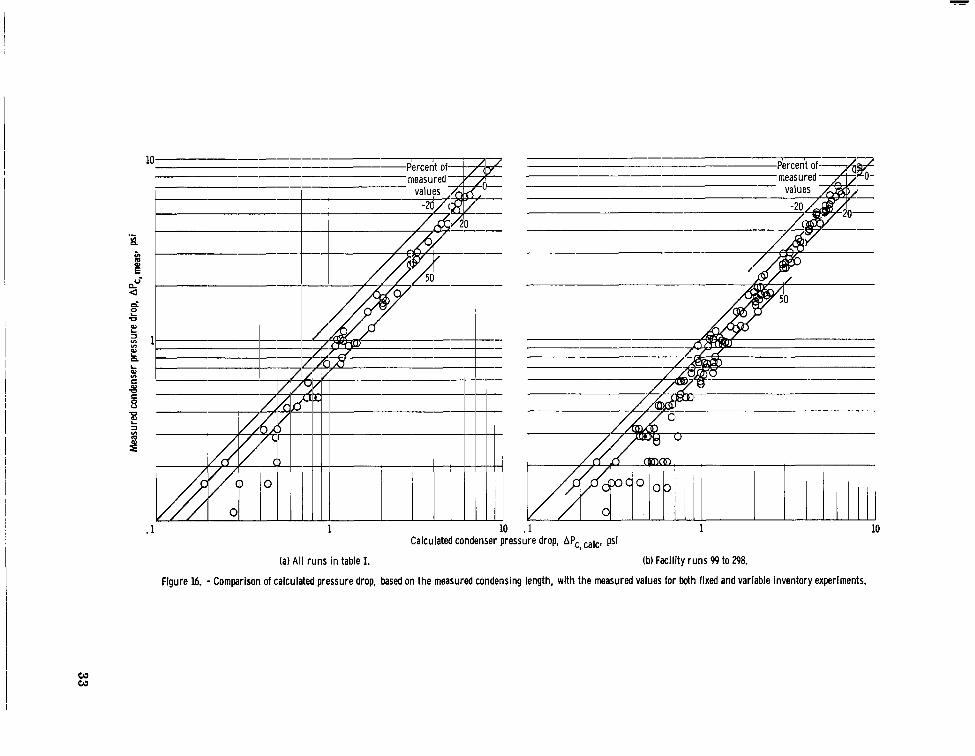
Figure 16. - Comparison of calculated pressure drop, based on the measured condensing length, with the measured values for both fixed and variable inventory experiments.
(a) All runs in table I. (b) Facility runs 99 to 298.
10
It should be noted that the predicted values tend to be conservative (i. e., higher than the measured values). Again, the comparison of the inventory 1 data is not the same as for the inventory 2 data. As mentioned previously, in the discussion of Ui, c, meas, the char-
slightly different from those of the fixed inventory 2 experiments. for all runs is
presented in figures 16(a) and (b). The data in figure 16(a) are only from the condenser runs listed in table I (p. 7), while the data in figure 16(b) a r e from the condenser runs in table I plus some additional facility runs that a re not tabulated. It can be seen that the predicted values of APc, talc a re high (conservative) at the lower pressure drops (up to about 3 psid) and tend to be low at the higher pressure drops. Lines representing devia- tions of &20 and 50 percent from the measured value are shown in figure 16. Therefore, the fact that the Lockhart-Martinelli correlation of q2 with X2 showed a data scatter of about &45 percent in reference 6 indicates that the use of the approximating equations to calculate APTpF results in reasonable values for predicted overall condenser pressure drops greater than about 2 pounds per square inch differential for this condenser. There is considerable scatter a t the low pressure drops, which is to be expected since instru- mentation error becomes more significant at the lower pressure drops, both in the meas-
acteristics of the measured condensing lengths for the fixed inventory 1 experim 1 nts were
with "'c, meas The comparison of APc, talc (basedon Lc meas
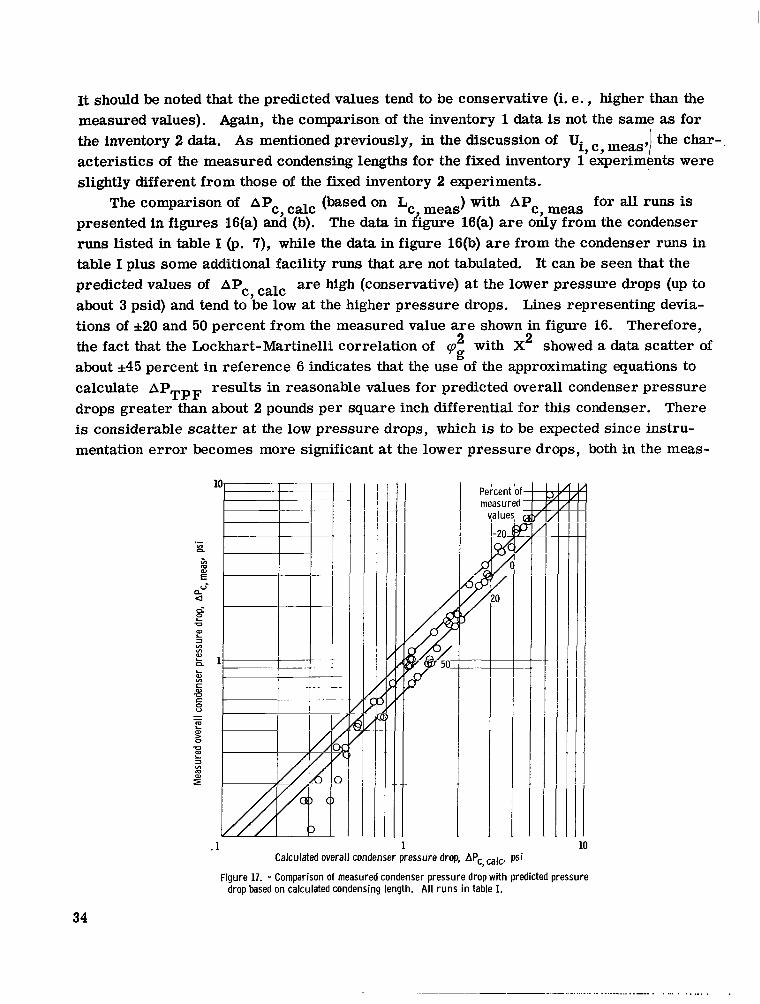
Figure 17. - Comparison of measured condenser pressure drop with predicted pressure drop based on calculated condensing length. All runs in table I.
34
-.- .... . ... . . .....
urement of the pressure drop itself and in the determination of the condensing length. Also, the actual flow distribution (among the 19 tubes) is unknown; therefore, particularly at small flows, it is possible that some of the tubes had more vapor flow than others. The flow distribution could not be detected since only two tubes were instrumented.
runs is presented in figure 17. Again, the calculated values are high at the low pressure drops and low at the high pressure drops, when compared with the measured data.
than the respective values calculated by using Lc, meas (fig. 16(a)). This would be ex- pected, since Lc, talc tended to be less than Lc, meas.
for all tabulated The comparison of APc, talc (based on Lc, talc with Apt, meas
The pressure drop values predicted by using Lc, talc, however, tend to be lower
CONCLUDING REMARKS
The equations used to calculate the overall heat-transfer coefficient Ui, c, talc pre- dicted values that were mostly within &20 percent of the measured values, with the major- ity of the calculated values being from 0 to 20 percent higher than the measured values. Measured condenser inlet conditions were used in the calculations.
The predicted values of condensing length were almost all within *20 percent of the experimental data, with the calculated values tending to be less than the measured values.
The predicted values of overall pressure drop, calculated using both the calculated and measured values of condensing lengths, were mostly within 50 to -20 percent of the experimental data, with the largest percent deviations at the small pressure drops. The calculated values of the overall condenser pressure drop tended to be conservative (i. e., higher than the actual measured values) although the values predicted with Lc, talc were, in general, smaller than the corresponding values calculated with Lc,
Lewis Research Center, National Aeronautics and Space Administration,
Cleveland, Ohio, July 5, 1966, 120-27-04-02-22.
35
APPENDIX A
SYMBOLS
Ahi
Ai
AS
cP
DE
Di
DO
DS
f
GC
Gf
Gm
GO
gC
heat-transfer area, based on tube inside diameter, sq f t
total flow area, based on the tube inside diameter, sq f t
coolant flow area, sq f t
specific heat, Btu/lb
equivalent diameter of condenser shell, f t
tube inside diameter, f t
tube outside diameter, f t
condenser inner shell inside di- ameter, f t
friction factor
wC
AS
coolant mass velocity, -,
W h r ) (sq ft) vapor mass velocity at tube out-
let, - xwv, lb/(hr)(sq ft) Ai
mean vapor mass velocity, 0. 58 Go lb/(hr)(sq ft)
vapor mass velocity at tube inlet,
Ai 8 conversion factor, 4. 18x10
(lb mass/lb force)(ft/hr)/hr
% hi
hO
KT
KV
k
L
N
NGr
Npr
NRe
P
pc2c
p~ IB
'V 1B
enthalpy of vaporization, Btu/lb
film coefficient of heat transfer on inside of tube, Btu/(Wsq ft)(OF)
film coefficient of heat transfer on outside of tubes, Btu/(hr) (sq ft) (OF)
quality dependent factor in turbulent-turbulent two-phase friction pressure drop equation
quality dependent factor in viscous-turbulent two-phase friction'pressure drop equation
Btu/(hr) (sq f t ) (OF) /f t thermal conductivity ,
length, f t
number of tubes
Grashof number
Prandtl number
Reynolds number
pressure, lb/sq ft
pressure of coolant at condenser outlet, psia
pressure of heating fluid at boiler inlet, psia
pressure of vapor loop fluid at boiler inlet, psia
36
pvlc
pW
A P
ApH
ApM
A p ~ ~ ~
Q S
Si
'm
' 0
T
TCI
TCIC
TC2C
T~ IB
pressure of vapor loop fluid at condenser inlet, psia
wetted perimeter, f t
pressure drop, lb/sq f t
pressure change at tube inlet, lb/sq f t
pressure loss from inlet piping to inlet vapor plenum, lb/sq f t
pressure change due to momen- tum recovery, lb/sq f t
two-phase friction pressure loss, lb/sq f t
heat load, Btu/hr
axial coolant temperature, F
heat-transfer area per unit
0
length, based on tube inside diameter, sq ft/ft
heat-transfer area per unit length, based on mean tube diameter, sq ft/ft
heat- transfer area per unit length, based on tube out- side diameter, sq ft/ft
axial vapor temperature, F
coolant temperature at end of
0
0 condensing length, F
coolant temperature at con- 0 denser inlet, F
coolant temperature at con- 0 denser outlet, F
temperature of heating loop fluid a t boiler inlet, O F
temperature of heating loop fluid at boiler outlet, O F
TH2B
TSAT, vapor saturation temperature
vapor saturation temperature at end of condensing length,
0 at tube inlet, F
T ~ ~ ~ , 2
O F
TV 1B
TV2B
TVIC
TV2C
ATcc
AT^^
AT^^
t
'i
V
W
wA
wB
temperature of vapor loop fluid 0 at boiler inlet, F
temperature of vapor loop fluid 0 at boiler outlet, F
at condenser inlet, O F
a t condenser outlet, O F
temperature of vapor loop fluid
temperature of vapor loop fluid
directly measured temperature change of coolant from inlet to outlet of condenser, O F
directly measured temperature change of heating loop fluid from inlet to outlet of boiler, O F
log- mean temperature differ- ence
tube wall thickness, f t
overall heat-transfer coeffi- cient, based on tube inside area, Btu/(hr)(sq ft)(OF)
velocity, ft /hr
flow, lb/hr
axial wall temperature of 0 tube A, F
tube B, O F
axial wall temperature of
37
wC
X
X
xO
Y/L
T "
"V
PT
PV
P
P
qg
coolant flow, lb/hr
Lockhart- Martinelli parameter, 1-
vapor quality at condenser inlet
fraction of condensing length
quality dependent factor in tur- bulent two-phase friction pressure drop equation
quality dependent factor in viscous two-phase friction pressure drop equation
temperature dependent prop- erties factor in turbulent two-phase friction pressure drop equation
temperature dependent prop- erties factor in viscous two-phase friction pressure drop equation
viscosity, lb/(f t) (hr )
density, lb/cu ft
Lockhar t- Mar tinelli parameter , afunction of X
Subscripts:
A
B
b
C
calc
g
H
Q
meas
0
P
s c
TPF
TT
t
V
VT
W
1,2, . . .
condenser
condenser
tube A (at the top)
tube B (at the bottom)
evaluated at bulk temperature of liquid
condensing, condensing portion of heat exchanger
calculated value
gas or vapor
heating loop
liquid
measured value
tube inlet
Pipe
subcool e r , subc ooling portion
two-phase friction
turbulent-liquid - turbulent-gas regime
tube
vapor loop
viscous-liquid - turbulent-gas regime
wall or evaluated a t wall tem- perature
sequence
38
APPENDIX B
CONDENSER DESIGN CONSIDERATIONS
The requirements and considerations used in the design of the condenser in this test facility are presented in the following paragraphs.
General Requirements
The requirements established for this condenser were as follows: (1) The heat rejection rate would be a nominal 500 000 Btu per hour, which was ap-
(2) The unit should be horizontal and contain small diameter tubes in order to reduce
(3) The unit must be less than 10 feet long to permit disassembly. It was decided
proximately the same as that of the alkali metal facility (see INTRODUCTION).
the effects of gravity.
that the condenser should be a multitube, shell-and-tube type with triangular pitch so that the unit would be small and simple.
Operating Range
An operating range of about 5 to 25 pounds per square inch absolute was chosen. In this range, the properties of water were comparable with those of potassium in the oper- ating range of the alkali metal facility. A nominal maximum flow rate of 500 pounds per hour was established.
Tube Size and Number of Tubes
Tubes of nominal 0.25-inch inside diameter with a 0.035-inch wall thickness were used. In order to efficiently f i l l a shell of circular cross section, the following number of tubes were considered N = 7, 13, 19, 31, o r 55. ThGrefore, in order to determine which number of tubes should be used, various condenser characteristics were calculated for several values of N, as discussed in the following paragraphs.
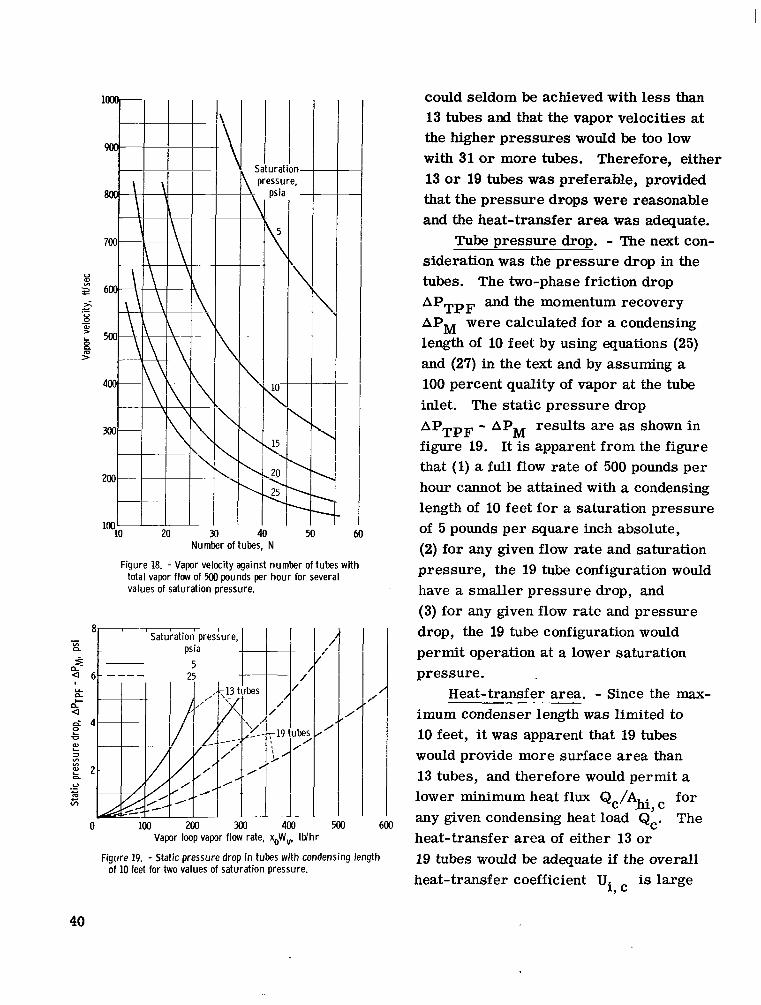
Vapor velocity. - The maximum velocity of the vapor is plotted against the number of tubes in figure 18 for the maximum flow rate of 500 pounds per hour at several values of saturation pressure. From this figure, i t was decided that the maximum flow rate
39
t I
T n i
‘b Y 1-
!uration- ssure. )si;
\5 \
10- \
15 ‘. 20 \ 25 L-
Number of tubes, N Figure 18. - Vapor velocity against number of tubes with
total vapor flow of Hx1 pounds per hour for several values of saturation pressure.
i /
Ibe , t
I
,’
m 600 0 100 200 300 1
Vapor loop vapor flow rate, xoWv, lblhr
Figure 19. - Static pressure drop in tubes with condensing length of 10 feet for two values of saturation pressure.
could seldom be achieved with less than 13 tubes and that the vapor velocities at the higher pressures would be too low with 31 o r more tubes. Therefore, either 13 o r 19 tubes was preferable, provided that the pressure drops were reasonable and the heat-transfer area was adequate.
sideration was the pressure drop in the tubes. The two-phase friction drop
A P ~ ~ ~ APM were calculated for a condensing length of 10 feet by using equations (25) and (27) in the text and by assuming a 100 percent quality of vapor at the tube inlet. The static pressure drop APTpF - APM results are as shown in figure 19. It is apparent from the figure that (1) a full flow rate of 500 pounds per hour cannot be attained with a condensing length of 10 feet for a saturation pressure of 5 pounds per square inch absolute, (2) for any given flow rate and saturation pressure, the 19 tube configuration would have a smaller pressure drop, and (3) for any given flow rate and pressure drop, the 19 tube configuration would permit operation at a lower saturation pressure.
Tube pressure drop. - The next con-
and the momentum recovery
Heat-transfer area. - Since the mix- imum condenser length was limited to 10 feet, it was apparent that 19 tubes would provide more surface area than 13 tubes, and therefore would permit a lower minimum heat flux Qc/Ahi, for any given condensing heat load Qc. The heat-transfer area of either 13 or 19 tubes would be adequate if the overall heat-transfer coefficient U. is large
1, c
40
enough for the range of log-mean temperature difference ATLM available from the facil- ity.
Therefore, since the use of 19 tubes would require a smaller Ui, c, or permit oper- ation at a lower ATLM, and would result in reasonable pressure drops and permit max- imum flow rate operation at a lower saturation pressure, it was decided that 19 tubes would be used.
Final Considerations
A tube spacing of 1/8 inch was used to allow the tube entrances to be slightly rounded. This dimension determined the shell size. The overall heat-transfer coefficient U. was then checked by using equation (7) and was found to be large enough that the heat- transfer area of 19 tubes was adequate.
1, c
4 1
APPENDIX C
DERIVATION OF APPROXIMATING EQUATIONS FOR TWO-PHASE FRICTION
PRESSWE DROP DURING CONDENSATION
The derivation of the equations used to calculate the two-phase friction pressure drop during condensation, based on the Lockhart-Martinelli (ref. 6) correlation for two-phase, two-component flow, is presented herein. These equations are derived in a manner sim- ilar to that used in reference 7 by substituting an approximating equation for the Lockhart- Martinelli correlation of p volved over the condensing length of the condenser.
against X and by integrating the various parameters in- g
The Lockhart-Martinelli correlation was of the form
2 dP (%)TpF = .(.,,
where
and
For the viscous-liquid - turbulent-gas regime
each phase flowing alone
42
I
where
0.046 f =
The superficial local velocities are defined as
wQ vQ,t =-
PQ Ai
wg Vg,t =-
PgAi
Combining equations (C2) to (C7),
In a condenser, the values of Reynolds numbers, flow rates, and velocities change con- tinuously over the length of the condenser; therefore, local values must be used. fluid properties are evaluated at the condenser inlet static pressure and are assumed con- Stant. Assuming Qc/Ahi, is constant,
The
WQ = wv - wg
vg,t=vg,o(l -:) and
43
=I IIIIIII I l1ll1ll111llIIl .l111ll111l
Combining equations (C8), (Cll), and (C13), and taking the square root,
0.5
(C 14)
The Lockhart-Martinelli viscous-liquid - turbulent-gas regime curve of q was approximated over the range of interest for a condenser (the value of X is very low over most of the condensing length) by the relation
against X g
= 2. 2XVT 0. 13 q
gVT
Combining equations (C4), (C5), (Cll), and (C12) yields
Combining equations (Cl), (C14), (C15), and (C16) and integrating yield
13
[ 1 - x o ( 1 - - ”(1 - $’ 566d(:) (C17)
When the integral is evaluated, the result is a power series of xo. By selecting values
44
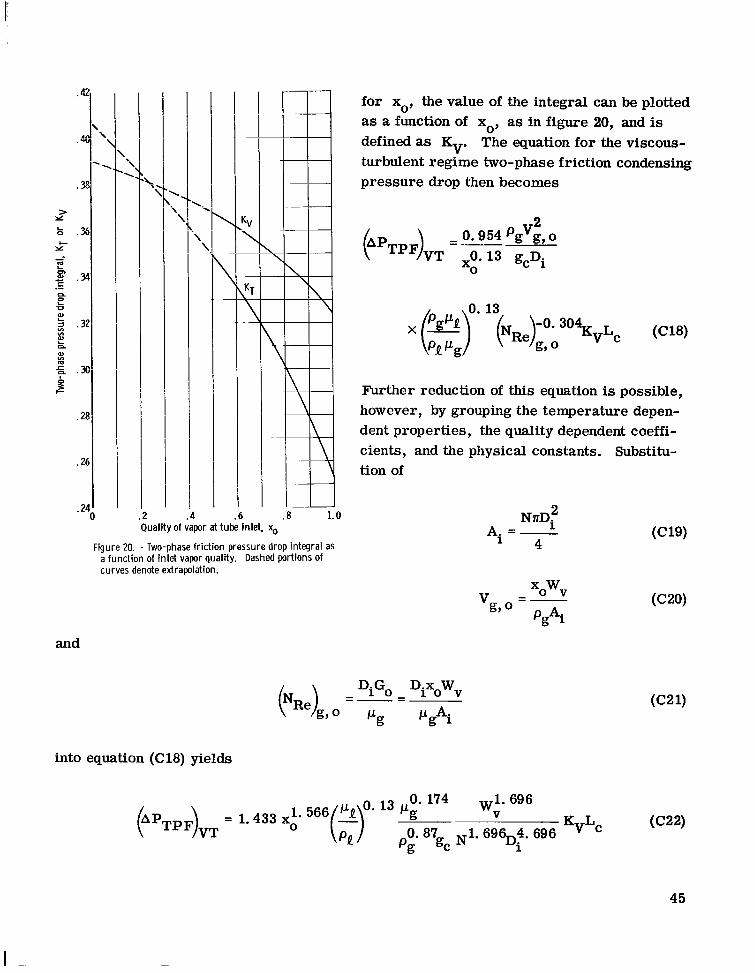
for xo, the value of the integral can be plotted as a function of xo, as in figure 20, and is defined as Kv. The equation for the viscous- turbulent regime two-phase friction condensing pressure drop then becomes
. \
\
t. '. i \
0.954pg V2 g,o - kPTpF)VT - gcDi
xO
Further reduction of this equation is possible, however, by grouping the temperature depen- dent properties, the quality dependent coeffi- cients, and the physical constants. Substitu- tion of
N~D: A. =-
l 4
.2 .4 .6 I .8 Quality of vapor at tube inlet, x,,
Figure 20. - Two-phase friction pressure drop integral as a function of inlet vapor quality. Dashed portions of curves denote extrapolation.
- xowv Vg,o --
p g 4
and
D.G D x W
PgAi
1 0 - i o v
into equation (C18) yields
KvLc ( C W
1.566(:r* l3 ",g. 0. 87 174 APTpF VT = 1.433 xo
1.696,,4. 696 pg gc i
0 45
. 5
.4
I- U
L O . 3 > U
i
fi L
ZI * 2 c. m 3 U
-
. 1
0 .2 4 6 .a
/
I
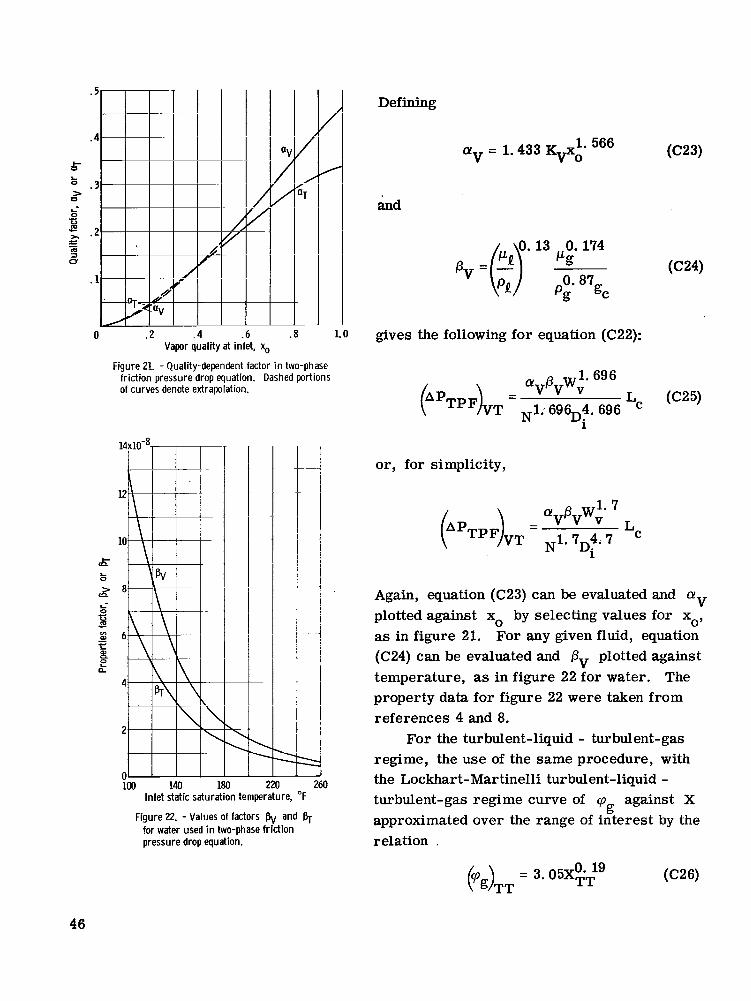
Vapor quality at inlet, ~0 Figure 21. - Quality-dependent factor in two-phase
friction pressure drop equation. Dashed portions of curves denote extrapolation.
1.0
14
12
10
05 L 0
h a L' 0 c P .- Z 6
e n
- c
k
4
2i- 0 100 140 1
Inlet static satur i n temperature, "F
Figure 22. - Values of factors and l 3 ~ for water used in two-phase friction pressure drop equation.
Defining
(C23) 1. 566 av = 1.433 K p o
and
0. 13 0. 174
pv=(:) pg ':87 gc
gives the following for equation (C22):
1.696 *va,w,
kPTpF)VT = N1; 6 9 b 4 . 6 9 6 Lc i
or, for simplicity,
CY p w 1 . 7
Di LC
- v v v (.pTpF)VT - N1. 7 4 . 7
Again, equation (C23) can be evaluated and aV plotted against xo by selecting values for xo, as in figure 21. For any given fluid, equation (C24) can be evaluated and PV plotted against temperature, as in figure 22 for water. The property data for figure 22 were taken from references 4 and 8.
For the turbulent-liquid - turbulent-gas regime, the use of the same procedure, with the Lockhart-Martinelli turbulent-liquid - turbulent-gas regime curve of cp against X approximated over the range of interest by the relation .
g
0. 19 @g)TT = 3' 05XTT
46
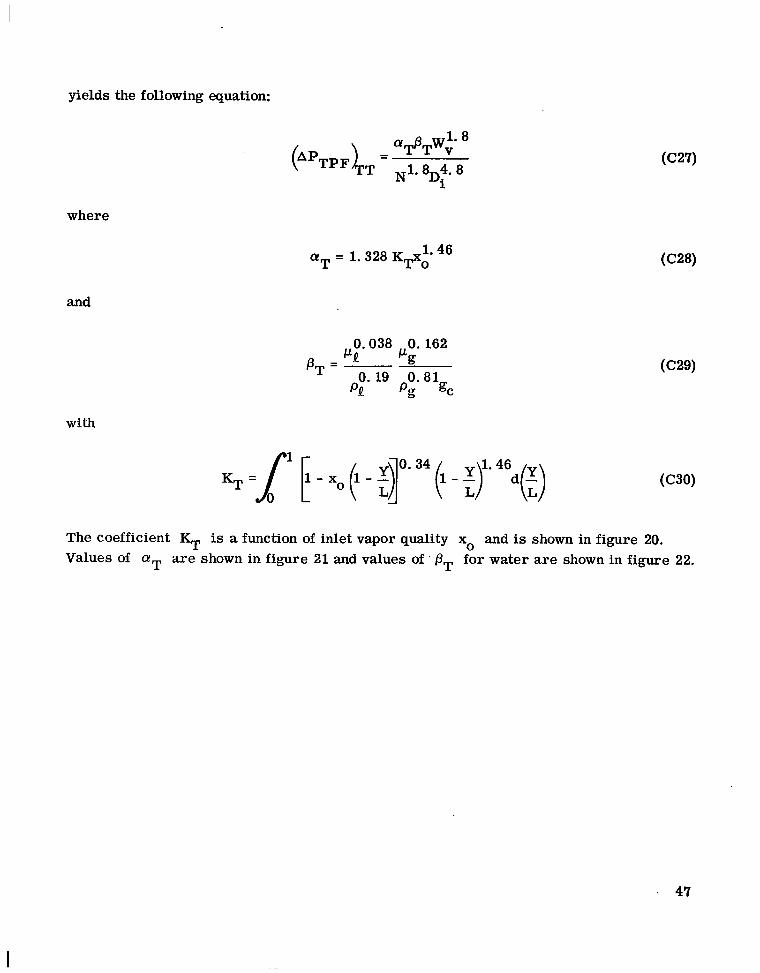
yields the following equation:
a! /3 w1.8
Di
- T T v @PTpF)TT - N1. 8 4.8
where
a! - 1.328Kp0 1.46 T -
and
0.038 0. 162
0. 19 0.81 pQ pg gc
I-LQ I-Lg PT = -
with
KT =[ E - xo (1 - 34 (1 - $. 46d(:)
47
I
The coefficient KT is a function of inlet vapor quality xo and i s shown in figure 20. Values of aT are shown in figure 21 and values of ' oT for water are shown in figure 22.
REFERENCES
1. Zipkin, Morris A. ; and Edwards, Russell N., eds. : Power Systems for Space Flight. Vol. 11 of Progress in Astronautics and Aeronautics, Martin Summerfield, ed. , Academic Press, 1963.
2. Fenn, David B. ; Coe, Harold H. ; and Gutierrez, Orlando A. : Steady-State Perform- ance of a Modified Rankine Cycle System Using Water. NASA TN D-3333, 1966.
3. Carpenter, E. F. ; and Colburn, A. P. : The Effect of Vapor Velocity on Condensation Inside Tubes. Proceedings of the General Discussion on Heat Transfer, Inst. Mech. Eng., (London), and ASME, 1951, pp. 20-26.
4. McAdams, William H. : Heat Transmission. Third ed., McGraw-Hill Book Co., Inc., 1954.
5. Anon. : Flow of Fluids Through Valves, Fittings, and Pipes. Tech. Paper No. 409, The Crane Co., Chicago, Ill., May 1942.
6. Lockhart, R. W. ; and Martinelli, R. C. : Proposed Correlation of Data for Isothermal Two-Phase, Two Component Flow in Pipes. Chem. Eng. Prog., vol. 45, no. 1, Jan. 1949, pp. 39-48.
7. Coombs, M. G. ; Stone, R. A. ; and Kapus, T. : The SNAP 2 Radiative Condenser Analysis. Rep. No. NAA-SR- 5317, Atomics International, 1960.
8. Keenan, Joseph H. ; and Keyes, Frederick G. : Thermodynamic Properties of Steam. John Wiley and Sons, Inc. 1936. (28th printing, 1955. )
48 NASA-Langley, 1966 E-3229
“The aeronautical and space activities of the United States shall be conducted so as to contribute . . . to the expansion of human knowl- edge of phenomena in the atmosphere and space. The Administration shall provide for the widest practicable and appropriate dissemination of information concerning its actiuities and the results thereof.”
-NATIONAL AERONAUTICS AND SPACE ACT OF 1958
NASA SCIENTIFIC AND TECHNICAL PUBLICATIONS
TECHNICAL REPORTS: important, complete, and a lasting contribution to existing knowledge.
TECHNICAL NOTES: of importance as a contribution to existing knowledge.
TECHNICAL. MEMORANDUMS: Information receiving limited distri- bution because of preliminary data, security classification, or other reasons.
CONTRACTOR REPORTS: Technical information generated in con- nection with a NASA contract or grant and released under NASA auspices.
TECHNICAL TRANSLATIONS: Information published in a foreign language considered to merit NASA distribution in English.
TECHNICAL REPRINTS: Information derived from NASA activities and initially published in the form of journal articles.
SPECIAL. PUBLICATIONS: Information derived from or of value to NASA activities but not necessarily reporting the results .of individual NASA-programmed scientific efforts. Publications include conference proceedings, monographs, data compilations, handbooks, sourcebooks, and special bibliographies.
Scientific and technical information considered
Information less broad in scope but nevertheless
Details on the availability o f these publications may be obtained from: