This article was downloaded by: [University of Guelph] On: 25 August 2012, At: 04:23 Publisher: Taylor & Francis Informa Ltd Registered in England and Wales Registered Number: 1072954 Registered office: Mortimer House, 37-41 Mortimer Street, London W1T 3JH, UK Analytical Letters Publication details, including instructions for authors and subscription information: http://www.tandfonline.com/loi/lanl20 Comparison of Chemometric and Chromatographic Methods to Obtain Kinetic Parameters for Textile Dyes during a Biodegradation Process Wagner José Barreto a , Nathalia D'Elboux Bernardino a , Suely Mayumi Obara Doi b & Renata Afonso a a Laboratory of Environmental Physical Chemistry, Department of Chemistry, Center of Exact Sciences, State University of Londrina, Londrina, Paraná, Brazil b Departament of Biochemistry and Biotechnology, Center of Exact Sciences, State University of Londrina, Londrina, Paraná, Brazil Accepted author version posted online: 13 Apr 2012. Version of record first published: 02 Aug 2012 To cite this article: Wagner José Barreto, Nathalia D'Elboux Bernardino, Suely Mayumi Obara Doi & Renata Afonso (2012): Comparison of Chemometric and Chromatographic Methods to Obtain Kinetic Parameters for Textile Dyes during a Biodegradation Process, Analytical Letters, 45:12, 1713-1723 To link to this article: http://dx.doi.org/10.1080/00032719.2012.677792 PLEASE SCROLL DOWN FOR ARTICLE Full terms and conditions of use: http://www.tandfonline.com/page/terms-and-conditions This article may be used for research, teaching, and private study purposes. Any substantial or systematic reproduction, redistribution, reselling, loan, sub-licensing, systematic supply, or distribution in any form to anyone is expressly forbidden. The publisher does not give any warranty express or implied or make any representation that the contents will be complete or accurate or up to date. The accuracy of any instructions, formulae, and drug doses should be independently verified with primary sources. The publisher shall not be liable for any loss, actions, claims, proceedings, demand, or costs or damages whatsoever or howsoever caused arising directly or indirectly in connection with or arising out of the use of this material.
Transcript
This article was downloaded by: [University of Guelph]On: 25 August 2012, At: 04:23Publisher: Taylor & FrancisInforma Ltd Registered in England and Wales Registered Number: 1072954 Registeredoffice: Mortimer House, 37-41 Mortimer Street, London W1T 3JH, UK
Analytical LettersPublication details, including instructions for authors andsubscription information:http://www.tandfonline.com/loi/lanl20
Comparison of Chemometric andChromatographic Methods to ObtainKinetic Parameters for Textile Dyesduring a Biodegradation ProcessWagner José Barreto a , Nathalia D'Elboux Bernardino a , SuelyMayumi Obara Doi b & Renata Afonso aa Laboratory of Environmental Physical Chemistry, Department ofChemistry, Center of Exact Sciences, State University of Londrina,Londrina, Paraná, Brazilb Departament of Biochemistry and Biotechnology, Center of ExactSciences, State University of Londrina, Londrina, Paraná, Brazil
Accepted author version posted online: 13 Apr 2012. Version ofrecord first published: 02 Aug 2012
To cite this article: Wagner José Barreto, Nathalia D'Elboux Bernardino, Suely Mayumi Obara Doi &Renata Afonso (2012): Comparison of Chemometric and Chromatographic Methods to Obtain KineticParameters for Textile Dyes during a Biodegradation Process, Analytical Letters, 45:12, 1713-1723
To link to this article: http://dx.doi.org/10.1080/00032719.2012.677792
PLEASE SCROLL DOWN FOR ARTICLE
Full terms and conditions of use: http://www.tandfonline.com/page/terms-and-conditions
This article may be used for research, teaching, and private study purposes. Anysubstantial or systematic reproduction, redistribution, reselling, loan, sub-licensing,systematic supply, or distribution in any form to anyone is expressly forbidden.
The publisher does not give any warranty express or implied or make any representationthat the contents will be complete or accurate or up to date. The accuracy of anyinstructions, formulae, and drug doses should be independently verified with primarysources. The publisher shall not be liable for any loss, actions, claims, proceedings,demand, or costs or damages whatsoever or howsoever caused arising directly orindirectly in connection with or arising out of the use of this material.
COMPARISON OF CHEMOMETRIC ANDCHROMATOGRAPHIC METHODS TO OBTAINKINETIC PARAMETERS FOR TEXTILE DYESDURING A BIODEGRADATION PROCESS
Wagner Jose Barreto,1 Nathalia D’Elboux Bernardino,1
Suely Mayumi Obara Doi,2 and Renata Afonso11Laboratory of Environmental Physical Chemistry, Department ofChemistry, Center of Exact Sciences, State University of Londrina,Londrina, Parana, Brazil2Departament of Biochemistry and Biotechnology, Center of Exact Sciences,State University of Londrina, Londrina, Parana, Brazil
The concentrations of three industrial-grade textile dyes were determined in a mixture after
degradation by the fungusGanoderma sp, by using the methods of UV-Vis spectrophotometry
associated with Partial Least Squares regression and HPLC and comparing the results
obtained from both methods. Using the concentrations calculated from the two methods, a
kinetic study of the biodegradation mediated by the fungus was performed. The rate constants
and the activation energies for this transformation were obtained for each dye in the mixture.
The concentration of Remazol Blue R ESP could be determined by the HPLC method, and
the value obtained was comparable with the result using the Partial Least Squares regression
method. The Partial Least Squares regression method offers advantages over the HPLC
method for the quantification of dyes in textile effluents, as it provides the kinetic parameters
In recent decades, environmental problems have become increasingly criticaland frequent, due to population growth and increased industrial activity. Thecontamination of water bodies and their consequent impairment have led to thedevelopment of technologies that minimize the volume and toxicity of industrial
Received 4 November 2011; accepted 4 February 2012.
The authors would like to thank Fundacao Araucaria (03=2006=6416), FAEPE=UEL, CNPq
(476270=2007-3), and CAPES for financial support. Nathalia D. Bernardino thanks IC-CNPq for the
scholarship and Renata Afonso thanks CAPES for the scholarship.
Address correspondence to Wagner Jose Barreto, Laboratory of Environmental Physical
Chemistry, Department of Chemistry, Center of Exact Sciences, State University of Londrina, Campus
effluents. Large amounts of dye used during textile processing are released as effluentdue to the incomplete fixation of the dye to the fibers, and many studies have shownthat some classes of dyes, mainly azo dyes and their byproducts, can be toxic onaccount of their carcinogenic and=or mutagenic nature (Mechichi, Mhiri, and Sayadi2006). Around 60% of the dyes used during textile processing are azo dyes, which arecharacterized by the presence of the functional group -N=N- connected to aromaticgroups (Kunz et al. 2002; Martins et al. 2001; Lucilha et al. 2010). These dyes areparticularly problematic as they form weak bonds with the fiber and thus approxi-mately 10–20% of all dyes used during the dyeing process are discarded in theeffluent (Murugesan et al. 2007).
Treatment of textile effluents containing dyes is difficult and inefficient usingconventional processes because synthetic dyes have complex structures and are stableunder high temperature and light (Eichlerova, Homolka, and Nerud 2007). There arebasically three types of treatment used for textile effluents: physical, physic-chemical,and biological methods (Kamida et al. 2005). Wastewater treatment employing theformer two methods involves precipitation including coagulation, flocculation, anddecantation (Forgacs, Cserhati, and Oros 2004), adsorption on activated charcoal(Slokar and Marechal 1998), and biosorption (Akar et al. 2008). The chemical meth-ods used for the decolorization of textile effluents are most commonly based onoxidation processes (Ledakowicz, Solecka, and Zylla 2001), including the Fentonreaction and photochemical involving the presence of H2O2 or TiO2 as oxidizingagents in presence of sunlight (Forgacs et al. 2004, Lucilha et al. 2010), resulting inthe cleavage of the aromatic ring of the dye molecule (Robinson et al. 2001). Biologi-cal processes can be employed using various microorganisms, including bacteria andfungi, due to their ease of handling along with their rapid growth rates and high adap-tation capacity (Shedbalkar, Dhanve, and Jadhav 2008). A notable type of fungusused in such processes is the so-called white rot fungus, which is a heterogeneous groupof microorganisms capable of degrading the lignin present in vegetable matterand other recalcitrant compounds due to their production of lignolytic enzymes(Eichlerova et al. 2007; Forgacs et al. 2004; Kirby, Marchant, and McMullan 2000;Novotny et al. 2001).
The mechanism of decolorization of polymeric dyes by white rot fungi is com-plex and involves the enzymes lignin peroxidase (LiP), manganese peroxidase (MnP)(Harazono and Nakamura 2005), and laccases (Zhao and Hardin 2007; Campos et al.2001). Fungi, however, differ in terms of their ability to degrade dyes due to thequalitative and quantitative differences in their enzyme production (Machado et al.2006). Generally, the white rot fungi contain one or more of the aforementioned lig-nolytic enzymes. Most of the white rot fungal strains produce laccase as the mainenzyme for the dye decolorization process. One of the advantages associated withlaccases is that they do not require H2O2 for substrate oxidation, unlike peroxidases,and they have broad substrate specificity (Saito et al. 2003).
One pertinent problem in analytical chemistry is to estimate the number andconcentration of chemical species in a mixture from spectra or chromatograms(Peralta-Zamora et al. 1998; Scarminio et al. 1998; Barreto et al. 2010). Different meth-ods have been used for the determination of mixtures of dyes in different matrices.Except for UV-Vis spectrophotometry, these methods require sophisticated instru-ments and, consequently, have a high operating cost. The kinetics of the degradation
1714 W. J. BARETTO ET AL.
Dow
nloa
ded
by [
Uni
vers
ity o
f G
uelp
h] a
t 04:
23 2
5 A
ugus
t 201
2
of dyes in textile effluents by fungi can be studied using mathematical models toestimate the biodegradation reaction rates. The kinetic constants are estimated by fit-ting mathematical equations to the experimental data and the model can be used foreach effect under different operating conditions (Cristovao et al. 2008). The spectro-photometric determination of organic dyes in mixtures is a very complex problemdue to spectral interference, which results in widely overlapping absorption bands.For this type of determination, conventional univariate calibration is not viable andmultivariate calibration is used. The advantage of multi-component analysis usingmultivariate calibration is the speed of determination of components in the mixture,thus avoiding preliminary separation (Nevado, Flores, and Llerena 1998).
Several statistical methods are used in calibration procedures to analyze thespectra of mixtures, such as: Classic Least Squares (CLS) regression, MultipleLinear Regression (MLR), Inverse Least Squares (ILS), Principal ComponentRegression (PCR), and Partial Least Squares (PLS) regression. Of them, thePCR and PLS methods are considered to be more efficient in dealing with experi-mental noise, collinearity, and nonlinearity. An important point in the PLS methodis the complete design of the calibration samples (calibration matrix) to includeall possible interferences influencing the spectra of the samples. This includesinteractions between the components to be determined and the influence ofcomponents on the spectra of the analyte samples (Carvalho et al. 2006; Barretoet al. 2011).
The objective of this study was to compare two methods, UV-Vis spectropho-tometry associated with Partial Least Squares (PLS) regression and the HPLCmethod to obtain the concentrations of three industrial-grade textile dyes in solutionduring the microbial degradation using the fungus Ganoderma sp.
EXPERIMENTAL
Reagents and Solutions
The reagents used in this study were of low grade purity (meant for industrialproposes) and were obtained from the textile industry: Remazol Brilliant Orange 3R(RBO-3R), Remazol Blue RR (RB-RR), Remazol Blue R ESP (RB-RESP), disper-sant (Quimerol-535), NaCl, and Na2CO3 (soda ash). All solutions were preparedwith distilled water and the solutions for chromatography were prepared withultrapure water (Millipore Plus). The microorganism used in this study was the whiterot fungus, Ganoderma sp.
Experimental Design
The proportion of the dye mixture used to obtain the calibration curve weredetermined following a Simplex-Centroid triangle experimental design, where thevertices correspond to pure dye solutions, the edges to binary mixtures of the sameproportion and the center point to a ternary mixture of the same proportion. In thesepreparations the same reagents and procedures as those commonly employed inindustrial textile dyeing plants were followed, thus making the obtained kinetic datacloser to that of industrial effluents.
KINETIC PARAMETERS FOR TEXTILE DYES 1715
Dow
nloa
ded
by [
Uni
vers
ity o
f G
uelp
h] a
t 04:
23 2
5 A
ugus
t 201
2
Preparation of Calibration Curve
The dye solutions were prepared with the same composition used in theindustrial process. Three stock solutions (1000mgL�1) of each dye were preparedin 100-mL volumetric flasks. The mixtures for the calibrations were prepared in100mL of distilled water by adding 6 drops of Quimerol-535 variable volumes ofthe dye stock solution according to the experimental design, 3.0 g of NaCl and1.0 g of soda ash (Na2CO3). Samples (23.25mL) of these mixtures were then addedto a 125-mL Erlenmeyer flask with 0.5mL of Vogel minimum salts medium, yeastextract (0.2% w=v), and glucose (0.5% w=v). The pH was adjusted to 5.0, at whichthe enzymes showed maximal activities, with 1mol L�1 and 0.1mol L�1 H3PO4.All Erlenmeyer flasks were autoclaved at 121�C for 20min.
Preparation of the Dye Solution on a Laboratory Scale
To obtain the dye solutions with the same composition used during industrialprocesses, 6 drops of Quimerol-535, 0.05 g of each dye, 3.0 g NaCl, and 1.0 g Na2CO3
were added to 100mL of distilled water. Aliquots (12.5mL) of this solution were thentransferred to 125-mL Erlenmeyer flasks and 10.75mL of distilled water, 0.5mLVogel minimum salts medium, yeast extract (0.2% w=v), and glucose (0.5% w=v) werethen added and the pH was adjusted to 5.0. All Erlenmeyer flasks were autoclaved at12�C for 20min and were then inoculated with three 0.7 cm diameter discs taken froma potato dextrose agar plate covered with fungal mycelium grown for 240 h. Cultureswere incubated at temperatures of 25�C, 28�C, and 31�C and stirred in a rotary shaker(at 180 rpm), for different incubation times: 0, 24, 49, 78, 143, 175, 215, 246, and335 h. At the end of these periods, the dye solutions were removed from the shaker,centrifuged (Presvac DCS-16-RV), and filtered using 0.45-mm cellulose ester mem-branes (Millipore). Solutions without the fungus served as an abiotic control (blank).
Obtaining the UV-Vis Spectra
The UV-Vis spectra (Thermo Scientific Evolution 60) of all the calibrationsolutions and the dye solutions prepared as previously stated were recorded at roomtemperature from 200 to 800 nm using a 1-cm quartz cuvette and a blank prepared asdescribed. We have taken account the equilibrium time (Kunz, Reginatto, andDuran 2001) and the mycelium of the Ganoderma sp fungus was added to themedium, the mixture was shaken for 6 h to reach the adsorption equilibrium, andthis time was assigned as zero time or the starting point for the kinetic studies.
Determination of Biomass
Fungal biomass was measured gravimetrically after recovery of the myceliumby centrifugation at 9.05 g for 0.5 h and drying it at 70�C for 24 h.
Laccase Assay
Cell-free supernatants were obtained after removal of the mycelium by centri-fugation (at 9.05 g for 5min at 4�C) and used as the enzyme source. Laccase activity
1716 W. J. BARETTO ET AL.
Dow
nloa
ded
by [
Uni
vers
ity o
f G
uelp
h] a
t 04:
23 2
5 A
ugus
t 201
2
was measured at 50�C using 10mmol L�1 DMP (2,6-dimethoxyphenol) as thesubstrate (Paszczynski, Huynh, and Crawford 1985). The absorbance was monitoredat 468 nm (Fento 700 s). Laccase activity was expressed in units of mmoles of theoxidized product formed per minute per milliliter of enzyme solution.
High Performance Liquid Chromatography
The HPLC analysis (Finnigan Surveyor Plus, Thermo Electron Corporation)was performed using a quaternary pump and photodiode array (PDA) detector oper-ating at 254, 494, 594, and 605 nm. A Zorbax ODS C18 chromatography column wasused with 5mm packing (Agilent Technologies, 250� 4.6mm). For the mobile phase,a gradient method was used with pH 3.0 phosphate buffer and acetonitrile (Zhao andHardin 2007). The injection volume was 20 mL (filtered through a 0.2-mm nylon filter)and the flow rate for the separation column was 1mL=min at 25�C.
Statistical Analysis
The statistical analysis of the data were performed using partial least squares(PLS) regression with Parles_V2 program 1A (Rossel 2008) and Statistica 7.0(StatSoft Inc. 2004).
RESULTS AND DISCUSSION
Calculation of the Dye Concentrations
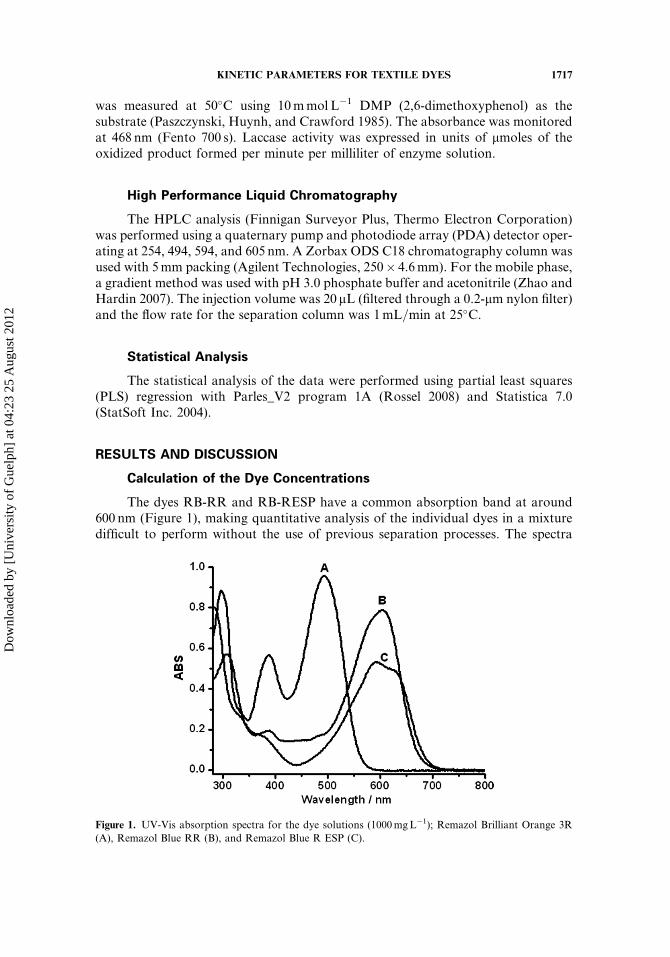
The dyes RB-RR and RB-RESP have a common absorption band at around600 nm (Figure 1), making quantitative analysis of the individual dyes in a mixturedifficult to perform without the use of previous separation processes. The spectra
Figure 1. UV-Vis absorption spectra for the dye solutions (1000mgL�1); Remazol Brilliant Orange 3R
(A), Remazol Blue RR (B), and Remazol Blue R ESP (C).
KINETIC PARAMETERS FOR TEXTILE DYES 1717
Dow
nloa
ded
by [
Uni
vers
ity o
f G
uelp
h] a
t 04:
23 2
5 A
ugus
t 201
2
of the dye solutions showed a decrease in the absorbance of the dyes with increasingincubation period, indicating a significant degradation of each dye by the fungusGanoderma sp. To obtain the kinetic parameters of the degradation reaction for eachdye individually in the dye solutions, UV-Vis spectrophotometry associated with thePLS method was performed after the biodegradation process at 25�C, 28�C, and31�C, and the results were compared with those obtained from the HPLC method.To validate the PLS method, concentrations (mass=volume) of the axial points ofthe calibration curve were calculated, indicating errors of 3.5% for the dye RBO-3R,8.4% for RB-RR, and 2.2% for RB-RESP. The PLS method was tested using three,four, and five principal components (PC) and the calculations with four PCs showedthe lowest RMSE (root mean square error of prediction), which explained the 99.98%of variance in the data without loss of relevant information (Figure 2A and B).
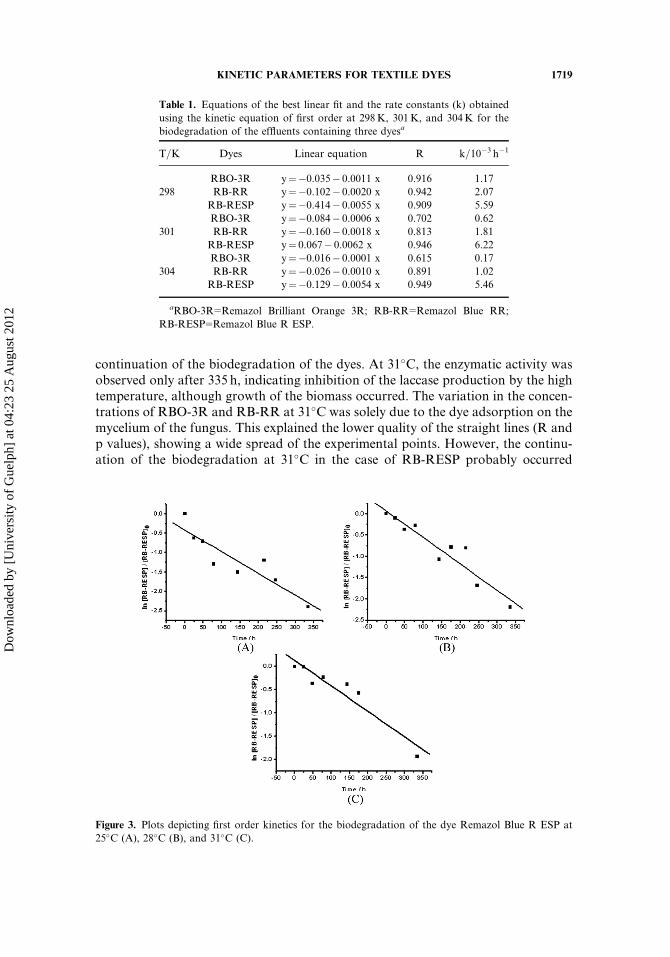
The reaction order was determined by fitting the best straight line obtainedbetween the rate equations of zero order ([A]-[A]0¼ -kt), first order (ln[A]-ln[A]0¼ -kt) and second order (1=[A]- 1=[A]0¼ kt). The kinetic graphs showed that thedegradation reactions followed straight lines with best values of R (coefficient of cor-relation) for first order kinetics (Table 1). The first order kinetic graphs for the dyeRB-RESP for example, as a function of the degradation time at 25�C, 28�C, and31�C, are shown in Figure 3A, B, and C. It was observed that the kinetic constants(k) of the biodegradation of the dyes RBO-3R and RB-RR decreased with increasingtemperature, while for the dye RB-RESP this constant increased from 25�C to 28�C,and then decreased at 31�C (Table 1). In Figure 3, at 25�C and 28�C, a plateau canbe observed at around 140 h due to a decrease in the reaction rate. This decrease inthe biodegradation process could be explained by the reduced amount of laccaseenzyme released by the fungus Ganoderma sp that occurred at this point in the bio-degradation process (140 h) (Table 2). The fact that no enzymatic activity wasobserved after 143 h at 25�C and 28�C may be related to inhibition of the laccaseby some secondary product formed during the biodegradation process. This inhi-bition disappeared after 175 h and the enzymatic activity increased, resulting in a
Figure 2. (A) Percentage of variance explained by the number of principal components (PC) used. (B)
Variation in the RMSE with the number of PCs for the dyes: Remazol Brilliant Orange 3R (a),
Remazol Blue RR (b), and Remazol Blue R ESP (c).
1718 W. J. BARETTO ET AL.
Dow
nloa
ded
by [
Uni
vers
ity o
f G
uelp
h] a
t 04:
23 2
5 A
ugus
t 201
2
continuation of the biodegradation of the dyes. At 31�C, the enzymatic activity wasobserved only after 335 h, indicating inhibition of the laccase production by the hightemperature, although growth of the biomass occurred. The variation in the concen-trations of RBO-3R and RB-RR at 31�C was solely due to the dye adsorption on themycelium of the fungus. This explained the lower quality of the straight lines (R andp values), showing a wide spread of the experimental points. However, the continu-ation of the biodegradation at 31�C in the case of RB-RESP probably occurred
Figure 3. Plots depicting first order kinetics for the biodegradation of the dye Remazol Blue R ESP at
25�C (A), 28�C (B), and 31�C (C).
Table 1. Equations of the best linear fit and the rate constants (k) obtained
using the kinetic equation of first order at 298K, 301K, and 304K for the
biodegradation of the effluents containing three dyesa
T=K Dyes Linear equation R k=10�3 h�1
RBO-3R y¼�0.035� 0.0011 x 0.916 1.17
298 RB-RR y¼�0.102� 0.0020 x 0.942 2.07
RB-RESP y¼�0.414� 0.0055 x 0.909 5.59
RBO-3R y¼�0.084� 0.0006 x 0.702 0.62
301 RB-RR y¼�0.160� 0.0018 x 0.813 1.81
RB-RESP y¼ 0.067� 0.0062 x 0.946 6.22
RBO-3R y¼�0.016� 0.0001 x 0.615 0.17
304 RB-RR y¼�0.026� 0.0010 x 0.891 1.02
RB-RESP y¼�0.129� 0.0054 x 0.949 5.46
aRBO-3R=Remazol Brilliant Orange 3R; RB-RR=Remazol Blue RR;
RB-RESP=Remazol Blue R ESP.
KINETIC PARAMETERS FOR TEXTILE DYES 1719
Dow
nloa
ded
by [
Uni
vers
ity o
f G
uelp
h] a
t 04:
23 2
5 A
ugus
t 201
2
because this dye is sensitive to other enzymes secreted by the Ganoderma sp, such aslignin peroxidase (LiP) or manganese peroxidase (MnP).
To compare the activation energy (Ea) of the reactions for the three dyes, thesevalues were calculated using only the assays at 25�C and 28�C, by applying theArrhenius equation ln k2=k1¼�Ea=R (1=T2� 1=T1). The Ea values were found tobe 175.90 kJmol�1, 37.17 kJmol�1, and 29.58 kJmol�1 for RBO-3R, RB-RR, andRB-RESP, respectively. The highest rate constants were obtained for RB-RESP,reflecting the lower activation energy which explains the fact that this dye had thehighest discoloration percentage (95.4%) at 25�C. The dye RBO-3R showed lowerrate constants and higher activation energy at the temperatures studied, with thelowest percentage of biodegradation (38.7%) at 25�C. The dye RB-RR, however,showed intermediate values for the rate constants and activation energy, with adiscoloration percentage of 52.8% at 25�C.
High Performance Liquid Chromatography Method
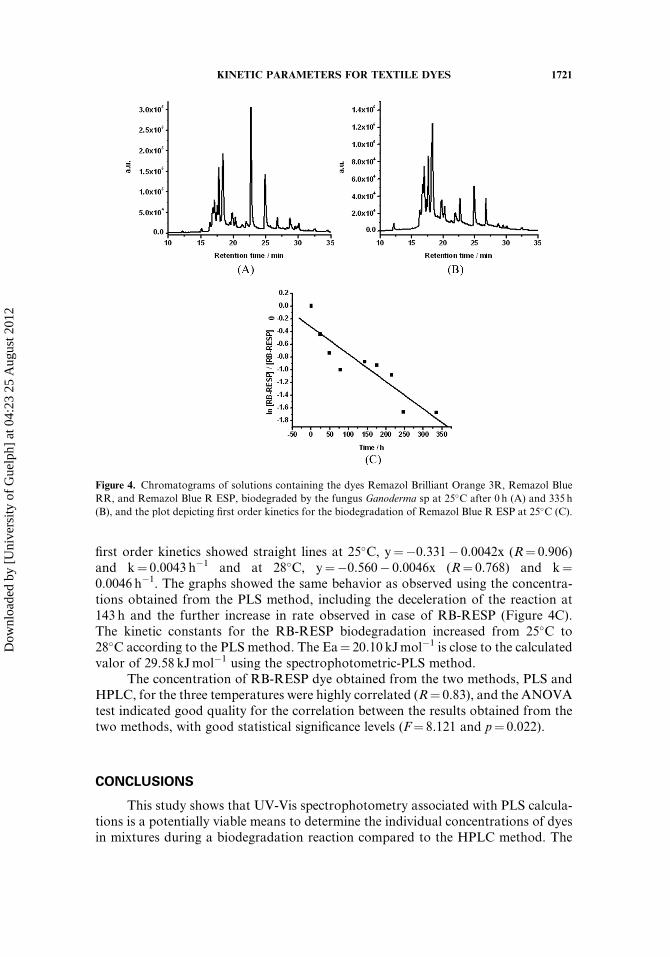
The chromatograms of the biodegraded dye solutions at 25�C were obtainedwith an aim to identify and quantify the three dyes during biodegradation and tocompare them with those obtained from the PLS method. It was very difficult toassign the peaks corresponding to the three dyes according to their retention times.The mixture of commercial dyes showed a very complex composition due to the addi-tives used for fixation of the dye to the fiber and the presence of organic residues orig-inating during the synthesis of the dyes. Thus, there were several peaks which couldnot be attributed to the dyes. Even when comparing the chromatograms of the threedyes mixed without additives (stock solutions), it was not easy to identify each dye. Itwas however possible to identify with confidence a peak of the RB-RESP dye, with aretention time of 32.5min (Figure 4A and B). This peak area was used for calculationof the concentrations for the subsequent kinetic studies. The graphs corresponding to
Table 2. Enzymatic activity of the laccase and microbial biomass in the
biodegraded effluents using Ganoderma sp at 298K, 301K, and 304K
T=K Incubation time=h Laccase=U mL�1 Biomass=10�4 kg
0 0.0008
24 0.0032
298 143 0.0000 1.81
175 0.2328
335 0.1088
0 0.0884
24 0.0664
301 143 0.0000 1.74
175 0.0080
335 0.0264
0 0.0000
24 0.0000
304 143 0.0000 1.73
175 0.0000
335 0.1320
1720 W. J. BARETTO ET AL.
Dow
nloa
ded
by [
Uni
vers
ity o
f G
uelp
h] a
t 04:
23 2
5 A
ugus
t 201
2
first order kinetics showed straight lines at 25�C, y¼�0.331� 0.0042x (R¼ 0.906)and k¼ 0.0043 h�1 and at 28�C, y¼�0.560� 0.0046x (R¼ 0.768) and k¼0.0046 h�1. The graphs showed the same behavior as observed using the concentra-tions obtained from the PLS method, including the deceleration of the reaction at143 h and the further increase in rate observed in case of RB-RESP (Figure 4C).The kinetic constants for the RB-RESP biodegradation increased from 25�C to28�C according to the PLS method. The Ea¼ 20.10 kJmol�1 is close to the calculatedvalor of 29.58 kJmol�1 using the spectrophotometric-PLS method.
The concentration of RB-RESP dye obtained from the two methods, PLS andHPLC, for the three temperatures were highly correlated (R¼ 0.83), and the ANOVAtest indicated good quality for the correlation between the results obtained from thetwo methods, with good statistical significance levels (F¼ 8.121 and p¼ 0.022).
CONCLUSIONS
This study shows that UV-Vis spectrophotometry associated with PLS calcula-tions is a potentially viable means to determine the individual concentrations of dyesin mixtures during a biodegradation reaction compared to the HPLC method. The
Figure 4. Chromatograms of solutions containing the dyes Remazol Brilliant Orange 3R, Remazol Blue
RR, and Remazol Blue R ESP, biodegraded by the fungus Ganoderma sp at 25�C after 0 h (A) and 335h
(B), and the plot depicting first order kinetics for the biodegradation of Remazol Blue R ESP at 25�C (C).
KINETIC PARAMETERS FOR TEXTILE DYES 1721
Dow
nloa
ded
by [
Uni
vers
ity o
f G
uelp
h] a
t 04:
23 2
5 A
ugus
t 201
2
UV-Vis-PLS method is easy, fast, and uses less expensive equipment. With theHPLC method, it is very difficult to assign the dye bands, which restricts its appli-cation to the crude and highly complex solutions obtained during biodegradation.On the other hand, the UV-Vis-PLS method is less sensitive to the additives usedto enhance dye fixation to the fabric and the biological substrates necessary forthe biological processes to occur.
REFERENCES
Akar, T., A. S. Ozcan, S. Tunali, and A. Ozcan. 2008. Biosorption of a textile dye (Acid Blue40) by cone biomass of Thuja orientalis: Estimation of equilibrium, thermodynamic andkinetic parameters. Bioresour. Technol. 99: 3057–3065.
Barreto, W. J., S. R. G. Barreto, I. S. Scarminio, and F. Inoue. 2010. Quantification of TextileDyes in Industrial Effluent Using UV-Vis Spectrophotometry Combined with PrincipalComponents Regression. Anal. Lett. 43: 814–822.
Barreto, W. J., N. D. Bernardino, R. Afonso, and S. M. O. Doi. 2011. Biodegradation of a mix-ture of textile dyes using the fungus Ganoderma sp: a kinetic study. Quim. Nova 34: 568–572.
Campos, R., A. Kandelbauer, K. H. Robra, A. Cavaco-Paulo, and G. M. Gubitz. 2001.Indigo degradation with purified laccases from Trametes hirsuta and Sclerotium rolfssi. J.Biotechnol. 89: 131–139.
Carvalho, A. R., M. N. Sanchez, J. Wattoom, and R. G. Brereton. 2006. Comparison of PLSand kinetic models for a second order reaction as monitored using ultraviolet visible andmid infrared spectroscopy. Talanta 68: 1190–1200.
Cristovao, R. O., A. P. M. Tavares, A. S. Ribeiro, J. M. Loureiro, R. A. R. Boaventura, andE. A. Macedo. 2008. Kinetic modeling and simulation of laccase catalyzed degradation ofreactive textile dyes. Bioresour. Technol. 99: 4768–4774.
Eichlerova, I., L. Homolka, and F. Nerud. 2007. Decolorization of high concentrations ofsynthetic dyes by the white rot fungus Bjerkandera adusta strain CCBAS 232. Dyes Pigm.75: 38–44.
Forgacs, E., T. Cserhati, and G. Oros. 2004. Removal of synthetic dyes from wastewaters: Areview. Environ. Int. 30: 953–971.
Harazono, K., and K. Nakamura. 2005. Decolorization of mixtures of different reactive textiledyes by the white-rot basidiomycete Phanerochaete sordida and inhibitory effect ofpolyvinyl alcohol. Chemosphere 59: 63–68.
Kamida, H. M., L. R. Durrant, R. T. R. Monteiro, and E. D. Armas. 2005. Biodegradation oftextile effluents by Pleurotus sajor-caju. Quim. Nova 28: 629–632.
Kirby, N., R. Marchant, and G. McMullan. 2000. Decolourisation of synthetic textile dyes byPhlebia tremellosa. FEMS Microbiol. Lett. 188: 93–96.
Kunz, A., P. Peralta-Zamora, S. G. Moraes, and N. Duran. 2002. New tendencies on textileeffluent treatment. Quim. Nova 25: 78–82.
Kunz, A., V. Reginatto, and N. Duran. 2001. Combined treatment of textile effluent using thesequence Phanerochaete chrysosporium-ozone. Chemosphere 44: 281–287.
Ledakowicz, S., M. Solecka, and R. Zylla. 2001. Biodegradation, decolourisation and detoxifica-tion of textile wastewater enhanced by advanced oxidation processes. J. Biotechnol. 89: 175–184.
Lucilha, A. C., C. E. Bonancea, W. J. Barreto, and K. Takashima. 2010. Adsorption of thediazo dye direct red 23 onto a zinc oxide surface: A spectroscopic study. Spectrochim. ActaA 75: 389–393.
Machado, K. M. G., L. C. A. Compart, R. O. Morais, L. H. Rosa, and M. H. Santos. 2006.Biodegradation of reactive textile dyes by basidiomycetous fungi from brazilian ecosystems.Braz. J. Microbiol. 37: 481–487.
1722 W. J. BARETTO ET AL.
Dow
nloa
ded
by [
Uni
vers
ity o
f G
uelp
h] a
t 04:
23 2
5 A
ugus
t 201
2
Martins, M. A. M., I. C. Ferreira, I. M. Santos, M. J. Queiroz, and N. Lima. 2001. Biodegra-dation of bioaccessible textile azo dyes by Phanerochaete chrysosporium. J. Biotechnol. 89:91–98.
Mechichi, T., N. Mhiri, and S. Sayadi. 2006. Remazol brilliant blue R decolorization by thelaccase from Trametes trogii. Chemosphere 64: 998–1005.
Murugesan, K., A. Dhamija, I. Nam, Y. Kim, and Y. Chang. 2007. Decolourization ofreactive black 5 by laccase: Optimization by response surface methodology. Dyes Pigm.75: 176–184.
Nevado, J. J. B., J. R. Flores, and M. J. V. Llerena. 1998. Simultaneous spectrophotometricdetermination of Tartrazine, Sunset Yellow and Ponceau 4R in commercial products bypartial least squares and principal component regression multivariate calibration methods.Fresen. J. Anal. Chem. 361: 465–472.
Novotny, C., B. Rawal, M. Bhatt, M. Patel, V. Sasek, and H. P. Molitoris. 2011. Capacityof Irpex lacteus and Pleurotus ostreatus for decolorization of chemically different dyes.J. Biotechnol. 89: 113–122.
Paszczynski, A., V. B. Huynh, and R. Crawford. 1985. Enzymatic activities of an extracellular,manganese-dependent peroxidase from Phanerochaete chrysosporium. FEMS Microbiol.Lett. 29: 37–41.
Peralta-Zamora, P., A. Kunz, N. Nagata, and R. J. Poppi. 1998. Spectrophotometric determi-nation of organic dye mixtures by using multivariate calibration. Talanta 47: 77–84.
Robinson, T., G. McMullan, R. Marchant, and P. Nigam. 2001. Remediation of dyes in tex-tile effluent: a critical review on current treatment technologies with a proposed alternative.Bioresour. Technol. 77: 247–255.
Rossel, R. A. V. 2008. Software for chemometric analysis of spectroscopic data. Chemom.Intell. Lab. Syst. 90: 72–83.
Saito, T., P. Hong, K. Kato, M. Okazaki, H. Inagaki, S. Maeda, and Y. Yokogawa. 2003.Purification and characterization of an extracellular laccase of a fungus (family Chaetomia-ceae) isolated from soil. Enzyme Microb. Technol. 33: 520–526.
Scarminio, I. S., D. N. Ishikawa, W. J. Barreto, E. L. Paczkowski, and I. C. Arruda. 1998. Qmode factor multivariate calibration for systems with overlapped bands. Quim. Nova 21:590–596.
Shedbalkar, U., R. Dhanve, and J. J. Jadhav. 2008. Biodegradation of triphenylmethane dyecotton blue by Penicillium ochrochloron MTCC 517. J. Hazard. Mater. 157: 472–479.
Slokar, T. M., and A. M. L. Marechal. 1998. Methods of decoloration of textile wastewaters.Dyes Pigm. 37: 335–356.
Zhao, X., and I. R. Hardin. 2007. HPLC and spectrophotometric analysis of biodegradationof azo dyes by Pleurotus ostreatus. Dyes Pigm. 73: 322–325.