COMPARISON OF CONSUMER PRICE INDEX BASKET BETWEEN CURRENT BASE YEAR AND NEW BASE YEAR IN MYANMAR By Nyaung Tai A call paper submitted in Requirement for ESCAP Asia-Pacific Economic Statistics Week Seminar Component Bangkok, 2 – 4 May 2016 at the Central Statistical Organization (CSO) 5 April 2016
Transcript
COMPARISON OF CONSUMER PRICE INDEX BASKET BETWEEN CURRENT
Table 2.1 Comparison of weights between 2006 base year and 2012 base year……. 6
Table 2.2 Comparison of CPI basket between 2006 base year and 2012base year... 8
Table 3.1 Components and weights of the CPI basket…………………………………… 11
Table 3.2 Differences method between current CPI and new CPI……………………. 14
Table 4.1 Comparison of CPI& Inflation between 2006 current base year and 2012
new base year……………………………………………………………………. 16
Table 4.2 Comparison of monthly CPI& Inflation between current base year and new
base year of 2015………………………………………………………………… 17
Table 4.3 Base year comparison within ASEAN Countries ……………………………. 19
LIST OF FIGURES
iv
Figure 4.1 Comparison of monthly CPI& Inflation between current base year and
new base year of 2015……………………………………………………….. 18
ACRONYMS
ASEAN Association of South East Asian Nations
CES Consumer Expenditure Survey
COICOP Classification of Individual Consumption according to Purpose
v
CPI Consumer Price Index
CSO Central Statistical Organization
FPI Fisher Price Index
HIES Household Income and Expenditure Survey
LPI Laspeyres’ Price Index
MNPED Ministry of National Planning and Economic Development
PPI Paasche Price Index
RAP Ratio of Arithmetic Mean Prices
Abstract
This paper studies the comparison of Consumer Price Index (CPI) basket between current base year and new base year. The Central Statistical Organization (CSO) is collecting the prices of selected commodities (158) items for computing states/regions and union levels of CPI with Laspeyres’ Price Index (LPI) formula on the 2006 base year that is using simple average method. The selected commodities includes (83) food items and (75) non-food items are taken as representative consumer market basket items from Household Income and Expenditure Survey (HIES) that used stratified three stages random sampling and collected data on commodities and services (436) items from 32000 households of 80 townships in December 2006. CPI 2006 base year covered for only urban household. CSO
vi
is trying improving CPI to change new 2012 base year that consists of selected commodities (274) items from 32669 households in 82 townships of HIES by using Classification of Individual Consumption according to Purpose (COICOP), the standard international classification as well as present classification of items adopted in the existing CPI numbers compiled at both of urban and rural level. New CPI base year will be used Modified Laspeyres’ Price Index. The selected commodities are food (108) and non-food (166) to compute CPI by using geometric mean method. In the market economy, prices are basically determined by forces of supply and demand. As price have influence on the behavior of the economy, and impact on the real income of the people, a number of price indexes are constructed and used in economic analysis. It shows the changes in prices of specific consumer items in a representative consumer market basket related to a base period which represents a fairly normal period insofar as possible. Key words: Laspeyres Price Index, Modified Laspeyres’ Price Index, Simple Average Method, Geometric Mean Method, Improving CPI, Inflation
1
CHAPTER 1
INTRODUCTION
1.1 Background
The world is enjoying the fruits of modern technology in many ways which are based on
the quality of statistics for economic sector. Economic statistics is very important for a country.
The statistics indicates the real economic conditions of a country and economic statistics (or)
indicators are showing how much economic growth can be reflected on people of the country.
Myanmar has been moving towards a free market-oriented economy, since late 1988. In
the market economy, prices are basically determined by forces of supply and demand. As prices
have influence on the behavior of the economy and impact on the real income of the people, a
number of price indexes are constructed and used in economic analysis. Among them, CPI is a
widely referred one that draws the attention of policy-makers, decision-makers, entrepreneurs
and investors and which also concerns the general public. It shows the changes in prices of
specific consumer items in a representative consumer market basket related to a base period.
The CSO had used differing years such as 1958, 1965,1972,1978,1986, 1997 as the
base period in CPI computation over time. CPI measures changing of prices based on nation-
wide HIES which conducted once in five years. CPI is used as a principal measure of Inflation in
Myanmar. CPI and Inflation are key economic indicators; CSO computes monthly CPI for the
users at varied levels, i.e., union, regions/states and cities and submits the findings to the higher
authorities for necessary action, within a week from the end of month reported.
1.2. Objectives of the study
HIES survey uses to conduct for using CPI base year. CSO is now using 2006 base year
for computing CPI based on HIES which was conducted in December 2006. When conducting
the 2006 HIES, sampling frame drown out form administrative records released by Ministry of
Home Affair. In this survey, three stages stratified random sampling had used. These were as
2
follows: 1st stage for townships, 2nd stage for wards and village tracks and 3rd stage for
households. In this survey, 32000 households in 80 townships were monitored.
When compiling the CPI 2006-based, Union price is a weighted average price of these
80 townships. The fluctuation of CPI depends on its weight and prices. In 2006-based, there are
only 158 commodities including 83 food items and 73 goods and services, and the commodities
are mostly domestic products. Therefore, Items lists are out of date and it is need to repair
modernized. Moreover, the order of item does not in line with the COICOP and it can’t compare
with the statistics of international agencies. Above mentioned problems, CSO need to change
the new CPI base-year. As the objectives of this paper, 3 parts are shown as follows;
(1) To overcome the problems of 2006 base CPI
(2) To standardize in line with international level
(3) To reflect the current situation consumption
1.3. Organization of the study
This paper consists of five chapters. The first chapter comprises introduction,
background, objectives, and paper organization. Chapter 2 describes literature review, which
states previous empirical evidence of compilation of the CPI in a country. Chapter 3 explains
using data and methodology. Chapter 4 shows discussion of the results. Finally, Chapter 5
concludes the paper by showing the comparison result of the 2006 base year and 2012 new
base year in Myanmar.
3
CHAPTER 2
LITERATURE REVIEW
The price section of CSO under the Ministry of National Planning and Economic
Development (MNPED) is collecting, compiling, computing, and dissemination the price of
selected commodities for states/regions, and Union levels of CPI and Inflation. The price section
has been summiting daily CPI for Yangon, Naypyitaw (Pyimana, Lawei, and Tatkone), gold
prices and US $ value to higher Authority. And also, 15 states/ regions, Yangon City, Mandalay
City, and Naypyitaw Council of CPI and inflation for weekly, monthly, and yearly are presented.
Price section has been using 2006 base year to computing CPI with LPI formula. CPI basket
weights based on HIES, 2006 December. In “Base Year Revision of Consumer Price Index
(CPI)”, Republic of India Ministry of Statistics and Programme Implementation (2015) writes that
the base year of this series of CPI is 2010=100 and weighting diagrams are based on the
results of Consumer Expenditure Survey (CES) 2004-05.
Current commodities’ price reflects on individual consumption by households. Changes
in price level of goods and services in Myanmar that most people buy for their day-to-day
consumption. Therefore, our CPI baskets need to reflect the consuming of Myanmar’s
households. New CPI with a base year of 2012 will meet with our needs. CSO is now working
on an updated consumer price index to measure retail inflation that would have a lesser
weighted for food prices. Veronica & Irene (2010) showed that the rate of change in the CPI,
which captures the changes in the characteristic Filipino household cost of living based on the
movements of the prices of items in the basket of goods and services consumed.
The current base year is using CPI basket (158) items in accordant with Myanmar
consumption pattern in 2006. CSO is now trying improving CPI that is to change new 2012 base
year with COICOP that consists of (12) heading group. The international standard classification
of COICOP that is being followed the geometric mean, instead of arithmetic mean being used in
4
the old series, of the price relatives with respect to base prices would be used to collect CPI
basket item (Republic of India Ministry of Statistics and Programme Implementation,2015).
2.1. Concepts and definition
2.1.1 Consumer Price Index (CPI)
The CPI represents prices paid by consumers or households. Prices for a basket of
goods are compiled for a certain base period. Price data for the same basket of goods is then
collected on a monthly basis. This data is used to compare the prices for a particular month with
the prices from a different time period. The CPI measures the average change in the retail price
of goods and service purchased and consumed overtime.
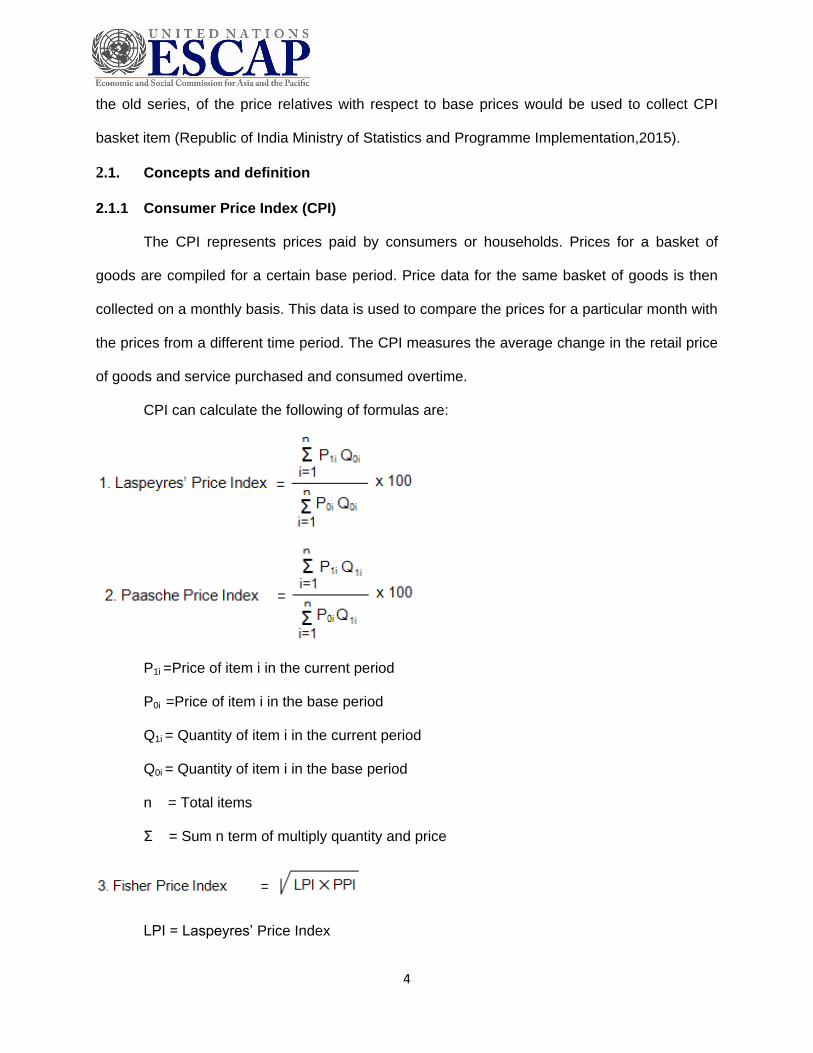
CPI can calculate the following of formulas are:
P1i =Price of item i in the current period
P0i =Price of item i in the base period
Q1i = Quantity of item i in the current period
Q0i = Quantity of item i in the base period
n = Total items
Σ = Sum n term of multiply quantity and price
LPI = Laspeyres’ Price Index
5
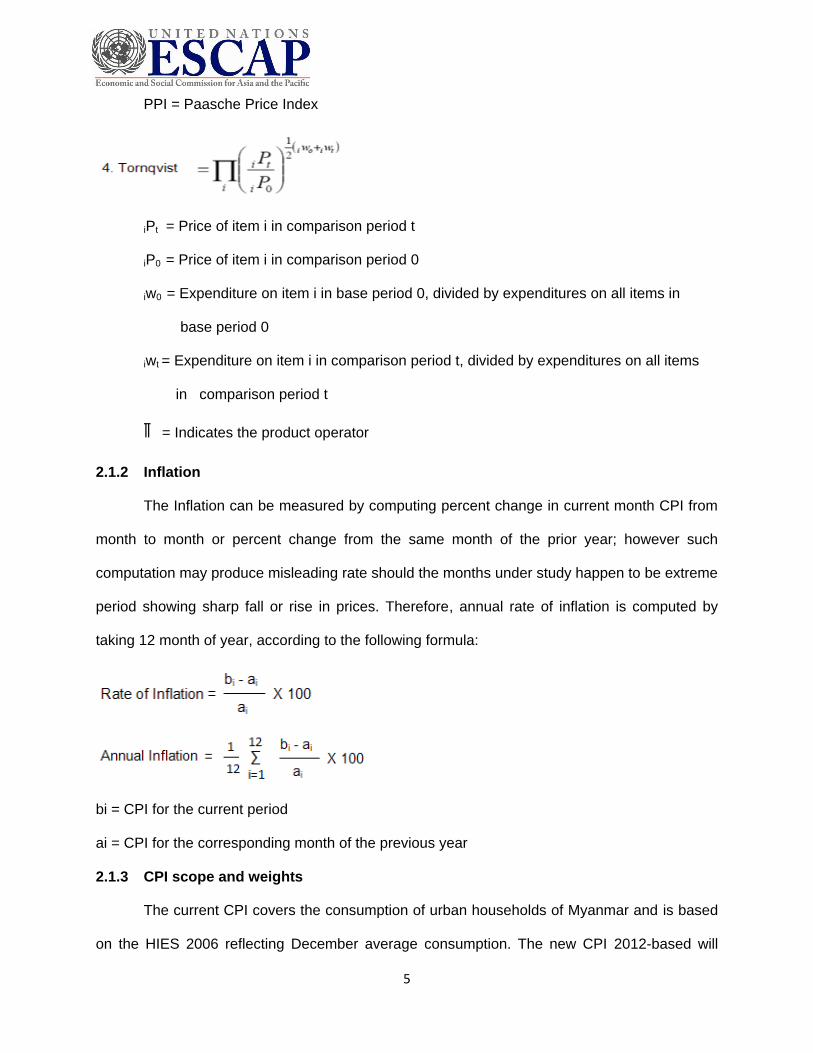
PPI = Paasche Price Index
iPt = Price of item i in comparison period t
iP0 = Price of item i in comparison period 0
iw0 = Expenditure on item i in base period 0, divided by expenditures on all items in
base period 0
iwt = Expenditure on item i in comparison period t, divided by expenditures on all items
in comparison period t
∏ = Indicates the product operator
2.1.2 Inflation
The Inflation can be measured by computing percent change in current month CPI from
month to month or percent change from the same month of the prior year; however such
computation may produce misleading rate should the months under study happen to be extreme
period showing sharp fall or rise in prices. Therefore, annual rate of inflation is computed by
taking 12 month of year, according to the following formula:
bi = CPI for the current period
ai = CPI for the corresponding month of the previous year
2.1.3 CPI scope and weights
The current CPI covers the consumption of urban households of Myanmar and is based
on the HIES 2006 reflecting December average consumption. The new CPI 2012-based will
6
cover both urban and rural private household consumption based on the HIES 2012. The
December average consumption per urban and rural households was used to derive total
consumption of all households in the regions/states. As total expenditure was measured in
December 2012 with prices of that period, the weights were price-updated to current price level
using the current indices. For new products; the index of a link product was used to proxy the
price change of the new product. The regions/states level consumptions were used to receive
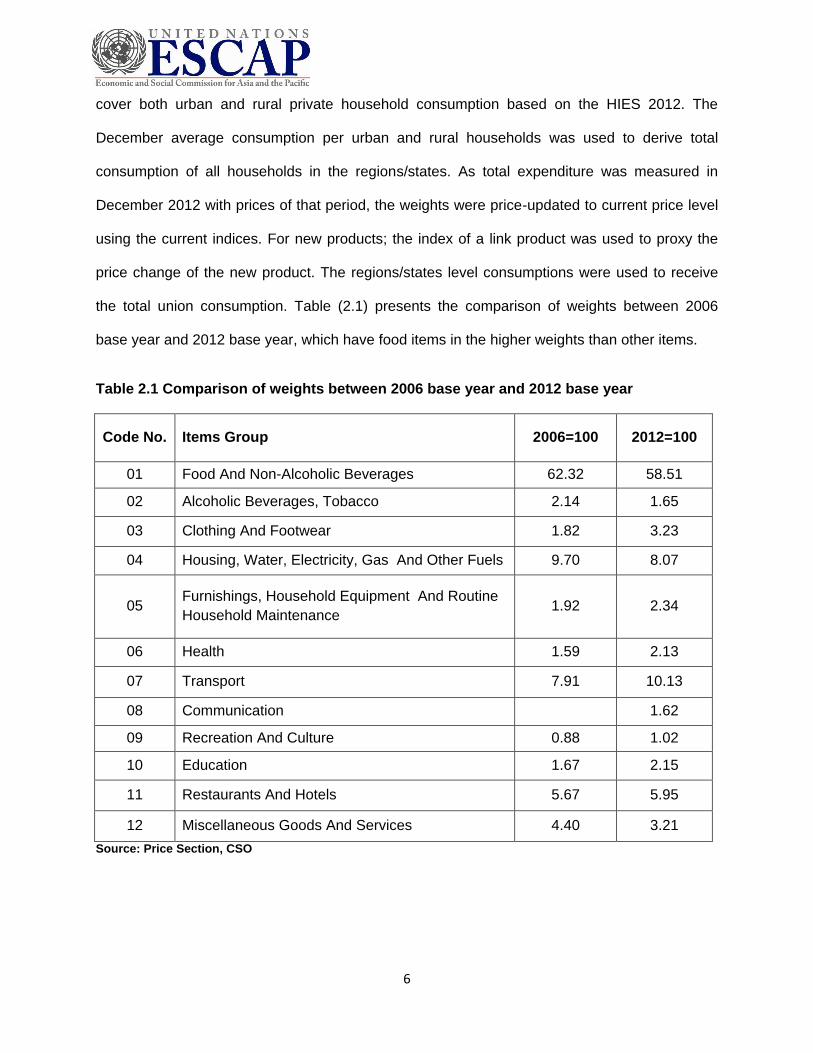
the total union consumption. Table (2.1) presents the comparison of weights between 2006
base year and 2012 base year, which have food items in the higher weights than other items.
Table 2.1 Comparison of weights between 2006 base year and 2012 base year
Code No. Items Group 2006=100 2012=100
01 Food And Non-Alcoholic Beverages 62.32 58.51
02 Alcoholic Beverages, Tobacco 2.14 1.65
03 Clothing And Footwear 1.82 3.23
04 Housing, Water, Electricity, Gas And Other Fuels 9.70 8.07
05 Furnishings, Household Equipment And Routine
Household Maintenance 1.92 2.34
06 Health 1.59 2.13
07 Transport 7.91 10.13
08 Communication
1.62
09 Recreation And Culture 0.88 1.02
10 Education 1.67 2.15
11 Restaurants And Hotels 5.67 5.95
12 Miscellaneous Goods And Services 4.40 3.21
Source: Price Section, CSO
7
2.1.4 CPI basket and classification
The new CPI introduces the UN COICOP classification. The classification is used
internationally and makes it possible to make international comparison of inflation on more
detailed level. The current CPI includes 158 products and services, 83 food items and 75 non-
food items. The new CPI has 274 products and services, 108 food items, 166 non-food items
including goods and services. There are new 116 items in the index, for example new and used
cars, mobile phones and mobile phone charges and computers…etc. When constructing the
CPI 2006-based, both of purchased and non-purchased items are included. But in 2012-based,
non-purchased items are excluded from total expenditure. In table (2.2) there is a comparison of
weights between 2006 base year and 2012 base year.
8
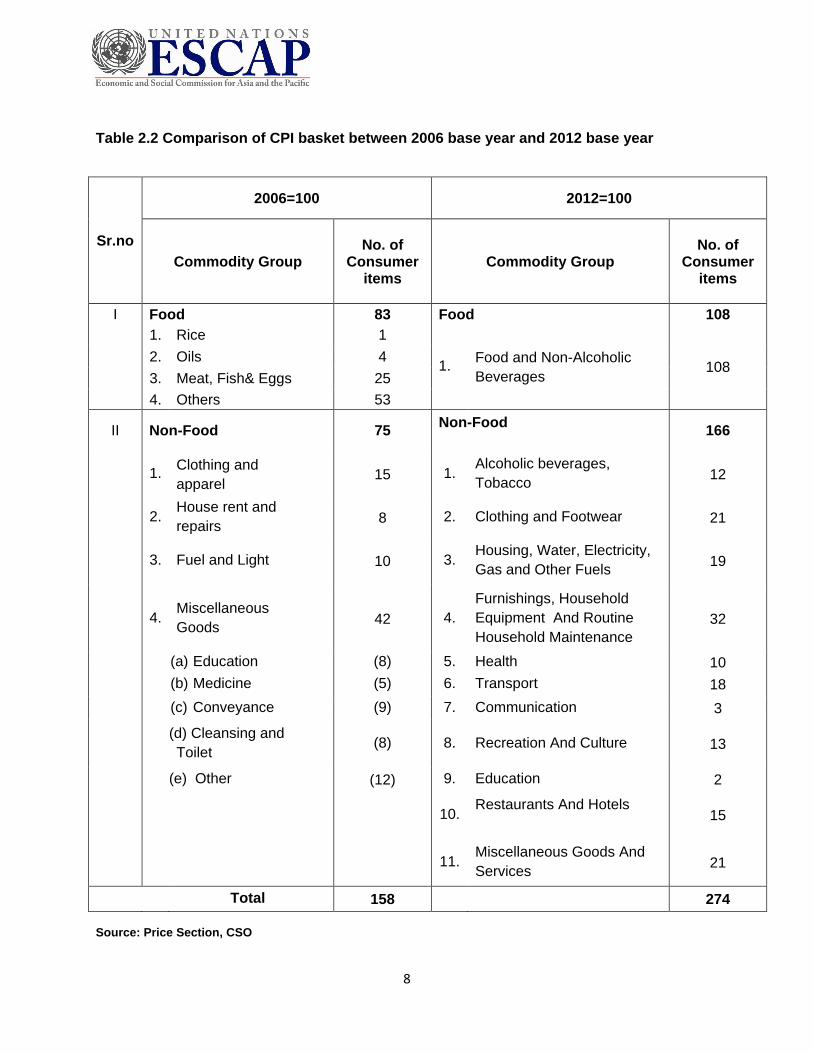
Table 2.2 Comparison of CPI basket between 2006 base year and 2012 base year
Sr.no
2006=100 2012=100
Commodity Group
No. of Consumer
items
Commodity Group
No. of Consumer
items
I Food 83 Food 108
1. Rice 1
1. Food and Non-Alcoholic
Beverages 108
2. Oils 4
3. Meat, Fish& Eggs 25
4. Others 53
II Non-Food 75 Non-Food
166
1. Clothing and
apparel 15 1.
Alcoholic beverages,
Tobacco 12
2. House rent and
repairs 8 2. Clothing and Footwear 21
3. Fuel and Light 10 3. Housing, Water, Electricity,
Gas and Other Fuels 19
4. Miscellaneous
Goods 42 4.
Furnishings, Household
Equipment And Routine
Household Maintenance
32
(a) Education (8) 5. Health 10
(b) Medicine (5) 6. Transport 18
(c) Conveyance (9) 7. Communication 3
(d) Cleansing and
Toilet (8) 8. Recreation And Culture 13
(e) Other (12) 9. Education 2
10. Restaurants And Hotels
15
11. Miscellaneous Goods And
Services 21
Total 158 274
Source: Price Section, CSO
9
CHAPTER 3
DATA AND METHODOLOGY
3.1. Regional Data
In the current CPI the indices are compiled in township level. And also, CSO is
computing CPI and Inflation for union, states and region levels. The new CPI will be compiled in
states/regions level and 3 major cities (Yangon, Mandalay and Naypyitaw) and Union level. The
Yangon, Mandalay and Naypyitaw region indices are compiled excluding the cities. Therefore,
union level consists of states/regions (15) and (3) major cities, which are total of (18) townships.
3.2 Selecting Commodity and Outlets
In selecting the items as CPI basket, it depends on consumption of households that
spend more on some items and less on the others. A total of 274 varieties are included in the
CPI basket, 108 items for food and 166 items for non-food including goods and services. They
are classified into 12 main divisions based widely on the COICOP. In the CPI 2012 base, some
new products come to include which were not included in 2006-based such as automobile,
motorcycle, computer, cell phone, call charges etc. Outlets were chosen depend on total
number of households within a township. Total outlets, therefore, among the cities were not
same. The total number of outlets selected for pricing is 258 and observation prices are about
70,692.
3.3 Price Collection
The current CPI prices are collected on a weekly basis from 80 townships, 4 outlets in
each township. The weekly average price of township is calculated. Average price of state is
receives as an average of these township averages. Also the union level average price is
calculated as non-weighted average of township averages. The upper level index is then
achieved as weighted average of these lower level averages of averages.
10
In the new CPI prices will be collected from 82 townships. Number of outlets in one
township depends on the number of households in the township. In biggest townships, there are
7 outlets and in the smallest townships there is 1 outlet. The prices will be collected only once a
month/outlet, but in region/state level all weeks of the month are covered.
Individual outlet the prices are collected at the same week of the month. In total there
are 258 outlets in the sample. For homogenous products, e.g. Rice Emata, only one price per
outlet is collected, for more heterogeneous product, e.g. Mobile phones, two to three prices per
outlet is collected. Some prices that are same in the whole union, e.g. electricity, are centrally
collected and the same index is used for all states/regions.
3.4 CPI Weighting Pattern
In compilation of the CPI, weights are required to reflect the relative importance of each
item in the basket, that is, their share as a proportion of total household expenditure. In driving
the CPI weight, 15 states and regional and 3 major cities were compiled, and Yangon,
Mandalay and Naypyitaw region weight were constructed excluding the cities. Weights of Union,
state and regional level are shown in Table (3.1).
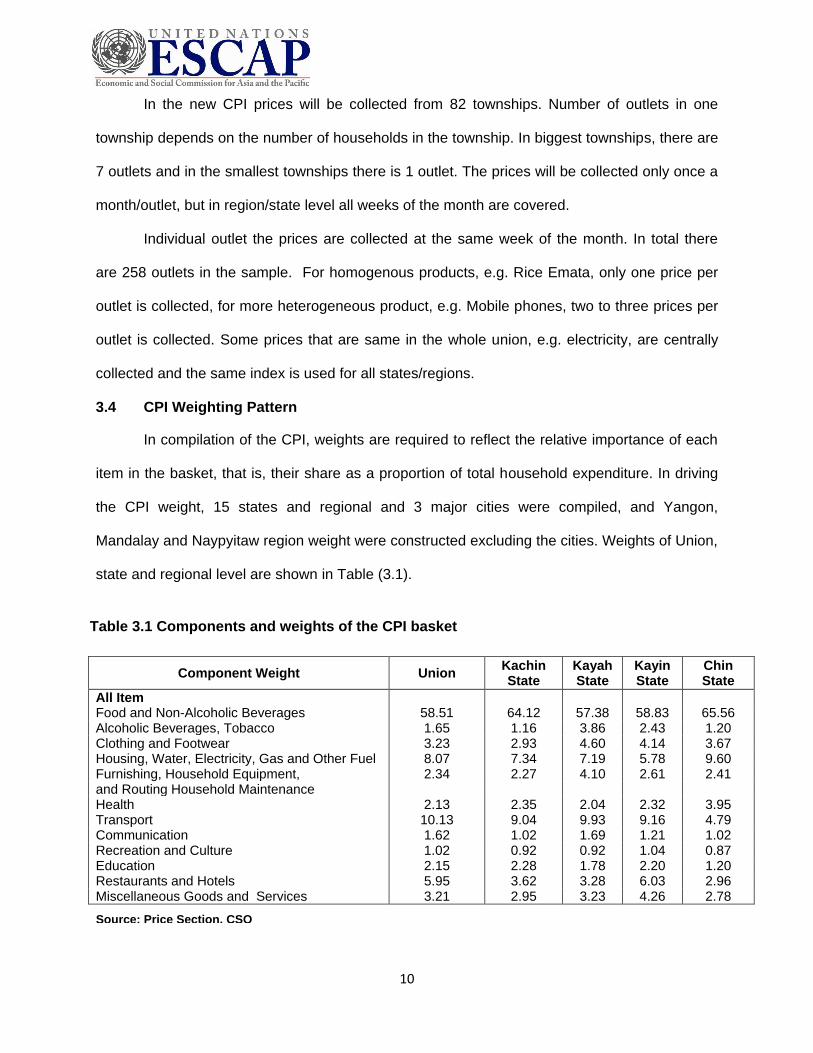
Table 3.1 Components and weights of the CPI basket
Component Weight Union Kachin State
Kayah State
Kayin State
Chin State
All Item Food and Non-Alcoholic Beverages 58.51 64.12 57.38 58.83 65.56 Alcoholic Beverages, Tobacco 1.65 1.16 3.86 2.43 1.20 Clothing and Footwear 3.23 2.93 4.60 4.14 3.67 Housing, Water, Electricity, Gas and Other Fuel 8.07 7.34 7.19 5.78 9.60 Furnishing, Household Equipment, 2.34 2.27 4.10 2.61 2.41 and Routing Household Maintenance Health 2.13 2.35 2.04 2.32 3.95 Transport 10.13 9.04 9.93 9.16 4.79 Communication 1.62 1.02 1.69 1.21 1.02 Recreation and Culture 1.02 0.92 0.92 1.04 0.87 Education 2.15 2.28 1.78 2.20 1.20 Restaurants and Hotels 5.95 3.62 3.28 6.03 2.96 Miscellaneous Goods and Services 3.21 2.95 3.23 4.26 2.78
Source: Price Section, CSO
11
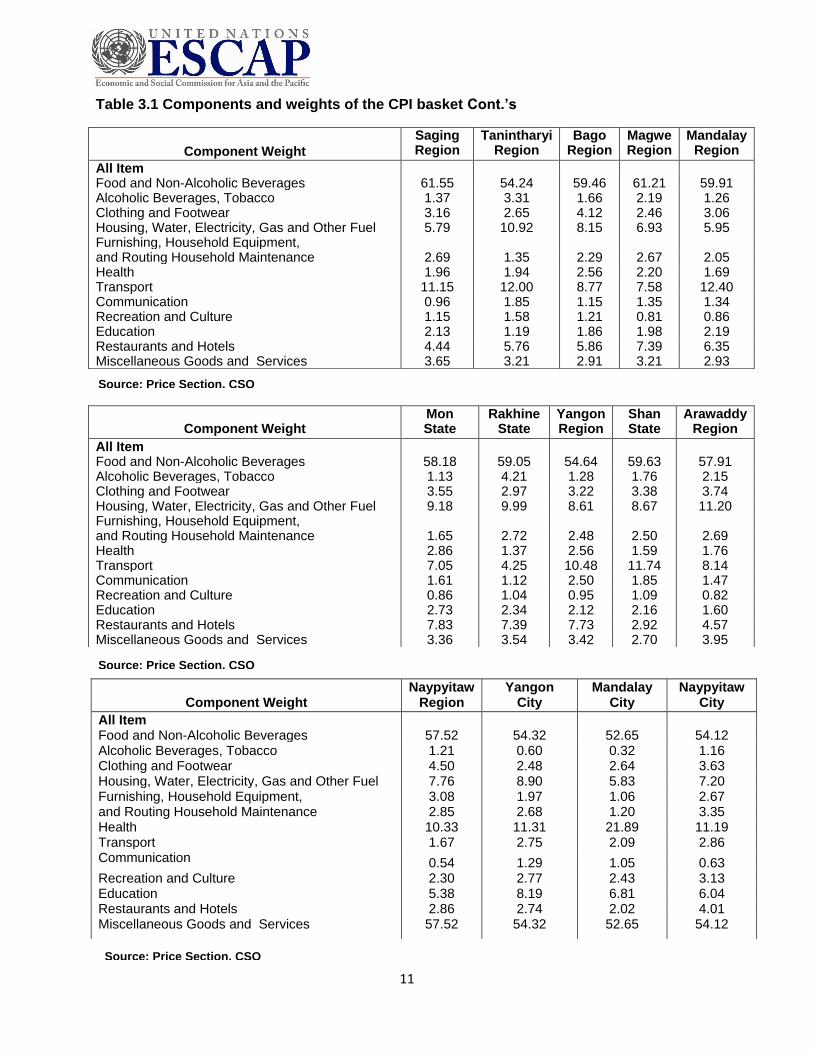
Table 3.1 Components and weights of the CPI basket Cont.’s
Component Weight
Saging Region
Tanintharyi Region
Bago Region
Magwe Region
Mandalay Region
All Item Food and Non-Alcoholic Beverages 61.55 54.24 59.46 61.21 59.91 Alcoholic Beverages, Tobacco 1.37 3.31 1.66 2.19 1.26 Clothing and Footwear 3.16 2.65 4.12 2.46 3.06 Housing, Water, Electricity, Gas and Other Fuel 5.79 10.92 8.15 6.93 5.95 Furnishing, Household Equipment, and Routing Household Maintenance 2.69 1.35 2.29 2.67 2.05 Health 1.96 1.94 2.56 2.20 1.69 Transport 11.15 12.00 8.77 7.58 12.40 Communication 0.96 1.85 1.15 1.35 1.34 Recreation and Culture 1.15 1.58 1.21 0.81 0.86 Education 2.13 1.19 1.86 1.98 2.19 Restaurants and Hotels 4.44 5.76 5.86 7.39 6.35 Miscellaneous Goods and Services 3.65 3.21 2.91 3.21 2.93
Component Weight
Mon State
Rakhine State
Yangon Region
Shan State
Arawaddy Region
All Item Food and Non-Alcoholic Beverages 58.18 59.05 54.64 59.63 57.91 Alcoholic Beverages, Tobacco 1.13 4.21 1.28 1.76 2.15 Clothing and Footwear 3.55 2.97 3.22 3.38 3.74 Housing, Water, Electricity, Gas and Other Fuel 9.18 9.99 8.61 8.67 11.20 Furnishing, Household Equipment, and Routing Household Maintenance 1.65 2.72 2.48 2.50 2.69 Health 2.86 1.37 2.56 1.59 1.76 Transport 7.05 4.25 10.48 11.74 8.14 Communication 1.61 1.12 2.50 1.85 1.47 Recreation and Culture 0.86 1.04 0.95 1.09 0.82 Education 2.73 2.34 2.12 2.16 1.60 Restaurants and Hotels 7.83 7.39 7.73 2.92 4.57 Miscellaneous Goods and Services 3.36 3.54 3.42 2.70 3.95
Source: Price Section, CSO
Source: Price Section, CSO
Component Weight
Naypyitaw Region
Yangon City
Mandalay City
Naypyitaw City
All Item Food and Non-Alcoholic Beverages 57.52 54.32 52.65 54.12 Alcoholic Beverages, Tobacco 1.21 0.60 0.32 1.16 Clothing and Footwear 4.50 2.48 2.64 3.63 Housing, Water, Electricity, Gas and Other Fuel 7.76 8.90 5.83 7.20 Furnishing, Household Equipment, 3.08 1.97 1.06 2.67 and Routing Household Maintenance 2.85 2.68 1.20 3.35 Health 10.33 11.31 21.89 11.19 Transport 1.67 2.75 2.09 2.86 Communication 0.54 1.29 1.05 0.63 Recreation and Culture 2.30 2.77 2.43 3.13 Education 5.38 8.19 6.81 6.04 Restaurants and Hotels 2.86 2.74 2.02 4.01 Miscellaneous Goods and Services
57.52 54.32 52.65 54.12
Source: Price Section, CSO
12
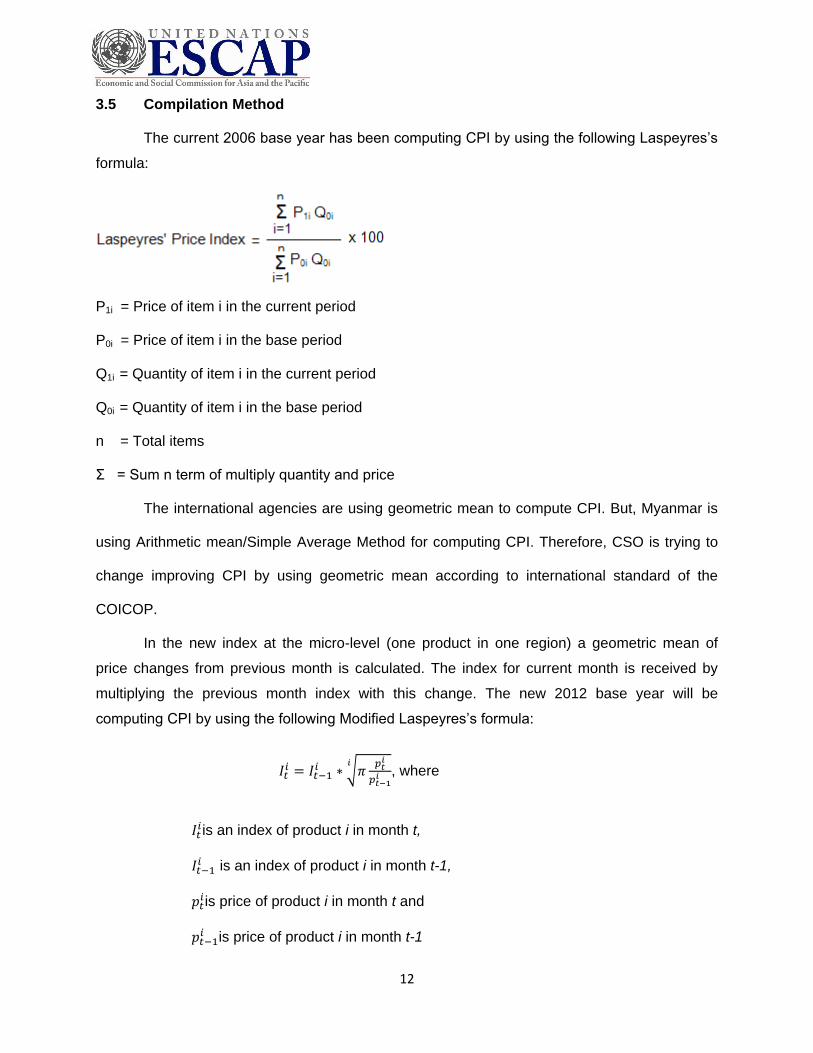
3.5 Compilation Method
The current 2006 base year has been computing CPI by using the following Laspeyres’s
formula:
P1i = Price of item i in the current period
P0i = Price of item i in the base period
Q1i = Quantity of item i in the current period
Q0i = Quantity of item i in the base period
n = Total items
Σ = Sum n term of multiply quantity and price
The international agencies are using geometric mean to compute CPI. But, Myanmar is
using Arithmetic mean/Simple Average Method for computing CPI. Therefore, CSO is trying to
change improving CPI by using geometric mean according to international standard of the
COICOP.
In the new index at the micro-level (one product in one region) a geometric mean of
price changes from previous month is calculated. The index for current month is received by
multiplying the previous month index with this change. The new 2012 base year will be
computing CPI by using the following Modified Laspeyres’s formula:
𝐼𝑡𝑖 = 𝐼𝑡−1
𝑖 ∗ √𝜋𝑝𝑡𝑖
𝑝𝑡−1𝑖
𝑖, where
𝐼𝑡𝑖 is an index of product i in month t,
𝐼𝑡−1𝑖 is an index of product i in month t-1,
𝑝𝑡𝑖 is price of product i in month t and
𝑝𝑡−1𝑖 is price of product i in month t-1
13
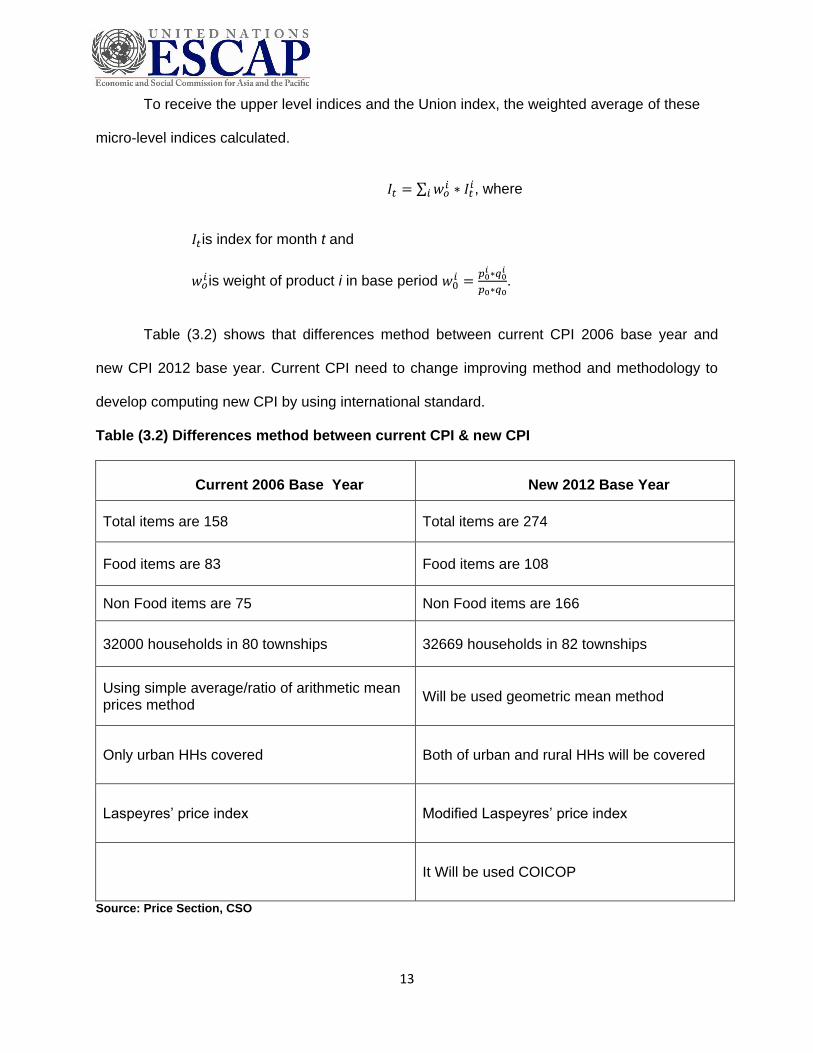
To receive the upper level indices and the Union index, the weighted average of these
micro-level indices calculated.
𝐼𝑡 = ∑ 𝑤𝑜𝑖 ∗ 𝐼𝑡
𝑖𝑖 , where
𝐼𝑡 is index for month t and
𝑤𝑜𝑖 is weight of product i in base period 𝑤0
𝑖 =𝑝0𝑖 ∗𝑞0
𝑖
𝑝0∗𝑞0.
Table (3.2) shows that differences method between current CPI 2006 base year and
new CPI 2012 base year. Current CPI need to change improving method and methodology to
develop computing new CPI by using international standard.
Table (3.2) Differences method between current CPI & new CPI
Current 2006 Base Year
New 2012 Base Year
Total items are 158 Total items are 274
Food items are 83 Food items are 108
Non Food items are 75 Non Food items are 166
32000 households in 80 townships 32669 households in 82 townships
Using simple average/ratio of arithmetic mean prices method
Will be used geometric mean method
Only urban HHs covered Both of urban and rural HHs will be covered
Laspeyres’ price index Modified Laspeyres’ price index
It Will be used COICOP
Source: Price Section, CSO
14
CSO is computing the union level of current CPI 2006 base year by fixed choosing of the
(158) items. Although, the new CPI 2012 base year is based on the expenditure of states/
regions, which is identified biggest or smallest of the expenditure for townships. Therefore, each
of townships cannot be same CPI basket for collecting items.
In Myanmar, there is also interest on average prices. In the current average prices are
calculated as mentioned above in the index methodology part. In new production system, the
average prices will be calculated on the regional level. The union level average price will be the
weighted average of these averages. The same weights are used as in the CPI calculation.
15
CHAPTER 4
DISCUSSION
4.1 Consumer Price Index and Inflation
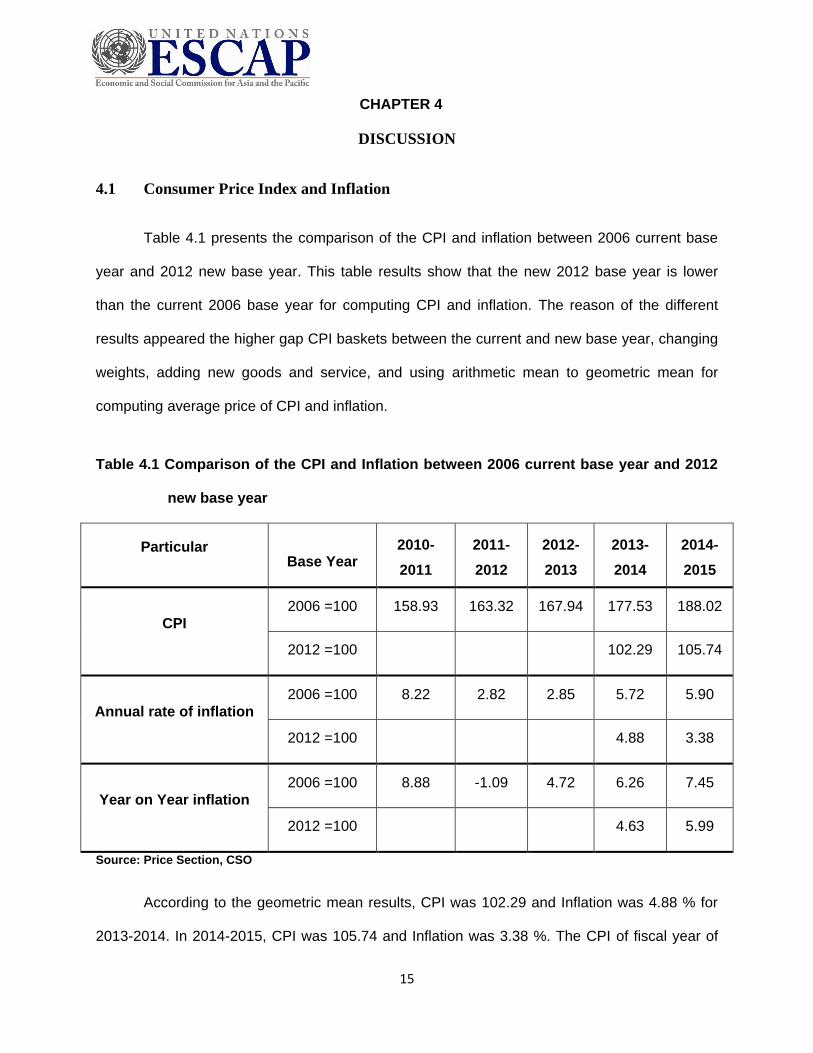
Table 4.1 presents the comparison of the CPI and inflation between 2006 current base
year and 2012 new base year. This table results show that the new 2012 base year is lower
than the current 2006 base year for computing CPI and inflation. The reason of the different
results appeared the higher gap CPI baskets between the current and new base year, changing
weights, adding new goods and service, and using arithmetic mean to geometric mean for
computing average price of CPI and inflation.
Table 4.1 Comparison of the CPI and Inflation between 2006 current base year and 2012
new base year
Particular Base Year
2010-
2011
2011-
2012
2012-
2013
2013-
2014
2014-
2015
CPI
2006 =100 158.93 163.32 167.94 177.53 188.02
2012 =100
102.29 105.74
Annual rate of inflation
2006 =100 8.22 2.82 2.85 5.72 5.90
2012 =100
4.88 3.38
Year on Year inflation
2006 =100 8.88 -1.09 4.72 6.26 7.45
2012 =100 4.63 5.99
Source: Price Section, CSO
According to the geometric mean results, CPI was 102.29 and Inflation was 4.88 % for
2013-2014. In 2014-2015, CPI was 105.74 and Inflation was 3.38 %. The CPI of fiscal year of
16
2014-2015 is higher than CPI fiscal year of 2013-2014. But, 2014-2015 fiscal year of inflation
lower than 2013-2014 of inflation. Because of the commodities’ price was not factual rising and
falling for 2013-2014 fiscal years. That’s why; the growth rate of CPI is very high.
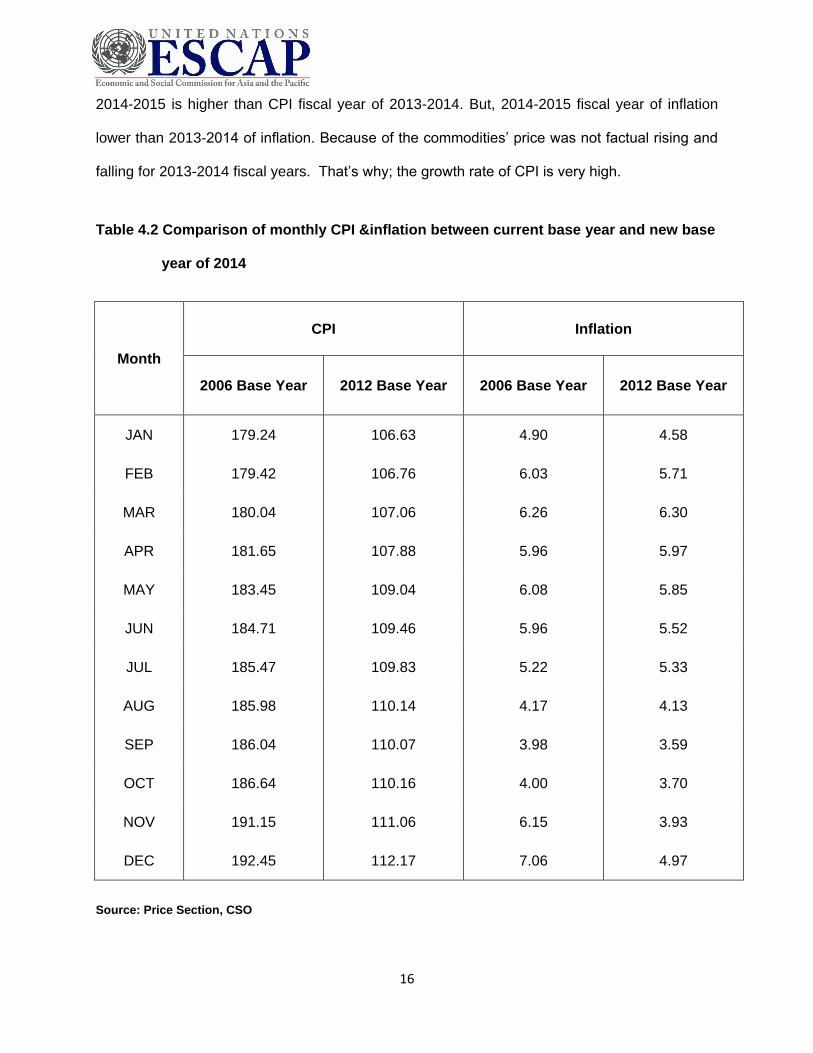
Table 4.2 Comparison of monthly CPI &inflation between current base year and new base
year of 2014
Month
CPI Inflation
2006 Base Year 2012 Base Year 2006 Base Year 2012 Base Year
JAN 179.24 106.63 4.90 4.58
FEB 179.42 106.76 6.03 5.71
MAR 180.04 107.06 6.26 6.30
APR 181.65 107.88 5.96 5.97
MAY 183.45 109.04 6.08 5.85
JUN 184.71 109.46 5.96 5.52
JUL 185.47 109.83 5.22 5.33
AUG 185.98 110.14 4.17 4.13
SEP 186.04 110.07 3.98 3.59
OCT 186.64 110.16 4.00 3.70
NOV 191.15 111.06 6.15 3.93
DEC 192.45 112.17 7.06 4.97
Source: Price Section, CSO
17
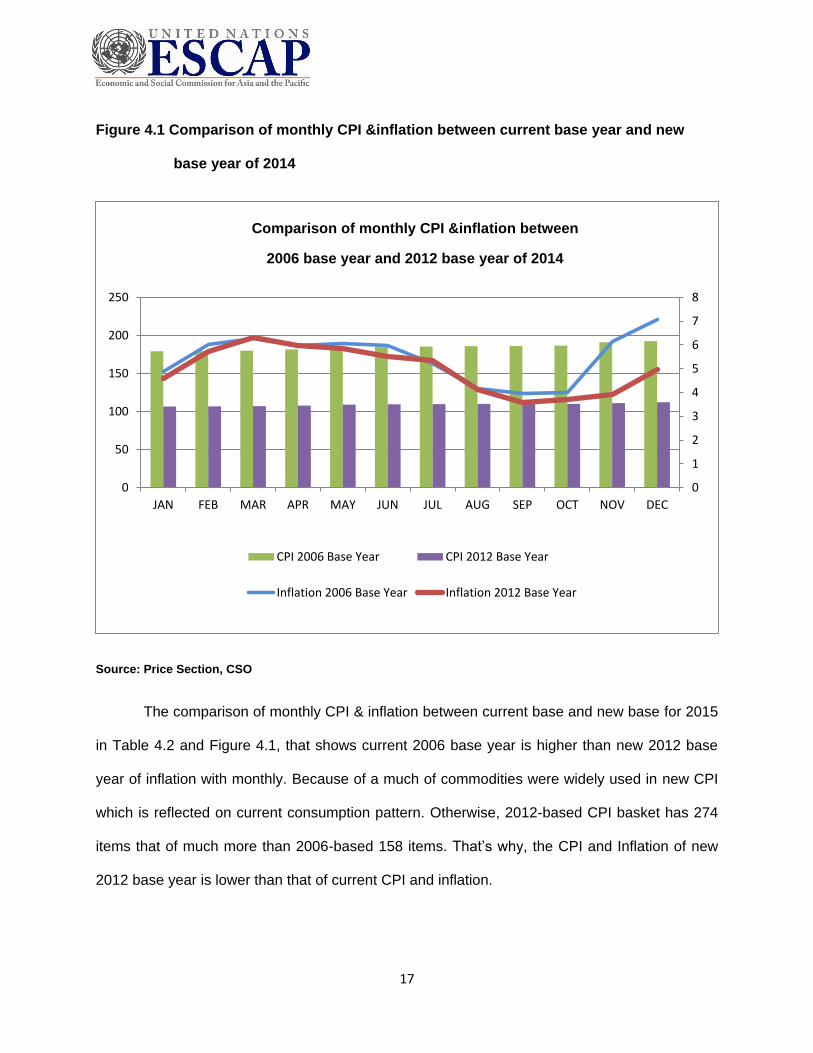
Figure 4.1 Comparison of monthly CPI &inflation between current base year and new
base year of 2014
Source: Price Section, CSO
The comparison of monthly CPI & inflation between current base and new base for 2015
in Table 4.2 and Figure 4.1, that shows current 2006 base year is higher than new 2012 base
year of inflation with monthly. Because of a much of commodities were widely used in new CPI
which is reflected on current consumption pattern. Otherwise, 2012-based CPI basket has 274
items that of much more than 2006-based 158 items. That’s why, the CPI and Inflation of new
2012 base year is lower than that of current CPI and inflation.
0
1
2
3
4
5
6
7
8
0
50
100
150
200
250
JAN FEB MAR APR MAY JUN JUL AUG SEP OCT NOV DEC
CPI 2006 Base Year CPI 2012 Base Year
Inflation 2006 Base Year Inflation 2012 Base Year
Comparison of monthly CPI &inflation between
2006 base year and 2012 base year of 2014
18
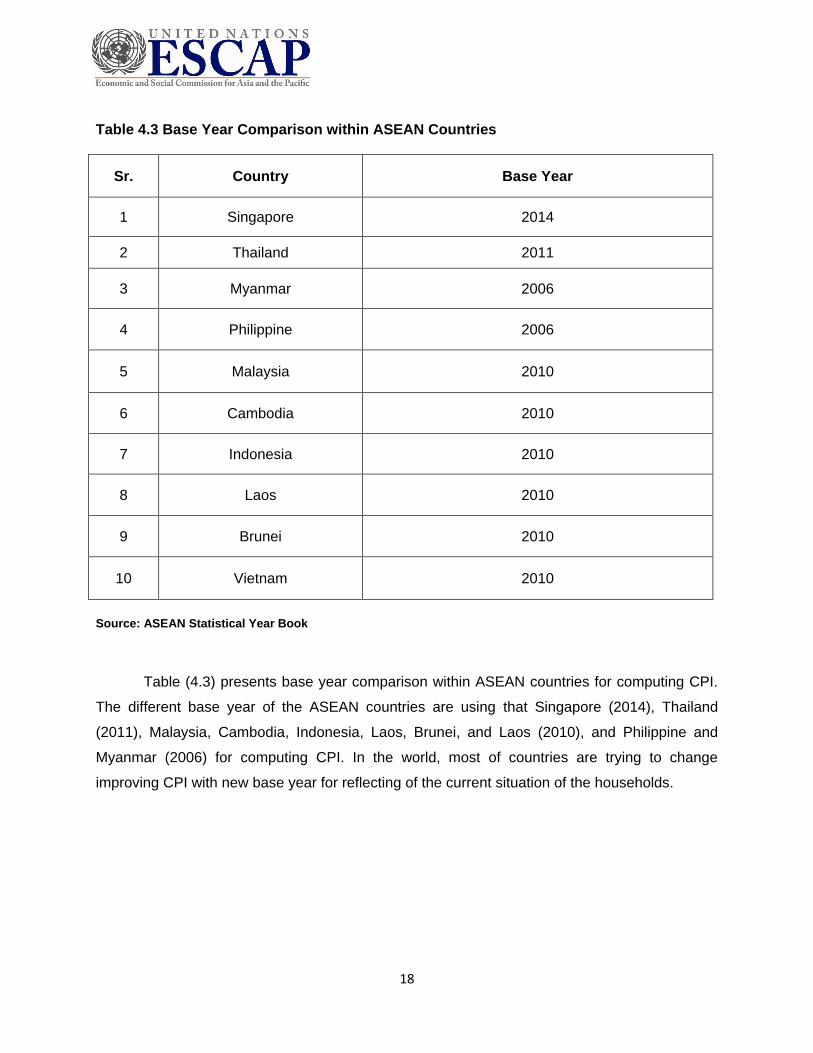
Table 4.3 Base Year Comparison within ASEAN Countries
Sr. Country Base Year
1 Singapore 2014
2 Thailand 2011
3 Myanmar 2006
4 Philippine 2006
5 Malaysia 2010
6 Cambodia 2010
7 Indonesia 2010
8 Laos 2010
9 Brunei 2010
10 Vietnam 2010
Source: ASEAN Statistical Year Book
Table (4.3) presents base year comparison within ASEAN countries for computing CPI.
The different base year of the ASEAN countries are using that Singapore (2014), Thailand
(2011), Malaysia, Cambodia, Indonesia, Laos, Brunei, and Laos (2010), and Philippine and
Myanmar (2006) for computing CPI. In the world, most of countries are trying to change
improving CPI with new base year for reflecting of the current situation of the households.
19
CHAPTER 5
CONCLUSION AND RECOMMODITION
5.1 Conclusion
CSO has been undergoing to change the CPI, which is gauge in Myanmar, base year
from 2006 to 2012. It will help the available consumption patterns across nation-wide, and for
non-food subgroup titles, the weight was significantly increased up to 41.49 % compare with
that of 37.68% in 2006 base. CPI, which tracks inflation at the consumer level, has become the
key measure of inflation for Central Bank of Myanmar (CBM) to decide on monetary policy
action. United Nation (2009) reported that CPI is widely scope, which has used macroeconomic
indicator of inflation that has been targeting and monitoring to stable price, and as deflators in
the national accounts by governments and central banks. Price section has been doing exercise
of the new CPI pattern with IMF expert, who had come to CSO of Myanmar seven times.
According to experts, the revision of base year will have a marginal impact on the index. The
methodology of calculating inflation will also see a change from the present average method to
geometric mean, which will take care of a particular category driving the entire index, an
internationally accepted practice. The CPI basket includes items for which more than 75%
households have reported consumption.
In 2006-based CPI, the key problem of the index methodology is using unweighted
average of Township prices to calculate states/regions and union level indexes are incorrect.
The states/regions level indexes to be consistent with the Township indexes require weighting.
Although average prices at Township level acceptable, a focus on deriving comparable average
prices over time results in sub-optimal indexes. The current base year has too few varieties
priced (generally only one for each item) and too few outlets (usually only one in each
Township).
The new CPI measures more data. The current CPI 2006 base year listed one index for
each of the five pricing categories (food, fuel, clothing, housing, and miscellaneous). The new
[1] Republicof India Ministry of Statistics and Programme Implementation (2015). “Base Year Revision of Consumer Price Index (CPI).” Available from www.govtempdiary.com/2015/01/base.../baseyearrevision22jan15 [2] United Nations. 2009. “Practical Guide to Producing Consumer Price Indices.” New York and Geneva. [3] Veronica, B., & Irene, T. 2010. “A Geometric Price Index for the Philippines: A Preliminary Assessment.” BSP Working Paper Series 10(01).


![Sectorwatch: Software Engineering · Software Engineering August 2018 Sector Dashboard [4] Public Basket Performance [5] Operational Metrics [7] Valuation Comparison [10] Recent Deals](https://static.documents.pub/doc/80x56/5f7ba0057a476b681909becb/sectorwatch-software-engineering-software-engineering-august-2018-sector-dashboard.jpg)


