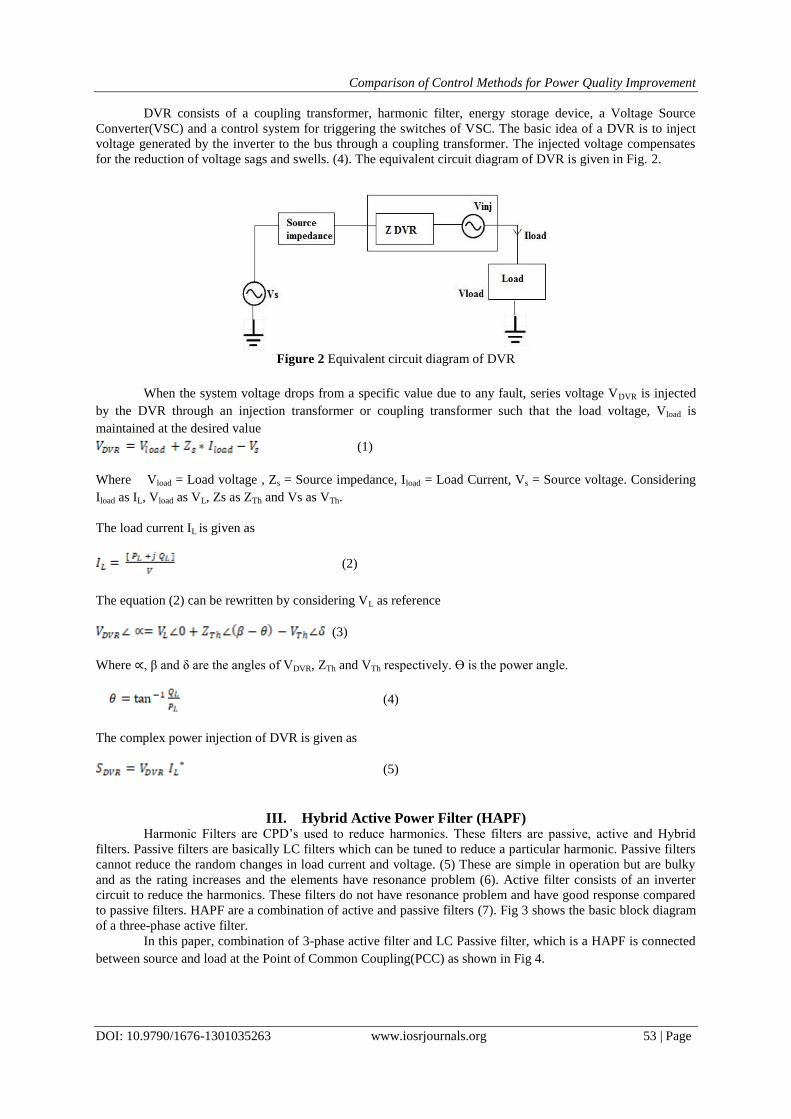
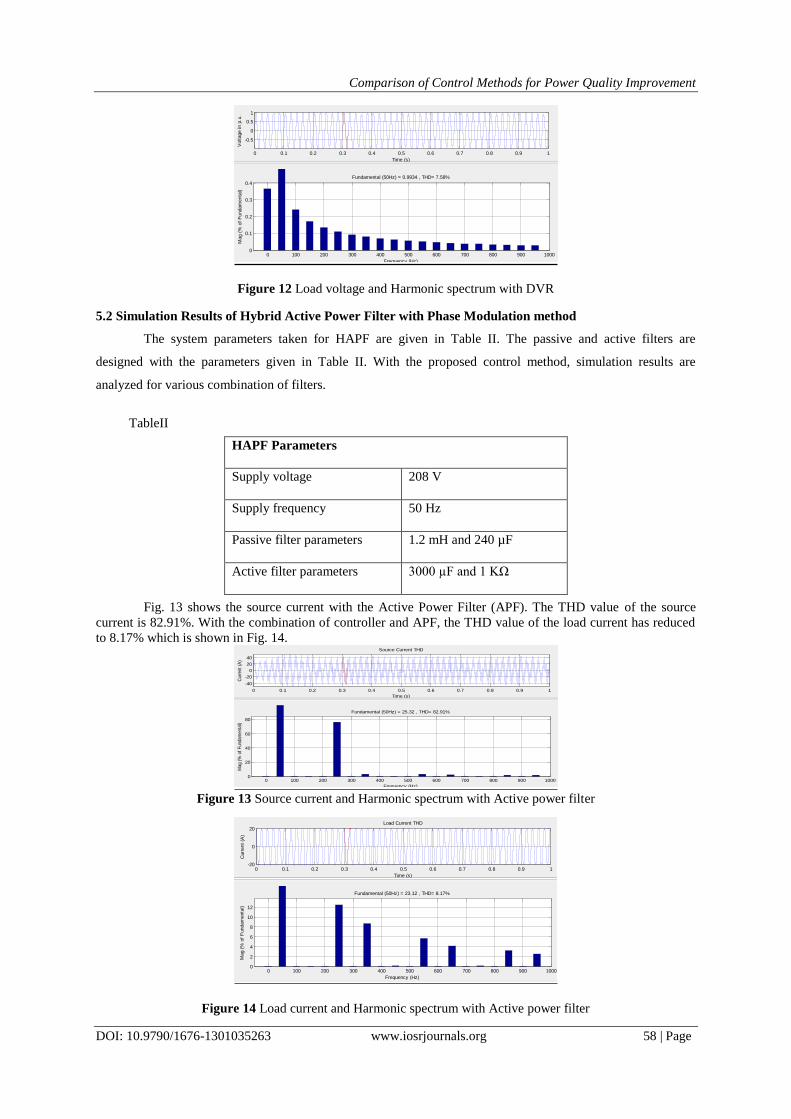
IOSR Journal of Electrical and Electronics Engineering (IOSR-JEEE) e-ISSN: 2278-1676,p-ISSN: 2320-3331, Volume 13, Issue 1 Ver. III (Jan. – Feb. 2018), PP 52-63 www.iosrjournals.org DOI: 10.9790/1676-1301035263 www.iosrjournals.org 52 | Page Comparison of Control Methods for Power Quality Improvement Using Dynamic Voltage Restorer and Hybrid Active Power Filter Ms. M. Sharanya 1 , Dr. Basavaraja Banakara 2 and Dr. M. Sasikala 3 1 Department of EEE, Jawaharlal Nehru Technological University, Hyderabad,Telanagana, India. 2 UBDTCE, Davangere, Karnataka, India. 3 GECW, Gulbarga, Karnataka, India. Corresponding Author: Ms. M. Sharanya ABSTRACT :Power quality is the most common factor which is looked by both power consumers and power suppliers. The power industry has to supply power to the consumers at rated magnitude and frequency and also uninterrupted. But due to the use of various nonlinear loads by domestic as well as industrial consumers this has become a very difficult task. To reduce the power quality problems many Custom Power Device’s (CPD) are used. The voltage quality can be improved using Dynamic Voltage Restorer (DVR) whereas current quality can be improved using Hybrid Active Power Filter(HAPF). In this paper two control methods are discussed and the results are compared for both the methods. DVR, HAPF and the control methods are simulated using MATLAB/SIMULINK environment. Keywords -Custom Power Devices (CPD), Dynamic Voltage Restorer (DVR), MATLAB, Hybrid Active Power Filter (HAPF), Power Quality, SIMULINK. --------------------------------------------------------------------------------------------------------------------------------------- Date of Submission: 05-02-2018 Date of acceptance: 23-02-2018 --------------------------------------------------------------------------------------------------------------------------------------- I. INTRODUCTION The quality of power supplied to the consumers play a very important role in the working of various equipment which are connected on the consumer end. The power quality problems are classified as voltage imbalance, interruption, flicker, transient, distortion, harmonics, voltage sag and voltage swell. Usually around 10 to 90% of power quality problems are originated by voltage sags and swells. Inrush currents, faults, lightning strokes are the causes for voltage sags whereas voltage swells are caused due to single line to ground fault or sudden lowering of loads (8). Voltage sag is the reduction in voltage magnitude from 0.1 to 0.9 p.u. of its nominal value and it lasts for 0.5 cycles to one minute. Voltage swell is the increase in voltage magnitude from 1.1 to 1.8 p.u. of its nominal value. Voltage sags even for a short duration leads to the damage of computer equipment, variable speed drives etc. (1). CPD’s are used to reduce power quality problems. CPD’s can be either series or shunt compensators. Series compensators are connected in series with the load on the distribution side through a coupling transformer like Dynamic Voltage Restorer (DVR). Whereas shunt compensators are connected in parallel to the load like Active Filters (2). In this paper DVR and HAPF are simulated using MATLAB Simulink environment. II. Dynamic Voltage Restorer(DVR) Dynamic Voltage Restorer(DVR) is an important CPD used to reduce voltage sags and swells in the distribution network. DVR is a solid-state device that regulates the voltage on the load side by injecting the voltage into the system. DVR is usually installed between the source and the load at the Point of Common Coupling(PCC). DVR can reduce voltage sag and voltage swell. DVR can also limit fault current, reduce transients in the voltage and also compensate voltage harmonics (3). Fig 1. shows the basic block diagram of DVR. Figure 1 Block Diagram of DVR
Transcript
IOSR Journal of Electrical and Electronics Engineering (IOSR-JEEE)
I would like to express my sincere gratitude to my advisor Dr. A. Jaya Laxmi, Professor, Department of EEE,
Coordinator, CES, JNTUHCEH, Kukatpally, Hyderabad for her continuous support and guidance.
I would like to express my sincere gratitude to the management of VBIT for allowing me to carry out the work
in the FIST lab, R & D Department, VBIT, Ghatkesar.
References [1]. Dr A. Jaya Laxmi, Dr. K. Uma Rao, Dr. M. Sushama, N.Tejasri Devi 2010, Hardware implementation of single phase Dynamic
Voltage Restorer, 16th National Power Systems Conference, 15th-17th December, 2010.
[2]. Sujin P. R, T. Ruban Deva Prakash and L. Padma Suresh, 2012 ARPN Journal of Engineering and Applied Sciences, ISSN 1819-
6608, VOL. 7, NO. 7, July 2012.
[3]. K.Sandhya, Dr. A.Jaya Laxmi, Dr. M.P.Soni, 2012, Design of PI and FUZZY controllers for Dynamic Voltage Restorer (DVR),
2012 AASRI conference on power and energy, AASRI Procedia 2(2012) 149-155.
[4]. R. Omar, N.A. Rahim and A. Ahmad, 2011, Voltage Swells Improvement in Low Voltage Network Using Dynamic Voltage Restorer, American Journal of Applied Sciences 8 (1): 55-62, 2011 ISSN 1546-9239.
[5]. A. Jaya Laxmi, G. Tulasi Ram Das and K. Uma Rao, 2007, Role of Pi and Fuzzy Controllers In Unified Power Quality Conditioner, ARPN Journal of Engineering and Applied Sciences, ISSN 1819-6608, VOL. 2, NO. 2, APRIL 2007.
[6]. Tirunagari Sridevi And Kolli Ramesh Reddy, 2015, Performance Evaluation of Shunt Active Power Filters for Different Control
Strategies, ARPN Journal of Engineering and Applied Sciences, ISSN 1819-6608, Vol. 10, No. 6, April 2015.
[7]. Hirofumi Akagi, New trends in active filters for power conditioning, IEEE Transactions on Industry Applications, VoL 32, NO 6, November- December 1996.
[8]. Anita Pakharia1, Manoj Gupta, DVR Based Compensation of Voltage Sag due to Variations of Load: A Study on Analysis of Active Power, IOSR Journal of Electrical and Electronics Engineering (IOSRJEEE) ISSN : 2278-1676 Volume 1, Issue 1 (May-
June 2012), PP 38-48.
[9]. A.Venkatesh Rajesh, Dr.K.Narasimha Rao, Power Quality Improvement using Repetitive Controlled Dynamic Voltage Restorer for various faults , (IJERA) ISSN: 2248-9622 www.ijera.com Vol. 2, Issue 1, Jan-Feb 2012, pp.168-174.
[10]. Miss. Riddhi R. Pandya, Asst. Prof. Falguni Bhavsar, An Overview on Power Quality Issues in Smart Grid, IOSR Journal of Electrical and Electronics Engineering (IOSR-JEEE) e-ISSN: 2278-1676,p-ISSN: 2320-3331, Volume 13, Issue 1 Ver. I (Jan. –
Feb. 2018), PP 01-04.
[11]. P. V. Ram Kumar, Dr.M. Surya Kalavathi, Power Quality Improvement Using Interleaved Boost Converter Fed Shunt Active Filter In Photo Voltaic System, IOSR Journal of Electrical and Electronics Engineering (IOSR-JEEE) e-ISSN: 2278-1676,p-ISSN: 2320-