Page 1
Scholars' Mine Scholars' Mine
Masters Theses Student Theses and Dissertations
Spring 2014
Comparison of costs of personal protective equipment for all Comparison of costs of personal protective equipment for all
workers to avoid costs of fall accidents workers to avoid costs of fall accidents
Sultan Noori Al-karawi
Follow this and additional works at: https://scholarsmine.mst.edu/masters_theses
Part of the Civil Engineering Commons
Department: Department:
Recommended Citation Recommended Citation Al-karawi, Sultan Noori, "Comparison of costs of personal protective equipment for all workers to avoid costs of fall accidents" (2014). Masters Theses. 7261. https://scholarsmine.mst.edu/masters_theses/7261
This thesis is brought to you by Scholars' Mine, a service of the Missouri S&T Library and Learning Resources. This work is protected by U. S. Copyright Law. Unauthorized use including reproduction for redistribution requires the permission of the copyright holder. For more information, please contact [email protected] .
Page 3
COMPARISON OF COSTS OF PERSONAL PROTECTIVE EQUIPMENT
FOR ALL WORKERS TO AVOID COSTS OF
FALL ACCIDENTS
by
SULTAN NOORI AL-KARAWI
A THESIS
Presented to the Faculty of the Graduate School of the
MISSOURI UNIVERSITY OF SCIENCE AND TECHNOLOGY
In Partial Fulfillment of the Requirements for the Degree
MASTER OF SCIENCE IN CIVIL ENGINEERING
2014
Approved by:
W. Eric Showalter, Advisor
Stuart Baur
Suzanna Long
Page 4
2014
SULTAN NOORI AL-KARAWI
ALL RIGHTS RESERVE
Page 5
iii
ABSTRACT
The construction industry is one of the most important industries in the United
States. It is the biggest contributor in the growth of the U.S. economy. Despite the great
achievements and prominent role for this sector in the U.S. economy, the construction
industry is suffering from neglect and dereliction by related government institutions and
private companies. This neglect led to formation of a negative image about the
construction industry that has caused a deep impact in productivity and economic growth.
One of the reasons is a high percentage of accidents that occur within the construction
industry which leads to injuries and fatalities. The construction industry consists of about
5% of the U.S.A work force, and accounts for some 20% of the work fatalities and 12%
of disabling injuries. The largest percentages of fatalities or injuries in the construction
industry were the result of a fall. The falling fatality rate was about 33.3% of the total
attributed most common accidents in this sector at 2010 (CPWR, 2013), and this
percentage increased in 2012 as the number of fatalities due to falls was to 280 out of 775
people killed in industrial constructions (United States Department of Labor, 2012).
This thesis is a comparison between the total cost of fall accidents and costs of
protective programs to reduce a fall accidents. The lack of accurate information about
costs is one of the main reasons that employers show little interest in supporting the
protective systems to avoid a fall hazards. The mechanism that was used in this thesis is a
realistic comparison between costs that may occur as a result of fall accident in the
construction industry, and costs of use of Personal Protective Equipment (PPE).
Page 6
iv
ACKNOWLEDGEMENTS
I am very grateful to my thesis advisor, Dr. Eric Showalter, for his guidance and
encouragement. His expertise in Construction Engineering improved my research skills
and prepared me for future challenges, thanks for his support. I thank my other committee
members, Dr. Stuart Baur, and Dr. Suzanna Long, for their helpful suggestions and
comments during my study. Dr. Suzanna Long, I would like to say I am very pleased
when „‟I was in your class (Management for Engineers & Scientists)‟‟. I would like to
extend my thanks to the faculty & staff of the Department of Civil Engineering at
Missouri University of Science & Technology.
I would like take this opportunity to present this modest effort to several people
who made this endeavor possible. First and foremost, dedicate this effort to the memory
of my father who has been deceased since I was nine years old. I also dedicate this effort
to my mother, who helped me with her prayer and kindness, and she was as my father
and mother in my life. To the faithfulness in my wife and her love, I dedicate my respect
and love for her. Thanks to my brothers and sisters who wish to me always a better Life.
Thanks to my colleagues. Thanks to Iraqi students in Rolla city. Thanks to Staff and
Faculty of Diyala University. Lastly, I would like of my heart to present my master
degree to my dear son ''Mokhalad''. I am asking God to keep him for us, and make to him
a better future.
Page 7
v
TABLE OF CONTENTS
Page
ABSTRACT ....................................................................................................................... iii
ACKNOWLEDGEMENTS ............................................................................................... iv
LIST OF ILLUSTRATIONS ............................................................................................ vii
LIST OF TABLES ........................................................................................................... viii
SECTION
1. INTRODUCTION ....................................................................................................... 1
2. REVIEW OF LITERATURE...................................................................................... 5
3. BACKGROUND ....................................................................................................... 10
4. METHODOLOGY .................................................................................................... 11
5. U.S CONSTRUCTIONS ........................................................................................... 14
5.1. U.S CONSTRUCTION INDUSTRY PROFILE. ............................................... 14
5.2. CONSTRUCTION AND EMPLOYMENT. ...................................................... 14
5.3. VALUE OF CONSTRUCTION SPENDING (PUT IN PLACE). ..................... 17
6. CONSTRUCTION SAFETY .................................................................................... 19
6.1. IMPORTANT OF CONSTRUCTION SAFETY AND HEALTH. ................... 19
6.2. FALL ACCIDENT IMPORTANCE IN THE CONSTRUCTION
INDUSTRY. .............................................................................................................. 21
7. FALLS IMPACT ON ECONOMY ......................................................................... 23
7.1. DIRECT COST................................................................................................... 23
7.2 INDIRECT COST ............................................................................................... 25
7.3 WORKERS‟ COMPENSATION INSURANCE ................................................ 29
8. FALLS PROTECTION AND COST. ....................................................................... 32
8.1 FALLS PROTECTION ....................................................................................... 32
8.1.1 Fall Protection System. ................................................................................. 32
8.1.2 Conventional Fall Protection ........................................................................ 33
8.1.2.1 Personal fall arrest systems. ................................................................... 33
8.1.2.1.1 The anchor ....................................................................................... 33
Page 8
vi
8.1.2.1.2 Connectors. ...................................................................................... 33
8.1.2.1.3 The body harness. ............................................................................ 34
8.1.2.1.4 Lanyards. ......................................................................................... 34
8.1.2.1.5 Deceleration devices. ....................................................................... 35
8.1.2.1.6 Lifelines. .......................................................................................... 35
8.1.2.2 Guardrail systems. .................................................................................. 36
8.1.2.3 Safety net systems. ................................................................................. 37
8.1.3 Other Fall Protection Systems and Methods. ................................................ 38
8.1.3.1 Fall restraint systems. ............................................................................. 38
8.1.3.2 Positioning device systems..................................................................... 39
8.1.3.3 Warning line systems. ............................................................................ 39
8.1.3.4 Safety monitoring systems. .................................................................... 40
8.1.3.5 Controlled access zones. ........................................................................ 40
8.1.3.6 Covers..................................................................................................... 41
8.1.3.7 Training workers about fall protection ................................................... 41
8.2 COST OF FALL PPE .......................................................................................... 42
9. CONCLUSION AND RECOMMENDATION. ....................................................... 44
10. AREAS OF FUTURE RESEARCH ....................................................................... 46
APPENDICES
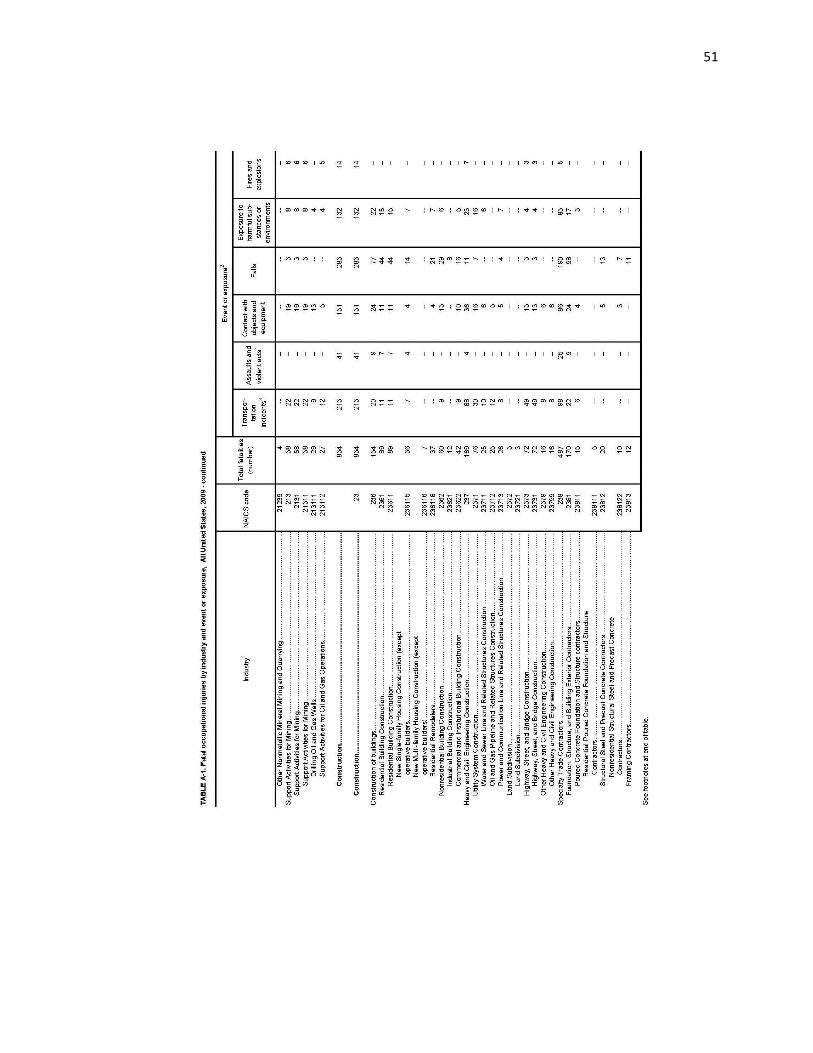
A FATAL OCCUPATIONAL INJURIES BY INDUSTRY AND EVENT OR
EXPOSURE, ALL U.S. ........................................................................................... 47
B CURRENT EMPLOYMENT STATISTICS SURVEY, ALL U.S. ........................ 58
C ANNUAL VALUE OF CONSTRUCTION PUT IN PLACE, 1993 - 2013 ........... 63
BIBLIOGRAPHY ............................................................................................................. 69
VITA ................................................................................................................................. 73
Page 9
vii
LIST OF ILLUSTRATIONS
Page
Figure 1.1 Annual Construction as % of Gross Domestic Product (GPD). ........................ 3
Figure 1.2 Causes of Construction Fatalities. ..................................................................... 4
Figure 5.1 Employment by Construction Industry from 1970 to 2010............................. 15
Figure 5.2 The Employment in Construction Industry between 2007-2010. ................... 16
Figure 5.3 Annual Value of Construction Put in Place, 1993-2012. ................................ 18
Figure 6.1 Fatalities in Construction from 2000 to 2010. ................................................. 20
Figure 6.2 The Rates of Fatalities per 100,000 Workers for Construction and all
Industries Combined from 2001 to 2010. .................................................................. 20
Figure 6.3 Causes of Construction Fatalities. ................................................................... 21
Figure 6.4 Analysis of Fatalities Caused by Fall Accidents. ............................................ 22
Figure 6.5 The Percentage of Fall Accidents from Various Activities. ............................ 22
Figure 7.1 Percentage of Fall Claims Volume and Cost. .................................................. 24
Figure 7.2 The Ratio of Indirect Cost to Direct Cost for Constructon Accidents. ........... 26
Figure 8.1 Shows Horizontal Lifeline. .............................................................................. 36
Figure 8.2 Shows Design of A guardrail Systems. ........................................................... 37
Figure 8.3 Shows Simple Design of A warning Line System. ......................................... 39
Figure 8.4 Shows Controlled Access Zone. ...................................................................... 40
Figure 8.5 Shows Covers Systems. ................................................................................... 41
Page 10
viii
LIST OF TABLES
Page
Table 1.1 Statistics on the Size, and Annual Revenue of the Construction Industry
in the United States. ...................................................................................................... 2
Table 1.2 Percent of Employment for Industry. ................................................................. 2
Table 4.1 Costs of Fall Avoidance and Costs of Fall Accident. ....................................... 13
Table 5.1 Employment by Major Industry Sector from 1970 to 2010.............................. 15
Table 5.2 The Employment in Construction Industry between 2007-2010 ...................... 16
Table 7.1 Average Cost and Days Lost Per Day through 2010-2012. .............................. 24
Table 7.2 Direct Cost of Total Construction and Falls. .................................................... 25
Table 7.3 Time-Related Indirect Injury Cost Calculations. .............................................. 27
Table 7.4 Production- Related Indirect Injury Cost Calculations. .................................... 28
Table 8.1 Minimum Required Horizontal Distance of Outer Edge of Net from the Edge
of the Working Surface. .............................................................................................. 38
Table 8.2 Cost of PPE to Protect from A fall in Construction Industries. ........................ 42
Table 8.3 Other Fall Protection Systems and Methods Cost. ........................................... 43
Page 11
1. INTRODUCTION
The construction industry in the United States is a huge and diverse industry to a
great extent. Ranging from small residential and commercial projects, to complex
projects such as dams, bridges, and highway. All of which are managed by engineering
and construction companies. Generally, the construction industry is divided into three
major of sub-sectors. First, companies or institutions directly responsible for the
construction of buildings, it may be the work done includes a new work, alteration,
additions and modification or demolition of any structure or building. As well as other
specialized business those are involved in other types of structures, such as electricians,
and plumbers. Second, heavy and civil engineering construction “nonresidential
building” (e.g. highways, dams, road, and other "infrastructure" building). Third,
specialty trade contractors that are within the main construction (e.g., pouring concrete,
plumbing, site preparation, electrical work and painting) involved in building work or
acts and other activities that are similar for all construction, but these activities are not
responsible for the entire project.
Construction is one of the most important industries in the United States in
particular and in the rest of the world in general, so as to by a large contribution in the
Gross Domestic Product (GDP) for the majority of the world countries, and the Gross
National Product (GNP).The importance of this sector is not only for its size or number
of employees in this area, but for large importance in the economic growth of the
countries. The construction industry has an important role in the economy of all nations,
its importance in achieving the goals of economic and social development of national,
and providing shelter, employment, and infrastructure. It is clear also that sector has a
direct impact on all aspects of the economy. The table below shows statistics on the size,
and annual revenue of the construction industry in the United States (US Census Bureau,
2012). Table 1.1 shows statistics on the size, and annual revenue of the construction
industry
.
Page 12
2
Table 1.1- Statistics on the Size, and Annual Revenue of the Construction Industry in the
United States.
Construction Industry Statistics Annual Revenue
US Construction industry annual revenue $1.731 Trillion
Number of construction companies in the US 729,345
Number of construction company employees in the US 7,316,240
Average construction company employee salary $45,200.00
Construction Company Type
Statistics
Number of
Companies
Value of Annual
Business
Construction of Buildings 211,956 $748 Billion
Heavy and civil engineering
construction
39,439 $260 Billion
Specialty trade contractors 477,950 $722 Billion
From these statistics we find the construction employment is greater than 5% of
the rest of the other industrial sectors, but responsible for 20% of the accidents. Thus
construction is about 4 times more hazardous than other industries (U.S. Department of
Commerce, 2012). Table 1.2 shows percent of employment for industry
Table 1.2 - Percent of Employment for Industry.
Industry Percent of Employment
Steel 1.1%
Auto 1.0%
Agriculture 4.5%
Construction 5.0%
Page 13
3
Unfortunately, in spite of the significant role played by industrial construction in
economic growth on various areas within the United States as well as the achievements of
this sector in recent years which are established by large-scale projects such as The
Gateway Arch in St. Louis, the Sears Tower in Chicago, the Golden Gate Bridge in San
Francisco and the Cable Stayed Bridge in Alton, Illinois. This broad sector suffers from
neglect and dereliction in many ways by related companies and institutions, which led to
the formation of a negative image about the sector that caused the faltering economic
growth, and reduced productivity during the last decade compared with the past 50 years.
One of these reasons is a high percentage of accidents that occur within this sector which
leads to injuries and fatalities. Figure 1.1 shows annual Construction as % of Gross
Domestic Product (GDP) (U.S. Department of commerce, 2012).
Figure 1.1 - Annual Construction as % of Gross Domestic Product (GDP).
Page 14
4
Most of the incidents that lead to fatalities or injuries in the construction industry
were the result of a fall. The falling fatality rate was about 34% of the total attributed
most common accidents in construction in 2010 (CPWR, 2013), and this percentage
increased in 2012 as the number of fatalities due to falls was 280 out of 775 people killed
in industrial construction (Bureau of Labor Statistics, 2012). Figure 1.2 shows the
percentage of fatality in construction industry by causes.
Figure 1.2 - Causes of Construction Fatalities.
In this thesis we will discuss the fall accidents which are statistically the most
frequently and dangerous in the construction industry as well as we discuss the impact of
these kind of incidents on the economy and productivity. We will compare between costs
that may be occur as a result of a fall accidents in the construction industry, and costs of
use of Personal Protective Equipment(PPE).
15.7%
33.3%
26.2%
7.2%
0.0%
5.0%
10.0%
15.0%
20.0%
25.0%
30.0%
35.0%
1
Exposure.
Fall (elevation)
Contact w/Objects.
Transportation
Other
Page 15
5
2. REVIEW OF LITERATURE
In 1971, the Occupational Safety and Health Administration (OSHA) was
founded. Since then, OSHA worked together with governmental, trade unions, lawyers,
health organizations as partner to reduce incidents of injuries and fatalities. OSHA has a
high impact on safety at the worksite, and the percentage of injuries and fatalities was
significantly decreasing in the workplace. Despite the lack of accurate statistics in 1970,
the number of fatalities was estimated to be about 14,000. This number of fatalities was
reduced to 4,340 in the 2009. On the other hand, there was an increase in the rate of
employment and workplaces to reach more than 130 million workers, and more than 7.2
million worksite. Since the OSHA and application of safety standards were enacted, the
rates of incident and disease have dropped from 11 cases per 100 people in 1972 to 3.6
per 100 people in 2009 (U.S. Department of Labor, 2012)
In spite of these excellent results on the reduction of the rate of accidents from
1971 to 2009, there is a negative image is still inherent with construction. Although there
have been great achievements that made in the field of construction in the United States,
for example, the Gateway Arch in St. Louis, the Sears Tower in Chicago, the Golden
Gate Bridge in San Francisco and the Cable Stayed Bridge in Alton, Illinois. The
construction industry is seen as considerably dangerous, boring, and having management
weakness (Reid, 1995). The 1999 Jobs Rated Almanac ranks the job of a construction
worker as 247 out of possible 250 career choices ahead of fisherman (rank 248), and
lumberjack (rank 249).
One of reasons that lead to this negative perception or image around the
construction; is that construction is considered hazardous work. According to INJURY
FACTS (1999) published by the National Safety Council, the probability of accidental
death in construction is four times higher than other industries. There are four types of
accidents are most common in the construction industry; falls, transportation, contact
w/objects, and exposure. Fall hazard represents the highest rates of accidents. Fall
accidents were analyzed during the last ten years, and falls from a top are the largest
Page 16
6
proportion of these accidents. Total falls from 1992 to 2010 were about 7,275 at an
estimated cost about $1.9 billion (CPWR, 2013).
A paper was published in April 1998 by George Berg and Richard Dutmer (Berg,
1998) (George Berg and Rick Dutmer are part of FMI‟s Quality Productivity
Improvement Group). This paper discusses the relationship between Productivity,
Quality, and Safety on the construction industry. The relationship between them may
seem incidental, but they have a stronger correlation than one might think. For safety, the
construction industry is only 5% of the Gross Domestic Product (GDP), but it is responsible
for 20% of the workplace accidents. The direct cost of the losses, worker's compensation
insurance rate increased dramatically. In the 1989, injury losses estimated at $112 Billion
in direct cost and another $20 billion to $30 billion of lost productivity due to fatalities,
injuries and lost-time accidents. This result has generated difficult problems that led to
some construction companies to reduce of worker's compensation rate for new applicants.
The relationship between productivity and safety is clear. More attention to safety
increases productivity in the workplace and the direct and indirect costs will be reduced
of construction accidents, which also improve profits.
In an effort to reduce the number of injuries and fatalities from falls, beginning
June 12, 2002, the Ontario Ministry of Labor‟s fall protection enforcement has worked at
a high level of effort. It has introduced some mandatory laws to protect workers from
falls hazard. Its inspectors began to visit construction sites; they were looking for how
worker training in the use of fall protection equipment was being provided by employers.
The Provincial Labor- Management Health & Safety Committee and The Construction
Safety Association of Ontario (CSAO) were key contributors to falls protection laws and
plans. They were rewriting the laws and put all issues about the hazards of fall protection
into one grouping in the regulations. Law 26 says that the protection from the fall
required for any work above three meters and law 26.3 under the Act, says that guardrails
are required around a scaffold platform above 2.4 meters. The Ministry of Labor‟s puts
all the laws that it has related with workers protection of training and plans and how to
use the protective personal equipment (PPE). An important part of the Ministry of
Labor‟s strategy was visiting construction worksites to investigate safe work procedures
Page 17
7
and how the workers are training in fall protection. Any weakness may cause working
cessation, causing lost production, convictions, charges, fines or jail under the
Occupational Health and Safety Act.
American Society of Safety Engineering (ASSE) was keen to put new standards
for safety and fall protection (ASC Z359), after the old standards that were not adequate
to reduce the dangers of falling. Also, ASSE developed the Safety Requirements for
Lanyards and Energy Absorbers (BSR/ASSE Z359.13-200x) for Personal Fall Arrest
Systems. These standards establish requirements for the design, performance, marking,
instructions, inspection, qualification, maintenance and removal from service of energy
absorbing lanyards and users of personal energy absorbers within the range of 130 to 310
lb. The requirements of safety design and specifications for Personal Fall Arrest Systems
(BSR/ASSE Z359.6-200x) were also under development. This standard was required
especially for the design and performance of complete active fall protection systems,
including travel restraint, horizontal and vertical fall arrest systems.
The Journal of Safety Research published a report about fall prevention and
safety communication training for foremen (Kaskutas, 2013). The recommendation of
this journal was that is needed to decrease falls from heights in construction workers.
This journal identified a wide range of fall protection and safety communication training
opportunities for foremen on the job-site. The research included eight hours of training
which was well received among foremen, and there are indicators of improvements in
safety protection behaviors.
In the 2007, a paper was published about costs of fatal and nonfatal injuries for
the construction industry (Waehrer, 2007). This paper used 2002 national incidence data
from the Bureau of Labor Statistics (BLS) and a model of comprehensive cost that
includes direct cost and indirect cost which is losses in wage and household productivity.
They estimated in 2002 about $11.5 billion represented the total costs of fatal and
nonfatal injuries in the construction industry, 15% of the costs of injury for all private
industry. The average cost per worker for fatal or nonfatal injury is $27,000 in
construction. After all, in this paper, the publisher did not mention the other costs such as
Page 18
8
Worker's Compensation Insurance (WCI) that it must be added to the cost of fatal and
nonfatal injury.
The Business Roundtable (BR) commissioned a study in 1971; this study was to
determine the actual costs of injuries and accidents in the construction industry (Everett,
1996). From 1979, the BR determined that injuries and accidents account for 6.5% of the
total cost of the construction industry. Since the time of study, much has changed in the
construction industry and the Worker's Compensation Insurance (WCI) has increased
significantly. For these, there has been a rash of lawsuits due to accidents on the
construction site. Everett used unique models in re-examining the costs of accidents and
injuries, and shows that the total costs of accidents increased from a level of 6.5% in
1982 to somewhere between 7.9% to 15.0% of the total costs of new construction in
1996.
A study was submitted by a group of researchers and members in American Society
of Civil Engineers (ASCE) about Costs of Construction Injuries (Hinze, 1991). This
study was about how to obtain an accurate measurement of all costs that are associated
with job-site worker injuries in the construction industry. This study showed that even
when the injuries were minor; the costs of these injuries can be considerable. The indirect
costs are often hidden and have been neglected when calculating the costs, but in fact,
they may be much more than the direct costs. The ratio between the indirect costs to the
direct costs is 4:1 that it posted by Heinrich (Hinze, 1991); this ratio is reasonably valid
for medical cases injuries. However, the ratio becomes closer to 20:1 for restricted-
activity/lost-workday cases. This study concluded that the ratios of indirect costs to the
direct costs depended on several factors. For example, small companies with a good
safety record may subtend no restricted work lost workday or restricted work cases over a
period of several years. If the same companies did experience a serious injury, and the
injury caused in a third party suit, the ratio of direct to indirect costs could be many times
larger than the 20:1 ratio derived as an overall average for the construction industry. In
any case, even if one chooses to neglect the possibility of any claims costs, the indirect
costs are still considerable.
Page 19
9
A study has been conducted to determine indirect cost of injuries. This study was
submitted as part of the requirements for master degree in Civil Engineering at the
University of Washington by James R. Van de Voorde (Van de Voorde, 1991). This
study was based on data analysis of a study conducted previously by the Construction
Industry Institute (CII) on the indirect costs of workplace accident on construction
projects. Average indirect cost for 800 cases which have been studied by CII, the
analysis detached injuries of medical case from lost time/numbers of activity cases. In
this study, two realistic scenarios were developed to analyze and illustrate how the
indirect costs have risen through a rise in the cost of medical cases and lost time injuries.
CII proposed two mathematical models to help contractors and owners. These models
were to estimate the dollar value of the indirect costs which are associated with a
particular accident. A second proposed method was more accurate; it was two sets of cost
models to estimate the indirect cost after follow-up data had become available. Analysis
of the CII data showed four significant results:
As a project's value increases, so do the indirect costs of accidents
Injuries on new construction type projects have lower indirect cost than injuries
on maintenance contracts.
Injuries on lump sum or unit price contracts have lower cost than injuries on cost
plus contracts.
There was no difference in indirect cost on union shop or merit/ open shop
projects.
A manager will not obtain the actual cost of injuries because the contractor
mismanaged their indirect and direct costs of injuries by allowing them to get lost in
labor cost codes or overhead. Managers can use the models in this study to achieve
best results in determining the indirect cost. In addition, to make the cost accounts
balanced, an equal dollar amount would be subtracted from perhaps overhead
expenses account. This procedure would clarify the fiscal impact of these accidents
to the project team. The truth here, is good job site safety not only saves worker lives
and but saves money, as well.
Page 20
10
3. BACKGROUND
In addition to the costs and social damages, work- related injuries have a
significant impact on the employer. The latest estimates indicate that employers are
paying about $1 billion per week for Worker's Compensation Insurance alone (U.S.
Department of Labor, 2012). Most previous research projects on the construction industry
were about how to determine the total costs of injuries and fatalities, or were limited to
account Worker's Compensation Insurance (WCI) for the construction industry in
general. These studies have relied on Occupational Safety and Health Administration
(OSHA) in determine the number of injuries and fatalities. Also, they depended on the
survey data from the Center to Protect Workers‟ Rights (CPWR), in the rate of injuries
and worker's compensation Insurance. Most of these research projects have indicated that
the rate of injuries or its costs in the construction industry is greater than in other
industries. A previous study showed that the worker or carpenter in the construction
industry has a higher cost of work-related injuries and illnesses than other industries
(Leigh, 1997). In another study that used the Worker's Compensation Insurance (WCI)
data from Washington State it was estimated the average cost of WCI for construction is
equivalent to four times the cost in most other industry (Silverstein, 1998).
Despite all research and perspectives, there are no studies that seek to achieve an
integrated estimate for the entire construction industry. The exception is one study that
was conducted by the National Institute for Occupational Safety and Health (NIOSH),
which showed costs of fatalities of the work site, it was shown that the cost of the
fatalities for construction were about $10 billion for ten years from 1992 to 2002
(NIOSH, 2006). Another study was conducted in 1990 by Construction Industry Institute
(CII) to collect data on the direct and indirect costs of injuries resulting of construction
accident. The aim of this study was to show the cost of these incidents by limited the ratio
between direct and indirect cost. The conclusion was that the direct costs are much less
than the real costs of injuries.
Page 21
11
4. METHODOLOGY
A little attention and measurable information were developed or studied about a
comparison between the total cost of fall accidents and costs of protective programs to
reduce a fall accidents. The lack of accurate information about costs is one of the main
reasons that employers or contractors show weak interest in supporting the protective
programs to avoid a fall hazards. Therefore, the result was the inability to reduce the rate
of injuries from falling through the last fifteen years. Statistical results have been
presented by Occupational Safety and Health Administration (OSHA) on rates of fatal
and non-fatal injuries was very disturbing. These statistics still have a negative impact on
construction companies and researchers, as well as people who wish to work in this
sector. In addition, these statistics have led to the formation of a negative image about the
construction industry, which is one of the most important industries that have a
distinctive role in the U.S. economy.
All of these reasons and negative images about the construction industry had an
impact in determining the topic for this thesis. The idea was to compare between costs
resulting from fall accidents and costs resulting from the adoption of protective programs.
Most companies and contractors were believed not to put sufficient effort into
establishing protective systems from fall hazards, because they were thought that the cost
of fully implementing fall protection was higher than the benefit leading to their loss. The
thesis's goal is to give an idea for employers about these costs, and try to convince them
that the costs of fall accidents are much more than the amount that may be paid for the
protection to avoid fall hazards.
Also, this thesis focuses on how to calculate the direct costs, indirect costs, and
costs resulting from expense of Worker's Compensation Insurance (WCI). Despite this,
there is general information about the ratio between direct and indirect cost of 4:1 that is
posted by Heinrich (Hinze, 1991). Managers should not always rely on this ratio because
it depends on the site-work, injury cases, and other factors. A greater attention must be
paid to safety, especially if the ratio was high.
Page 22
12
For the success of this study, it has been relying on a base of data and statistics
about the annual incidences of fall in the construction industry. Also, we needed accurate
information about the costs of damage due to these incidents, and the cost of fall
protective systems. To get all these data, we have been relying on companies and official
websites such as; Occupational Safety and Health Administration (OSHA), American
Society of Civil Engineers (ASCE), American National Standards Institute (ANSI),
Construction Industry Institute (CII), American Society of Safety Engineers (ASSE), and
the National Safety Council (NSC).
We began to analyze the data and calculated the total costs of fatal or non-fatal
injuries. Some of these costs necessitated simple mathematical equations to calculate
them. For example, when calculating the direct costs, we calculated the number of
injuries, and the cost per one injury and the same thing for fatalities. There are
calculations to determine the Worker's Compensation Insurance (WCI). Also, there are
indirect costs that were necessitated by other forms of calculation such as working hours
that the injured worker missed work and the wage cost of the worker on the day the
injury.
The mechanism that was used in this thesis is a realistic comparison between
costs that may occur as a result of a fall accident in the construction industry, and costs of
use of Personal Protective Equipment (PPE) to avoid a fall accident and its costs. Costs of
a fall accidents include Direct Costs, Indirect Costs, and Worker's Compensation
Insurance (WCI), in addition to social and family impacts for the injured person. A cost
of fall protection and avoided incidents that may occur as a result of a fall depends on the
type of programs and personal protection systems. Personal protection systems depend on
the work type, and elevation of work surface. In this thesis we estimated the cost of all
the protection systems that can be used to avoid incidents of falling. The table below
shows details about how to determine costs of a fall accident in the construction industry,
and costs of (PPE) to avoid fall hazards. Table 4.1 shows how to determine costs of fall
avoidance and costs of fall accident.
Page 23
13
Table 4.1– Costs of Fall Avoidance and Costs of Fall Accident.
Costs of Fall Avoidance Systems Costs of Fall Accident
1- Personal Fall Arrest System 1- Direct Costs
2- Guardrail systems a - wage losses
3- Safety Net systems b - medical expenses
4- Fall Restraint Systems c - administrative expenses
5- Positioning Device Systems
6- Warning Line Systems 2- Indirect Costs
7- Worker's Training a- Time-Related Indirect Injury Cost
b- Production- Related Indirect Cost
3- Worker's Compensation Insurance
a- Medical Care
b- Temporary Disability (TD)
c- Permanent Disability (PD)
d- Transportation Reimbursement
e- Vocational Rehabilitation (VR)
f- Death Benefits
Page 24
14
5. U.S CONSTRUCTIONS
5.1. U.S CONSTRUCTION INDUSTRY PROFILE
The construction industry in the United States of America represents a significant
element in the movement and growth of the economy, and considered a backbone of
permanence and stability of the economic activity in the U.S., both public and private.
The construction sector is a large, complex, dynamic, and directly affects a broad range
of human life. It includes a large number of staff and workers. They are working in
various fields in this area. They are responsible for the construction of roads, houses and
workplaces, as well as in the maintenance and repair of infrastructure. Construction work
involves building a new structures or additions, modifications, or repair and maintenance
of established engineering projects such as highways and utility systems.
The construction industry is one of the most volatile industries in the United
States. It reacts rapidly with economic expansions and shrinks to a large extent in
recession times. Since 2006 to 2011, the construction sector suffers from a sever period,
where the annual spending in the United State was a decline on the construction industry
more than quarter, or approximately $ 300 million. This reduction represents about 2% of
the size of the U.S. economy.
5.2. CONSTRUCTION AND EMPLOYMENT
Increasing the rate of employment in any industry is evidenced by economic
growth for this sector in a particular time. The construction industry is one of the
significant sources in the U.S. economy, which contributed significantly in increasing the
rate of employment growth. During the past years since 1965 to 2006, the construction
industry has been the growth rate ranging between (15-30%) for every 10 years. See
Table 5.1., and Figure 5.1 (U.S. Department of Labor, 2014).
Page 25
15
Unlike, the rest of the industrial sectors, the construction industry has suffered
from vacillating and decline in the employment rate between 2007-2010. There are
several reasons that directly affected this sector which led to this a recession during the
last decade. Among these reasons is the large number of accidents that lead to the injuries
and fatalities. In addition, over the years there is no preceding factors support or
stimulating this sector to stability in employment growth. The table 5.2 and figure 5.2
Declining
between
2007-
2010
Figure 5.1 - Employment by Construction Industry from 1970 to 2010.
Table 5.1 - Employment by Major Industry Sector from 1970 to 2010.
Page 26
16
show the contraction was happening in industrial construction at the time between 2007-
2010. It caused the fall of 2.1 million jobs between 2007-2010 in the annual employment
of salary and wages for workers. This fall represents about 10 percent of the annual rate
of decline (U.S. Department of Labor, 2014).
Figure 5.2 – The Employment in Construction Industry between 2007-2010.
Table 5.2 - The Employment in Construction Industry between 2007-2010
Page 27
17
5.3. VALUE OF CONSTRUCTION SPENDING (PUT IN PLACE)
Spending data in the construction industry represents the cost of the value of work
in completed projects (all projects that be completed or which completed the process
during the period). Regardless of when the work in any individual project was started or
when the payment was made to the implementing agency (Contractors). Some of these
estimates are based on the amounts paid during the period rather than the rate of the work
done, and some of these estimates depend on the total cost of the project by means of
historic construction progress patterns. For an individual project, the value of
construction put in place represents of the value of construction erected or installed at
work during a given period, including:
1. Cost of labor (both by contractors and force account) and a proportionate share of
the cost of
2. Cost of materials installed or erected.
3. Cost of construction equipment rent.
4. Cost of design and engineering work.
5. The value of Contractor‟s profit.
6. Interest, insurance, and taxes paid during construction
7. Cost of overhead and office that is chargeable to the project.
Construction spending is very necessary for U.S. economy, it represents about
20% of the gross domestic product that making it significant source for information.
Economist‟s perspective of construction spending, it is considered vital clues about the
overall economy. The construction industry is the first in a recession when the economy
suffers from decline, and, likewise, it is the first in the case of recovery when the
economy is booming.
Despite the importance of spending in the construction industry and its large role
in the U.S. economy, the spending in this sector gradually reduced in recent years to
reach 788,014 in the year 2011 after it was about 1,167,222 in 2006. This means that the
total decrease for five years is about 32%. This percentage was large and influential for
the construction sector. Reasons that led to this decline were a negative image of the
Page 28
18
sector in recent years, which we reported it with the causes at the introduction of this
thesis. Figure 5.3 shows the annual value of construction put in place (U.S. Department
of Commerce, 2013).
Figure 5.3 - Annual Value of Construction Put in Place, 1993-2012.
0
200,000
400,000
600,000
800,000
1,000,000
1,200,000
1,400,000
public construction private construction
Page 29
19
6. CONSTRUCTION SAFETY
6.1. IMPORTANT OF CONSTRUCTION SAFETY AND HEALTH
Construction industry includes a wide range of activities and works which include
erection and building or/and repair, they cause a lot of accidents most of these are a high
hazard. These works consist of about 5% of the U.S.A work force, and account for some
20% of the work fatalities and 12% of disabling injuries. They work in various area
including residential construction, bridges erection, excavation, paving, demolition, and
large projects that expose them to serious hazard, such as, falling from high levels,
transportation, contact w/objects, and exposure, and other incidents that be hazardous to
workers' lives.
Recent figures from the Bureau of Labor Statistics (BLS) show that the
construction industry accounted for more injuries work and fatalities than any other
industry in U.S “in 2010‟‟. Although the rate of fatalities and injuries in the construction
industry have declined every year since 2006 and are down about 40% over that time
(United States Department of Labor, 2012), construction accounted for more fatal work
injuries than any other industry in 2010. The rate of injuries among all workers in all
other industries was 3.5 percent while the construction industry remained at 9.5 percent;
higher than all industries combined (United States Department of Labor, 2012). The
direct and indirect costs of construction injuries have been estimated to exceed $31
billion. See figure 6.1 and 6.2.
Page 30
20
Figure 6.1 - Fatalities in Construction from 2000 to 2010.
Figure 6.2 - The Rates of Fatalities per 100,000 Workers for Construction and all
Industries Combined from 2001 to 2010.
Page 31
21
The top four hazards that cause fatalities in construction remain the same. They
are fall, transportation, contact, and exposure (CPWR, 2013). Figure 6.3 indicates the
causes of the construction industry fatalities for the year 2009. In previous years, the
order of arrangement among the four leading causes varied, but the fall always remained
at the top.
Figure 6.3 - Causes of Construction Fatalities.
6.2. FALL ACCIDENT IMPORTANCE IN THE CONSTRUCTION INDUSTRY
Fall accidents in construction are the most common that lead to fatalities, severe
injuries, and other consequences. For example, work stopped, negative impact on
productivity for companies, and economic impact through indirect costs can result from a
fall. Falling from any level of height remains the single cause of the largest number of
fatalities in the construction industry. There is 34% of all fatalities in the construction
industry are the result of a fall. Thirty percent of them as a result of the fall from height of
11 to 20 ft., and nineteen percent of them from a height of 20 ft. or under. Figure 6.4
shows the varying heights of the fall in 2009 (National Safety Council, 2013).
Exposure 15.7%
fall 33.3%
Contact W/Objects
17.6%
Transportation 26.2%
other 7.2%
Page 32
22
Figure 6.4 - Analysis of Fatalities Caused by Fall Accidents.
Falls occurs as a result of various activities within the worksite in the construction
industry. Figure 6.5 shows the percentage of falls from various activities (National Safety
Council, 2013).
Figure 6.5 – The Percentage of Fall Accidents from Various Activities.
0
10
20
30
40
50
60
70
20 22
63
35
54
10
Nu
mb
et
of
fata
litie
s 2
00
9
Height of fall
<6'
6' - 10'
11' - 20'
21' - 30'
> 30'
Not given
Floor opening ( total 79) 4%
Other ( total 167) 10%
Roof (total 605) 35% Scaffold(total
301) 17%
Steel eraction( total 125) 8%
Stairs or steps(total
10) 1%
Vehicle( total 110) 6%
Ladder( total 347) 19%
Page 33
23
7. FALLS IMPACT ON ECONOMY
By all relevant measures, the construction industry is not safe. It represents a big
challenge to investors in how to deal with the hazards that occur during the work, and
how to reduce the high costs that result from these incidents. These costs represent a
significant financial burden on companies and institutions. We mentioned earlier that the
percentage of the workforce in construction accounted about 5% of all sectors, but it is
responsible for about 20% of the accidents. Fall accidents are responsible for the largest
rate of these incidents, which represent more than 34%. The actual costs of falls accident
in the construction industry include direct and indirect costs. Direct costs represent the
worker's compensation claims, and indirect costs are often less tangible and clear, but
certainly real in terms of lost profits.
7.1. DIRECT COST
Direct costs usually associated with worker's compensation claims that can be
calculated relatively simply, these include expenses paid to patients who are receiving
treatment as a result of accidents. In most cases, these costs are documented and included
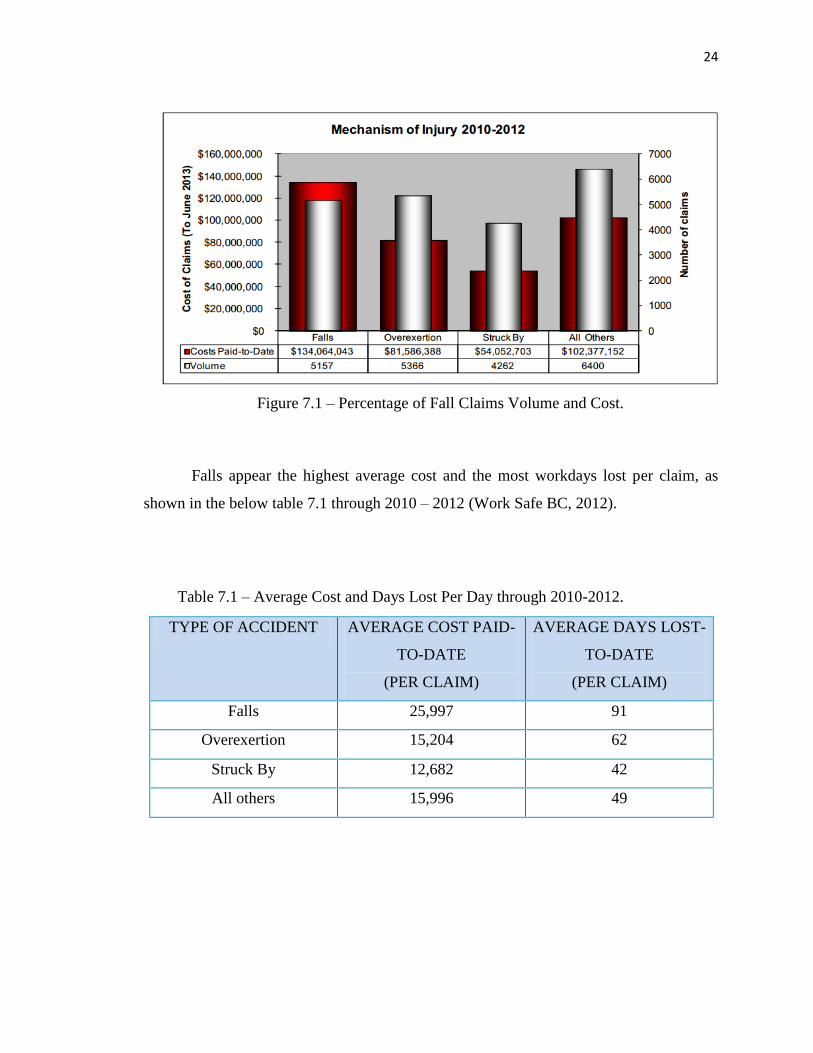
in the form of bills paid by the employer or insurance companies. Falls represents 25% of
all claim volumes and 36% of all claim costs. See the Figure 7.1 through 2010 – 2012
(Work Safe BC, 2012).
Page 34
24
Falls appear the highest average cost and the most workdays lost per claim, as
shown in the below table 7.1 through 2010 – 2012 (Work Safe BC, 2012).
TYPE OF ACCIDENT AVERAGE COST PAID-
TO-DATE
(PER CLAIM)
AVERAGE DAYS LOST-
TO-DATE
(PER CLAIM)
Falls 25,997 91
Overexertion 15,204 62
Struck By 12,682 42
All others 15,996 49
Figure 7.1 – Percentage of Fall Claims Volume and Cost.
Table 7.1 – Average Cost and Days Lost Per Day through 2010-2012.
Page 35
25
Based on Bureau of Labor Statistics (BLS) in 2010, the average cost per death
about $1,390,000 and cost per injury about 37,000 for the construction industry, so the
direct cost for fatalities and injuries through 2010 is shown in table 7.2 (National Safety
Council, 2013).
Table 7.2 – Direct Cost of Total Construction and Falls.
7.2 INDIRECT COST
Indirect costs are not clear and therefore cannot be calculated accurately because
they depend on the situation and the workplace. In general, indirect costs include the
costs of training, workers' compensation, accident investigation, repair damaged property,
maintain on insurance coverage, and cost resulting from the delay in the project schedule
due to accidents.
The rate of indirect costs of injuries to the direct costs may be 20 times (OSHA).
Recent study shows that the ratio of indirect cost to direct cost varies widely; from a high
of 4:1 to a low of 1:1(U.S. Department of Labor, 1982). See figure 7.2.
Page 36
26
The following table shows the indirect cost calculation associated with injuries,
and also shows the overlap of the work environment and the impact of injuries on the
environment.
Table 7.3 show the indirect costs that are associated with personal- related time
and includes non-compensable time related to the worker on the day of the injury and
consequences; loss of worker productivity due to the injury, time lost by other workers
assisting the injured worker; watching; and interviewed; time lost to find alternative
worker, and the time required to new worker training. The total time that related indirect
cost associated with the injury was $22,730.00.
Figure 7.2 - The Ratio of Indirect Cost to Direct Cost for Construction Accidents.
Page 37
27
Table 7.3- Time-Related Indirect Injury Cost Calculations.
Page 38
28
Table 7.4 shows the calculation of indirect costs associated with productivity-
related indirect costs. Examples include loss in productivity as a result of the injured
worker, and others who are helping the injured worker. In addition, the loss in
productivity after the injured worker returns to work, and the percent of his production
capacity; and other things that related to the injury and affect the productivity are in the
table below. The total lost production-related indirect cost associated with this injury
about $130,000.
Table 7.4 - Production- Related Indirect Injury Cost Calculations.
Page 39
29
From these two tables above. The indirect cost of non-fatal injuries for one
worker equal to the sum of (Time-Related Indirect Injury Cost and Production-Related
Indirect Injury Cost), which will be about $ 152,730.
7.3 WORKERS’ COMPENSATION INSURANCE
Workers' compensation insurance premium (industrial insurance) coverage
protects both employers and workers from the funding impact of a work related injury or
job disease. Workers' compensation insurance pays to an injured worker for medical
services, hospitals, and related services that are necessary for the treatment of the injured
worker and recovery. Also, it pays portions of wages to workers who are temporarily
unable to work due to injuries. Employer must provide adequate coverage for their
employees. The coverage is mandatory on the employer. On the other hand, workers
cannot establish a lawsuit when any injuries happen or other related event. Employers
provide the workers by workers' compensation insurance (WCI) through the Department
of Labor & Industries (L&I). Workers' Compensation insurance coverage the following:-
Hospital and medical services needed to treat the job-site injuries and illness.
Temporary payments to the worker instead of his lost wages.
Permanent payments to the worker to recompense for permanent effects of the
injury.
A death benefit for the worker's survivors in the event of a fatal injury.
Lawful representation for the employer by the insurance company carrier.
Employer protection against most lawsuits for on-the-job injuries and illnesses.
Workers‟ Compensation Insurance depends on three factors.
Different worker use different rates depending on their individual jobs that are
grouped into class codes.
Annual payroll and individual occupation class codes are used to calculate the
company‟s rates.
Page 40
30
Each company has an experience modifier based on the company‟s track record of
accidents, safety, and claims filed.
The general equation to determine the (Workers‟ Compensation Insurance) is:
(WCI) = [(Payroll/100) x Manual rate] x Experience Modifier.
In this case, we will take a carpenter as a case to calculate the (WCI), who is more
exposed to fall during his work. Calculate the amount of benefit that he will obtain from
the workers' compensation insurance. This amount will be added to the falling cost that is
calculated before (direct cost and indirect cost) which costs the employers or the
companies. Average national wage for a carpenter is from $ 45 to $ 65, so we will use the
Missouri rate of $50. Manual rates vary from $18 to $29, so again we will use the
Missouri rate of $20.18 for our calculations. So:-
Annual Payroll for Carpenter at Missouri= $50/hr. x 2080 hours (full time around
year).
Annual Payroll= $50/hr. x 2080hr. = $104000.00
Manual rate for Carpenter at Missouri = 20.18 (MO Comp Rates, 2013)
Experience modifiers are typically between 0.6 and 1.6 an industry average
modifier would be 1.00.
To calculate the Workers‟ Compensation Insurance (WCI). The equation will be
(WCI) = [(Payroll/100) x Manual rate] x Experience Modifier.
(WCI) = [($104000/100) x $20.18] x $1.00
(WCI) = $ 21,000 per person
Total amount of (WCI) for all fall fatalities and injuries =
Average of (WCI) = $ 21,000 x 1.0 x [No. of (fatalities) + No. of (injuries)].
Average of (WCI) = $ 21,000 x 1.0 x [264 + 12,950] = $ 277,494,000
Page 41
31
Very safe of (WCI) = $ 21,000 x 0.6 x [264 + 12,950] = $ 166,496,400
Savings = $ 277,494,000 - $ 166,496,400 = $ 111,000,000
So from these results that we have obtained in this part of the thesis, the total cost
equal (direct cost, indirect cost and cost of (WCI)) of falls for 2013 is calculated through
this simple equation.
Total Cost = Direct Cost + Indirect Cost + Cost of WCI
Direct Cost = $ 846.11 Million. (Cost of fatalities and non-fatalities injuries.
Table (7.2)
Indirect Cost = No. of injuries * Indirect cost for one worker tables (7.3, 7.4).
= 12,950 * $ 152,730 = $ 1,977,853,500
Workers‟ Compensation Insurance (WCI) = $ 111,000,000
Total Cost = Direct Cost + Indirect Cost + Cost of WCI
Total Cost = $ 846,110,000 + $ 1,977,853,500 + $ 111,000,000
= $ 2,934,963,500
If we divided this amount on the number of a fall accident in 2011, which
includes fatalities and injuries. It will be $ 222,000 per worker who affected by a fall
incident. In addition, the ratio between indirect costs to direct costs in this case about 3.6
to 1. In some cases, the rate is more than 20 times based on the American Society of
Safety Engineers (ASSE).
Page 42
32
8. FALLS PROTECTION AND COST
8.1 FALLS PROTECTION
Fall protection involves a broad concept of planning, training and uses appropriate
personal protective equipment. Fall protection includes the development of appropriate
procedures, proper planning, rules, regulations, and styles that are all aimed to protect
from falls, and minimizing damage and losses resulting from these incidents on projects.
Fall protection does not mean the use of bulky equipment or cumbersome equipment;
also it does not interfere or intersect with the procedures and workflow of the worker if
we understand the concept (fall protection) correctly, and apply it in properly.
8.1.1 Fall Protection System. The fall protection system refers to how to design
especially equipment to control fall hazards. In general, the fall protections systems use
on either prevent a fall from occurring or safely arrest a fall. Typical fall protection
systems include the following:
Personal fall-arrest systems
Guardrail systems
Safety-net systems
Positioning-device systems
Warning-line systems
Safety-monitoring systems
Controlled-access zones.
Personal fall-arrest systems, guardrail systems, and safety net systems are used in
most industries where workers are faced to fall hazards, they are called conventional fall
protection. Warning lines, positioning devices, and safety monitoring systems are used
with more specialized applications; they are used primarily to protect workers doing
roofing tasks, and concrete formwork. Controlled-access zone defines an area where the
Page 43
33
worker is doing at the edge in the workplace, overhand bricklaying and related work, or
working and without using conventional fall protection.
8.1.2 Conventional Fall Protection
8.1.2.1 Personal fall arrest systems. In general, a personal fall arrest system
consists from anchor, connectors, and a body harness, they are working together to
prevent a person from falling and to minimize the arrest force. Sometimes a personal fall
arrest system includes a lanyard, a lifeline, and a deceleration device. However, this
system becomes effective only if you know how these groups that make up this system to
work together to arrest a fall. OSHA‟s design and performance requirements for personal
fall arrest systems were in Subpart M, 1926.502 (d).
8.1.2.1.1 The anchor. An anchor provides an important secure point of
attachment for a lanyard, lifeline, or deceleration device. It is considered the most
important personal fall arrest system component. It must be able to withstand or support a
minimum load of 5,000 pounds. There are some challenges or constrains, when it used on
wood framed and residential-type structure. Important points for using an anchor of arrest
fall system are it must be installed under the supervision of the person with qualifications,
and it must take a safety factor of at least twice the impact force of a worker that has six
feet free falling.
8.1.2.1.2 Connectors. A pair of conductors is the basic components of a personal
fall arrest system. Snap hooks and D-rings are common types of connectors. Connectors
must be pressed; drop forged or made from formed steel or strong material. They must be
made in a way that it is a high resistance of corrosion, with a smooth surface, and The
edges are fair curve to avoid damage other parts of the personal fall arrest system.
The D-ring and a body harness component are attaches to a lanyard or to a
deceleration device. D-rings are necessary have a minimum breaking strength 5,000 lbs.
The snap hook consists of a keeper and a hook-shaped member. It is opening to
receive a connecting component and when released, automatically closes. Snap hook
must also have a minimum breaking strength of 5,000 lbs. There are two common types
of snap hooks: locking and non-locking. The locking types will not open until it is
Page 44
34
unlocked because they have a self-locking keeper. OSHA considers; the non-locking type
is not always safe. It uses only locking snap hooks as part of the system.
8.1.2.1.3 The body harness. There are many types of body harness; all of these
consist of tapes that distribute fall arrest forces over the chest, pelvis, waist, thighs, and
shoulders. Body harnesses are light and comfortable. Any harness must include a back D-
ring for attaching lanyards, lifelines, or retractable devices and back pad for support. A
body harness must exert an inhibition force of no more than 1,800 lbs. on a falling
worker. The following must be remembered when you use a body harness:
Body harnesses must not be made from natural fibers.
There are different sizes of body harnesses. The body harness must fit properly.
The attribution point of a body harness must be located in the back center, around
shoulder level.
Must do not use recreational climbing harnesses.
8.1.2.1.4 Lanyards. A lanyard is a specially designed strap, rope, or webbing. It
connects a body harness to a deceleration device on one end, and to an anchor or a
lifeline on the other end. There are a variety of designs of a lanyard including self-
retracting and shock-absorbing types. Self-retracting type is moving easier either shock-
absorbing type is reducing fall-arrest forces. All of the types of lanyards must have a
minimum breaking strength of 5,000 lbs. The following must be remembered when you
use a lanyard;
Self-retracting lanyards with free-fall distance to equal or less of two feet must
have held a minimum load of 3,000 lbs. and the lanyard in the fully extended
position.
Self-retracting lanyards that do not limit free-fall distance to equal or less of two
feet must have held a minimum load of 5,000 lbs. and the lanyard in the fully
extended position.
When self-retracting lanyards do not limit free-fall distance to equal or less of two
feet, it is recommended to work near or directly below the anchor to prevent
swing falls.
Page 45
35
Lanyards should not be made from natural fibers.
8.1.2.1.5 Deceleration devices. There are three types of deceleration devices;
shock-absorbing lanyard, self-retraction lifeline, and rope grab. All of these types and
minimizing the fall distance are reduced to reduce the fall-impact force on the anchor.
The third type (rope grab) allows to move up and down a vertical lifeline. It automatically
locks onto the lifeline if worker fall.
8.1.2.1.6 Lifelines. In general, there are two types of lifeline, vertical and
horizontal. These types are flexible rope or cable that connect to a lanyard, a body
harness, or deceleration device and at least one anchor. Vertical lifelines must have a
minimum breaking strength of 5,000 lbs. They attach to a lanyard, a body harness, or
deceleration device and to an anchor.
The self-declining lifeline is both a vertical lifeline and a deceleration device. It is
comprised of a drum-wound line that unwinds and declines from the drum as a worker
moves. When the worker falls the drum automatically locks. Self-declining lifelines that
automatically limit the free-fall distance to equal or less of two feet must have a
minimum breaking strength of 3,000 lbs. Self-declining lifelines that do not limit the
free-fall distance to equal or less of two feet must have a minimum breaking strength of
5,000 lbs.
If you are moving horizontally over a long distance, the vertical lifeline can be a
risk because it creates the potential for a swing fall - a movement of the pendulum swing
that result from swinging under the anchor point. In contrast to the vertical lifeline, the
horizontal lifeline extends between two anchors. This allows moving freely across a flat
surface when connect to the line with a lanyard, body harness, or deceleration device.
Horizontal lifelines and the anchors are under high loads greater than the vertical
lifelines. Therefore, if not anchored correctly, horizontal lifelines may fail at the anchor
points. For these reasons, it is essential the horizontal lifelines be designed and installed
under the supervision of a qualified person to maintain a safety factor of at least twice the
impact force of a worker that has six feet free falling. To maintain the integrity of the
work, the lifeline must support at least 5,000 lbs. and lifeline of horizontal must support
Page 46
36
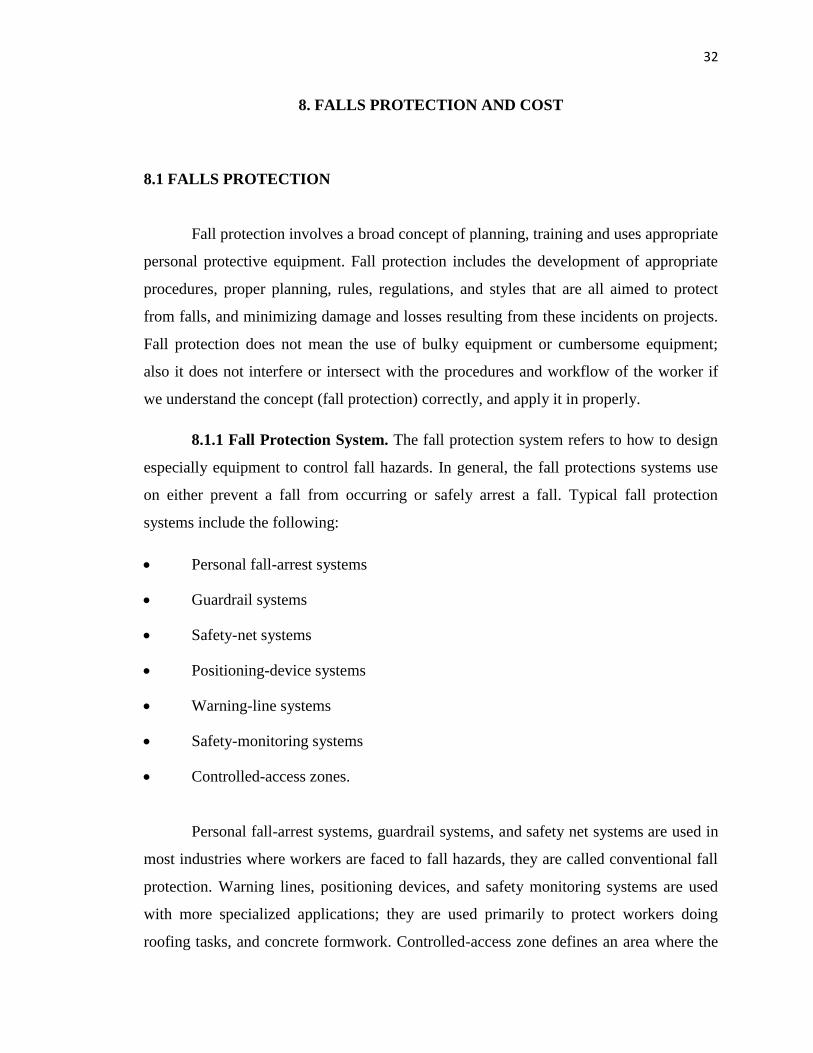
at least 5,000 lbs. per the worker. Lifeline must not be made from natural fiber rope
because the fiber deteriorates with time, and the line must be protected against cuts or
abrasions. A fall arrest system must remove from service immediately and do not use it
after it stops a fall until a relevant person determines that it is safe to return to service
(OSHA). See figure 8.1.
8.1.2.2 Guardrail systems. Guardrail systems are preventing workers, materials
and equipment from falling to lower level. Guardrail systems are consisting of top rails,
mid rails, and vertical members between them. OSHA design and performance
requirements for guardrail systems are in CFR 1926.502 (b), and include the following:
Guardrail systems must be free of bumps or sharp edges that may cause harm to
the worker or tearing his clothes. The thickness of the protection systems must be
at least a quarter inch, in order to reduce the risk of hand lacerations. Plastic or
steel banding is not permitted for top and mid rails.
Wire rope that is used with a top rail must be signed at least every six feet with
high-visibility material.
Figure 8.1- Shows Horizontal Lifeline.
Page 47
37
The top edge must be 42 inches, plus or minus three inches, above the surface to
which it is attached. The top edge height may exceed 45 inches when conditions
warrant.
When there is no wall or parapet at least 21 inches high, mid-rails, mesh, screens,
or similar protection must be installed between the top edge of the guardrail
system and the working surface. Mid-rails must be installed between the top edge
of the guardrail system and the working surface. Mesh and screens must extend
from the top rail to the working surface.
Vertical members, between the top and mid rail, must be no more than 19 inches.
The guardrail systems must have the ability to withstanding a 200 lbs. force
applied within two inches of its top edge in any outward or downward direction.
Screens, mid-rails, and vertical members must withstand at least 150 lbs. applied
in any downward or outward direction. See figure 8.2.
8.1.2.3 Safety net systems. Safety net systems typically are used to protect
workers who work at 25 feet or more above lower levels at building construction sites.
Safety net systems are comprised of mesh nets, panels, and a system of connecting them.
Figure 8.2- Shows Design of A guardrail Systems.
Page 48
38
OSHA's design and performance, the maximum net opening must not be more than 6
inches on a side, center-to-center (OSHA, CFR 1926.502 (c)).
Safety net systems must be installed to withstand a drop test involving a 400 lb.
bag of sand 30 inches in diameter dropped from a working surface. It must be able to
resist the impact without supporting anything below it. Safety nets system must be set up
as close as possible below working surfaces, but no more than 30 feet below the surfaces.
The outer edge of a safety net system must extend at least 8 feet from the edge of the
working surface. However, this distance depends on how far the net is below the working
surface. In the table 8.1 we can see the minimum distances (U.S. Department of Labor,
1996).
Table 8.1 – Minimum Required Horizontal Distance of Outer Edge of Net from the Edge
of the Working Surface.
Vertical distance
from working level to
horizontal plane of net
Minimum required horizontal
distance of outer edge of net from the
edge of the working surface
Up to 5 feet 8 feet
5 to 10 feet 10 feet
More than 10 feet 13 feet
8.1.3 Other Fall Protection Systems and Methods.
8.1.3.1 Fall restraint systems. In contrast to the personal fall-arrest system that is
designed to stop a fall, the fall restraint system prevents a fall. A fall restraint systems
consist of an anchor, a body harness or a body belt, and connectors. The fall restraint
system's anchor must be designed to support at least 3000 lbs. Addition; it must be
installed, designed, and used under the supervision of a skilled person.
Page 49
39
8.1.3.2 Positioning device systems. Positioning device systems help to work on
vertical surfaces such as a wall or vertical structure, and enable to work with both hands
free. This system is typically used as protection for placing rebar and concrete formwork.
There is a difference between a positioning device system and fall-arrest system: the
positioning device system supports the worker on an elevated surface and limits fall to
two feet. On the other hand, a personal fall arrest system stops a free fall without support
it. OSHA design and performance requirements for positioning device systems are in
CFR 1926.502 (e).
Positioning device anchors must be designed to support at least 3,000 lbs. Other
positioning device such as snap hooks and D-rings must be proof tested to a minimum
tensile load of 3,600 lbs. without a failure. To maintain the integrity of the positioning
device system the components must always be inspected for wear and damage before
using them.
8.1.3.3 Warning line systems. Warning line systems consist of wires, ropes, or
chains that are supported by stanchions. This system forms a barrier to warn those who
are working near the surfaces that do not have edges or rail. Warning lines systems mark
off an area within which worker can do roofing work without using safety nets or
guardrails. Warning line systems can be involved with personal fall arrest systems,
guardrail systems, or safety monitoring; which protect those doing roofing work on low
slope roofs (4:12 or less). OSHA's design and performance requirements for warning line
systems covered in CFR 1926.502 (f). See figure 8.3.
Figure 8.3 – Shows Simple Design of A warning Line System.
Page 50
40
8.1.3.4 Safety monitoring systems. A safety monitoring system is a set of steps
and procedures that take by a qualified person this person responsible to warning and
monitoring workers who may be unmindful of fall hazards. This system works in
conjunction with a controlled access zone and a fall protection plan is also adequate in
situations where conventional fall protection is not feasible. CFR 1926.502 (h) includes
the design and performance requirements for safety monitoring systems.
8.1.3.5 Controlled access zones. The controlled access zone defines as an area
where ones can do nearing the edge, overhand bricklaying and another related work, or
work under a fall hazard without using conventional fall protection. All others are
forbidden from entering a controlled access zone. This zone created by establishing lines,
or a control line, to restrict access to the area. The control line alerts the workers to work
or access to the zone is limited to authorized persons. See figure 8.4.
The following criteria must be considered when used the control lines:
Consist of wires, tapes, ropes, or equivalent materials and supporting Pillars.
Be marked at least every 6 feet, and used high visibility material
Must be no more than 45 inches from the working surface at its highest point and
no less than 39 inches from the working surface at its lowest point.
Must be a design at a minimum breaking strength of 200 lbs.
OSHA's design and requirements for controlled access zones. CFR 1926.502 (g)
Figure 8.4 – Shows Controlled Access Zone.
Page 51
41
8.1.3.6 Covers. A cover includes the use of any rigid or solid object to cover
opening in roofs, floors, and other working surfaces. A covering material must be able to
load at least twice the maximum load of workers, materials, and equipment. Covers must
have enough of edges to cover all parts of the hole, and all covers must be colored marks
and writes the word (Hole or Cover). Cover must be safety to prevent accidental
displacement. CFR 1926.502 (i) the design and performance requirements for covers. See
figure 8.5.
8.1.3.7 Training workers about fall protection. Employer must be aware of fall
hazards at his workplace, and they must work to minimize hazards of falling. The first
step must be selecting the fall protection toward meeting that responsibility. Training
workers is the second step, so the workers are familiar with the fall protection that they
will use. CFR1926.503 requires from employers to provide training for all workers who
are exposed to fall hazards.
Responsible person must be qualified to train that ensures workers will recognize
hazards of falls and use adequate procedures to reduce exposure to the hazards. In
addition, workers should know exactly how to use personal fall arrest systems and know
the following:
Figure 8.5- Shows Covers Systems.
Page 52
42
How to wear and use the equipment.
The attachment methods and adequate hookup for the equipment.
Storage and inspection procedures equipment after used it.
Appropriate anchoring and tie-off distances.
Self-rescue methods and techniques
8.2 COST OF FALL PPE
There are a lot of types of personal protective equipment (PPE) that are used by
individual workers to protect them from falling. These types vary depending on the work-
site at the construction industries, and also depend on the level of elevation from the
surface of the work place.
In this section, we will focus on the calculation the cost of PPE, which are
generally used to protect from a fall in construction industries. Tables 8.2, 8.3 show the
cost of PPE that it is reported by OSHA.
Table 8.2 – Cost of PPE to Protect from A fall in Construction Industries.
Page 53
43
Table 8.3 – Other Fall Protection Systems and Methods Cost.
Through the above results, the expected cost to protect a person from falling equal
$7,295.00 per person who is exposed to falling. This amount represents a cost of personal
protective equipment (PPE) which mentioned it by (OSHA). This equipment is sufficient
to protect any worker of falling hazard.
Employers or companies are obliged to provide worker with these equipment to
protect them. The cost of these materials is much less than the cost that may result from
in the event of a fall, which in Section 7 has been estimated at $ 222,000 per person.
Page 54
44
9. CONCLUSION AND RECOMMENDATION
The main purpose of this research is to encourage employers and companies in
the construction industry to take necessary and appropriate measures to reduce falls
accidents. A lot of employers may believe that the costs of providing the protection
systems to reduce falls accidents are large. They believe this spending will lead to a
reduction of profits or perhaps economic loss in construction projects. The consequences
of these convictions have contributed to a lot of fatal and non-fatal a fall accidents in the
construction industry. Fall accidents in construction are the most common that lead to
fatalities and severe injuries; during the last decade falls reached about 34% of the total
accidents in the construction industry (BLS 2009 CFOL Data). This percent is high when
the construction industry is representing 5% of the labor force in the U.S., but is
responsible for 20% of the work fatalities and 12% of disabling injuries.
We have been relying in this research on data and statistics that derived from
Occupation Safety and Health Administration (OSHA), and Bureau of Labor Statistics
(BLS) in the study and analysis. The study was to compare between the total cost of fall
accidents and costs of protective systems to reduce a fall accidents. The total costs of fall
accidents include Direct Costs, Indirect Costs, and Worker's Compensation Insurance
(WCI), in addition to social and family impacts for the injured person. Costs of protective
systems depend on work type, and elevation of work surface. In this thesis, we estimated
the cost of all the protection systems that can be used to avoid incidents of falling.
The result was an unexpected. The cost of all fall protection systems through the
use of all necessary equipment to protect worker from fall hazard was equal to $7,295.00
per person. It is much lower than the costs loss that may result from falls accidents. The
costs of a fall loss was equal to $ 222,000 per person which represents the Direct Costs,
Indirect Costs, and Worker's Compensation Insurance (WCI), in addition to social and
family impacts for the injured person.
Construction Industry has a prominent role in the growth of the U.S. economy in
terms of productivity and employment rat. Through study and analysis in this research,
Page 55
45
we recommend taking appropriate measures, and seek to develop a new mechanisms and
production systems to reduce all accidents that are causing a loss in money, time and
productivity. Also, the loss in worker's lives which is most important, and a negative
consequence that impacts on the society and his family.
Also, we recommend the companies to adopt Zero Injury Policy; Preparation
programs in the field of process safety to reduce fall accidents in the construction
industry. The workers must be trained in safety programs on a regular basis to ensure the
preservation their lives and health. In the end, we will reduce the costs that result from a
fall accidents.
Page 56
46
10. AREAS OF FUTURE RESEARCH
Clearly this research was a study of an important part of the problem facing the
construction industry. It has a recurrent incident that is causes a decline in productivity,
an increase in wasted spending, and stagnation in economic growth for this sector. Falls
are the main factor for incidents in the construction industry, and this was the basis for
the subject in this research. This research has been to clarify and correct some concepts
about costs of fall accidents and the cost of protection from them, but this certainly is not
the only reason that causes injuries.
Future study we will focus on a larger area of reasons that falls have a role in
these incidents. One of those reasons is worker's negligence in how use of protection
systems. A lot of time and study must be given on how to obligate a worker to be
responsible about use protection systems by using the appropriate procedures. One of the
measures that can be taken is a list of instructions that must be signed by the worker
before starting any work which requires fall protection. These instructions include
procedures for checking protection systems before use, measures to make sure of a
worker's knowledge for use these systems, procedures to bring equipment back to its
original position after use, and a lot of instructions that can be included to reduce these
incidents.
In addition, we can study other reasons for accidents that occur in the construction
industry. Transportation, contact w/objects, and exposure are equal 59.5% of construction
incidents; these represent a large opportunity to improve construction safety.
Another study for future research would be a survey of employers about their
perception about the cost of accidents and the cost of protection from accidents in the
construction industry. This will help in finding appropriate solutions to increase their
interest in supporting programs and protection systems to reduce the rate of accidents.
Page 57
APPENDIX A
FATAL OCCUPATIONAL INJURIES BY INDUSTRY AND EVENT OR
EXPOSURE, ALL U.S.
Page 68
APPENDIX B
CURRENT EMPLOYMENT STATISTICS SURVEY, ALL U.S.
Page 73
APPENDIX C
ANNUAL VALUE OF CONSTRUCTION PUT IN PLACE, 1993 - 2013
Page 79
69
BIBLIOGRAPHY
Berg, G., & Dutmer, R. (1998). Productivity, Quality, and Safety. A Relationship for
Success. Construction Dimensions, 9.
Bhattacharjee, S., & Ghosh, S. (2011). Safety Improvement Approaches in Construction:
A Review and Future Directions ASC Annual International Conference
Proceedings, 47, 8.
CPWR. (2013). The Construction Chart Book. The U.S. Construction Industry and Its
Workers. (978-0-9802115-1-1). 8484 Georgia Avenue, Suite 1000, Silver Spring,
MD 20910: Library of Congress Control Number: 2013937372.
Everett, J. G., & Jr., P. B. F. (1996). Costs of Accidents and Injuries to the Construction
Industry. CONSTRUCTION ENGINEERING AND MANAGEMENT, 6.
Hinze, J., & Appelgate, L. L. (1991). Costs of Construction Injuries. Construction
Engineering Management, 14.
Kaskutas, V., Dale, A. M., Lipscomb, H., & Evanoff, B. (2013). Fall prevention and
safety communication training for foremen: Report of a pilot project designed to
improve residential construction safety. Journal of safety research, 44, 111-118.
Leigh, P. J., & Miller, T. R. (1997). Ranking occupations based upon the costs of job-
related injuries and diseases. Journal of Occupational and Environmental
Medicine, 39(12), 1170-1182.
Page 80
70
McAlinden, S. P., Hill, K., & Swiecki, B. (Fall 2003). Economic Contribution of the
Automotive Industry to the U.S. Economy An Update. Alliance of Automobile
Manufacturers, 47.
MO Comp Rates. (2013). Missouri Rates for Select Workers Comp Class Codes. Worker
Compensation Shop. Retrieved 11-02, 2013, from
http://www.workerscompensationshop.com/mo-workers-comp-rates.html
N.C. Department of Labor. Occupational Safety and Health Division. (2008). A Guide to
Fall Prevention in Industry. Industry Guide, 32, 50.
National Safety Council. (2013). Injury facts. 2013 Edition. Itasca, IL: Author. Library of
Congress Catalog Card Number: 99-74142.
NIOSH Publications and Products. (2006). NIOSH Fatal Occupational Injury Cost Fact
Sheet: Construction. Centers for Disease Control and Prevention. Retrieved 09-
16, 2013, from http://www.cdc.gov/niosh/docs/2006-153/.
Reid, Janine L. (1995). Challenges for the Construction Industry, Construction Business
Review. 30-32.
Schulze, L. (2010). Case Study: Indirect Costs Associated with a Back Injury Incurred in
a Manufacturing Facility. American Society of Safety Engineers, 3(3)
Silverstein, B., Welp, E., Nelson, N., & Kalat, J. (1998). Claims incidence of work-
related disorders of the upper extremities: Washington State, 1987 through 1995.
American Journal of Public Health, 88(12), 1827-1833.
Texas Department of Insurance. (2009). Fall Protection for the Construction Industry.
Division of Workers’ Compensation(3), 19.
Page 81
71
U.S. Census Bureau. (2012). Construction Industry Statistics. Statistic Brain. Retrieved
12-07, 2013, from http://www.statisticbrain.com/construction-industry-statistics/.
U.S. Department of Commerce. (2012). Gross Domestic Product by Industry Data.
Bureau of Economic Analysis Retrieved 05-10, 2013, from
http://bea.gov/industry/gdpbyind_data.htm.
U.S. Department of Commerce. (2013). Construction Spending: Historical Value Put in
Place. Census Retrieved 05-17, 2013, from
http://www.census.gov/construction/c30/historical_data.html.
U.S. Department of Labor (2012). Safety and Health Topics. Occupational Safety &
Health Administration. Retrieved 03-23, 2014, from
https://www.osha.gov/dcsp/products/topics/businesscase/.
U.S. Department of Labor. (1982). OSHA's Ratio of Indirect to Direct Costs.
Occupational Safety & Health Administration. Retrieved 06-20, 2013, from
https://www.osha.gov/SLTC/etools/safetyhealth/mod1_costs.html.
U.S. Department of Labor. (2012). All about OSHA. Occupational Safety and Health
Administration. Retrieved 11-18, 2013, from
https://www.osha.gov/Publications/3302-06N-2006-English.html.
U.S. Department of Labor. (2013). Employment, Hours, and Earnings from the Current
Employment Statistics survey>. Bureau of Labor Statistics. Retrieved 08-03,
2013, from http://data.bls.gov/pdq/SurveyOutputServlet.
U.S. Department of Labor. (n.d.). OSHA Construction Etool: Safety Net Systems.
Occupation safety & Health Administration. Retrieved 07-12, 2013, from
https://www.osha.gov/SLTC/etools/construction/falls/safetynet.html.
Page 82
72
United States Department of Labor. (2012). Census of Fatal Occupational Injuries
(CFOI) - Current and Revised Data. Bureau of Labor Statistics. Retrieved 12-10,
2013, from http://www.bls.gov/iif/oshcfoi1.htm#charts.
Voorde, J. R. V. d. (1991). Estimating Indirect Costs of Injuries to Construction Workers.
University of Washington. (91-10897)
Waehrer, G. M., Dong, X. S., Miller, T., Haile, E., & Men, Y. (2007). Costs of
occupational injuries in construction in the United States. Accid Anal Prev, 39(6),
1258-1266. doi: 10.1016/j.aap.2007.03.012
Work Safe BC. (2005). An Introduction to Personal Fall Protection Equipment. Workers'
Compensation Board of B.C., 20.
Work Safe BC. (2012). Construction Sector Overview: Mechanism of Injury (MOI)
Sheets. Mechanism of Injury, 4.
Page 83
73
VITA
Mr. Sultan Noori Al-karawi. He was born in Jalawlaa, Diyala, Iraq in 1981. He
studied at Jalawlaa High School; he completed it in 1999. He entered collegiate studies
at Technology University in Baghdad, Iraq. Majoring in Civil Engineering, he graduated
with a Bachelor of Science with Good in September of 2003.
After graduation, He worked in a number of construction projects in his country
for three years. Since 2006 to 2011 he served in the Civil Engineering Department,
Diyala University to help civil engineering students in laboratories (Soil Lab, Concrete
Lab). In August 2011, he got a scholarship from the Higher Committee for Education
Development in Iraq to complete a master degree in Civil Engineering at Missouri
University of Science & Technology.
He focused in Construction Engineering and management when he studied at
Missouri University of Science and Technology, and he graduated with a Master of
Science in Civil Engineering in May 2014.