Page 1
Accepted Manuscript
Comparison of grinding energy efficiency between E and MPS type vertical spindle pulverizer based on the experimental and industrial sampling tests
Weining Xie, Yaqun He, Fengnian Shi, Yong Huang, Weiran Zuo, Shuai Wang, Biao Li, Wei Hua, Nianxin Zhou
PII: S0360-5442(17)30679-5
DOI: 10.1016/j.energy.2017.04.113
Reference: EGY 10754
To appear in: Energy
Received Date: 01 November 2016
Revised Date: 04 March 2017
Accepted Date: 21 April 2017
Please cite this article as: Weining Xie, Yaqun He, Fengnian Shi, Yong Huang, Weiran Zuo, Shuai Wang, Biao Li, Wei Hua, Nianxin Zhou, Comparison of grinding energy efficiency between E and MPS type vertical spindle pulverizer based on the experimental and industrial sampling tests,
(2017), doi: 10.1016/j.energy.2017.04.113Energy
This is a PDF file of an unedited manuscript that has been accepted for publication. As a service to our customers we are providing this early version of the manuscript. The manuscript will undergo copyediting, typesetting, and review of the resulting proof before it is published in its final form. Please note that during the production process errors may be discovered which could affect the content, and all legal disclaimers that apply to the journal pertain.
Page 2
ACCEPTED MANUSCRIPT
Comparison of energy efficiency between E and MPS type vertical spindle pulverizer
Modify the energy-size reduction model based on experimental data
Comparison of energy efficiency by breakage model and structure parameter difference
Relationship of product t10 linked with specific grinding energy and product tn
Comprehensive analyses of classification and grinding to compare energy efficiency
Page 3
ACCEPTED MANUSCRIPT
1
1 Comparison of grinding energy efficiency between E and MPS type vertical spindle
2 pulverizer based on the experimental and industrial sampling tests
3 Weining Xie, Yaqun He, Fengnian Shi, Yong Huang, Weiran Zuo, Shuai Wang,
4 Biao Li, Hua Wei, Nianxin Zhou
5
6
7
8 School of Chemical Engineering and Technology, China University of Mining and Technology,
9 Xuzhou, Jiangsu 221116, China; Julius Kruttschnitt Mineral Research Centre, The University of
10 Queensland, Brisbane Qld 4068, Queensland, Australia.
11
12
13 Address correspondence to Yaqun He, School of Chemical Engineering and Technology, China
14 University of Mining and Technology, Xuzhou 221116, Jiangsu, China; Fengnian Shi, Julius
15 Kruttschnitt Mineral Research Centre, The University of Queensland, Brisbane Qld 4068, Queensland,
16 Australia.
17
18
19
20 E-mail: [email protected] (Y.Q. He), [email protected] (F.N. Shi)
21 Tel number: +8613912005699, +61 7 3365 5913
22
Page 4
ACCEPTED MANUSCRIPT
2
23 Comparison of energy efficiency between E and MPS type vertical spindle pulverizer
24 based on the experimental and industrial sampling tests
25 Weining Xie1, Yaqun He1,2, Fengnian Shi3, Yong Huang4, Weiran Zuo5,
26 Shuai Wang1, Biao Li6, Wei Hua1, Nianxin Zhou2
27 1.Advanced Analysis &Computation Center, China University of Mining& Technology, Xuzhou,
28 Jiangsu 221116, China; 2. School of Chemical Engineering and Technology, China University of
29 Mining& Technology, Xuzhou, Jiangsu 221116, China; 3. Julius Kruttschnitt Mineral Research
30 Centre, The University of Queensland, Brisbane, Queensland 4068, Australia; 4. Beijing Power
31 Equipment Group, Fangshan, Beijing 102400, China; 5. College of Zijin Mining, Fuzhou University,
32 Fuzhou, Fujian 350000, China; 6. Mining and Minerals Engineering Department, Virginia Tech,
33 Blacksburg, VA 24060, USA.
34 Abstract: 0.5%~2% gross power generation of coal power plant is consumed by vertical spindle
35 pulverizer (VSP), and it is essential to select a VSP with better operational performance.
36 Simulated studies of lab-scale mills, which show the similar breakage mechanism with VSP, and
37 industrial sampling on VSPs are conducted to compare energy efficiencies of E and MPS type
38 VSPs (with the grinding media of balls and tread rollers, respectively). The classical energy-size
39 reduction model is modified with the addition of particle size in the exponential form to compare
40 the grinding energy efficiency (product fineness for the certain specific energy) of two lab-scale
41 mills. Also, differences in structure and operational parameters of lab-scale mills are considered.
42 For the industrial sampling tests of two VSPs, recorded data and size distribution of sampled
43 materials are preliminarily compared. Product t10 is selected as the bridge to connect the specific
44 grinding energy and size distribution of products. The modified breakage model is combined with
Page 5
ACCEPTED MANUSCRIPT
3
45 the King’s equation to compare the energy efficiency on the premise of feed in the same fineness.
46 Comprehensive comparison of the results obtained from both lab-scale and industrial-scale VSPs
47 suggests that the MPS type VSP shows the higher grinding energy efficiency and lower total
48 energy consumption.
49 Keywords: Energy efficiency Experimental study Industrial sampling Vertical spindle
50 pulverizer
51 1 Introduction
52 Particle breakage is a common and important process in the treatment of metal ores, raw coal,
53 cement, colorant, pharmaceutical powders and other materials. But the high energy consumption
54 is also an obsessional and headache problem for operators and researches. For instance,
55 comminution activities account for nearly 30% of the total energy consumption in a cement plant
56 [1]. While this proportion increases to 70% for a typical mineral processing plant [2]. It is noted
57 that the grinding equipment should be selected according to the property of materials. In addition,
58 energy efficiency of a certain grinding device depends not only on the operating and design
59 parameters, but also on the circuit that it belongs to. Hence, optimization for the grinding
60 technology or circuit is very essential for the saving energy.
61 The development and evolution of grinding equipment are conducted based on the principle of
62 improving the grinding performance [3]. Different grinding technologies have been compared
63 from various aspects, which can be classified as machines with different grinding mechanisms,
64 various grinding parameters or circuits and diverse grinding media. The first category is very
65 common for selecting proper and efficient grinding method for a certain purpose. Stirred mill
66 favors the fine and ultra-fine grinding due to using grinding media with a smaller diameter than
Page 6
ACCEPTED MANUSCRIPT
4
67 that of the ball mill. However, Shi et al. attempted to compare the energy efficiency of coarse
68 breakage with ball mills. There is no wonder that ball mill showed a higher energy efficiency [4].
69 It is known that mineral liberation also occurs in the process of particle breakage, and different
70 breakage methods may result in different liberation degrees. Comparative studies between the
71 compressed bed breakage and impact breakage indicated that the former method could promote
72 the mineral liberation of products with coarse sizes. But there is no significant difference for the
73 finer products [5,6]. Additionally, grinding methods also have effects on the separation process of
74 metals, and the yield or grade of concentrate can be improved with a properly selected grinding
75 method [7-9]. For the second category, it is more practical for improving the performance of
76 grinding technology. For instance, recycling loads of the high pressure grinding rolls (HPGR) has
77 an influence on the breakage performance by increasing the fineness of feed, which is beneficial
78 for creating a uniform material bed and a higher pressure gradient along the roller [10]. Hence, a
79 higher running efficiency than that of HPGR employed in an open circuit at the same product
80 fineness can be achieved by reducing energy consumption [11]. And the finer of the recycling
81 load, the lower of the specific energy consumption in HPGR [12]. The third category of
82 comparison mainly refers to the ball mills and stirred mills. Cylpebs are also an alternative
83 grinding media for ball mills in addition to balls. Shi found that cylpebs slightly reduced the yield
84 of coarse products while comparing cylpebs and balls at the same specific energy consumption
85 level, but the difference of products in fines was small [13]. Ipek indicated that a faster breakage
86 rate was obtained from using cylpebs [14], but the primary breakage distribution function
87 depended on the feed size, not the shape of grinding media [15]. While for the stirred mills, the
88 use of non-spherical media can give rise to various negative effects, such as dilation of particle
Page 7
ACCEPTED MANUSCRIPT
5
89 bed, decrease of bulk density, poorer performance of transporting and mixing, which are also
90 demonstrated by the Discrete Element Method (DEM). Hence, both the grinding performance and
91 energy efficiency of stirred mills deteriorate with using non-spherical media [16].
92 Vertical spindle pulverizers (VSP) are widely used in coal power plants and cement plants, but the
93 comparison of grinding efficiency among various VSPs is less common. Energy consumption in
94 the grinding process accounts for 0.5%~1% of the gross power generation [17]. In China, nearly
95 90% of coal power plants use VSP to grind raw coal to pulverized fuel (PF), and over 2 billion
96 tons of coals are consumed each year. It is crucial to save energy by optimizing the grinding
97 performance of VSPs. It is different to conduct directly experimental work in a closed industrial
98 scale VSP due to the high pressure and temperature. Therefore, some experimental works have
99 been performed with the lab-scale machines, whose breakage mechanisms are similar to that of
100 VSP [18-22]. These studies mainly focus on the description and modelling of the energy-size
101 reduction of raw coal, which could be regarded as the premise for conducting comparison studies
102 on different VSPs. Sato modified the Hardgrove mill by changing balls to rollers, and preliminary
103 discussed the effects of roller shapes on the grinding characteristics [23]. However, the small
104 batch roller mill used in above research still showed some differences in the angle of roller if
105 compared with that of MPS mill, making the findings incomplete. Some researches on the
106 industrial VSP have also been conducted, such as the utilization of VSP for the breakage of copper
107 or iron ores to reduce the energy consumption [24,25]. For VSP used in coal power plants, the
108 Julius Kruttschnitt Mineral Research Centre (JKMRC) and China University of Mining and
109 Technology (CUMT) conducted industrial sampling experiments on E, MPS and CKP type VSPs
110 in Australia and China, respectively. Kojovic modeled sampling data for these three different
Page 8
ACCEPTED MANUSCRIPT
6
111 VSPs, and provided a reliable tool for the optimization of PF grinding circuit [26]. Ozer also
112 developed a multi-component model with coupling the comminution and classification operations
113 for the E type VSP based on the sampling data of Tarong Energy [27,28].
114 Since the VSP plays an important role in the pulverizing system in a coal power plant, it is critical
115 to select the type of VSP reasonably. In present work, the comparison of energy efficiency
116 between E and MPS type VSPs was conducted. Lab-scale experiments have been designed on the
117 Hardgrove machine and lab-scale ring-race, which represents the E and MPS type VSP
118 respectively. Grinding energy efficiencies of two simulated devices were also compared by the
119 composite analyses of both the modified energy-size reduction model and the differences in
120 structure parameters. As to sampling tests, both feed and PF samples were obtained from the
121 industrial operated E and MPS type VSPs. Size distributions of sampled feed and PF are analyzed
122 and recorded data during the sampling process of two VSPs are contrasted. Energy efficiencies of
123 industrial VSPs were then discussed based on the sampled data and the differences in operational
124 and design parameters.
125 2 Experiment
126 2.1 Experimental tests
127 Raw coal, sampled from a coking coal preparation plant, was used in the experiments. Hardgrove
128 machine and lab-scale roller mill were applied to represent the grinding process of E and MPS
129 type VSP, respectively. In order to ensure the repeatability and correctness of results, some
130 exploratory experiments were first conducted. As the roller diameter of the lab-scale roller mill is
131 relatively larger, the upper size limit of samples was determined as 11.2 mm. In the Hardgrove
132 machine, large particles would start to accumulate on the bulge of grinding table and cannot be
Page 9
ACCEPTED MANUSCRIPT
7
133 broken regardless of longer grinding time. Hence, the upper size limit is decided to 4 mm. The
134 lower size limit of particles used in the roller mill was kept the same with the upper size limit of
135 the Hardgrove machine, which is beneficial for the comparison of grinding efficiency between two
136 mills. Raw coals of -11.2+8 mm, -8+5.6 mm, -5.6+4 mm were separately ground in the lab-scale
137 roller mill, and samples in size of -4+2.8 mm, -2.8+2 mm, -2+1.25 mm, -1.25+0.71 mm and -
138 0.71+0.5 mm were comminuted in the Hardgrove machine. Narrowly sized particles are in the size
139 ratio of , which benefits the analysis on particle effect on the grinding behavior if compared 2
140 with samples in the size ratio of 2. Two machines were modified with a power meter to measure
141 the energy consumption during particle breakage. These experimental tests have been
142 implemented and results were published in separated manuscripts [18,20]. In order to conduct the
143 comparison, experimental data were summarized, modelled and discussed again.
144 2.2 Industrial tests
145 For the industrial VSP, the mass flow rates of raw coal and PF are the same after the VSP operates
146 steady. Materials on the grinding table consist of the feed, and the rejects from elutriator and
147 separator, with a mass ratio (fresh feed to the total material) in the range from 1/13 to 1/9 [29]. It
148 is relatively hard to directly study the breakage behavior of fresh feed considering the
149 heterogeneous grinding of mixtures. Hence, in the comparison of energy efficiency between E and
150 MPS type VSPs, assumptions were made that the size-reduction of fine reject could be ignored,
151 and the PF was regarded as the product of fresh raw coal. After leaving the grinding table,
152 materials would be separated in the elutriator and separator in sequence, and the separation
153 efficiency influences the fineness and size distribution of PF. Separation efficiencies of elutriator
154 and separator would keep at the steady state during the breakage process of fresh feed based on
Page 10
ACCEPTED MANUSCRIPT
8
155 above assumptions, and do not change with the variation in fineness of coal fines that resulted
156 from continuously blowing the primary air.
157 For the industrial E type VSP used in the Yulin Energy and Chemical Company Ltd, raw coal was
158 fed by a belt conveyer. Sampling tool of feed moved across the section of belt to insure the
159 representativeness. While, for the industrial MPS mill of Xutang Power Company, materials were
160 fed by the closed weighting coal feeder to avoid the overflow of pressure air. Hence, a homemade
161 sampling equipment was designed, made and installed into the feeder. During the sampling
162 process, this tool was shifted tardily into the feeder by the hand shank and to get the raw coal
163 efficiently. Upon finishing, the hand shank was dragged out and screw was rotated downward to
164 insure the seal and therefore avoid the escape of PF. As the sampling port is relatively small, this
165 procedure would be repeated for several times to get enough samples. Sampling process of PF for
166 two industrial VSPs were the same, and details could be seen in the reference [30] published by
167 our group. Note that VSP should run steadily for at least 2 h before the sampling. Size
168 distributions of raw coal and PF were analyzed by the drying sieving technique.
169 3 Results and Discussion
170 3.1 Comparison of grinding energy efficiency by simulated devices of VSP
171 Previous studies have illustrated that the energy-size reduction of raw coal in narrow size in the
172 Hardgrove machine and lab-scale roller mill can be described by the classical breakage model
173 developed by JKMRC. Namely,
174 (1)t10 = A ∙ (1 - e- b ∙ Ecs)
175 Where t10 is the fineness index of ground products (%), Ecs is the mass specific energy (kWh.t-1),
176 A and b are ore impact breakage parameters.
Page 11
ACCEPTED MANUSCRIPT
9
177 As the breakage experiments were conducted for narrowly sized coal, various fitted values of A*b
178 were calculated and it is difficult to directly compare the grinding energy efficiencies of two
179 simulated VSP. Particle size has an effect on the energy-size reduction process and affects the
180 positions of trend lines of fineness t10 and specific energy. For the same energy input, ground
181 products of coarse particles show the big fineness t10 if compared with fine feed. In order to
182 decrease the scattering degree of figures, effect of the initial particle size on the energy-size
183 reduction should be modelled in the breakage model to describe the product fineness t10 in relation
184 to coal property. To overcome this issue, Shi used the Vogel and Peukert’s breakage probability
185 model to modify the energy-size reduction model and established a new one including the particle
186 size in the exponential term [31]. Similar work can also be done in our study and the classical
187 breakage model is modified as:
188 (2)t10 = A ∙ (1 - e- b ∙ x ∙ Ecs)
189 Where x is the diameter of initial particles (mm), the other parameters have the same meaning to
190 those in equation 1.
191 Based on the new model, data of breakage tests on two simulated devices are refitted and results
192 are shown in Fig. 1 and Fig. 2, with the R2 of 0.91 and 0.92, respectively. For the industrial VSP,
193 the size distribution of fresh raw coal feed was a little different with the one used in the
194 experimental design, which has a wider size distribution. But the modified breakage model, which
195 models the particle size, can help to analyze the grinding energy efficiencies of different industrial
196 VSPs. Also, the same coal was used in this simulation research, there, the effects of minerals types
197 and their associated conditions and coal ranks on the energy-size reduction could be ignored. As to
198 the values of A*b, the differences between A and b for raw coal ground in two devices indicated
Page 12
ACCEPTED MANUSCRIPT
10
199 the different breakage characteristics for them. Though there is no overlap of size for coal
200 breakage in the Hardgrove machine and lab-scale roller mill, comparisons among measured 113
201 groups of data and predicted ones by fitted A and b of two mills are conducted and results are
202 shown in Fig. 3 and Fig. 4. Two figures depict that if the product t10 is less than 70%, the
203 differences between predicted t10 values and measured ones is small. When the product t10
204 increases over 70%, which mainly originates from breakage experiments of coarse coal in the lab-
205 scale roller mill, predicted values by fitted parameters of Hardgrove machine are smaller than the
206 measured ones. But predicted results of lab-scale roller mill show a high fitting degree with
207 measured t10. Note that parameter A in equation 2 represents the maximum value of product t10.
208 Even though the breakage ratios are 10, the characteristic size of t10 for coal broken by Hardgrove
209 machine are smaller than those of roller mill. Based on the inference of area hypothesis developed
210 by Rittinger [32], more specific energy will be consumed by Hardgrove machine to yield products
211 of the same t10, due to the difference in the initial particle size. In other words, the product t10 is
212 higher for raw coal ground by roller mill at the same energy input. The difference in initial particle
213 size eventually results in the smaller of both product t10 and fitted value A for coal ground in the
214 Hardgrove machine. If the product fineness is above 70%, the t10 of coal broken in the roller mill,
215 calculated by fitted parameters of Hardgrove machine, is smaller than the measured one at the
216 same energy input and feed size. +4 mm particles is too big for the Hardgrove machine, but the
217 lab-scale roller mill is capable to break all samples used in this work. Fig. 4 demonstrates that
218 predicted t10 values by the modified breakage model with fitted parameters of the roller mill show
219 good agreement with measured ones. That is to say, for conditions of the same specific energy and
220 feed size, two mills would yield products in the same fineness t10. Or if the coal type, feed size and
Page 13
ACCEPTED MANUSCRIPT
11
221 product t10 are same, specific energies of two mills will also be the same.
222 The Hardgrove machine and roller mill show similar breakage mechanism and energy-size
223 reduction process, it is therefore possible to describe their breakage with the same model, although
224 the differences in structural parameters may lead to the variation of energy efficiency. Structural
225 and operational parameters and part of fitted results of two mills are presented in Table 1. Also,
226 fitted values A and b of coals used in two mills are calculated by the eq.2 and shown in this table.
227 As a standard device, structure and operational parameters of Hardgrove machine are fixed and
228 cannot change flexibly. Compared with the lab-scale roller mill, size and mass of raw coal, and
229 table revolution of Hardgrove machine are relatively small due to its small diameter of grinding
230 media and table. But difference in the loading force is little. Value A*b represents the resistance of
231 ore to be broken, and a higher value A*b indicates that the ore is relatively easy to break. Though
232 the same coals are used in grinding experiments, value A*b of coal ground in the Hardgrove
233 machine is a little larger than that in the lab-scale roller mill. That is to say, resistance of fine coal
234 to breakage in the Hardgrove machine is weak, which it is contrary to the principle that the ore
235 strength increases with the decrease of particle size [33]. It is possible that the differences in
236 structural and operational parameters lead to this phenomenon. Just as shown in Table 1, the
237 Hardgrove machine uses eight grinding media, and the ratio of the sum of media diameter to
238 perimeter of grinding table is 2:3. While, for the lab-scale roller mill, only one grinding roller is
239 used and its diameter accounts for 1/4 of the table perimeter. Therefore, the breakage events that
240 particles undergo in the Hardgrove machine are 2.67 times higher than those in the lab-scale roller
241 mill for every rotation. Considering difference in table revolution, this ratio reduces to 1.3 for unit
242 time. The more breakage events make fine coals show the weak resistance to be broken in the
Page 14
ACCEPTED MANUSCRIPT
12
243 Hardgrove machine. Above discussion indicates that the grinding energy efficiencies of two mills
244 are the same. For a given period, the breakage events in the Hardgrove machine are 1.3 times
245 higher than those in the lab-scale roller mill. If the specific energy is same, breakage events that
246 particles undergo in the roller mill will be less than those in the Hardgrove mill. That is to say that
247 the energy efficiency of per breakage event in the roller mill is higher. If the laboratory roller mill,
248 whose structure dimension is similar to the Hardgrove machine, has been equipped with proper
249 number of rollers, the breakage events that particles undergo would have increased and therefore
250 the energy-size reduction process would have been accelerated. Meanwhile, the fitted value A*b
251 of the roller mill will increase, and the roller mill shows the higher grinding energy efficiency in
252 comparison to Hardgrove machine. However, this inference needs to be verified with both
253 experimental and industrial experiments further.
254 3.2 Comparison between industrial E and MPS type VSP based on sampling data
255 3.2.1 Difference in operational parameters and running performance
256 During the industrial sampling of feed and PF of VSP, operation data were also recorded and
257 shown in Table 2. As the E type VSP was relatively small, unit power generated during surveys
258 was only one fifth of that of the MPS mill. In addition, the primary air blower consumes 59.19%
259 total power for the E type VSP, but this parameter of MPS type VSP was only 27.34%. The
260 primary air power of the small E type VSP was even higher than that of the bigger MPS mill. It
261 may be caused by the difference in mill structure. As shown in Fig. 5, the moving trajectories of
262 mixtures of air and coal were similar in two VSPs. Comparison of grinding zone indicates that
263 there are nine balls on the grinding table of E type VSP and the interspace among balls is
264 relatively small. However, the interspace among rollers in the MPS mill is big as only three rollers
Page 15
ACCEPTED MANUSCRIPT
13
265 are installed. Also, space around the grinding table of MPS mill is bigger than that of E type VSP.
266 A smaller interspace in the E type VSP results in the higher ventilation resistance to the primary
267 air flows, and therefore the power of air blower should be big enough. The total power
268 consumption of mill and air blower accounts for 2.21% of power generation of E type VSP, and
269 this ratio decreases to 0.78% for the MPS mill.
270 Industrial sampling experiments were conducted at five different operational conditions for two
271 VSPs, and the running parameters of each survey are shown in Fig. 6. As the E type VSP is small,
272 both of the feed and airflow rates of the E type VSP under each sampling condition are smaller
273 than those of the MPS mill. However, as to the ratio of airflow rate vs feed rate, the E type VSP
274 shows higher values than the MPS mill, which are indicated in Fig. 7. Since the ventilation
275 resistance of airflow in E type VSP is higher, the airflow rate would be quicker than that of MPS
276 mill to transport the same mass coal fines. Analyses of size distribution of feed and PF for each
277 sampling condition were conducted and the results indicate that the feed property of E type VSP is
278 steady and size distribution of PF does not change with different feed and airflow rates. However,
279 various coals were used in the MPS mill and the fineness of PF obtained under diverse sampling
280 conditions were different. In order to well contrast the operational and energy efficiencies of two
281 industrial VSPs, the second survey of E type VSP and the first and third sampling condition of
282 MPS mill were selected as representable surveys for the further comparison.
283 Detailed size distributions of feed and PF of represent industrial sampling surveys are described in
284 Fig. 8. Size distributions of +3 mm coarse feed for these surveys are similar, but yield of particle
285 in -3+0.2 mm of MPS mill is about 15% higher than that of E type VSP. Additionally, the PF
286 fineness of E type VSP is obviously coarser than that of MPS mill, and the finest PF was achieved
Page 16
ACCEPTED MANUSCRIPT
14
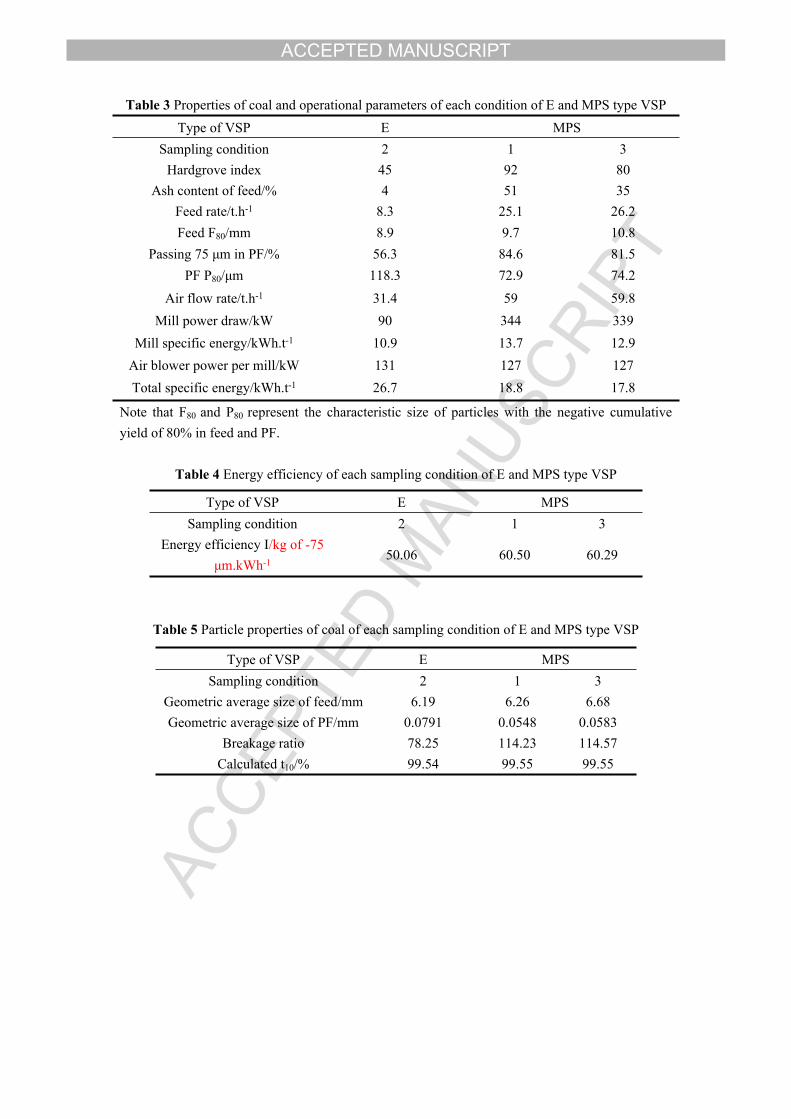
287 from the MPS mill under the first sampling condition. Table 3 provides the information on coal
288 properties and running parameters of these surveys. The raw coal fed into E type VSP is with a
289 much lower ash content than those of the MPS mill, but the Hardgrove index (HGI) of coal in high
290 ash contents are about two times as the super clean coal, which indicates that associated minerals
291 could promote the generation of fines. Based on the empirical model for calculating the HGI, the
292 bigger HGI of coal ground by the MPS type mill may lead to the difference in the yield of -75μm
293 PF which is 10%-15% higher in comparison with E type VSP. However, the sampling tests show
294 that the difference is over 25%. Figures in Table 3 and Fig. 8 demonstrate that the MPS type VSP
295 show a better grinding performance. The feed rate of E type VSP is only a quarter of that of MPS
296 mill, and the F80 of feed is relatively small. However, the fineness of PF for the MPS mill is high,
297 with the P80 at around 73μm, and only 61.86% of that of E type VSP. On the other hand, the P80 of
298 PF of the E type VSP is 118.3 μm, which is much higher than the standard fineness of PF (the
299 passing 75 μm in PF should be bigger than 85%). Hence, it can be inferred that the combustion
300 efficiency of boiler that connects with the E type VSP would be lower due to the coarse PF.
301 Though the specific grinding energy of the MPS mill is 25% higher than that of the E type VSP,
302 yield of -75 μm fines in PF is 1.5 times as that of the smaller E type VSP. So, conclusion could be
303 roughly made that the energy efficiency of MPS mill in the grinding process is higher than that of
304 E type VSP. In addition, overlarge air blower power makes the total specific energy consumed by
305 E type VSP is as high as 26.7 kWh.t-1, which is 40% bigger than that consumed by the MPS mill.
306 In this case, there is a huge potential to save energy for the pulverizing system equipped with a E
307 type VSP.
308 3.2.2 Comparison of grinding energy efficiency
Page 17
ACCEPTED MANUSCRIPT
15
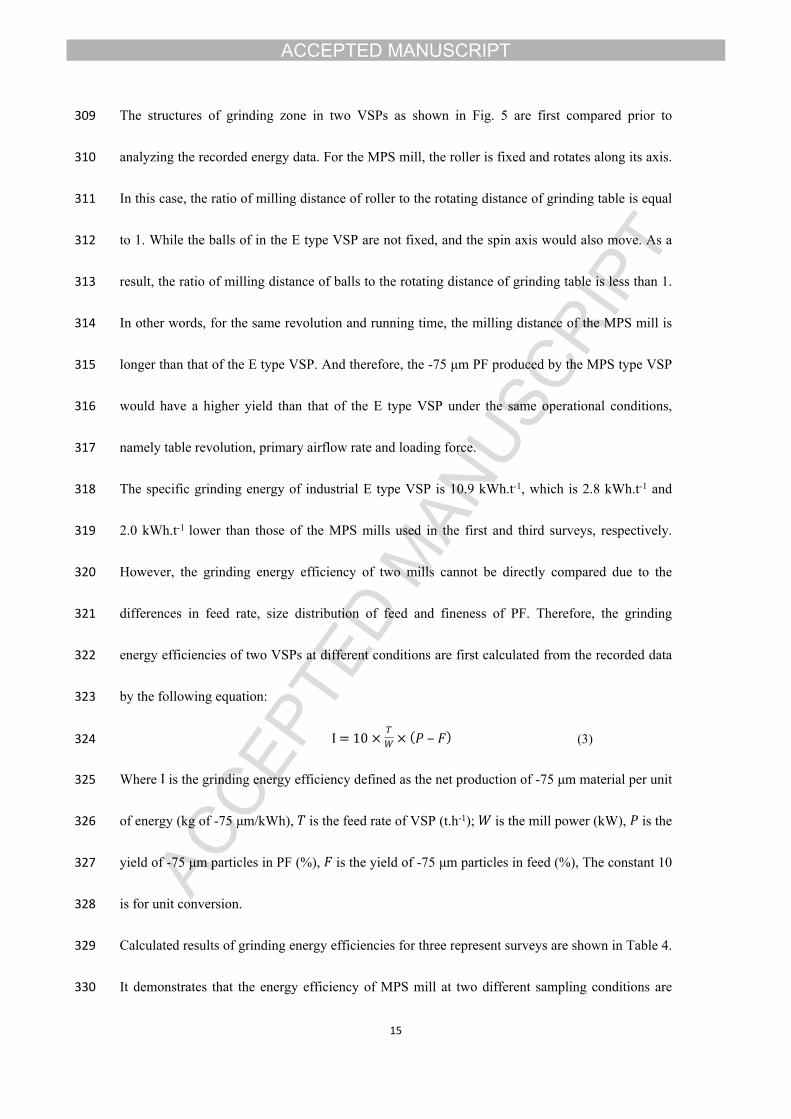
309 The structures of grinding zone in two VSPs as shown in Fig. 5 are first compared prior to
310 analyzing the recorded energy data. For the MPS mill, the roller is fixed and rotates along its axis.
311 In this case, the ratio of milling distance of roller to the rotating distance of grinding table is equal
312 to 1. While the balls of in the E type VSP are not fixed, and the spin axis would also move. As a
313 result, the ratio of milling distance of balls to the rotating distance of grinding table is less than 1.
314 In other words, for the same revolution and running time, the milling distance of the MPS mill is
315 longer than that of the E type VSP. And therefore, the -75 μm PF produced by the MPS type VSP
316 would have a higher yield than that of the E type VSP under the same operational conditions,
317 namely table revolution, primary airflow rate and loading force.
318 The specific grinding energy of industrial E type VSP is 10.9 kWh.t-1, which is 2.8 kWh.t-1 and
319 2.0 kWh.t-1 lower than those of the MPS mills used in the first and third surveys, respectively.
320 However, the grinding energy efficiency of two mills cannot be directly compared due to the
321 differences in feed rate, size distribution of feed and fineness of PF. Therefore, the grinding
322 energy efficiencies of two VSPs at different conditions are first calculated from the recorded data
323 by the following equation:
324 (3)I = 10 ×𝑇𝑊 × (𝑃 ‒ 𝐹)
325 Where is the grinding energy efficiency defined as the net production of -75 μm material per unit I
326 of energy (kg of -75 μm/kWh), is the feed rate of VSP (t.h-1); is the mill power (kW), is the 𝑇 𝑊 𝑃
327 yield of -75 μm particles in PF (%), is the yield of -75 μm particles in feed (%), The constant 10 𝐹
328 is for unit conversion.
329 Calculated results of grinding energy efficiencies for three represent surveys are shown in Table 4.
330 It demonstrates that the energy efficiency of MPS mill at two different sampling conditions are
Page 18
ACCEPTED MANUSCRIPT
16
331 nearly the same, which is 20% higher than that of E type VSP. This is identical with the inferences
332 obtained in the foregoing section. However, this model only concerns particles in -75 μm. As the
333 feed to mill is relatively coarse, parameter cannot represent the granulometric property of feed 𝐹
334 well, especially for the coarse part. Analyses in section 3.1 have illustrated that the modified
335 energy-size reduction model, with the addition of size, and fitted parameters for the particle
336 breakage in lab-scale roller mill could describe the experimental results of two simulated research
337 devices. As the lab-scale mills show the similar breakage mechanism and structure parameters to
338 the industrial VSP, the modified model and fitted parameters for the lab-scale roller mill were
339 directly applied for the comparison of grinding energy efficiency of two industrial VSPs. The
340 initial particle size in the model should be determined prior to the calculation. As the size
341 distribution of feed is relatively wide and recorded specific grinding energy is consumed by
342 particles in various size fractions, specific energy split by particles of narrow size cannot be
343 measured. Hence, the geometric average (GA) size of feed is computed, and characteristic size
344 and value of PF t10 are also determined. Simultaneously, the GA sizes of PF and breakage ratios of
345 various surveys are obtained. Results are summarized in Table 5. Figures indicate that the GA size
346 of the feeds to the two VSPs are similar. The PF GA size of E type VSP is coarse, which is 1.4
347 times to that of two sampling conditions of MPS mill, and the breakage ratio of E type VSP is
348 only 68% of that of MPS mill. Since the characteristic size of PF t10 is as high as 0.6 mm, values
349 of t10 reach to 100% and it cannot reflect the fineness of PF well. In order to compare the grinding
350 energy efficiency of two VSPs, it is important to relate the size distribution of PF to the specific
351 grinding energy. In section 3.1, the classical breakage model has been modified to describe the
352 relation among product t10, initial size and specific grinding energy. So, it is essential to link the t10
Page 19
ACCEPTED MANUSCRIPT
17
353 with size distribution of PF. Here, the King’s equation correlating tn with t10 is selected [34],
354 namely
355 (4)𝑡𝑛 = 1 ‒ (1 ‒ 𝑡10)(9 (𝑛 ‒ 1))𝛼
356 Where is the cumulative yield passing a given fraction of the initial size (%), is constant 𝑡𝑛 x 𝑛 n
357 and selected as 10, 20, 30, to 130, is the fitting parameter. α
358 Size distributions of PF of the selected three surveys are fitted by this model and the results are
359 shown in Fig. 9, with the R2 above 0.96. As the PF of E type VSP is coarse, fitting error is
360 relatively bigger if the breakage ratio is over 100. In this case, the product t80 (characteristic size n
361 of 0.079 mm) is selected to compare the difference in energy consumption for yield the same PF
362 fineness or difference in PF fineness at the same specific energy input. To implement this
363 comparison, equation 2 is substituted into equation 4 and yields:
364 (5)𝑡𝑛 = 1 ‒ [1 ‒ A ∙ (1 - e- b ∙ x ∙ Ecs)](9 (𝑛 ‒ 1))𝛼
365 Parameters in equation 5 are the same with those in equations 2 and 4. Based on the new model,
366 comparison is conducted on the premise of similar size distribution of feed. Calculated results
367 show that only 41% of specific grinding energy of the E type VSP (12.84 kW.h.t-1) is required to
368 yield product t80 of 40% for the MPS mill (5.25 kW.h.t-1). Or the product t80 of the MPS mill
369 (50.17%) is 1.27 times bigger than that of E type VSP (39.60%) if the specific grinding energy is
370 10 kW.h.t-1.
371 According to industrial sampling data of two VSPs, energy efficiencies are compared. It is found
372 that more energy is consumed by the air blower because the relatively compact internal structure
373 of E type VSP increases the ventilation resistance of air flow. In addition, analyses of size
374 distribution of feed and PF indicate that the breakage performance in the MPS mill is better, due to
Page 20
ACCEPTED MANUSCRIPT
18
375 a finer PF and a larger breakage ratio. Moreover, the MPS mill applies less energy to yield PF in
376 the same fineness, showing a higher grinding energy efficiency. Comprehensive analyses of
377 classification and grinding process demonstrate that the MPS mill shows a higher energy
378 efficiency and can help realize the purpose of energy saving.
379 3.3 Confidence analyses of experimental data
380 In this study, over one hundred lab-scale grinding tests were conducted, and ten industrial
381 sampling experiments were performed on the E and MPS type VSPs. Also, size distribution of
382 more than 100 ground products were analyzed. Hence, it is important and essential to make error
383 analysis to ensure the correctness and repeatability of results. Duplicate grinding tests were
384 conducted for the lab-scale roller mill and Hardgrove machine, and the confidence analysis of
385 experimental data is made. As discussed in reference 18 and 20, the 98% or 90% confidence limit
386 is less than 5% of the mean value, which indicates that the repeatability of results is relatively
387 high. Variation in properties of narrowly sized coal are relatively less and therefore ensure the
388 repetitiveness [18]. For the industrial sampling test, repeated experiments were made for the MPS
389 type VSP, namely the tests under the second and third sampling condition. The operation
390 parameters in the two parallel tests were the same except that the air rate of survey 2 was 3 t.h-1
391 higher than that of survey 3 [30]. Size compositions of feed and PF for two sampling conditions
392 are shown in Fig. 10. The particle content accumulative curves for the feed or feed of two tests are
393 nearly coincidence with each other. It depicts a high consistency in the sampling process of
394 industrial VSPs. Hence, repeatability of lab-scale and industrial experiments is good, and the
395 results of this study are believable.
396 4 Conclusions
Page 21
ACCEPTED MANUSCRIPT
19
397 The energy efficiencies of E and MPS type VSPs were compared based on experimental grinding
398 tests and industrial sampling experiments. Though the particle size and feed rate of MPS type VSP
399 are larger, the yield of -75 μm PF is larger and the PF P80 is smaller if compared with those of E
400 type VSP. The bigger HGI of coal ground by MPS type mill may lead to a 10%-15% difference in
401 the yield of -75μm PF in comparison with E type VSP. Also, the sampling tests indicate that this
402 difference is over 25%, which demonstrates the MPS type VSP shows a better grinding
403 performance. Comparison of grinding process is divided into two parts: experimental and
404 industrial tests. A modified energy-size reduction model, with the addition of particle size, has
405 been developed from the breakage data of both the Hardgrove machine and lab-scale roller mill.
406 Although all experimental grinding data of two mills could be described by the modified model
407 with the same fitted parameters, which indicates the same grinding energy efficiency, the
408 difference in structure makes the number of breakage events that particles undergo in the
409 Hardgrove machine is 1.3 times as that in the roller mill. Hence, the lab-scale roller mill, which
410 shows the same breakage mechanism with MPS mill, has a higher grinding energy efficiency. For
411 the comparison of industrial VSPs, the total specific energy, including the mill and air fan, of E
412 type VSP is much higher than that of MPS type VSP, due to the compact structure and higher
413 flowing resistance. Also, the breakage ratio of feed to pulverized fuel for the MPS type VSP is
414 about 1.5 times higher than that of the E type VSP. The product t10 is linked with the specific
415 grinding energy and product tn, in which the particle size is modeled, and relationship among
416 specific grinding energy, size distribution of feed and PF is established. On the premise of
417 neglecting the effect of classification on the size distribution of PF at the steady working
418 condition, grinding efficiencies of industrial VSPs are compared based on the similar size
Page 22
ACCEPTED MANUSCRIPT
20
419 distribution of feed. Results indicate that specific grinding energy of MPS mill (5.25 kW.h.t-1) is
420 only 41% of that of E type VSP (12.84 kW.h.t-1) to yield product t80 of 40%. Or the product t80 of
421 MPS mill (50.17%) is 1.27 times bigger than that of E type VSP (39.60%) if the specific grinding
422 energy is 10 kW.h.t-1.
423 Since the MPS mill shows a higher energy efficiency according to the comprehensive analyses of
424 the classification and grinding process, it is sensible and essential to the popularize the utilization
425 of MPS mill in coal power plants to improve the operational efficiency and reduce the raw coal
426 consumption. This work is a preliminary attempt to compare different VSPs, and more efficiency
427 studies, which are directly based on mathematical models of industrial VSP, still should be
428 conducted further.
429 Acknowledgement
430 The financial support for this work was from the Fundamental Research Funds FOR THE central
431 Universities (2017XKMS085). The vertical spindle pulverizer modelling work was conducted as a
432 part of the Asia-Pacific Partnership on Clean Development and Climate Program (APP) funded by
433 the Australian Government Department of Resource, Energy and Tourism. The support from
434 Xutang Power Company, Yulin Energy and Chemical Company Ltd and Beijing Power
435 Equipment Group Ltd during the industrial sampling work is gratefully acknowledged.
436 Reference
437 [1] Toprak NA, Altun O, Aydogan N, Benzer H. The influences and selection of grinding
438 chemicals in cement grinding circuits. Constr Build Mater 2014; 68:199-205.
439 [2] Fuerstenau DW, Lutch JJ, De A. The effect of ball size on the energy efficiency of hybrid
440 high-pressure roll mill/ball mill grinding. Powder Technol 1999; 105(1):199-204.
Page 23
ACCEPTED MANUSCRIPT
21
441 [3] Daniel L, Ron Z. Assessing the energy efficiency of a jaw crusher. Energy 2014; 74(1): 119-
442 130.
443 [4] Shi FN, Morrison R, Cervellin A, Burns F, Musa F. Comparison of energy efficiency between
444 ball mills and stirred mills in coarse grinding. Miner Eng 2009; 22(7):673-80.
445 [5] Ozcan O, Benzer H. Comparison of different breakage mechanisms in terms of product
446 particle size distribution and mineral liberation. Miner Eng 2013; 49:103-8.
447 [6] Hoşten Ç, Özbay C. A comparison of particle bed breakage and rod mill grinding with regard
448 to mineral liberation and particle shape effects. Miner Eng. 1998; 11(9):871-4.
449 [7] Felt DR, Bednar AJ, Georgian T. The effects of grinding methods on metals concentrations in
450 soil. Talanta, 2008; 77(1):380-7.
451 [8] Feng D, Aldrich C. A comparison of the flotation of ore from the Merensky Reef after wet and
452 dry grinding. Int J Miner Process. 2000; 60(2):115-29.
453 [9] Li M, Zhang JX, Liu Z, Zhao X, Huang P. Mechanical analysis of roof stability under
454 nonlinear compaction of solid backfill body. Int J Min Sci Technol 2016; 26(5): 863-868.
455 [10] Ozcan O, Aydogan NA, Benzer H. Effect of operational parameters and recycling load on the
456 high pressure grinding rolls (HPGR) performance. Int J Miner Process 2015; 136:20-5.
457 [11] Altun O, Benzer H, Dundar H, Aydogan NA. Comparison of open and closed circuit HPGR
458 application on dry grinding circuit performance. Miner Eng. 2011; 24(s 3–4):267-75.
459 [12] Jankovic A, Suthers S, Wills T, Valery W. Evaluation of dry grinding using HPGR in closed
460 circuit with an air classifier. Miner Eng 2015; 71:133-8.
461 [13] Shi FN. Comparison of grinding media- Cylpebs versus balls. Miner Eng 2004; 17(s11–
462 12):1259-68.
Page 24
ACCEPTED MANUSCRIPT
22
463 [14] Ipek H. The effects of grinding media shape on breakage rate. Miner Eng 2006; 19(1):91-3.
464 [15] Ipek H. Effect of Grinding Media Shapes on Breakage Parameters. Part Part Syst Char 2007;
465 24(24):229-35.
466 [16] Sinnott MD, Cleary PW, Morrison RD. Is media shape important for grinding performance in
467 stirred mills? Miner Eng 2011; 24(2):138-51.
468 [17] Shi FN, He YQ, Kojovic, Zuo WR. Efficiency improvements in coal fired utilities. Report of
469 Asia-Pacific Partnership on Clean Development and Climate, 2011.
470 [18] Austin LG, Shah J, Wang J, Gallagher E, Luckie PT. An analysis of ball-and-race milling
471 part1. the hardgrove mill. Powder Technol 1981; 29:263-75.
472 [19] Xie WN, He YQ, Zhang YH, Huang Y, Li H, Wei H. Simulation study of the energy-size
473 reduction of MPS vertical spindle pulverizer. Fuel 2015; 139:180-9
474 [20] Shi FN, Zuo WR. Coal breakage characterisation – Part 1: Breakage testing with the JKFBC.
475 Fuel 2014; 117:1148-55.
476 [21] Xie WN, He Y1, Luo C, Zhang X, Li H, Wang HF, Shi FN. Energy-Size Reduction of Coals
477 in the Hardgrove Machine. Int J Coal Prep Util 2015; 35(2):51-62.
478 [22] Wang P, Jiang JQ, Zhang PP, Wu QL. Breakage process and mining stress evolution
479 characteristics of a high-position hard and thick stratum. Int J Min Sci Technol 2016; 26(4): 563-
480 569.
481 [23] Sato K, Meguri N, Shoji K, Kanemoto H, Hasegawa T, Maruyama T. Breakage of coals in
482 ring-roller mills Part I. The breakage properties of various coals and simulation model to predict
483 steady-state mill performance. Powder Technol 1996; 86(3):275-83.
484 [24] Toprak NA, Altun O, Aydogan N, Benzer H. The influences and selection of grinding
Page 25
ACCEPTED MANUSCRIPT
23
485 chemicals in cement grinding circuits. Constr Build Mater 2014; 68:199-205.
486 [25] Reichert M, Gerold C, Fredriksson A, Adolfsson G, Lieberwirth H. Research of iron ore
487 grinding in a vertical-roller-mill. Miner Eng 2014; 73(15):109-15.
488 [26] Kojovic T, Shi F, Brennan M. Modelling of vertical spindle mills. Part 2: Integrated models
489 for E-mill, MPS and CKP mills. Fuel 2015; 143:602-11.
490 [27] Özer CE, Whiten WJ, Lynch AJ. A multi-component model for the vertical spindle mill. Int J
491 Miner Process 2016; 148:155-65.
492 [28] Özer CE. A new multi-component model for the vertical spindle mill. PhD thesis. The
493 University of Queensland, Australia, 2011.
494 [29] Zuo WR. Mathematic modeling and optimization on the process of MPS coal mill. PhD
495 thesis, China University of Mining and Technology (CUMT), China, 2013.
496 [30] Li H, He YQ, Shi FN, Zuo WR, Zhou NX, Wei H, Wang S, Xie WN. Performance of the
497 static air classifier in a Vertical Spindle Mill. Fuel 2016; 177:8-14.
498 [31] Shi FN, Kojovic T. Validation of a model for impact breakage incorporating particle size
499 effect. Int J Miner Process 2007; 82(3):156-63.
500 [32] Rittinger RP. Textbook of mineral dressing. Berlin: Ernst and Korn. 1867.
501 [33] He YQ. Textbook of coal preparation. China University of Mining and Technology Press,
502 2014.
503 [34] King RP. Modeling and simulation of mineral processing systems, first edit, Butterworth-
504 Heinemann Publisher, 2001.
Page 26
ACCEPTED MANUSCRIPT
Fig. 1. The modified breakage model fitted to experimental data of the Hardgrove machine
Fig. 2. The modified breakage model fitted to experimental data of the lab-scale roller mill
Fig. 3. Comparison between measured and predicted t10 by model fitting parameters based on the Hardgrove machine
Page 27
ACCEPTED MANUSCRIPT
Fig. 4. Comparison between measured and predicted t10 by model fitting parameters based on the lab-scale roller mill
Fig. 5. Structure of E and MPS type VSPs
Fig. 6. Feed and airflow rate for each sampling condition of E and MPS type VSPs
Page 28
ACCEPTED MANUSCRIPT
Fig. 7. Ratio of airflow rate vs feed rate for each sampling condition of E and MPS type VSPs
Fig. 8. Size distribution of feed and PF of representative conditions of E and MPS type VSP
Fig. 9. Curves of coal fineness tn vs breakage ratio n of industrial samples of two VSPs
Page 29
ACCEPTED MANUSCRIPT
Fig. 10. Size distribution of feed of repeat sampling conditions of MPS type VSP
Page 30
ACCEPTED MANUSCRIPT
Table 1 Experimental parameters and results in the simulated experimental studiesof two devices
Type of grinding mill Hardgrove mill Lab-scale roller millDiameter of grinding table/mm 98 260Diameter of grinding media/mm 25.4 200
Number of grinding media 8 1Diameter of media VS perimeter of table 2:3 1:4
Size of raw coal/mm -4+0.5 -11.2+4Mass of raw coal/g 50 60-120
Loading force/N 284 200-400Revolution of grinding table/rpm 20 41.6
A*b 14.45 12.94A 76.03 99.55b 0.19 0.13
Table 2 Operational data of two pulverizing systems during the industrial sampling
Type of VSP E MPS Unit power generation during surveys/MW 60 300
Number of running pulverizer 6 5Total mill power/kW 542 1693
Primary air power/kW 786 637Mill + Primary air blower power/kW 1328 2330
Mill power consumption/% 40.81 72.66Primary air blower power consumption/% 59.19 27.34
Ratio of power consumed by VSP to total generated power/% 2.21 0.78
Page 31
ACCEPTED MANUSCRIPT
Table 3 Properties of coal and operational parameters of each condition of E and MPS type VSPType of VSP E MPS
Sampling condition 2 1 3Hardgrove index 45 92 80
Ash content of feed/% 4 51 35Feed rate/t.h-1 8.3 25.1 26.2Feed F80/mm 8.9 9.7 10.8
Passing 75 μm in PF/% 56.3 84.6 81.5PF P80/μm 118.3 72.9 74.2
Air flow rate/t.h-1 31.4 59 59.8Mill power draw/kW 90 344 339
Mill specific energy/kWh.t-1 10.9 13.7 12.9Air blower power per mill/kW 131 127 127Total specific energy/kWh.t-1 26.7 18.8 17.8
Note that F80 and P80 represent the characteristic size of particles with the negative cumulative yield of 80% in feed and PF.
Table 4 Energy efficiency of each sampling condition of E and MPS type VSP
Table 5 Particle properties of coal of each sampling condition of E and MPS type VSP
Type of VSP E MPS Sampling condition 2 1 3
Energy efficiency I/kg of -75 μm.kWh-1 50.06 60.50 60.29
Type of VSP E MPS Sampling condition 2 1 3
Geometric average size of feed/mm 6.19 6.26 6.68Geometric average size of PF/mm 0.0791 0.0548 0.0583
Breakage ratio 78.25 114.23 114.57Calculated t10/% 99.54 99.55 99.55