COMPARISON OF HUMAN OCCUPANT KINEMATICS IN LABORATORY IMPACT AND RUN-OFF-ROAD CRASH CONFIGURATIONS R. Reichert, S. Kan, D. Marzougui, K. Opiela TRB, 1st International Road Safety Conference San Francisco, June 12-15, 2017 1
Transcript
COMPARISON OF HUMAN OCCUPANT
KINEMATICS IN LABORATORY IMPACT AND RUN-OFF-ROAD CRASH CONFIGURATIONS
R. Reichert, S. Kan, D. Marzougui, K. Opiela
TRB, 1st International Road Safety Conference
San Francisco, June 12-15, 2017
1
An accident on the “Autobahn” …
2
Source: Youtube
TRB, 1st International Road Safety Conference, 2017
“Safety doesn’t happen by accident”
The fatality rate in the US has been stagnant since 2009 Additional safety research is needed
TRB, 1st International Road Safety Conference, 2017
Compare Occupant Kinematics and Injury Risk in different load cases. Evaluate near- and far-side occupants
Research Objective
4
Validated vehicle model
Validated human occupant
models
TRB, 1st International Road Safety Conference, 2017
Outline
Model Development & Validation
90° Pole Impact
75° Pole Impact
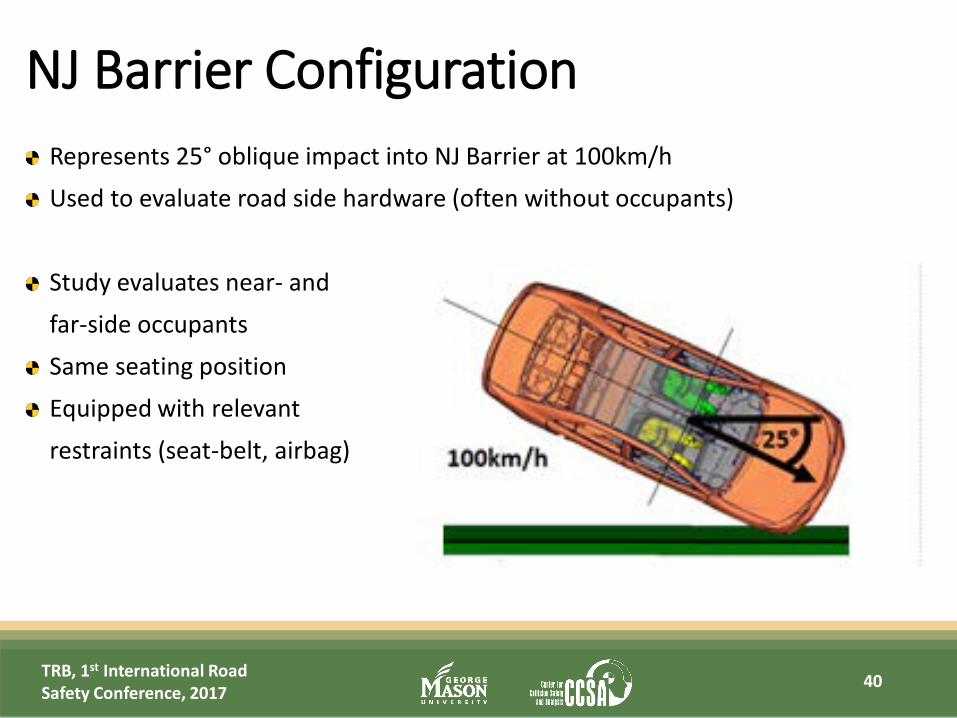
NJ Barrier Impact
Summary
5 TRB, 1st International Road Safety Conference, 2017
Mid-size sedan
Latest Developed FE-Model
6
1000 parts
2.3 million elements
TRB, 1st International Road Safety Conference, 2017
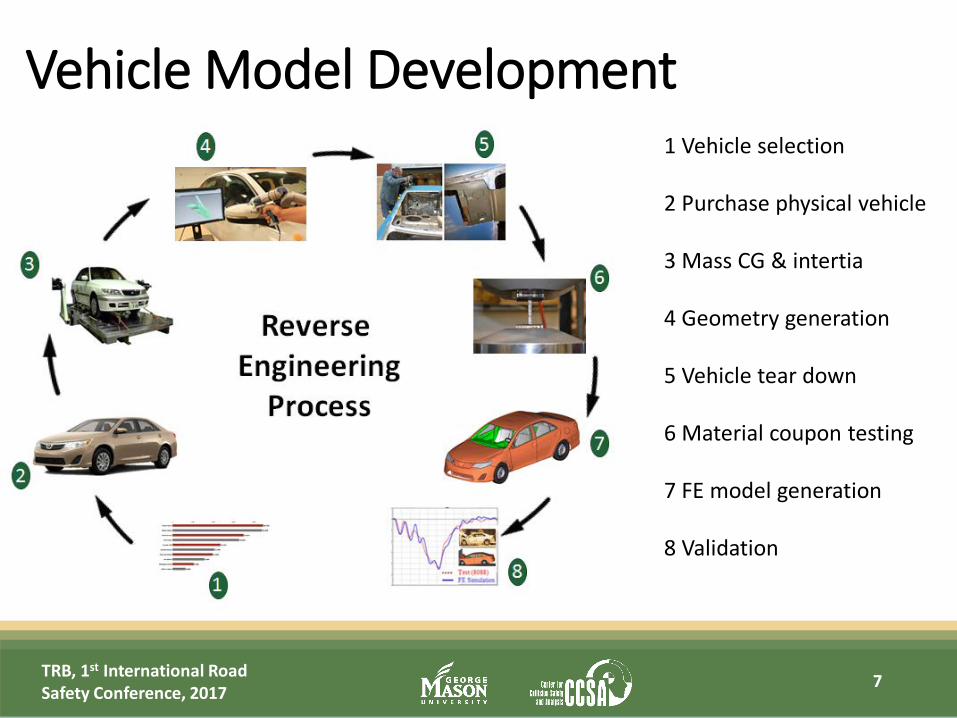
Vehicle Model Development
7
1 Vehicle selection 2 Purchase physical vehicle 3 Mass CG & intertia 4 Geometry generation 5 Vehicle tear down 6 Material coupon testing 7 FE model generation 8 Validation
TRB, 1st International Road Safety Conference, 2017
Left Oblique - Baseline Animation 1
8 TRB, 1st International Road Safety Conference, 2017
Left Oblique – Baseline 140ms
9 TRB, 1st International Road Safety Conference, 2017
Intrusion Toe-pan intrusion well captured
Vehicle and Barrier Pulse Acceleration well captured
Door Sill Deformation Moderate door sill deformation
Pulse and deformation
well captured
Left Oblique – Test vs Simulation
10 TRB, 1st International Road Safety Conference, 2017
Right Oblique – Animation 1
11 TRB, 1st International Road Safety Conference, 2017
Right Oblique – 140ms
12 TRB, 1st International Road Safety Conference, 2017
Intrusion Toe-pan intrusion reasonably well captured
Vehicle and Barrier Pulse Acceleration well captured
Door Sill Deformation Moderate door sill deformation
Pulse and deformation well captured
Right Oblique – Test vs. Simulation
13 TRB, 1st International Road Safety Conference, 2017
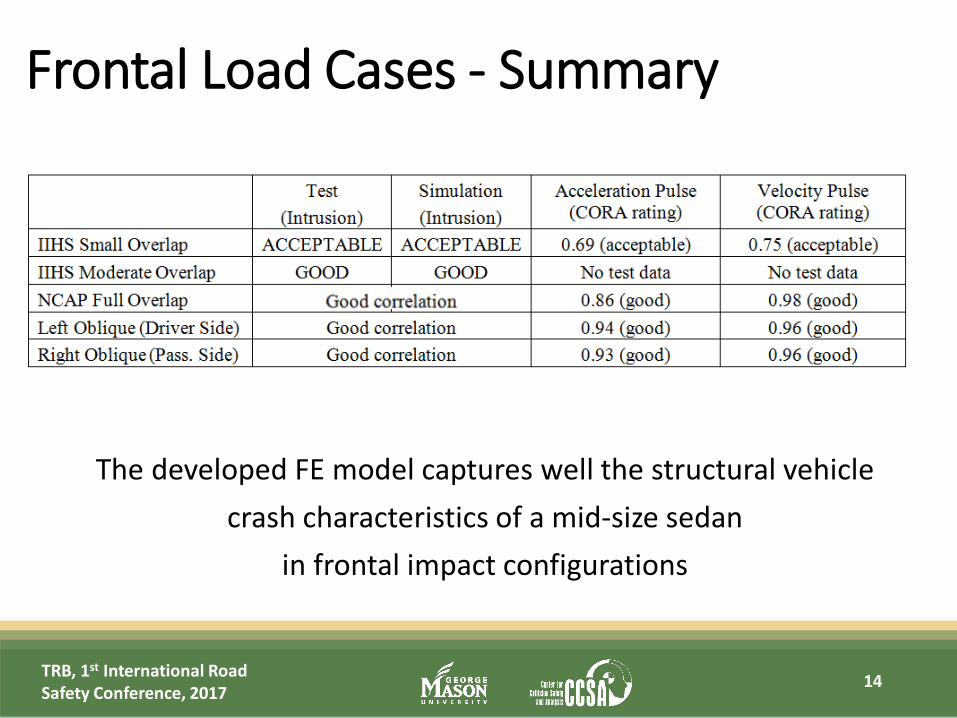
Frontal Load Cases - Summary
14
The developed FE model captures well the structural vehicle crash characteristics of a mid-size sedan
in frontal impact configurations
TRB, 1st International Road Safety Conference, 2017
SINCAP 62km/h - Animation
15 TRB, 1st International Road Safety Conference, 2017
SINCAP 62km/h – 140ms
16 TRB, 1st International Road Safety Conference, 2017
SINCAP 62km/h - Results
17
Vehicle Kinematics and Pulse Similar overall vehicle kinematics CORA-Rating: 0.92
Vehicle Damage Comparison Post crash intrusion measurements at 5 different heights
compare well in test and simulation
TRB, 1st International Road Safety Conference, 2017
Side Oblique Pole 32 km/h - Animation
18 TRB, 1st International Road Safety Conference, 2017
Side Oblique Pole 32 km/h – 140ms
19 TRB, 1st International Road Safety Conference, 2017
Side Oblique Pole 32 km/h - Results
20
Vehicle Damage Comparison Post crash intrusion measurements at 5 different heights (sill top, occupant hip point, mid door, window sill, and window top) compare well in test and simulation
TRB, 1st International Road Safety Conference, 2017
IIHS Side Impact 50km/h - Animation
21 TRB, 1st International Road Safety Conference, 2017
IIHS Side Impact 50km/h – 140ms
22 TRB, 1st International Road Safety Conference, 2017