Comparison of In-State and Out-State Tuition of Big Ten Colleges Mikal William Nelson, B.S. April 27, 2017 Table of Data School In-State Tuition Out-State Tuition Penn State $34, 506 $47, 456 Wisconsin $24, 475 $40, 725 Nebraska $22, 625 $36, 545 Indiana $24, 417 $47, 270 Maryland $24, 214 $44, 507 Rutgers $29, 875 $44, 653 Illinois $29, 568 $44, 194 Ohio State $23, 589 $40, 089 Northwestern $65, 844 $65, 844 Minnesota $25, 740 $32, 990 Iowa $20, 861 $40, 191 Michigan $26, 834 $55, 254 Purdue $23, 322 $42, 124 Michigan State $25, 286 $47, 051 In-State Tuition Analysis Measures of Center • Mean: $28, 654 • Median: $24, 880.50 • Mode: None Looking at the histogram and box plot below, we can deduce that the best measure of center for this data set would be the Median. There is no Mode for the In-State Tuition data set and the Mean is influenced too much by the outlier of Northwestern to be an accurate measure of center for the data set. 5 Number Summary • Minimum: $20, 861 • Lower Quartile (Q1): $23, 589 1
Transcript
Comparison of In-State and Out-State Tuition of Big TenColleges
Mikal William Nelson, B.S.
April 27, 2017
Table of Data
School In-State Tuition Out-State Tuition
Penn State $34, 506 $47, 456Wisconsin $24, 475 $40, 725Nebraska $22, 625 $36, 545Indiana $24, 417 $47, 270
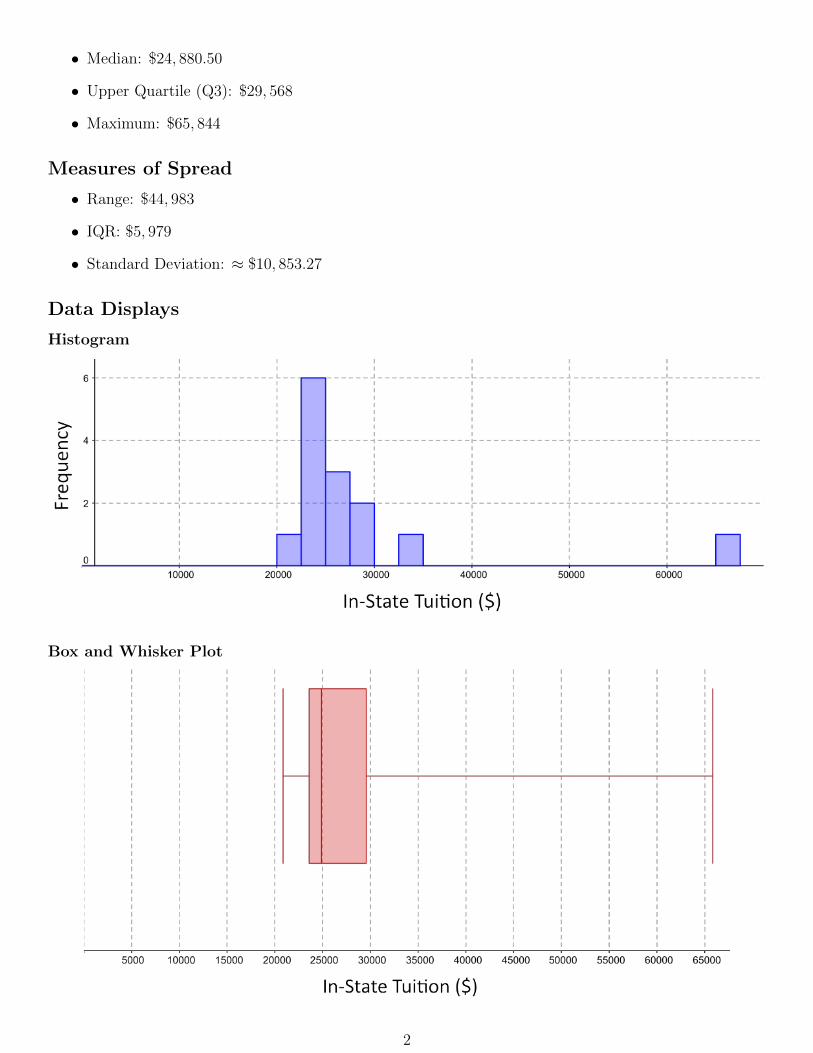
Looking at the histogram and box plot below, we can deduce that the best measure of center for thisdata set would be the Median. There is no Mode for the In-State Tuition data set and the Mean isinfluenced too much by the outlier of Northwestern to be an accurate measure of center for the data set.
5 Number Summary
• Minimum: $20, 861
• Lower Quartile (Q1): $23, 589
1
• Median: $24, 880.50
• Upper Quartile (Q3): $29, 568
• Maximum: $65, 844
Measures of Spread
• Range: $44, 983
• IQR: $5, 979
• Standard Deviation: ≈ $10, 853.27
Data Displays
Histogram
Box and Whisker Plot
2
Outliers
1.5(IQR) = 1.5(5979) = 8968.5
Lower Outliers
Q1 − 1.5(IQR) = 23589 − 8968.5 = 14620.5
Any lower outliers would have to lie below $14, 620.50. We do not have any data points who lie below thislimit, so there are no lower outliers.
Upper Outliers
Q3 + 1.5(IQR) = 29568 + 8968.5 = 38536.5
Any upper outliers would have to be above $38, 536.50. We have on data point which lies above this limit,Northwestern. Therefore Northwestern is an upper outlier.
Analysis
The in-state tuition is skewed and not particularly normal, especially when we include the outlier ofNorthwestern at $65, 844.
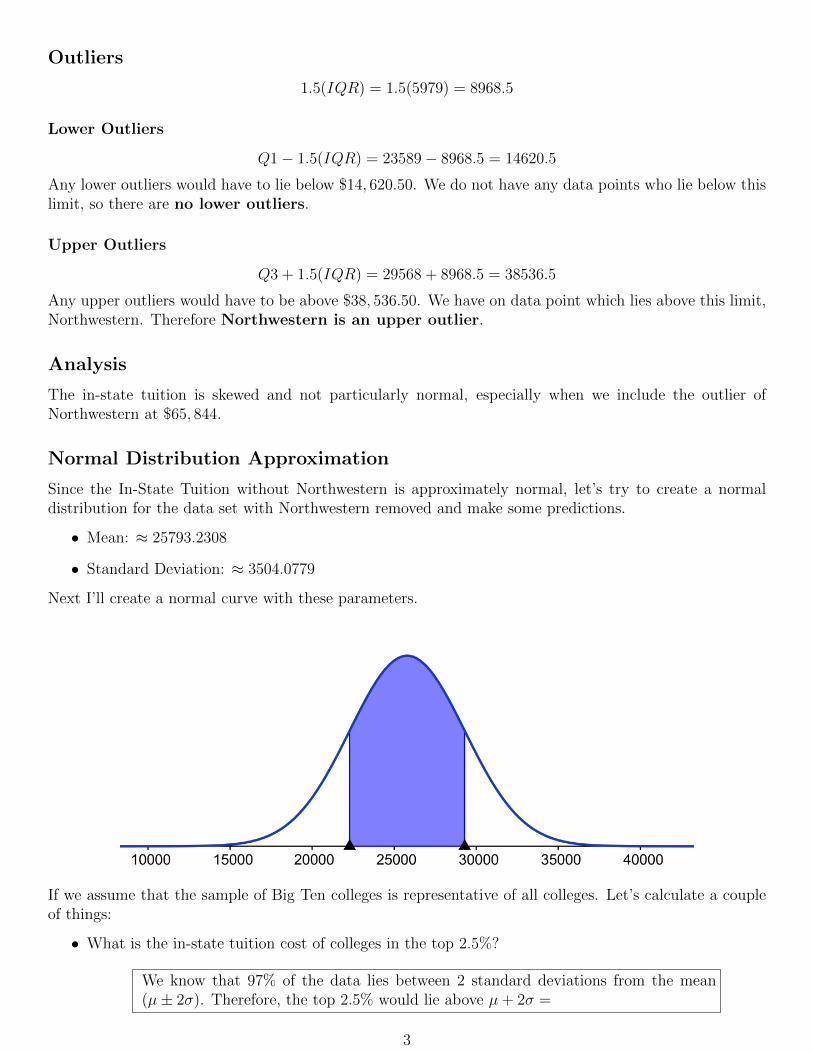
Normal Distribution Approximation
Since the In-State Tuition without Northwestern is approximately normal, let’s try to create a normaldistribution for the data set with Northwestern removed and make some predictions.
• Mean: ≈ 25793.2308
• Standard Deviation: ≈ 3504.0779
Next I’ll create a normal curve with these parameters.
If we assume that the sample of Big Ten colleges is representative of all colleges. Let’s calculate a coupleof things:
• What is the in-state tuition cost of colleges in the top 2.5%?
We know that 97% of the data lies between 2 standard deviations from the mean(µ± 2σ). Therefore, the top 2.5% would lie above µ+ 2σ =
3
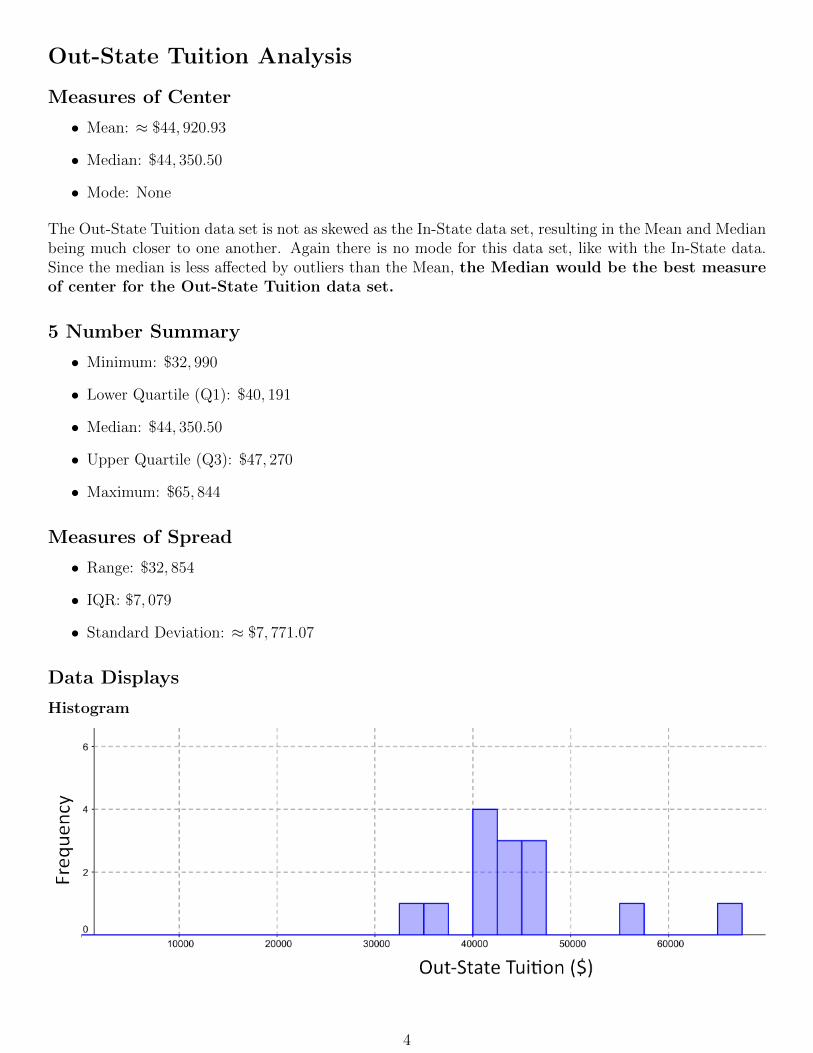
Out-State Tuition Analysis
Measures of Center
• Mean: ≈ $44, 920.93
• Median: $44, 350.50
• Mode: None
The Out-State Tuition data set is not as skewed as the In-State data set, resulting in the Mean and Medianbeing much closer to one another. Again there is no mode for this data set, like with the In-State data.Since the median is less affected by outliers than the Mean, the Median would be the best measureof center for the Out-State Tuition data set.
5 Number Summary
• Minimum: $32, 990
• Lower Quartile (Q1): $40, 191
• Median: $44, 350.50
• Upper Quartile (Q3): $47, 270
• Maximum: $65, 844
Measures of Spread
• Range: $32, 854
• IQR: $7, 079
• Standard Deviation: ≈ $7, 771.07
Data Displays
Histogram
4
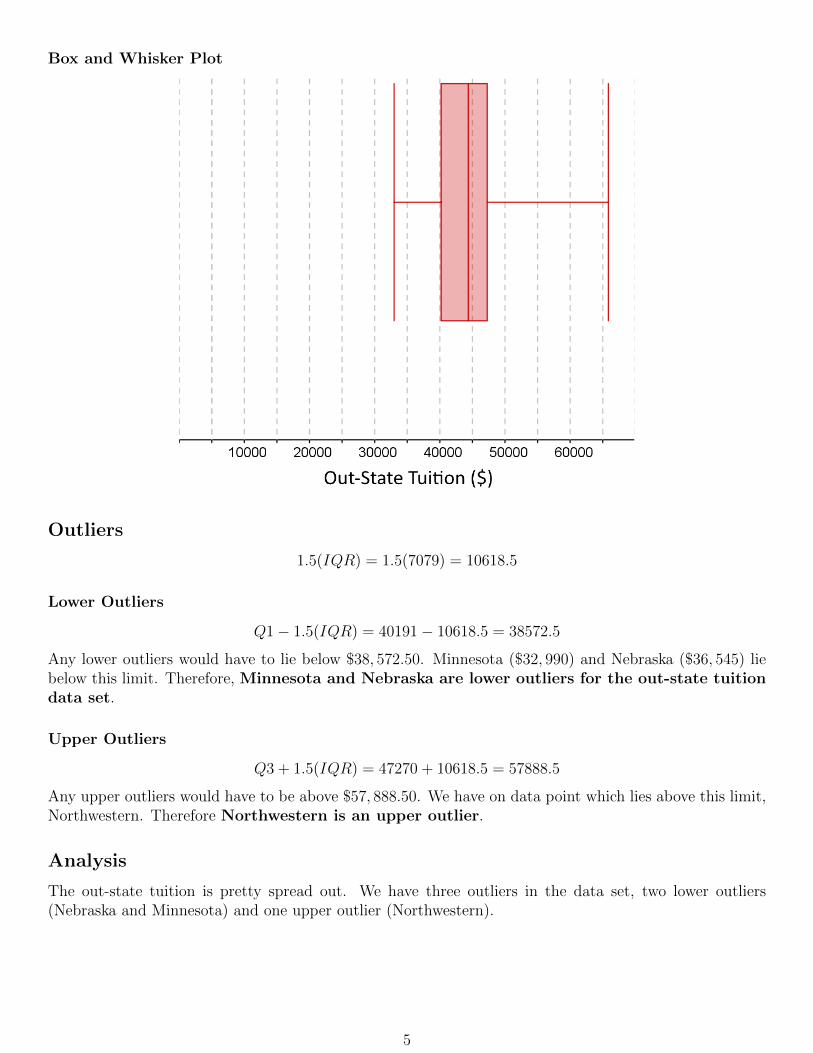
Box and Whisker Plot
Outliers
1.5(IQR) = 1.5(7079) = 10618.5
Lower Outliers
Q1 − 1.5(IQR) = 40191 − 10618.5 = 38572.5
Any lower outliers would have to lie below $38, 572.50. Minnesota ($32, 990) and Nebraska ($36, 545) liebelow this limit. Therefore, Minnesota and Nebraska are lower outliers for the out-state tuitiondata set.
Upper Outliers
Q3 + 1.5(IQR) = 47270 + 10618.5 = 57888.5
Any upper outliers would have to be above $57, 888.50. We have on data point which lies above this limit,Northwestern. Therefore Northwestern is an upper outlier.
Analysis
The out-state tuition is pretty spread out. We have three outliers in the data set, two lower outliers(Nebraska and Minnesota) and one upper outlier (Northwestern).
5
Comparison of In-State and Out-State Tuition
Parallel Box and Whisker Plots
Scatterplot with Linear Regression Line
6
The correlation coefficient for the regression line is r ≈ 0.7935.
Analysis
The out-state tuition is clearly higher than the in-state tuition costs for Big Ten colleges. We can see fromthe boxplots that the minimum value for out-state tuition is higher than 75% of the in-state data becausethe minimum value is greater than the upper quartile of the in-state data.
The correlation coefficient is about 0.7935, so the in-state and out-state tuitions are moderately posi-tively correlated. This tells us that, for the most part, as in-state tuition increases, so does out-statetuition. The obvious exception is Northwestern, which has the same in and out-state tuition costs.