Page 1
Ithaca CollegeDigital Commons @ IC
Ithaca College Theses
1993
Comparison of leadership styles and team cohesionRhonda A. FaunceIthaca College
Follow this and additional works at: http://digitalcommons.ithaca.edu/ic_theses
Part of the Sports Sciences Commons
This Thesis is brought to you for free and open access by Digital Commons @ IC. It has been accepted for inclusion in Ithaca College Theses by anauthorized administrator of Digital Commons @ IC.
Recommended CitationFaunce, Rhonda A., "Comparison of leadership styles and team cohesion" (1993). Ithaca College Theses. Paper 83.
Page 2
COMPARISON OF LEADERSHIP STYLES
AND TEAM COHESION
by
Rhonda A. Faunce
An Abstract
of a thesis submitted in partial fulfillment
of the requirements for the degree of
Master of Science in the Division
of Health, Physical Education,
and Recreation at
fthaca College
September 1993
Thesis Advisor: Dr. A. Craig Fisher
Page 3
ABSTRACT
This study investigated the relationship between
perceived levels of team cohesion of sectional softball
teams and perceived leadership qualities of coaches of
the same teams. Female hiqh school players (N = 93)
completed the Leadership Scale for Sports (r,SS),
comprising training and instruction (trinst),
democratie behavior (oem), autocratic behavior (Auto),
social support behavior (Socs), and positive feedbaek
behavior (neward). Subjects also completed the Group
Environment Questionnaire (GEQ), which categorizes
attraction to the task (ATGTask) and social aspects of
the group (atcsocial), as well as feelings of task
(GITask) and social unity (ctsocial). Pearson
product-moment correlation eoefficients revealed a high
relationship between Socs and GISocial and a low
relationship between GITask and Auto. Moderate
correlations were found between Trinst and all four
perceived cohesion categories. Multip1e regression of
the leadership predictor variables on perceived cohesion
revealed that, the variable Trinst was a significant
predictor in all four equations. The predictor
variables of Auto and Socs were also found significant
with GITask and GfSocial, respectively. Canonical
Page 4
correlation analysis revealed the following profile as
the best predictor of the existing levels of high
GISocial, moderately high ATGTask and ATGSociaI, and
low GfTask: Higrh Trinst, moderately high Socs,
moderately low Reward, and very low Dem and Auto. It,
was concluded that all five leadership behaviors are
related situationally to task and social cohesion.
Page 5
COMPARISON OF LEADERSHIP STYLES
AND TEAM COHES10N
Thesis Presented to the Faculty of
the Division of Health, Physical
Education, and Recreation
Ithaca College
In Partial Fulfillment of the
Requirements for the Degree
Master of Science
by
Rhonda A. Faunce
September 1993
Page 6
CERTIFICATE OF APPROVAL
MASTER OF SCIENCE THESIS
This is to certify that the Master of Science Thesis of
Rhonda A. Faunce
submitted in partial fulfillment of the requirementsfor the degree of Master of Science in the Division ofHealth, Physical Education, and Recreation at fthacaCollege has been approved.
Division of
Thes■ s Adv■ sor:
Comm■ ttee Member:
Candidate:
Cha■ rman′ GraduatePrograms ■n Phys■ ca■
Education:
Dean of GraduateStudies:
Date:
fthaca CollegeHealth, Physical Education,
fthaca, New Yorkand Recreation
Page 7
ACKNOWLEDGMENTS
The investigator would tife to thank everyone
involved in the completion of this study:
1. To Dr. Pat Frye for the great amounts of
timer pBtience, and support given to me throughout the
data portion of this thesis.
2. To Dr. A. Craig Fisher, AY thesis advisor, for
the tlme and guidance given through t,he years involved
in nriting this thesis.
3. To ny friends for staying behind me and always
pushing.
4. To my fanily, especially my parents, for the
opportunities and love they have given me'
5. To Dr. Beth McManis for rediseovering my
statistical programs and working them out '
6. To Jakie for aluays giving me a reason to
smi1e.
―■
●■
Page 8
TABLE OF CONTENTS
Page
■■
Vユ
ACKNOWLEDGMENTS
LIST OF TABLES
chapter
1.
Scope of Problem
Statement of Problem
Hypothesis
AssumPtions of StudY
Definition of Terms
Delimitations of StudY
LimitatiOns Of Study .
REVIEW OF LITERATURE . 0 ・ ・ 。 ・ ・ ° ・ °
cohes■ on Defined ・ ・ ・ ・ 。 ・ 。 ・ 。 ・ ・
The AsSesSment Of COhesion in Sport ・
cOach― Ath■ete Re■ atiOnships 。 ・ 。 ・ ・
Importance Of Leadership tO COhesion .
summary . . ・ ・ 。 ・ 。 ・ ・ ・ ・ ・ ・ ・ ・
METHODS AND PROCEDURES
Se■ ectiOn of SubjectS
Testing Instruments
Methods of Data Collection
2.
1
3
4
4
5
5
7
7
8
8
10
13
15
19
22
22
22
24
3.
■■■
Page 9
Chapter
5.
Summary
4. ANALYSIS OF DATA . .
Intercorre■ ations of the Leadership
DimenS■ ons and Cohes■ on Categor■ es .
Multip■ e Regression Analyses . . . . .
ATGTask . . . . . . ● ● ● ● ・ ● ● ・
ATGSocia■ . . . . . ・ ・ ・ ・ ・ ・ ・ ・
GITask . . . . 。 ・ ・ ・ ・ ・ ● ● ● ● ・
GISocial . . . . . . . . ・ ・ ・ ・ ・ ・
canon■ ca■ Correlation Ana■ ys■ s of
Leadership Dimensions and
Scoring of
Treatment
Data
of Data
Page
25
25
26
27
27
29
32
32
32
32
40
40
42
Cohes■ on Categor■ es
summary . . . . . .
DISCUSSION OF RESULTS
Intercorrelations of the Leadership
Dimensions and Cohesion Categories
Multiple Regression AnalYsis of
4
7
3
3
33
37
Leadershi
ATGSOcia■
ATGTask
ATGSOcia■
p Dimensions on. ATGTask,
, GfTask, and GISocial
■V
Page 10
Chapter
APPENDIXES
A. LEADERSHIP SCALE FOR SPORTS . .
B. GROUP ENVIRONMENT QUESTIONNAIRE
C. INFORMED CONSENT FORM: ATHLETES
Do RECRUITMENT LETTER TO COACHES .
REFERENCES
Page
GITask 46
GISociaI 48
Canonical Correlation of Leadership
6.
and Cohesion Variables
Summary . . . . . . ・ 。 ・ ・ ・ ・ ・ ・ ・
SUMMARY′ CONCLUS10NS′ AND RECOMMENDATIONS
Summary
Conclusions
Recommendations
50
52
56
56
58
58
60
64
67
69
71
Page 11
Tab■ e
LIST OF TABLES
Page
1. fntercorrelations of Leadership
Dimensions and Cohesion Categories 28
2. Multiple Regression of Leadership
Dimensions on Cohesion Categories 30
3. Canonical Loadings for the Leadership
( Predictor )
Variables
and Cohesion (criterion)
35
v1
Page 12
Chapter 1
INTRODUCTION
Cohesion, a somewhat controversial issue, has been
a topic of steady interest to sport psychologists
for yearsr /et gray areas stil1 exist- Results of
studies have shown evidence for and against the
importance of cohesion in sportt let its benefits, if
drrlr sti11 remain equivocal. Even though equivocity
is present, it is a commonly held belief by many sport
psychologists and coaches of team sports that cohesion
is an important factor in team success.
One of the earliest definitions of cohesion, and
one still accepted today, is Landers and Luschen's
(1974) Aefinition of cohesion: Cohesion is the result
of all situations or forces that influence the members
to remain in the group. Expanding on the above
definition, Widmeyer, Brawley, and Carron (1985)
ldentified a great number of factors suspected to lead
to group cohesion and grouped them into the following
three caLegories: (a) characteristics of the group
members, (b) characteristics of the group, and
(c) situations experienced by the group. Under these
three categories most forces or situations that lead to
group cohesion can be categorized. Thus, their
Page 13
2
suggestion is that any leader who hopes to foster
cohesion in his,/her group can do so by (a) selecting
members with certain qualities, (b) fostering certain
conditions within the group, and/or (c) providing
certain experiences for the group. widmeyer et a1.'s
research clarifies that the leader of a group can be
highlyresponsibleforthedegreeofcohesionpresent
in that grouP.
Leaders (coaches) come in many shapes and forms,
and this raises the question of coaching styles. Many
researchers state that there is no one best style of
leadership and the most appropriate leadership style
for a coach varies with the situation (Anshel' 1990;
Mountjoy, 1980). Straub's (1978) research supports
this perspective when he claimed that different sport
groups require different types of leadership' What
the coach has to do is examine the situation and
determine what would be the best choice for the group'
Thus, from a cohesion standpoint, the coach needs to
act accordingly to enhance the team's unity' The
questionarises:Isthereastyleofcoachingthat
better develops and/or maintains cohesion?
Fromthepreviousclaimsofcohesion.simportance
insportandtheroletheleaderhasonsituationsthat
Page 14
3
affect cohesion, the relationship between cohesion and
leadership will be examined in this study. Self-report assessment devices for both cohesion and
leadership were administered to assess the relationship
between these variables.
Scope of Problem
This study examined the relationship of perceived
leadership behavior and perceived leve1s of cohesion.
Two self-report questionnaires uere administered to 93
female softball athletes from high school sectional
teams from various sections of New York.
Leadership behavior was measured using the
Leadership Scale for Sport (LSS) (Cfrefladurai & Saleh,
1980) (appendix A). The LSS consists of 40 statements
that, when answered by placing an rtxir in one of f ive
categories ranging from "always" to "never", identify
a perceived leadership type. The LSS comprises the
following leadership dimensions: (a) training and
instruction behavior, (b) democratic behavior,
(c) autocratic behavior, (d) social support behavior,
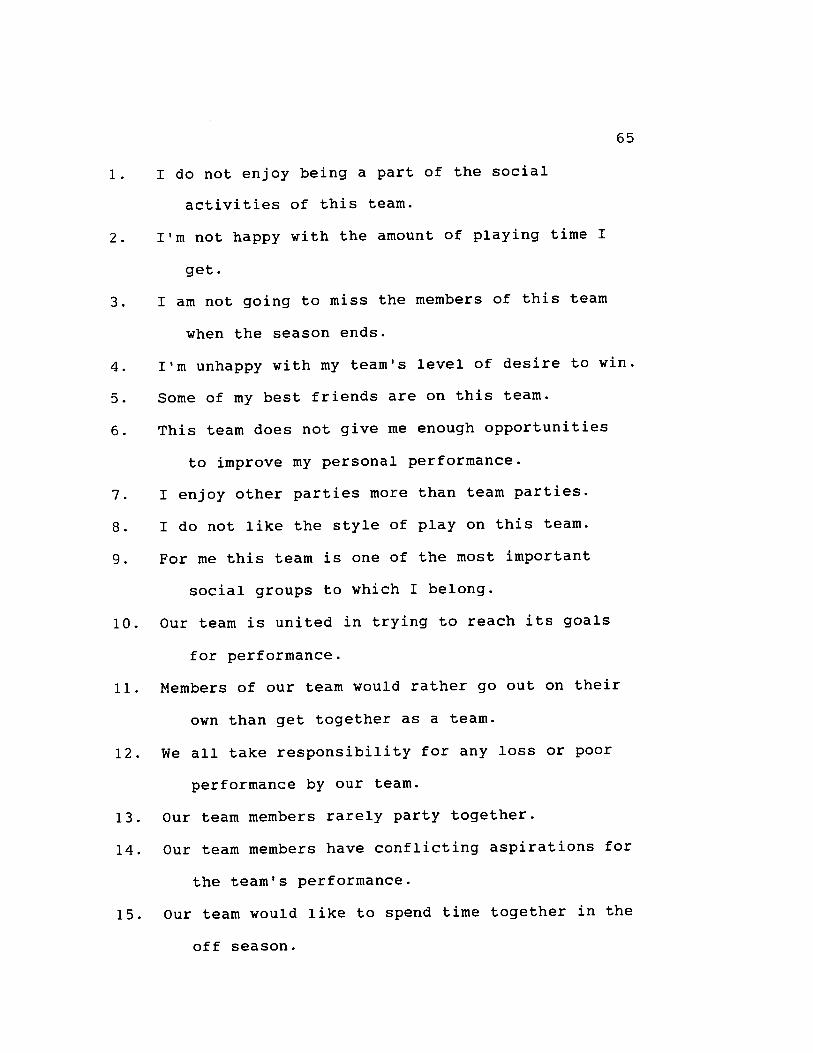
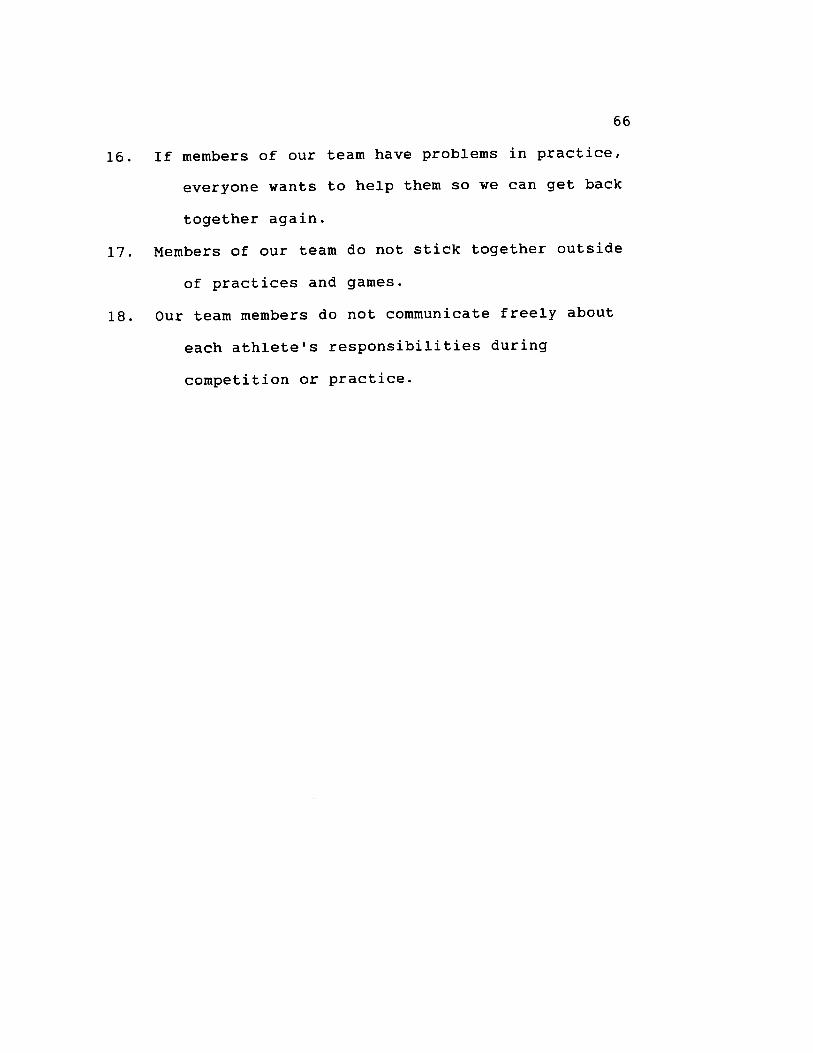
and (e) positive feedback behavior. Cohesion was
measured by the Group Environment Questionnaire (GEQ)
(widmeyer et ErI., 1985) (appendix B). The (cEQ) is a
1B-item instrument designed to assess perceptions of
Page 15
4
the cohesion present on athletic teams. The items of
the (CfQ ) are divided into the following four
categories: (a) individual attractions to the
group--task, (b) individual attractions to the
group--sociaI, (c) group integration--task, and
(d) group integration--social.
The data allowed for the examination of the
relationship between leadership styles and cohesion-
Data were subjected to Pearson product-moment
correlation, multiple regression, and canonical
correlation to assess the various relationships that
existed within the data-
Statement of Problem
The relationship bebween leadership behavior and
perceived levels of cohesion was investigated in this
study. Perceived levels of cohesion vere identified as
the four criterion variables while the five leadership
behaviors served as the predictor variables. The data
obtained from these measures were analyzed in an
attempt to answer the following question: Do
leadership styles relate to the level of athletes'
perceived team cohesion?
HvPothesis
Perceived cohesion can be predicted from
leadership stY1e.
Page 16
AssunBtions of StudY
The following assumptions lf,ere made for the
purposes of this studY:
1. Leadership behaviors are measured effectively
by the LSS.
2.Teamcohesionismeasuredeffect'ivelybythe
GEQ.
3. The athletes were able to relate to the
situations on the LSS and GEQ and gave honest replies'
4. Softball teams chosen for sectional
competition represent successful teams'
Definition of Terms
The following definitions clarify the meaning of
terms used in this investigation:
1. Traininq and Instruction Behavior (Trinst):
behavior of the coach aimed at improving the
performance of the athletes by emphasizing and
facilitating hard and strenuous training, by
instructing them in the ski1ls, techniques, and tactics
of the sport; by clarifying the relationship among the
members; and by strucLuring and coordinating the
activities of the members.
2. Democratic Behavior (oem): behavior of the
coach that allows greater participation by the
Page 17
6
athletes in decisions pertaining to group goa1s,
practice methods, and game tactics and strategies.
3. Autocratic Behavior (auto): behavior of the
coach that involves independence in decision making
and that stresses personal authority.
4. Social Support Behavior (Socs): behavior of
the coach characterized by a concern for individual
athlet,es, for their welfare, for positive group
atmosphere, and for warm interpersonal relations with
members.
5. Rewardinq (Positive Feedback) Behavior
(neward): behavior of the coach that includes
providing reinforcement for an at,hlete by recognizLng
and rewarding good Performance.
6. Sectional Softball Team: team that has over a
.500 win/toss record and is selected to compete within
its section of New York State for a championship'
7. Group Inteqration--Task (eltasx): individual
team member's feelings about the similarity, cloSeness,
and bonding within the team as a whole around the
group' s task.
B. Group Inteqration--Socia1 (CtSociat ) :
individual team member's feelings about the similarity,
closeness, and bonding within the team as a whole
around the group as a social unit.
Page 18
ions to
(ATGTask) : individual team member's
personal involvement nith the group
goals, and objectives.
(atesocial ) : individual team member's
personal involvement, acceptance, and
interact,ion with the grouP.
feelings about
task, productivity,
10. Individual AttractionQ to Group― ―S
feelings about
social
The
study:
1.
ath■ etic
2.
GEQ′ a
3.
LSS′ a
De■ imitations of Study
fo■ 10Wing were the delimitations of thiS
This study involved only high school female
teams (N = 11) in New York State.
Team cohesiveness was measured only by the
self-report assessment tool.
Leadership behaviors were assessed only by the
self-report assessment too1.
Limit,ations of Studv
procedures necessitated the following limitations.
1. The results of this study can only be
generalized to female softball athletes who are
considered similar to the athletes in this study'
2. Leadership styles and cohesion were examined
only within the confines of the definitions provided
and the tests administered.
Page 19
Chapter 2
REVIEW OF LITERATURE
The review of literature related to this study
focuses on the following areas: cohesion defined, the
assessment of cohesion in sport, coach-athlete
relationships, importance of leadership to cohesion,
and summary.
Cohesion Defined
The term cohesion is one t,hat cannot be easity
defined by a simple one-sentence definition due to itsgreat complexity and lack of specificity. The most
widely used definition or one most other definitions
were derived from is that of Festinger, Schachter, and
Back (1950). They described cohesion as t,he resultant
forces that act on members to stay in a group.
Cartwright (1968), in his early studies, suggested t,hat
these forces all had to do with interpersonal
attraction.
Most early research on cohesion focused on
interpersonal attraction. Shaw's ( 1971 ) research,
however, suggests that cohesion consists of more than
interpersonat attraction among group members because
this stresses only individual attraction, yet cohesion
can be altered by other things like the number,
8
Page 20
9
strengLh, and pattern of attractions within the group.
Every qroup has its goals or objectives and these are
interwoven into the development of the group and result
in the members sticking together and remaining united
as a social unit.
Landers and Luschen {1974) supported Shaw's (1971)
research by suggesting that the forces and situations
that influence members to remain in the group can be
broken int,o two categories: (a) social cohesion--the
degree of attractiveness an individual has to the
group, and (b) task cohesion--the degree to which group
members pursue common goals. Through the need to
further distinguish between the individual and the
groupr Els well as between social and task concerns,
researchers began to do more extensive studies.
Widmeyer et aI. (1985) supported Landers and Luschen's
research that implied cohesion can be altered by
social, task, individual, ot group situations and
developed four cohesion constructs they believed
covered alt areas. The constructs are group
integration to the taskr group integration to social
concerns, individual attraction to the group because of
the task, and individual attraction to the group for
social concerns. The development of the constructs by
Page 21
10
Widmeyer et a1. are those used by contemporary
researchers to study cohesion because they are believed
to address the major categories that comprise cohesion.
The Assessment of Cohesion in Sport
The importance of cohesion has been a subject of
sport research for many years, based on the belief
that cohesion is necessary for team success (Bird,
t977a; Carron, 1993; Gi11, L9'78; Widmeyer & Martens,
tg78; Widmeyer et al., 1985; Williams & Widmeyer, 1991)
However, research does not totally support this
commonly held cohesion-performance relationship. For
example, Lenk's (1969) study showed that team cohesion
was not necessary for an Olympic crew team. Fiedler
(1954), using basketball teams, and McGrath (1962),
using rifle teams, also found a negative relationship
between team success and cohesion. Even though there
is evidence of a negative retationship and even a
negligible relationship in some studies, most cohesion
researchers still tend to support a positive
relationship.
In 1978, Widmeyer and
evidence in the defense of
to groups. TheY suggested
teams do not have to sPend
Martens unveiled convincing
the importance of cohesion
the following: (a) cohesive
a great deal of time on
Page 22
11
group maintenanc€r therefore, more time can be spent
on task performance; (b) members of a team who are
attracted to that group will work harder to achieve
the group's goals; (c) the great communication that
appears in cohesive groups will improve that quality
of performance; and (d) cohesive teams show more of a
willingness to interact than do noncohesive teams. In
rebuttal to Widmeyer and Martens' last point, GilI
(1978) and Carron (1984) both found that teams with a
great deal of cohesion may not perform as well aS teams
with l-ess cohesion because individual members may ]et
the striving for group maintenance get in the vay of
the task performance. Even though the findings are
equivocal, it has been argued that the better conducted
studies general-ly demonstrate a positive relationship
between cohesion and performance. In fact, the more
recent research has not been concerned with whether
cohesion contributes to performance but rather with
the degree to which it contributes to performance
(widmeyer & Mart€Its, 1978) and with identifying
variables that might mediate the cohesion-performance
relationship (e.g., leadership) (Carron & Chelladuf?i,
1eB1).
Page 23
l2
In research on task demands of a sport team,
reviewers of cohesion research typically conclude that
the cohesion-performance relationship is positive in
interacting teams but negative or non-existent in
coacting teams (Carron, 1993; Gilt, 1978). In
interacting sports, success depends upon appropriatety
combining each player's diverse ski1ls in an
interdependent pattern of teamwork (e.g., baslcetball).
In coacting sports, players independently perform the
same skills, and team suceess is determined by the sum
of individual performances (e.9., golf) (Williams &
Widmeyer, 1991). The reason for the different results
between interacting and coacting sports is as follows:
cooperative tasks as in interactive sports facilitate
interaction that in turn leads to greater cohesion and
task performance. On the other hand, in coacting
sports cohesion is not necessarily a desirable
component because rivalry is thought to produce the
best performance in independent tasks. If an athlete
becomes too concerned vith the welfare and feelings of
coactors, this might detract from one's own
performance. Therefore, one would choose to develop
cohesion in interacting teams and not develop cohesion
in coacting teams (Carron, 1993).
Page 24
13
Coach-Athlete RelationshiPs
As indicated by Widmeyer et aI. (1985), leader-
member relat,ionships are important to the presence or
development of group cohesion. The leader-member
cohesion and performance relationship is quite complex
but should not be shied alray from by coaches and
leaders because of its importance- Throughout the
development of fitness and skills, attention must also
be focused on coach-athlete relationships in order to
achieve the best overall outcome of a group (Carron &
Chelladurai, 1981 ) .
It seems reasonable to assume that coaches have
the porrer to affect both team cohesion and
performance as far aS success or failure is concerned
by their leadership style (gira, L977b) - carron and
Chelladurai (1981) support Bird's position and
indicated which type of coaching style gets the best
results with various types of teams. They suggested
that, for teams with low amounts of cohesion, a task-
oriented leader is best. But for teams with pre-
existing cohesion, a leader who focuses on
interpersonal issues is best.
In 1980, Chelladurai and Saleh's interests in the
area of sport leadership led them to develop a
Page 25
14
leadership scale comprising of what they and past
researchers determined were the most important
dimensions of leadership behavior. The Leadership
Scale for Sports (LSS) consists of the following
dimensions: training and instruction behavior,
democratic behavior, autocratic behavior, social
support behavior, and positive feedback behavior- The
leadership scale was designed to analyze coaching
behavior by administering the questionnaire to
athletes.
Carron and Chelladurai ( 1981 ) suggested that the
nature of the coach-athlete relationship and its effect
on athletic performance is rrorthy of investigation
because (a) cohesion and leader-member compatibility
are similar and (b) both have apparent importance in
sport. Those environments where positive coach-athlete
relationships and team cohesion are found will likely
promote greater athlete satisfaction and more effective
performance. As is evident from the leadership
investigations, knoning how the athletes feel about
their leaders and their relationship to them may be
related to team cohesion and in the end team
performance (Cnerladurai & Saleh, 1980).
Page 26
15
Importance of Leadership to Cohesion
The problem of what constitutes the best
leadership style has long been a subject of controversy
and discussion among coaches, players, and the general
sporting public. As group leaders, coaches have been
traditionally characterized as disciplinarians,
enforcers of rigid rules, and impersonal in their
attitudes and treatment toward players (tutXo I
Richards , 7977).
In arriving at their definition of leadership,
Chelladurai and Saleh (1978) described it as the
behavioral process of influencing subordinates toward
organizational goals. Accepting the above definition,
the question then is not if leadership is important to
cohesion. There is support that leader-member
relationships are important to the development or
presence of group cohesion (e.9., Bird, L97'7b; widmeyer
et Erl., 1985). The question is, does knowing what type
of leadership works best for certain situations and
teams relate to cohesion and subseguently to
performance. The answer to the above question was
partially answered by Weiss and Friedrichs (1986) when
they discovered that, the coaching behaviors of
reinforcement, organization and control, encouragement
Page 27
16
when mistakes were made, and instruction when mistakes
were made were the most favored characteristics by
athletes to make them perform better. Carron and
chelladurai (1981) also offered some indication of
preferred leadership styles. In teams with lots
cohesion, they found that a leader who is task oriented
is best; but for teams with high cohesion, a leader who
is interpersonal with the members is best.
One of the problems with leadership research is
that most of the past studies have been done on
coaches' personality, coaches' behavior, coach-athlete
relationshipsr oE on trait and personality differences
amonlJ coaches or between coaehes and noncoaches. These
approaches ignored important considerations such as
situational factors or needs of the athlete (weiss &
Friedrichs, 1986).
Current research has attempted to identify
specific behaviors that are thought to be effective
for coaches. While certain behaviors have been
associated rrith desirable athletic outcomes, it is
apparent that situation differences (e.9., leve1s of
competition, dge of athletes, type of sport, gender)
mediate the effectiveness of these leader behaviors.
The vierr that leadership effectiveness is a funetion
Page 28
l7
of both situational and individual characteristics is
more credibte and has gained general acceptance in the
last few decades (chettadurai, 1984a; straub, 1978).
Fiedler's (1967 ) leadership theory was one of the
first published theories that utitized the contingency
approach. This approach to leadership suggests that
leader effectiveness is somehow situation specific and
that leader behaviors that are effective in one
situation may not be effective in another (Chelladurai,
1e84b).
Bird (7977b) examined the application of Fiedler's
leadership model to sport and speculated that the most
effective coaching Style, rather than coaching behavior,
requires flexibility according to the 1evel of skill or
competition. Chelladurai's studies with Carron and
Sa1eh (Cneftaaurai & Carron, 7978; Chelladurai & Saleh,
1978) introduced a leadership approach that focused on
the varying behaviors of the coach that are appropriate
to different athletic situations. After the
identification of behaviors, Chelladurai & SaIeh (1980)
proposed a multidimensional leadership model that
specifies that the coaching behavior should be
contingent upon the preferences of team members and the
particular situation.
Page 29
18
Because older leadership behavior questionnaires
dealt wit,h organizations other than sport, Chelladurai
and saleh (1980) took on the task of developing a sport-
specific inventory to deal with areas previous
inventories did not. Their efforts produced the LSS
in 1980. The LSS consists of one direct task factor
(trinst), two decision-style factors (oem and Auto),
and two motivational factors (Socs and Reward)'
Chelladurai and Saleh concluded that, although the
scale may not explain all of the total variance in
perceived leadership data, the LSS is a valuable t'ool
that has advantages over other instruments and can be
used profitably in the analysis of coaching behavior.
As is evident from the preceding paragraphs,
effective leadership does not depend solely on a set
of universal traits or behaviors. Rather, the
relationship between traits and behavior depends on the
situation. What is effective in one situation may not
be effective in another (chettaaurai, 1984a).
Chelladurai and Carron's (1978) leadership model and
Chelladurai and Saleh's leadership scale provide great
background for the study of situational leadership.
Yet, further research is always necessary because
leader-member relationships are very complex and because
Page 30
19
many factors can act on the behaviors of the group or
team leader to affect the environment (Weiss &
Friedrichs, 1986 ) .
Summary
Researchers have studied cohesion for many years
and have found it to be an important factor in team
success (sira, 1977a; Carron, 1993; widmeyer et a1.,
1985). Suggested effects of cohesion on groups range
from greater communication, which improves the quality
of performanC€r to having to spend less time on group
maintenance. Therefore, with more time to spend on
task performance, performance is improved.
Early research on cohesion indicated some
positive, some negative, and even negligibfe cohesion-
performance relationship results. However, the latest
research has not been concerned with whether cohesion
contributes to performance but rather with the degree
to which it contributes to performance (Widmeyer &
Martens , 7978) and with identifying variables that tend
to mediate the cohesion-performance relationship. An
additional point that must be mentioned is that most of
the literature on cohesion-performance outcomes
supports a positive relationship in interacting teams,
but a negative relationship in coacting teams (carron,
Page 31
20
1993; ci11, 1978 ) .
Supporting the evidence that cohesion is important
and has a positive impact on performance, Carron and
Chelladurai (1981) began to give attention to leader-
member and cohesion-performance relationships. They
claimed that the nature of coach-athlete relationships
was worthy of investigation because cohesion and
coach-member compatibility are similar and both have
importance in sport. They further argued that those
environments in which positive coach-athlete
relationships and team cohesion are found will likeIyshow greater athlete satisfaction and more effectiveperformance.
Another variable with relevance to sport
performance is leadership behavior. Chelladurai (1984b)
stated the coach, the person in the most powerful
position on the team, has the greatest influence on
establishing team climate, thus making the role the
leader plays a great one. Early research focused on
personality traits due to the belief Lhat great leaders
are born not made. However, later research began to
focus on leader behaviors and situations with the
inception of Fiedler's (1967) and other theories of
leadership. What was uncovered in the latest research
Page 32
2t
is that, while certain behaviors have been found to be
associated with desirable athlet,ic outcomes, it is
apparent that situation differences (e.9. levels of
competition, d9€ of the athlete, type of sport, gender)
mediate the effectiveness of these leader behaviors.
Leadership can take on many dimensions because there
are so many factors that can act on the team leader to
affect the environment. Therefore, lrhat behavior works
in one situation may not be effective in another. Any
leader will be most successful if he,/she analyzes the
situation and matches his/her behavior to fit the
circumstances.
Page 33
ChaPter 3
METHODS AND PROCEDURES
The following chapter outlines the methods and
procedures used in this investigation. selection of
subjects, testing instrumentsr methods of data
collection, scoring of data, treatment of data, and a
summary wilI be addressed.
Selection of Sub'iects
The subjects involved in this investigation (N =
93) were high school female varsity softball players of
sectional teams. Letters explaining this study were
initially sent to 160 New York state girls' varsity
softball coaches whose teams had qualified for sectional
competition. Sectional teams were chosen in an attempt
to have only successful teams participating in the
study. of the 160 teams initially chosen, 30 responded
and agreed to participate, but only 11 actually
completed the questionnaires and mailed back the
results. Of the 11 packets of results received, three
did not include results from all athletes on the team.
Testinq Instruments
The following tests were administered to the
subjects: the Leadership Sca1e for Sports (LSS)
(Cnettaaurai & Saleh, 1980) (Appendix A) and the Group
22
Page 34
23
Environment Questionnaire (GEQ) (widmeyer et a1', 1985)
(Appendix B).
The LSS consists of 40 items representing five
dimensions of leader behavior in sports ' A brief
description of the five dimensions is as follows: (a)
training and instruction behavior (Trinst)--behavior
of the coach aimed at improvement of performance,
emphasis is on hard and strenuous training; (b)
democratie behavior (Oem)--behavior of the coach that
allows participation of the athletes in decisions;
(c) autocratic behavior (auto)--behavior of the coach
that involves independence in making decisions,
personal authority is stressed; (d) social support
behavior (Socs)--behavior of the coach that involves
concerns for athletes' welfarer positive group
atmosphere, and interpersonal relations with members;
(e) rewarding behavior (Reward)--behavior by the coach
that provides reinforcement by recognizing and
rewarding good Performance.
The athletes responded to each item according to
how they perceived their coaches' behavior. For each
statement there were five Likert-type alternatives:
always (5), often (4), occasionally (3), seldom (2)'
and never ( 1 ) . The sum of the scores on the items in
Page 35
24
a dimension was divided by the number of items in that
dimension to derive the dimension score for a subject.
To assess the athletes, perception of their team's
cohesiveness, the GEQ was administered. The athletes
responded to eaeh item according to how they perceived
their team in that particular situation' The GEQ
consists of 18 statements, nine dealing with athletes'
personal involvement with the team and nine dealing
vith athletest perception of the team as a whole' A
9-item Likert-style response format nas used, ranging
from strongly disagree (1) to strongly agree (9)' The
GEQ is divided into the following four categories:
(a) group integration--task (GITask)--bonding within the
team as a nhole around the group's task; (b) group
integration--social (etsocial)--bonding within the team
as a whole around the group as a social unit; (c)
individual attractions to the group--task (etefasX)--
individual member's feelings about one's personal
involvement with the group task; (d) individual
attractions to the group--social (ATGSocial)--
individual member's feelings about one's personal
involvement with the grouP.
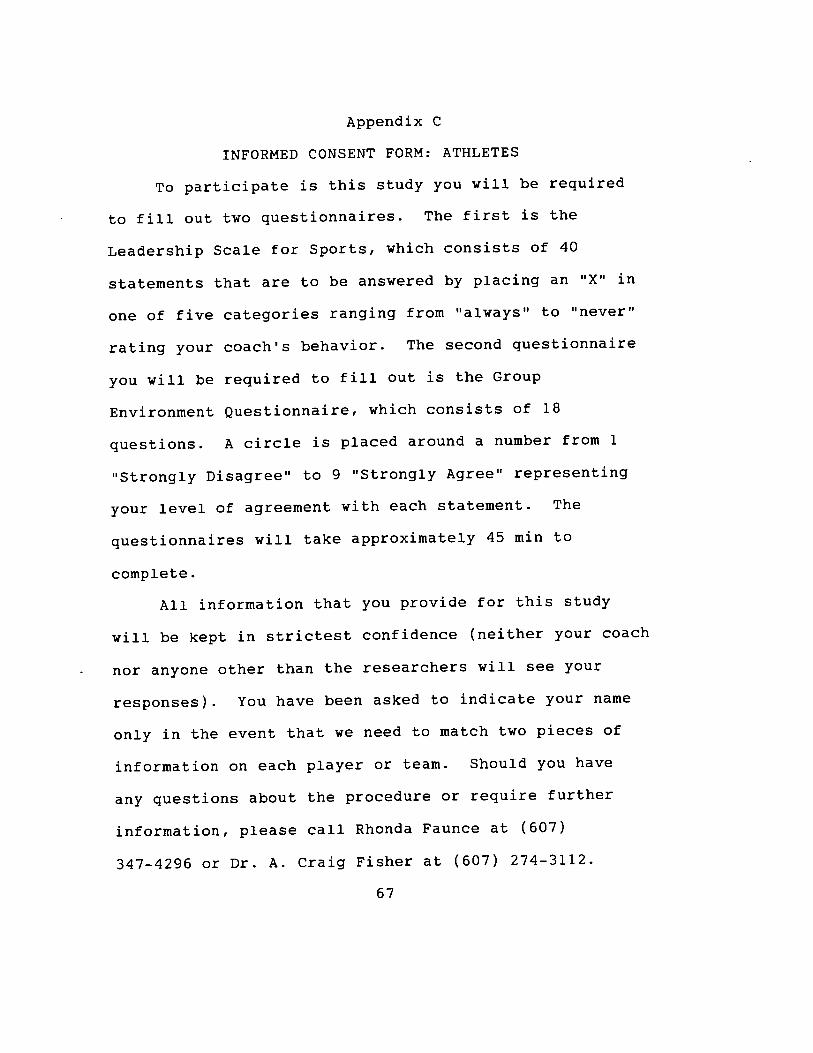
Methods of Data Collection
Each athlete received the following items:
Page 36
25
informed consent form, LSS, and GEQ. Athletes were
advised to complete the questionnaires as honestly as
possible. Because the data were collected through the
mail, the coach of each individual team administered
the tests in a group or on an individual basis. The
coaches were asked to explain the testing procedures
and to encourage a quick response rate. Upon
collecting the complete tests, the coach returned them
to the investigator. A11 data lfere collected between
May and July, 1988.
Scorinq of Data
The data from the athletes' LSS as well as the
data from the athletes' GEQ were transferred to
general purpose optical seanning sheets. The LSS was
transferred to a S-option scanning sheet. The
computer program was written so that, when the answer
sheets uere scanned, values were reversed in order to
match the correct point value of the response. The GEQ
\ilas transferred to a 1O-option scanning sheet, vhich
matched the guestionnaire's scoring method, So recoding
was not necessary. These data lrere then scanned onto
a VAX file for future analYsis.
Treatment of Data
The SPSS program was used for all analysis of data.
Page 37
26
To obtain a general overview of the interrelationships
among the nine variables, Pearson product-moment
correlation was used. Pearson correlations rrere
followed by multiple regression analysis of the five
leadership variables on the four cohesion variables,
respeetively. Canonical correlation was utilized to
assess the multivariate relationship between the
predictor variables (leadership) and the outcome
variables (cohesion). In all cases, the .05 level of
statistical significance was utilized-
Summarv
High school female varsity softball players
(N = 93) representing successful teams completed the
LSS and the GEQ. To assess interrelationships among
the nine variables, Pearson product-moment correlation
was used. Pearson correlations were followed by
multiple regression analysis of the five leadership
variables on the four cohesion variables, respectively-
Canonical correlation was utilized to assess the
multivariate relationship betneen the predictor
variables (leadership) and the outcome variables
(eohesion). In all cases, the .05 level of statistical
significance was utilized.
Page 38
Chapter 4
ANALYSIS OF DATA
The results of the investigation are presented in
this chapter. The chapter is divided into the
following sections: (a) intercorrelations of the
leadership dimensions and cohesion categories; (b)
multiple regression of the leadership dlmensions on
ATGTask, ATGSocial, GfTask, and GISocial, respectively,
(c) canonical correlation of the leadership dimensions
on cohesion categories; and (d) summary.
Intercorrelations of the Leadership Dimensions
and Cohesion Cateqories
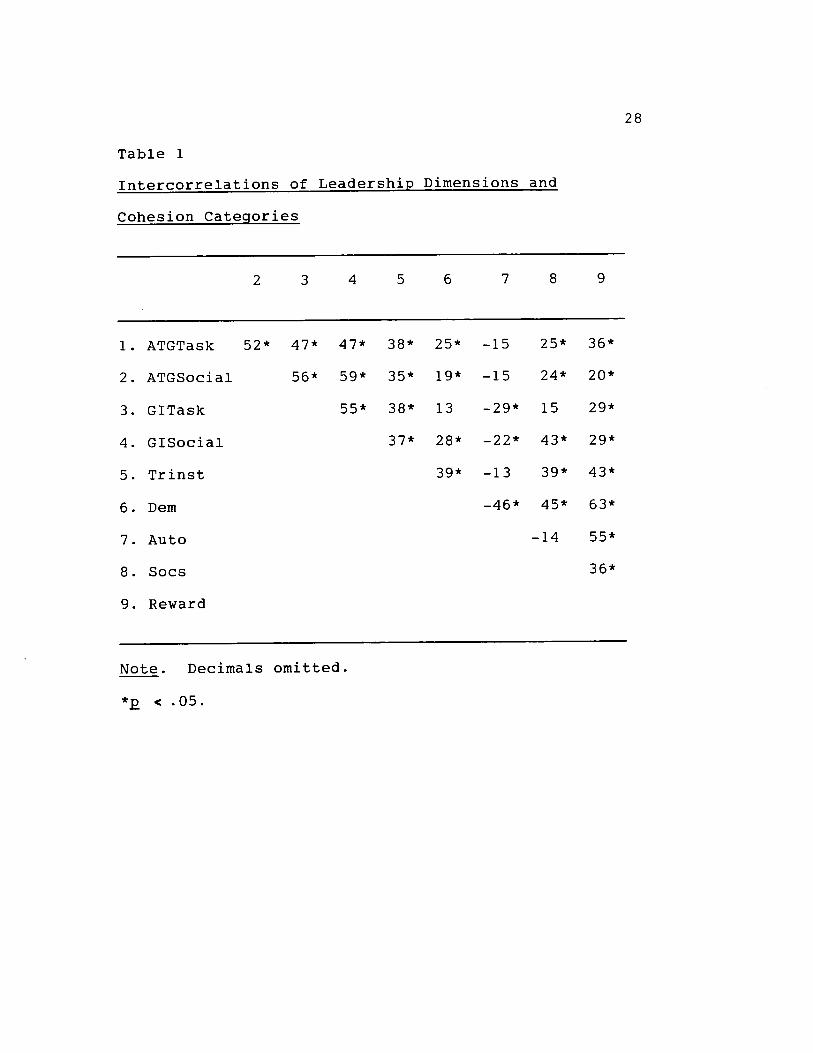
Pearson product-moment correlation assessed the
relationship among all variables. Pearson r values
ranged from a low of -.13 (euto with Trinst) to a high
of .63 (Reward vith Dem).
Results from Table 1 reveal moderate Pearson r
values between the cohesion categories ATGSocial and
GISocial, ! = .59; ATGSocial and GfTask, I = -56;
ATGTask and ATGSocial, L = '54; and ATGTask with
GlSocial and GITask, I = -47. Moderate I values were
also revealed between the leadership dimensions Dem and
Reward, L =.63; Auto and Rewardt | =.55; Dem and
Auto, L = .46i and Dem and Socs, L = -45.
27
Page 39
28
Table 1
Intercorrelations of Leadership Dimensions and
Cohesion Cateqories
7
1.
2.
3.
4.
5.
6.
7.
8.
9.
ATGTask 52★
ATGSocial
cITask
GISocia■
Tr■ nst
Dem
Auto
Socs
Reward
47★ 47★
56■ 59★
55■
38■ 25★
35' 19★
38' 13
37★ 28★
39★
-15 25★ 36★
-15 24★ 20★
-29■ 15 29■
-22' 43■ 29★
-13 39■ 43■
-46■ 45■ 63★
-14 55★
36★
Note. Decimals omitted.
*p < .05.
Page 40
29
Examination of the relationships between the
cohesion categories and the leadership dimensions
revealed the largest I value between Socs and GfSocial,
I = .43; and the smallest g value between GfTask and
Dem, I = .13.
Trinst showed moderate correlation with all
perceived cohesion categories, rs ranging from .35 to
.38. Slightly lower r values (.2O to .36) were found
between Reward and the cohesion categories '
The l0west correlations were found between the
variables of Auto and Dem and the four cohesion
categories with no correlation exceeding + ' 30 '
The remaining variable of socs shotred low to
moderate positive correlations with the four cohesion
categories. The r values ranged from '15 to '43'
Multiple Reqression Analvses
In order to assess the overall degree of
relationship between a set of predictor variables
(Trinst, Dem, Auto, Socs, and Reward) and a single
criterion measure of cohesion (ATGTask, ATGSocial,
GITask, and GISociaI, respectively), the SPSS stepwise
procedure of multiple regression was utilLzed. Values
from the multiple regression analyses can be found in
Table 2.
Page 41
30
Tab■ e 2
Mu■ ti
Cohesron Cateqories
ress■ on eadershi
Predictor Variables RsqCum t一
ATGTask
Tr■ nst
Reward
Socs
Dem
AutO
ATGSocia■
Tr■ nst
SocS
Auto
Reward
Dem
GITask
Trinst
Auto
Dem
Reward
Socs
.15
。19
。20
.20
.20
.13
.14
.15
。15
。15
2.323★
1.952
0.801
-0.398
0.098
2.709■
1。 026
-0.919
-0。 162
-0.160
3.455★
-2.523★
-1.700
0.663
0.290
(tab■ e cOntinues)
.15
.21
.23
.24
.24
Page 42
31
Predictor Variables RsqCum t一
GISocial
Socs
Trinst
Auto
Dem
Reward
.19
。24
.26
.26
.26
3.119★
2.080★
-1.286
-0.352
0.177
Note. ATGSocial = individual attractions to the
group--social. ATGTask = individual attractions to the
group--task. Gfsocial = group integration--socia1.
GITask = group integration--task. Auto = autocratic
behavior. Revard = rewarding behavior. Dem =
democratic behavior. Socs = social support behavior.
Trinst = training and instruction behavior.
*P < .05.
Page 43
32
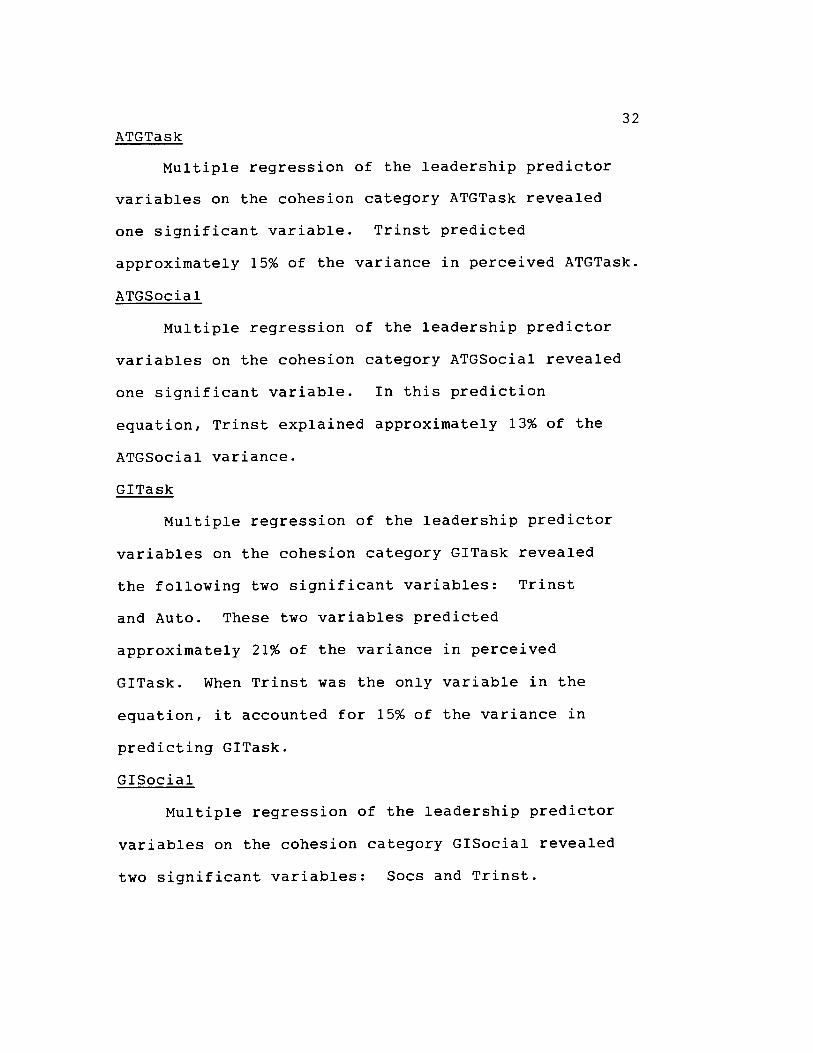
ATGTask
Multiple regression of the leadership predictor
variables on the cohesion category ATGTask revealed
one significant variable. Trinst predicted
approximately 15% of the variance in perceived ATGTask.
ATGSocial
Multiple regression of the leadership predictor
variables on the cohesion category ATGSocial revealed
one significant variable. In this prediction
eguation, Trinst explained approximately L3% ot the
ATGSocial variance.
GITask
Multiple regression of the leadership predictor
variables on the cohesion category GITask revealed
the following two significant variables: Trinst
and Auto. These two variables predicted
approximately 27% of the variance in perceived
GITask. When Trinst was the only variable in the
equation, it accounted for 15% of the variance in
predicting GITask.
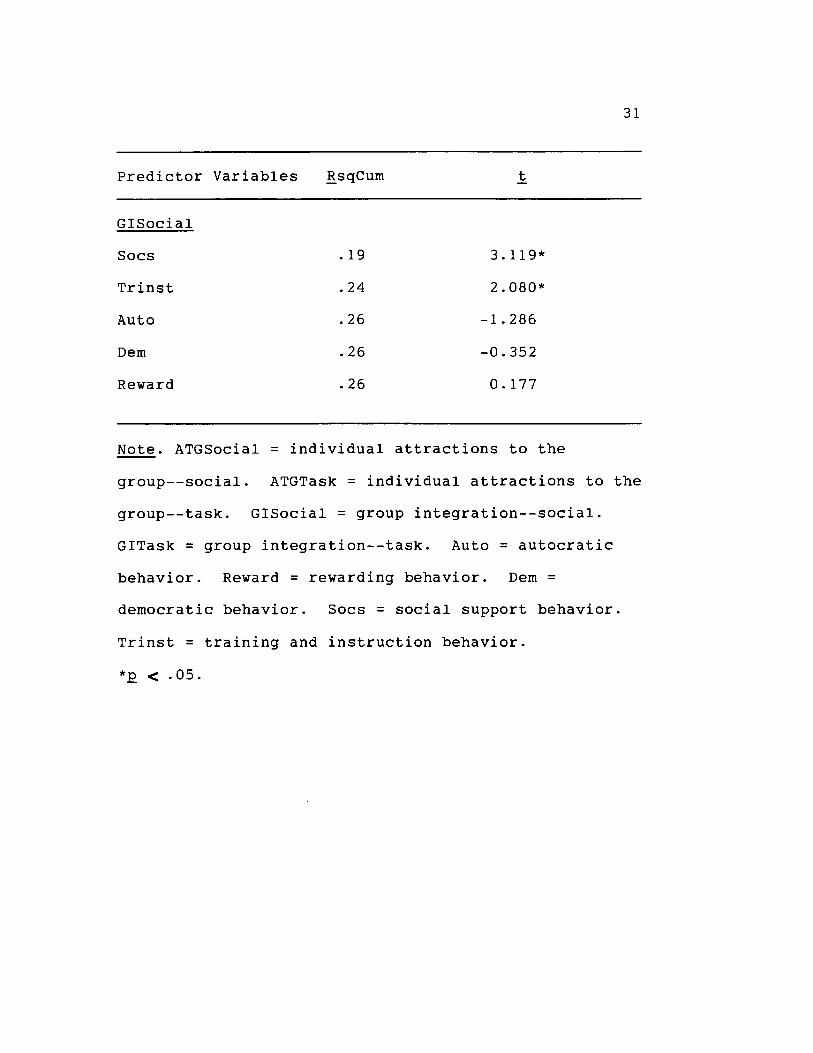
GI Social
Multiple regtression of the leadership predictor
variables on the cohesion category GISocial revealed
two significant variables: Socs and Trinst.
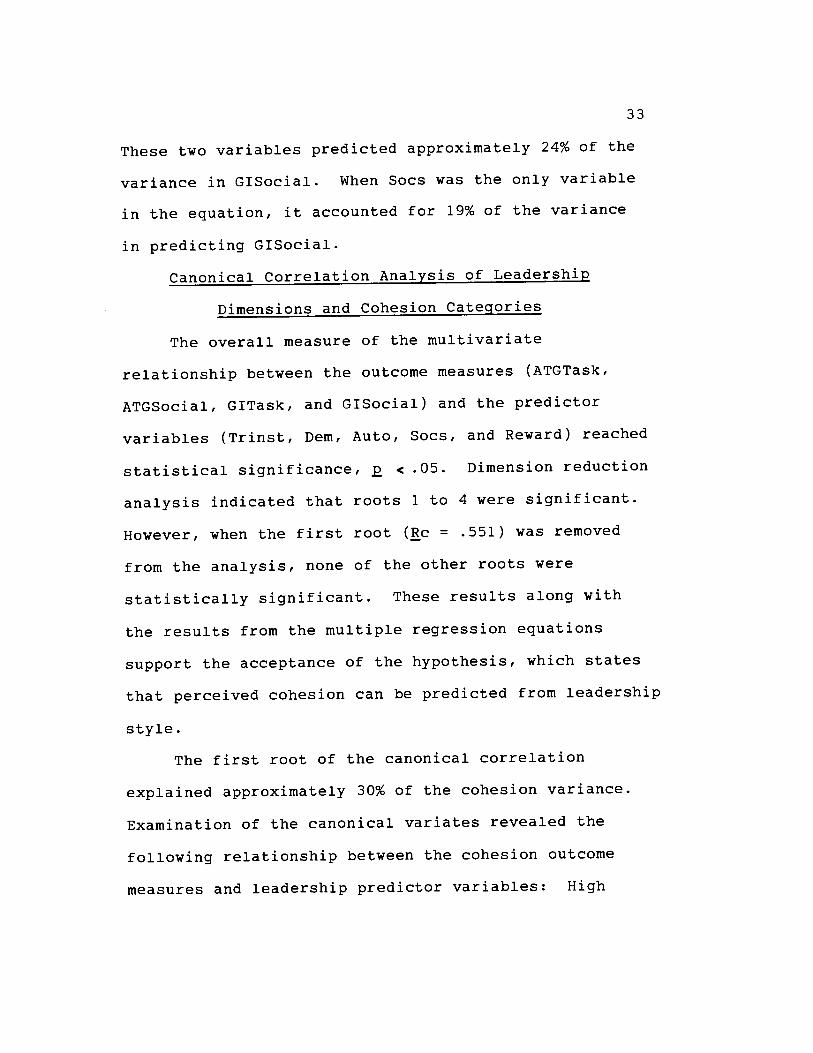
Page 44
33
These two variables predicted approximately 24% of the
variance in GfSocial. When Socs was the only variable
in the equation, it accounted for 19% of the variance
in predicting GISocial -
Canonical Correlation Analvsis of Leadership
Dimensions and Cohesion Cateqories
The overall measure of the multivariate
relationship betneen the outcome measures (ATGTask,
ATGSocial, GITask, and GfSocial) and the predictor
variables (trinst, Dem, Auto, SocS, and Reward) reached
statistical significance, p < .05. Dimension reduction
analysis indicated that roots 1 to 4 were significant.
However, when the first root (nc = .551) was removed
from the analysis, none of the other roots were
statistically significant. These results along with
the results from the multiple regression equations
support the acceptance of the hypothesis, trhich states
that perceived cohesion can be predicted from leadership
style.
The first root of the canonical correlation
explained approximately 30% of the cohesion variance.
Examination of the canonical variates revealed the
following relationship between the cohesion outcome
measures and leadership predictor variables: High
Page 45
34
GfSocial, moderately high ATGTask and GfTask, and 1ow
ATGSoeial was described by high Trinst, moderately high
Socs, moderately low Reward, and low Dem and Auto. This
profile characterizes coaches who focused primarily on
training and instruction, added with coneern for theirplayers welfare r Ers being able to develop high
group integrated social cohesion and moderately high
group integrated task and individual task cohesion.
The high predictive value of Trinst suggests it isthe best of the leadership variables in producing high
levels of ATGSocial and moderately high ATGTask and
GfTask cohesion. The moderately high Socs value
also suggests that softball coaches who are sociallysupportive wilt have teams that exhibit relatively high
social and task cohesion values. Further examination
of the first root of the canonical correlation can be
seen in Table 3.
Summarv
Pearson product-moment correlations revealed a
moderate relationship between Socs and GISoeiaI and a
low relationship between GITask and Auto. Moderate
correlations were also found between Trinst and all four
perceived cohesion values. Slightly lower r values
were found between Reward and the cohesion categories.
Page 46
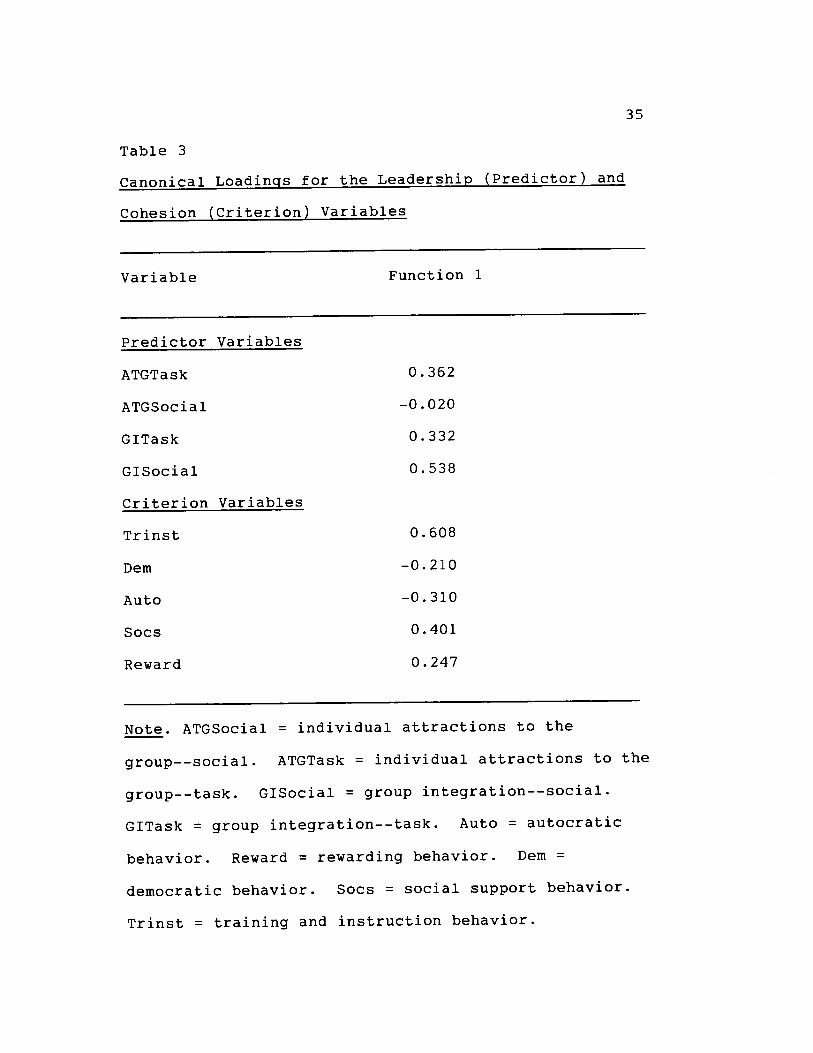
35
Table 3
Canonical Loadj-nqs or the Leadershi Pred i ctor nd
Cohesion (Criterion)Variables
Variable Function 1
Predictor Var■ ables
ATGTask
ATGSocia■
GITask
GISocial
Cr■ ter■ on Var■ ab■ es
Tr■ nst
Dem
Auto
Socs
Reward
0.362
-0.020
0.332
0.538
0.608
-0.210
-0.310
0。 401
0.247
Note. ATGSocial = individual attractions to the
group--social. ATGTask = individual attractions to the
group--task. GISocial = group integration--social'
GITask = group integration--task. Auto = autocratic
behavior. Reward = rewarding behavior. Dem =
democratic behavior. Socs = social support behavior.
Page 47
36
Multiple regression of the leadership predictor
variables on perceived cohesion revealed that the
predictor variable Trinst was a significant predictor
in all four equations. The predictor variables of
Auto and Socs were also found significant with GITask
and GlSocial, resPectivelY.
Canonical correlation analysis revealed the
foll_owing profile of high GISocial, moderately high
ATGTask and GITask, and lov ATGSocial: high Trinst,
moderately high Socs, moderately lorr Reward, and low
Dem and Auto.
Page 48
Chapter 5
DISCUSSION OF RESULTS
The results presented in chapter 4 are discussed
in this chapter. Topics include the following:
intercorrelations of the leadership dimensions and
cohesion categories; multiple regression analysis of
leadership dimensions on ATGTask, ATGSocial, GfTask,
and GlSocial; canonical correlation of leadership and
cohesion variables; and summary.
Intercorrelations of the Leadership Dimensions and
Cohesion Cateqories
The intercorrelation values for leadership and
cohesion variables are reported in Tab1e 1.
Correlations lilere in the direction (i.e., positive or
negative) expected by the investigator. The order of
magnitude of the relationships between leadership
profile items and task and social cohesion were as
follows: Trinst, Reward, followed closely by Socs,
then Dem and Auto.
The highest r value between any leadership
dimension and a cohesion category was r - .44 between
Socs and GlSocial. The above r value is understood by
looking at the definitions of Socs and GfSocial. Socs
behavior is characterized by creating a positive group
37
Page 49
38
atmosphere and warm interpersonal relations(Chelladurai & Saleh, 1980). GfSocial is bonding
within the team as a whole around the group as a social
unit (Widmeyer et a1., 1985). Examining the
definitions together suggests that if the coach
demonstrates behaviors of social support, the group is
likely to bond well as a social unit, thus explaining
the high r value. Even though the Socs-GISocial
relationship did reveal the highest r value, the
similarity of definitions might have suggested even a
more significant relationshiP.
Correlations between Trinst and the cohesion
categories revealed moderate correlations of rs = .35
to .38. These correlations were the highest values
of any leadership dimension. The r values for Trinst
vith the cohesion categories show that if coaches were
to use only one style of coaching and wanted cohesion
on their team, Trinst would appear to be the best
behavior to emphasize. The r values also revealed
significant but lower correlations between both Reward
and Socs and the cohesion categories. Initially, the
high Trinst r values were unanticipated by the
investigator, however, careful investigation into the
definition of Trinst and the review of literature
Page 50
39
supported that role clarity, strenuous training and
instruction, and high organization are favorable
qualities of coaches as viewed by athletes (Silletta,
t9B2) .
Correlations between the Auto behavior of the
coach and the cohesion categories revealed no
unexpected results. Low correlations (rs = -.15 to
-.29) resulted. The Auto behavior of the coach, which
involves independence in decision making and the
exercise of personal authority, on the surface would
not appear to foster favorable levels of cohesion.
However, it has been suggested that teams with common
experiences, even bad ones, can exhibit high levels of
cohesion (Widmeyer et aI., 1985). Even though the
authoritative leader does not promote care for the
individual, the experiences the team goes through
t,ogether may make them feel close. Although all the
relationships between Auto and the cohesion categories
were low, the relationships between Auto and GfTask and
between Aubo and GISocial were statistically
significant. The significant relationships point out
that Auto behavior should not be ignored completely when
describing the profile of a coach who would best promote
cohesion.
Page 51
40
Multiple Reqression Analvsis of Leadership Dimensions
on ATGTask, ATGSocial, GITask and GISocial
ATGTaSK
Multiple regression of the leadership predictor
variables on ATGTask accounted for 79.9% of the
variance. It is important to point out that 8O-l% of
the variance in ATGTask is unexplained by the
leadership variables. The remaining 80.1% represents
the unexplained percentage from unmeasured components
(e.g., luck, motivation, ability) tnat could have
contributed to the total ATGTask variance.
In the regression equation of ATGTask, only one
of the leadership variables (Trinst) was significant.
It explained 14.5% of the total variance. This
indicates that the leader who aims to improve the
performance of athletes by emphasizing and facilitating
hard and strenuous training; by instructing them in
the skills, techniques, and tactics of t,he sport, by
clarifying the relationship among the members; and by
structuring and coordinating the activities of the
members is going to be successful in fostering positive
feelings that contribute to how individuals feel about
their personal involvement with the group task, their
goals, and objectives. The Trinst' leader is
Page 52
4T
characterized by spending much time working toward and
focusing on the task (widmeyer et al., 1985), therefore,
one would hope that this focus would result in the
athletes feeling good about what it is they are trying
to accomplish. carron (1984) supports the above when
he suggested that the investment of much effort and
time into the task fosters a sense of pride and worth
in and about the task-
contributing to 4.7% of the remaining variance in
ATGTask was the predictor variable Reward. Although
the Reward value was not significant, the combination
of hard and strenuous training and instruction added
with positive feedback from the coach about the task
makes a more complete profile of predicting perceived
ATGTask in a team than the Trinst behavior a10ne.
The three remaining variables (Dem, Autor dlrd
socs) comprised just .62% ot the variance explained
in ATGTask. Thus, in attempting to develop high
ATGTask, a combination of strenuous training and
instruction with a reward system would appear to give
the best results. The reward contribution to the
development of individual attraction to the group task
is supported by Tutko and Richards (1971) when they
Page 53
42
suggested that if a coach uses positive methods during
instruction and rewards the athletes' good performance,
the players are prone to develop genuine feelings for
one another and the coach. When players are close to
one another they tend to play well together - Anshel
(1990) supports Tutko and Richards' findings and added
that players who are given a pat on the back for their
efforts witt be motivated to try harder and prepare
better. As a result, they vill likely be more
successful competitors and success can lead to greater
cohesion.
ATGSocial
Multiple regression of the leadership predictor
variables on ATGSocial accounted for 15% of the
variance. As was discussed with perceived ATGTask,
this is a significant amount of variance considering
that other variables not measured in the current study
are also related to team cohesion- As in the
regression equation with ATGTask, Trinst was the only
statistically significant variable. It accounted for
12.9% ot the variance. Of the remaining 2.1% ot
variance explained, Socs accounted for l.l% with the
other three variables comprising the remaining 1.0%'
Reward and Dem contributed negligibly to the overall
equation. The leadership profite for fostering high
Page 54
43
ATGSocial is very similar to that reported previously
for high ATGTask. The coach should exhibit behaviors
that focus on hard and strenuous training combined with
concern and praise for the athletes.
Trinst being the only significant variable is
somewhat of a surprise due to the fact that ATGSocial
is defined as how athletes feel they fit into the group
socially (Widmeyer et d1., 1985). It was expected that
Socs would be more of a contributor to the overall
equation because Socs refers to the leadership behaviors
that are concerned with individual athletes and their
welfare (Cnefladurai & Saleh, 1980). It would appear
that a coach who was concerned with the individual
athtetes and their welfare would try hard to make them
feel like they fit into the group socially. One
explanation why Socs rsas not as big a factor as
expected might be evident in the training and
instruction profile. Part of Trinst deals with how
effective the leader is at clarifying the relationships
among team members and structuring the activities of
the members. Trinst, therefore, best explains the
ATGSocial variance because, when roles are clarified,
athletes have an increased sense of security and fit
better into the team (widmeyer & Martens, 1978).
Page 55
t4
still, the lack of significance of Socs in the overall
explanation of the variance is surprising because the
two definitions of the leadership dimension and the
cohesion category overlap. However, examining the
intercorrelation of the variables, only a moderate
relationship was revealed between ATGSocial and Socs
(r = .24) with a seemingly higher (r = .35)
relationship revealed between ATGSocial and Trinst.
Another explanation of the lack of significance
of socs in ATGSocial is identified in Zander's (1982)
research. He suggested that social cohesion develops
more readily in homogeneous groups. Anshel (1990)
supports the above when he suggested that if coaches'
main focus is on individual athletes and their welfare,
it could create some diversity if the athletes do not
feel they are being treated equally. However, focusing
more on the task aS in Trinst would force all at'hletes
to encounter more of the same experiences, thereby
promoting team unity. Thus, the significant percentage
of cohesion variance explained by Trinst is best
understood by the belief thaL the softball coach whose
aim is hard and strenuous training for all, regardless
of athletes' level of ski11 (starter vs. nonstarter),
is going to make everyone feel the same because of
Page 56
45
their hard work. Not only would starters be working
hard, but having individuals who feel satisfied about
how they have been personally involved fosters high
acceptance from all members, thus making the social
interaction positive. No one would be singled out,
and everyone's experiences would be similiar.
A statement by Widmeyer et al. (1985) further
supports Trinst behavior as promoting ATGSocial. They
claimed that task and social cohesion within a team are
accompanied by reduced individuality and increased
conformity behavior. This is perpetuated by coaches
who emphasize Trinst behaviors because they focus
athletes on the skills and tactics of the sport and
they coordinate the members' activities so they all
experience the same thing. Widmeyer et al.'s claim
also supports the contribution of Auto to the total
explained ATGSocial variance because Auto coaches are
characterized as the sole decision makers and expect
conformity from all participants. The Auto coaches
would not accept individuality and force athletes to
do as they wish.
GITaSK
Multiple regression of
perceived GfTask accounted
the predictor variables on
for 23.6% of the variance.
Page 57
46
Of the four regression equations, GITask rras the second
highest in explained variance. Within the equation
there are two significant variables. Trinst explained
14.9% ot the tot,al variance, and Auto explained another
6.1% ot the remaining 8.7%.
Both of the variables that were significant are
readily explainable as to why they have a high
relationship with GfTask. If group members are
concerned only with the task at hand (GITask), focusing
on that task would be easiest vith a coach whose style
was task oriented (i.e., Trinst and Auto). The Auto
leadership style trith the role definition of Trinst
typically allorss no diversion from the focus on the
task. Thus, accomplishment of the task vould be the
main concern. Widmeyer et a1. (1985) support this when
they suggested that task cohesion develops more readily
in groups where members have clearly defined roles.
Thus, a team in which all members have roles and carry
specific structured tasks reveals high leve1s of
GITask, Els would best be promoted by a combination of
Trinst and Auto leadership styles.
Simply by examining the definitions of the Trinst
style and the GITask category, one would expect a high
positive correlation. However, one might predict the
Page 58
47
retationship between conformity (Auto leadership) and
task cohesiveness (GITask) to Ue opposite' unlike the
results. The negative Auto and GITask relationship is
supported by Cartrrright (1968) when he stated that'
if the standards for behavior and performance are
establishedandapprovedbythegroup'theirlikelihood
of acceptance will be high' If coaches want their
teams to conform, they should involve players in the
decision making process whenever possible. Cartwright,s
findings suggest that possibfy the Dem style of
leadership should have contributed more to the equation'
Further examination of the GITask regression
eguation, reveals that Dem did explain 2'O% of the
remaining variance. Although not a significant
variableintheequation,theDemstyleofleadership
wouldbeappropriatetouseinSomesituationssothat
athletesfeeltheyhaveSomeinputintotheteamrules
anddecisions.ThecomponentsoftheGlTaskequation
leadtotheassertionthatacoachneedstouseall
styles of coaching at appropriate times' The data from
thisinvestigationshowthatTrinstisasignificant
leadershipbehaviortofocusonaSacoachl}etnotat
all times. When the situation warrants' all five
l-eadershipbehaviorsshouldbeused(Anshel'1990;
Mountjoy, 1980).
Page 59
1B
GISocial
Multiple reqression of the leadership predictor
variables on GISocial accounted for approximately 25.8%
of the variance. Of the four cohesion categories,
GISocial was best predicted by the leadership
variables. Perhaps this occurred because GISocial
encompasses how team members feel about their closeness
as a social unit and the leadership dimension of Socs
is concerned with the same thing (Chelladurai & Saleh,
1980; Widmeyer et al., 1985), so the predictive value
of Socs is understood. Examining the significant
variables of the equation supports the above statement
because Socs alone explained L9% of the total variance
in GISocial.
Carron's (1984) research helps support and explain
the current findings with the GISocial cohesion
category. He found that, when team members understand
their roles and can accept their relationship to the
team, cohesion is enhanced. Also, leaders who have
great concern for their athletes as people and not just
as athletes will help the team members to sociatize
more closely with the group- If coaches deal with
an athlete's personal matters or structure social
activities apart from the sport, all members of the
A
Page 60
49
team can feel a part of the group and social cohesion
would be enhanced. Removal from the sport or task and
insertion into a situation where all have equal
opportunities gives athletes (starters or nonstarters) a
f eeling of equalit,y (widmeyer & Martens, 1978 ) ' This
could achieve positive social feelings outside the task
about the group and lead to greater overalt cohesion.
The more one can decrease differences and make the
group more homogeneous I the greater the subsequent
social and task cohesion (zander , 1982). Williams and
widmeyer,s ( 1991 ) research supports Zander's findings
when they claimed: People form better units when they
are alike, and an effective leader develops oneness
within a set by encouraging likeness among members.
From the results from the regression equations,
Trinst and Socs would appear to be the best leadership
styles to incorporate into softball coaching in an
attempt to develop cohesion. However, not one style is
always appropriate because the situation or
circumstances dictate which style one should use
(Chelladurai, 1984b) .
Canonical Correlation of Leadership
and Cohesion Variables
canonical correlation revealed that high GlSocial,
Page 61
50
moderately high ATGTask and GfTask, and low ATGSocial
was predicted by high Trinst, moderately high Socs,
moderately low reward, and 1ow Dem and Auto- This
leadership profile explained approximately 30% ot the
total cohesion variance. As was found in the multiple
regression analysis, Trinst is the most effective
leadership style to utilize with softball athletes for
the development of cohesion among the group members
Further examination into the specific make-up
the first vector of the canonical correlation shows
that the high relationship between Trinst and GfSocial
means that softball coaches who are organized and pay
special attention to clarifying the relationship among
the members will have players who feel good about the
similarity and bonding within the team as a social
unit. This suggests thatr Els long as members feel good
about what they are doing, they generally will perform
wel1. This, however, is not always true. There are
potential negative aspects of cohesive groups -
One potenLial negative, is "social loafing"
(GiIl , 1984). This is the tendency for some
individuals' efforts to decline, because the better
athletes can get ar.ray with not performing at their
maximum. They are good enough without maximum effort.
f
●
0
Page 62
51
It al1ows them not to work to their potential all the
time. However, this tendency might not be as evident
in a team sport like softball compared to a team sport
like voI1eyball where it is much more difficult to
measure individual effort. The softball athletes must
depend on themselves when it comes to performance and
in many instances volleyball athletes are able to get
assistance from another player if they make a mistake.
Softball has individual tasks incorporated into a group
task, and because of this distribution of effort it
would seem necessary to incorporate high levels of Socs
and Trinst into one's leadership sty1e. This approach
should help to keep athletes focused on the group and
not on individual achievements -
Low Reward as a coaching style is logical because
singling people out (e.9., stickers for helmetsr $dm€
ba11s, etc.) could decrease the group bonding, thus
hurting the group's social cohesion. Although I feel
it is appropriate to recognize good plays and individual
accomplishments, it is important to do it in a way not
offensive to the other team members. Leaders in
statistics and accomplishments will always emerge,
however taking notice of them or creating a reward
system is not highly supported by this study. The
Page 63
52
results show Reward as explaining only a sma1l portion
of the variance.
The idea that reduced individuality and increased
conformity come from increased cohesion (wiffiams &
Widmeyer, 1991) suggests that, in the game of softball,
the development of cohesion might be more of a problem
than in a sport of high interaction such as volleyball
because individual effort is more noticeable- To
counter this, just as the regression and canonical
correlation results show, coaches must incorporate into
their coaching the ability to use all styles at
appropriate times (cnertaaurai, 1984a). This implies
that coaches not onty need to be knowledgeable about the
skills of the sport but also about people - They must
understand the psychology of people and be observant to
what the team is doing (Carron, 1993).
Summary
The order of magnitude of the relationship between
the leadership profile items and task and social
cohesion were as follows: Trinst, Reward, followed
closely by Socs, then Dem and Auto- A11 of the
leadership variables showed significant results with at
least one of the cohesion categories, suggesting all
leadership behaviors would be appropriate to use in the
Page 64
53
development of cohesion.
The highest r values between any leadership
dimension and a cohesion category uas that of Socs with
GlSocial. However, the correlations between Trinst and
the cohesion categories revealed the highest averaged
values of any leadership dimension. The above results
suggest that Trinst and socs would be effective styles
of leadership to use in developing social and task
cohesion.
Multiple regression of the leadership predictor
variables on ATGTask accounted for 19 -9% of the
variance. Trinst was the only significant variable in
the equation explaining 14-5% of the total variance'
The Trinst leader, one whose focus is strenuous
training towards the task, is successful in fostering
positive feelings about the task (aterasx).
Contributing 4.7% of the remaining variance in
ATGTask was Reward. Although not significant, this
indicates that a combination of strenuous training
(Trinst) added with positive feedback (Revard) makes a
more complete profile of predicting perceived ATGTask
in a team.
Multiple regression of the leadership predictor
variables on ATGSocial accounted for 15% ot the
Page 65
54
variance. As in the regression eguation with ATGTask,
Trinst was the only statistieally signifieant variable.
It accounted for L2.9% of the variance. The leadership
profile for fostering high ATGSocial is very similar to
that reported above for ATGTask- The coach should
exhibit behaviors that focus on hard and strenuous
training combined with concern and praise for the
athletes.
The regression equation of GITask with the
leadership predictor variables accounted for
approximately 24% ot the variance. Of the four
regression eguations, GITask was the second highest in
explained variance. Within t.he equation there were two
significant variables. Trinst explained 74.9% of the
total variance, and Auto explained another 6% of the
remaining 8.7%. Trinst and Auto's significance are
easily explained. If group members are Concerned with
the task at hand (cttasx), focusing on that task would
be easiest with a coach whose style was task oriented
( i . e. , Trinst and Auto ) .
Multiple regression of the leadership predict,or
variables on GISocial accounted for approximately 26%
of the variance. Of the four cohesion categories,
GISocial was best predicted by the leadership
Page 66
55
variables. Perhaps the reason this occurred was
because GISocial encompasses how team members feel
about their closeness aS a social unit and because the
leadership dimension of Socs is concerned with the same
thing. Examination of the significant variables does
show that Socs alone explained 19% of the total
variance in GISocial. This supports the findings that
when team members understand their roles and can accept
their relationship to the team, cohesion is enhanced
(Carron, 1984).
canonical correlation of the leadership variables
and cohesion dimensions revealed that high GISocial,
moderately high ATGTask and GrTask, and low ATGSocial
was predicted by high Trinst, moderately high Socs,
moderately low reward, and low Dem and Auto. The above
leadership profile explained approximately 30% of the
total cohesion variance. As was found in the multiple
regression analyses, Trinst is the most effective
leadership style to utiLize with softball athletes for
the development of cohesion among the group members '
Page 67
Chapt,er 6
SUMMARY, CONCLUSIONS, AND RECOMMENDATIONS
Summarv
This study investigated the relationship between
perceived leadership styles on task and social cohesion.
High school athletes (N = 93) from sectional softball
teams completed the following two questionnaires: the
Leadership Scale for Sports (LSS1, and the Group
Environment Questionnaire (GEQ) .
To assess the interrelationships among all the
variabtes, Pearson product-moment correlation was used-
Pearson r values ranged from a low -.13 (auto with
Trinst) to a high of .63 (Renard with Dem). The
examination of the relationships between variables of
the cohesion questionnaire and the leadership scale
revealed the Iargest I values between Socs and GISociaI
and the smallest r values between GfTask and Dem.
Moderate correlations were found between Trinst and all
four cohesion values. Slightly lower r values were
found between Reward and the cohesion measures.
The stepwise procedure of multiple regression was
utilized to assess the overall degree of relationship
between the leadership predictor variables and the
criterion measures of cohesion.
56
Page 68
57
Multiple regression of the predictor variables on
the cohesion measure ATGTask revealed one significant
variable, Trinst. Multiple regression on the cohesion
measure ATGSocial revealed Trinst as significant also-
The remaining cohesion variables both revealed two
significant variables in their respective equations.
The first,, GITask revealed Trinst and Auto as
significant contributors, and GISocial's equation
revealed Trinst and Socs as significant.
The overall measure of the multivariate
relationship between the outcome measures and the
predictor variable was determined using canonical
correlation analysis. Dimension reduction analysis
indicated that roots 1 to 4 were significant. However,
when the first root (Rc = .551) was removed from the
analysis, none of the other roots were statistically
significant. The first, root of the canonical
correlation explained approximately 3O% ot the cohesion
variance. High GISocial, moderately high ATGTask and
GITask, and low ATGSocial were described by high Trinst,
moderately high Socs, moderately low Reward, 1ow Dem
and 1ow Auto. This profile characterizes coaches who
focus on training and instruction with concern for
their players as being able to develop high group
Page 69
5B
integrated social cohesion and moderately high GITask
and ATGTask cohesion.
Conclusions
The results of this study yielded the following
conclusions regarding the relationship betr,reen the
leadership dimensions and the four cohesion measures.
1. Trinst appears to be the most important
behavior to focus on in the development of task and
social cohesion.
2. A11 five leadership dimensions have a role in
the development of task and social cohesion under
appropriate circumstances .
3. Of the four cohesion measures ATGSocial is the
least explained by the leadership dimensions.
4. The use of the LSS as a predictor of task and
social cohesion is significant enough to warrant its use
in future studies.
Recommendations
The following recommendations for further study
were made after the completion of this investigation:
1. A study using only the LSS should be conducted,
using various types of sport teams to assess preferred
leadership.
2. Utilize sport teams other than softball where
Page 70
59
cohesion is intuitively more relevant to performance
( i . e. , vo1leyba1l or basketball ) .
3. Repeat this study with larger samples and with
different age groups and male athletes.
4. Compare individual and team sports to assess
various degrees of perceived cohesion.
Page 71
ApPendix A
LEADERSHIP SCALE FOR SPORTS
(ATHLETES' PERCEPTION OF COACH'S BEHAVIOR)
fnstructions
Each of the following statements describes a
specific behavior that a coach may exhibit. For each
statement there are five alternatives:
1. ALWAYS
2. OFTEN (about 75% of the time)
3. OCCASIONALLY (about 50% of the time)
4. SELDOM (about 25% of the time)
5. NEVER
Please indicate your eoach's actual behavior by
placing an trX* in the appropriate space. Answer all
items even if You are unsure of any-
please note that you are rating your present coach.
60
Page 72
61
1. Sees to it that athletes work to capacity;
2. Asks for the opinion of the athletes on strategies
for specific competition.
3. Helps athletes with their personal problems.
4. Compliments an athlete for good performance in
front of others.
5. Explains to each athlete the techniques and tactics
of the sport.
6. Plans relatively independent of the athletes.
7. Helps members of the group settle their confticts.
B. Pays special attention to correcting athletes'
mistakes.
9. Gets group approval on important matters before
going ahead.
10. Tel1s an athlete when the athlete does a
partieularly good job.
11. Makes sure that the coach's function in the team
is understood by all athletes.
L2. Does not explain his/her actions.
13. Looks out for the personal welfare of the
athletes.
74. Instructs every athlete individually in the skills
of the sport.
15. Lets the athletes share in decision making.
Page 73
62
16. Sees that an athlete is rewarded for a good
performance.
L7. Figures ahead on what should be done.
18. Encourages athletes to make suggestions for ways
to conduct Practices.
19. Does personal favors for the athletes.
20. Explains to every athlete rshat should be done and
what should not be done.
21. Lets the athletes try their own way even if they
make mistakes.
22. Expresses any affection felt for the athletes'
23. Expects every athlete to carry out one's
assignment to the last detail.
24. Lets the athletes try their own way even if they
make mistakes-
25. Encourages the athlete to confide in the coach'
26. Points out each athlete's strengths and weaknesses.
27. Refuses to compromise on a point.
28. Expresses appreciation when an athlete performs
well.
29. Gives specific instructions to each athlete on
what should be done in every situation'
30. Asks for the opinion of the athletes on important
decisions.
Page 74
63
31. Encourages close & informal relations with
ath■ etes.
32. Sees to it that the athletesi efforts are
co-ordinated.
33. Lets the athletes work at their own speed.
34. Keeps aloof from the athletes.
35. Explains how each athlete's contribution fits into
the total picture.
36. fnvites the athletes home -
37. Gives credit when it is due.
38. Specifies in detail- what is expected of athletes.
39. Lets the athletes decide on plays to be used in a
game.
40. Speaks in a manner which discourages questions.
Page 75
Appendix B
GROUP ENVIRONMENT QUESTIONNAIRE
Instructions
This questionnaire is designed to assess your
athletic team. There are no right or wrong answersr So
please give your immediate reaction. Some of the
questions may seem repetitive but please answer all
questions. Your candid responses are very important
to us.
Your responses vi11 be kept in strictest
confidence (neither your coach nor anyone other than
the researchers will See your responses). You have
been asked to indicate your name only in the event that
we need to match two pieces of information on each
player or team.
Questions 1-9 are designed to assess your feelings
about your personal involvement with this team. Please
circle a number from 1 to 9 to indicate your 1evel of
agreement with each of the statements.
Questions 10-18 are designed to assess your
perceptions of your team as a whole. Please circle a
number from 1-9 to indicate your level of agreement
with each of the statements.
64
Page 76
65
1. I do not enjoy being a part of the social
activities of this team.
2. I'm not happy with the amount of playing time f
get.
3. I am not going to miss the members of this team
when the season ends.
4. f'm unhappy with my team's level of desire to win'
5. Some of my best friends are on this team'
6. This team does not give me enough opportunities
to improve my personal performance '
7. I enjoy other parties more than team parties'
B. I do not like t,he style of play on this team'
9. For me this team is one of the most important
social grouPs to which I belong.
10. Our team is united in trying to reach its goals
for performance.
I 1 . Members of our team would rather go out on their
own than get together as a team.
L2. We aII take responsibility for any loss or poor
performance bY our team.
13. Our team members rarely party together.
L4. Our team members have conflicting aspirations for
the team's Performance.
15. Our team would like to spend time together in the
off season.
Page 77
66
16. If members of our team have problems in practice,
everyone wants to help them so we can get back
together again.
17. Members of our team do not sticlc together outside
of practices and games.
18. Our team members do not communicate freely about
each athlete's responsibilities during
competition or Practice.
Page 78
Appendix C
INFORMED CONSENT FORM: ATHLETES
To participate is this study you will be required
to fill out two questionnaires. The first is the
Leadership Scale for Sports, which consists of 40
statements that, are to be answered by placing an trxrr in
one Of five CategOrieS ranging frOm "aIWayS" to "never"
rating your coach'S behavior. The second questionnaire
you wilt be required to fill out is the Group
Environment Questionnaire, which consists of 18
questions. A circle is placed around a number from 1
,,Strongly Disagree" to 9 "Strongly Agree" representing
your level of agreement with each statement ' The
questionnaires will take approximately 45 min to
complete.
A11 information that you provide for this study
will be kept in strictest confidence (neither your coach
. nor anyone other than the researchers will see your
responses). You have been asked to indicate your name
only in the event that we need to match two pieees of
information on each player or team. should you have
any questions about the procedure or require further
information, please call Rhonda Faunce at (607)
347-4296 or Dr. A. Craig Fisher at (607) 274-31L2'
67
Page 79
68
Your participation is voluntary. You are free to
withdraw consent and discontinue at any time.
f have read the above, understand its contents,
and agree to participate in this study.
S ignature Date
Page 80
Appendix D
RECRUITMENT LETTER TO COACHES
You have been selected from New York State high
school varsity softball teams that have met the
requirements for sectional competition to represent
your sport in a research study. Our interest is the
relationship coaches' leadership styles have on
team unity and cohesion. The reason that we are
selecting sectional teams is because we believe that
success may affect the team's level of cohesion, and by
randomly selecting just any team we would not be able
to determine what variable was responsibte for the
degree of cohesion.
Because one of the variables we are interested in
is cohesion, if your team is characterized as having
any unusual interpersonal circumstances, infighting,
racial problems r oE any other out of the ordinary
problems, thank you for your time, but please disregard
this letter. If your team is not characterized as
having any of the above problems, Iet me continue to
see whether or not you and your team are interested.
Your athletes will be required to fill out the
40-item Leadership Scale for Sports and the 18-item
Group Environment Questionnaire, each assessments of
69
Page 81
70
athletes, perceptions of their athletic team. In the
Group Environment Questionnaire a circle is placed
around a number from 1 "Strongly Disagree" to 9
"Strongly Agree" depending on the agreement with each
statement. The questionnaires together will take
approximatelY 45 min to comPlete.
This study is being done at Ithaca College to
fulfi11 the requirements for a Master of Science
degree. Your participation would be greatly
appreciated and hopefully beneficial for present and
future coaches.
Wou1d you be willing to participate? If fes,
please fil-I out the enclosed postcard and return it as
soon as possible.
Thank you !
Page 82
REFERENCES
Anshel, M. H. (1990). Sport psvchologv: From theorv
to pracfice. Scottsdale, AZ: Gorsuch Scarisbrick'
Bird, A. M. (L977a). Development of a model for
predicting team performance. Research Quarterly,
48, 25-32.
Bird, A. M. (1977b). Team structure and success as
related to cohesion and leadership. Journal of
Social Psvcholoqv, 1tQ3, 217-223.
Carron, A. V. (1984). Cohesion in sport teams. In J.
M. Silva, III & R. s. Weinberg (Eds.), Psvcholoqical
foundations of sport (pp. 340-35i ). Champaign, IL:
Human Kineties.
Carron, A. V. (1993). The sport team as an effective
group. In J. M. williams (Ed. ), APP!iet!5por.!.
psvchology: Personal qrowth to peak performance (2nd
ed.; pp. 110-l2L). Mountain View, CA: Mayfield.
Carron, A. V., & Chelladurai, R. (1981). The dynamics
of group cohesion in sport. Journal of Sport
Psycholoqv, 3, 123-139.
Cartwright, D. (1968). The nature of group
cohesiveness. fn D. Cartwright & A. Zander (Eds.),
Group dvnamics: Research and theorv (pp. 91-109).
New York: Harper & Row.
71
Page 83
72
Chelladurai, P. ( 19B a ) . Discrepincy between
preferences and pereeptions of leadership behavior
and satisfaction of athletes in various sports '
Journal of Sport Psycholoqy, 6, 27-4L.
Chelladurai, P. ( 1984b) . Leadership in sports ' In J '
M. Silva, III & R. S. Weinberg (nas.), Psvcholoqical
foundations of sport (pp- 329-339). Champaign, IL:
Human Kinetics.
Chelladurai, P. , & Carron, A. v. ( 1978 ) - Leadership'
Ottawa, Ontario: Canadian Association of Health,
Physical Education, and Recreation (Monograph)'
Chelladurai, P., & Saleh, S. D. (1978)' Preferred
leadership in sports. canadian Journal of Applied
Sport Sciences, 3, 85-92-
Chelladurai, P., & Sa1eh, S. D. (1980)' Dimensions of
leader behavior in sports: Development of a
leadership sca1e. Journal of Sport Psycholoqv, 2,
34-45.
Festinger, L., Schachter, S., & Back, (1950)。
a1 pressures in informa
K.
:A study of
housinq Proiect. New York: HarPer.
Fiedler, F. E. (tSSa;. Assumed similarity measures
as predictors of team effectiveness. Journal of
Abnormal and Social Psvcholoqv, 49, 381-388'
Page 84
73
Fiedler, F. E. ( 1967 ) . A theorv of leadership
effectiveness. New York: McGraw-Hi11.
cilI, D. L. (1978). Cohesion and performance in sport
rn R. s. Hutton (Ed-), Exercise and Sport
Scienee Reviews (pp. 131-155). Santa Barbara:
Journal Publishing Affiliates.
Gi1l, D. L. (1984). Individuat and group performance
in sport. In J. M. Silva, ffl & R. S. Weinberg
(Eds.), Psvcholoqical foundations of sport.
Champaign, IL: Human Kinetics.
Landers, D. M., & Luschen, H. G. (L974). Team
performance outcome and cohesiveness of competitive
co-acting groups. International Review of Sport
Socioloqv, 2(9), 57-69.
Lenk, H. (1969). Top performance despite internal
conflicts: An antithesis to a functionalistic
proposition. In J. W. Loy & G. S. Kenyon (Eds.),
Sport, culture and society: A reader on the
sociolosv of sport (pp. 393-397). New York:
Macmi 1Ian.
McGrath, J. E. (L962). The influence of interpersonal
relations on adjustment and effectiveness in rifle
teams. Journal of Abnormal and SociaI Psychology,
65 , 365-375.
Page 85
74
Mountjoy, T. (1980, March). Situational leadership as
applied to sport- Coachinq Science Update, PP'
14- 16 .
Shaw, M. (1971). Group dvnamics: The psvcholosv of
small SrqUP--behavior.. New York: McGraw-Hi11'
Si1letta, T. (LgB2, July). Leadership styles: This
study shows that high school athletes least prefer
the laissez-faire leadership role played by coaches.
Coachinq Review, PP. 16-17.
Straub, W. F. (1978). How to be an effective leader'
In W. F. Straub (Ed.), Sport Psvcholosv: An analvsis
of athlete behavior (Znd ed.; pp. 382-391). Ithaca,
NY: Mouvement.
Tutko, T. A., & Richards, T- W. ( 1971 )' Psvcholosv
of coachinq. Boston: Al1yn and Bacon.
Weiss, M. R., & Friedrichs, W. D. (1986)' The
influence of leader behaviors, coach attributes,
and institutional variables on performance and
satisfaction of collegiate basketball teams'
Journal of Sport Psvcholoqy, B, 332-346.
Widmeyer, W. N., Brawley, L. R., & Carron, A' V'
(1985). The measurement of cohesion in sport
teams: The Group Environment Questionnaire. London,
Ontario, Canada: SPorts DYnamics'
Page 86
75
widmeyer′ W. N.′ & Martens′ R。 (1978)。 When COhesion
predicts performance outCOme ■n spOrt. Research
Quarter■ y′ 49′ 372-380.
Wi■ ■iams′ 」. M.′ & Widmeyer′ Wo N。 (1991). The
cohesion―performance outcome re■ ationship in a
coacting sport. 」ourna■ of SpOrt & Exerc■ se
Psycho■ ogy′ 1ュ ′ 364-371.
Zander′ A. (1982). Making groups effective′ San
Franc■ sco: 」ossey― Bass。