Page 1
Florida International UniversityFIU Digital Commons
FIU Electronic Theses and Dissertations University Graduate School
3-27-2015
Comparison of Linear Functions in Middle GradesTextbooks from Singapore and the United StatesLinda D. FowlerFlorida International University, [email protected]
DOI: 10.25148/etd.FI15032190Follow this and additional works at: https://digitalcommons.fiu.edu/etd
Part of the Cognition and Perception Commons, Cognitive Psychology Commons, Curriculumand Instruction Commons, Curriculum and Social Inquiry Commons, Educational Assessment,Evaluation, and Research Commons, Educational Psychology Commons, Educational SociologyCommons, International and Area Studies Commons, International and Comparative EducationCommons, Mathematics Commons, School Psychology Commons, Science and MathematicsEducation Commons, and the Social Psychology Commons
This work is brought to you for free and open access by the University Graduate School at FIU Digital Commons. It has been accepted for inclusion inFIU Electronic Theses and Dissertations by an authorized administrator of FIU Digital Commons. For more information, please contact [email protected] .
Recommended CitationFowler, Linda D., "Comparison of Linear Functions in Middle Grades Textbooks from Singapore and the United States" (2015). FIUElectronic Theses and Dissertations. 1799.https://digitalcommons.fiu.edu/etd/1799
Page 2
FLORIDA INTERNATIONAL UNIVERSITY
Miami, Florida
COMPARISON OF LINEAR FUNCTIONS IN MIDDLE GRADES TEXTBOOKS
FROM SINGAPORE AND THE UNITED STATES
A dissertation submitted in partial fulfillment of
the requirements for the degree of
DOCTOR OF EDUCATION
in
CURRICULUM AND INSTRUCTION
by
Linda Donnell Fowler
2015
Page 3
ii
To: Dean Delia C. Garcia
College of Education
This dissertation, written by Linda Donnell Fowler, and entitled Comparison of Linear
Functions in Middle Grades Textbooks from Singapore and the United States, having
been approved in respect to style and intellectual content, is referred to you for judgment.
We have read this dissertation and recommend that it be approved.
_______________________________________
Janice Sandiford
_______________________________________
Hilary Landorf
_______________________________________
Maria Fernandez, Co-Major Professor
_______________________________________
George E. O'Brien, Co-Major Professor
Date of Defense: March 27, 2015
The dissertation of Linda Donnell Fowler is approved.
_______________________________________
Dean Delia C. Garcia
College of Education
_______________________________________
Dean Lakshmi N. Reddi
University Graduate School
Florida International University, 2015
Page 4
iii
ACKNOWLEDGMENTS
First of all, I want to acknowledge my Lord and Savior Jesus Christ, without
whom, I would never have gotten this degree. He is the ultimate cause of all things.
I would next like to thank my family and friends for their love and support
throughout this process: my parents, John and Brenda, sisters Amy and Diane, brother
Johnny, husband Tom, daughter Ashley, and parents in law: Big Tom and Ginny.
A big thank you goes to my sister Diane whose editing comments pushed me
forward when I was at a standstill.
A big thank you goes to my husband Tom who suffered through the loathsome
task of being my second coder in the study. Thank you for your sacrifice.
I give a big thank you to Ashley who sacrificed the most time-wise throughout
this process. Thank you, Ashley.
I also give Marsha Guntharp a big thank you for being the third judge needed to
find the content validity index values for the study.
A big thank you goes to my co major professors: Dr. O’Brien, Dr. Fernandez,
without whom, I would never have gotten my extensions. Thank you for all your work.
A big thank you goes to my committee members Dr. Sandiford and Dr. Landorf
for all the work you put in.
I also gives thanks to my former advisor Dr. Alacaci for leading me to this topic
of study, to Dr. Tashakkori who taught my first class at FIU, and to Dr. Banya who
volunteered to teach an independent study for me.
I also thank the Palm Beach County school district and Conniston Middle School
for the use of one series of U.S. textbooks for the study.
Page 5
iv
ABSTRACT OF THE DISSERTATION
COMPARISON OF LINEAR FUNCTIONS IN MIDDLE GRADES TEXTBOOKS
FROM SINGAPORE AND THE UNITED STATES
by
Linda Donnell Fowler
Florida International University, 2015
Miami, Florida
Professor George E. O’Brien, Co-Major Professor
Professor Maria Fernandez, Co-Major Professor
Many U.S. students do not perform well on mathematics assessments with respect
to algebra topics such as linear functions, a building-block for other functions. Poor
achievement of U.S. middle school students in this topic is a problem.
U.S. eighth graders have had average mathematics scores on international
comparison tests such as Third International Mathematics Science Study, later known as
Trends in Mathematics and Science Study, (TIMSS)-1995, -99, -03, while Singapore
students have had highest average scores. U.S. eighth grade average mathematics scores
improved on TIMMS-2007 and held steady onTIMMS-2011. Results from national
assessments, PISA 2009 and 2012 and National Assessment of Educational Progress of
2007, 2009, and 2013, showed a lack of proficiency in algebra. Results of curriculum
studies involving nations in TIMSS suggest that elementary textbooks in high-scoring
countries were different than elementary textbooks and middle grades texts were different
with respect to general features in the U.S.
Page 6
v
The purpose of this study was to compare treatments of linear functions in
Singapore and U.S. middle grades mathematics textbooks. Results revealed features
currently in textbooks. Findings should be valuable to constituencies who wish to
improve U.S. mathematics achievement.
Portions of eight Singapore and nine U.S. middle school student texts pertaining
to linear functions were compared with respect to 22 features in three categories: (a)
background features, (b) general features of problems, and (c) specific characterizations
of problem practices, problem-solving competency types, and transfer of representation.
Features were coded using a codebook developed by the researcher. Tallies and
percentages were reported. Welch's t-tests and chi-square tests were used, respectively, to
determine whether texts differed significantly for the features and if codes were
independent of country.
U.S. and Singapore textbooks differed in page appearance and number of pages,
problems, and images. Texts were similar in problem appearance. Differences in
problems related to assessment of conceptual learning. U.S. texts contained more
problems requiring (a) use of definitions, (b) single computation, (c) interpreting, and (d)
multiple responses. These differences may stem from cultural differences seen in
attitudes toward education. Future studies should focus on density of page, spiral
approach, and multiple response problems.
Page 7
vi
TABLE OF CONTENTS
CHAPTER PAGE
1. INTRODUCTION ........................................................................................................ 1 Background ............................................................................................................. 2
Rationale for a Textual Analysis Concerning Linear Functions ........................ 4 Rationale for Comparison of Singapore and U.S. Middle School Texts ......... 15
Research Questions ............................................................................................... 16
Theoretical Framework ......................................................................................... 17 Potential Usefulness of Textbook Research ......................................................... 18
Historical Background ..................................................................................... 18 Merits of the Study ........................................................................................... 19
Delimitations of the Study .................................................................................... 21 Definition of Constructs ........................................................................................ 23
Overview of the Study .......................................................................................... 26 Overview of Remaining Chapters ......................................................................... 26
2. REVIEW OF LITERATURE ..................................................................................... 28 Background ........................................................................................................... 28
Textbook Features ................................................................................................. 34 Project 2061 ..................................................................................................... 35
Aspects of Problems ......................................................................................... 36 Images and Attention-getters ........................................................................... 39 Goals and Development of Concepts ............................................................... 40
Summary .......................................................................................................... 41
Textbooks within a Larger Mathematical System ................................................ 42 TIMSS-95 ......................................................................................................... 43 AIR Study ........................................................................................................ 44
Textbook Use ........................................................................................................ 48 Textbook Use in the Classroom ....................................................................... 49
Textbook Use and Teaching Strategy .............................................................. 50 Textbooks and Learning Comprehension ............................................................. 51
Effects on Learning When the Textbook is Altered......................................... 52 Types of learning inherent in the text .............................................................. 56
Summary ............................................................................................................... 62
3. METHOD ................................................................................................................... 65
Textbook Selection Process .................................................................................. 66 Track Determination ........................................................................................ 67
Year or Level Determination ........................................................................... 68 Textbook Determination .................................................................................. 68
Data Collection ..................................................................................................... 70 Analysis of Coding Scheme .................................................................................. 74 Treatment of the Data ........................................................................................... 80
Page 8
vii
Summary ............................................................................................................... 83
4. RESULTS OF STUDY ............................................................................................... 85 Results from Data Collection ................................................................................ 85
General Features............................................................................................... 85 Problem Features .............................................................................................. 89
5. DISCUSSION ............................................................................................................. 99 Research Questions ............................................................................................. 100
Examination of General Features ................................................................... 100 Examination of Problem Features .................................................................. 106
Future Research .................................................................................................. 115 Significance of Study .......................................................................................... 118
Implications for Practice ..................................................................................... 122 Summary Remarks .............................................................................................. 123
LIST OF REFERENCES .................................................................................................125
APPENDICES .................................................................................................................135
VITA ................................................................................................................................157
Page 9
viii
LIST OF TABLES
TABLE ........................................................................................................................ PAGE
1. Content Examined in AIR Study ................................................................................46
2. Textbook Setup ............................................................................................................69
3. Final Inter-Rater Reliability Coefficients for Categories Coded in Text .....................78
4. Comparison of Data for General Characteristics of the Text ......................................79
5. Number of Problems in each Text ...............................................................................86
6. Singapore Numbers for General Features ....................................................................87
7. United States Numbers for General Features...............................................................88
8. Average Values for General Features for Each Country .............................................89
9. Welch’s t-tests for General Features ............................................................................90
10. Welch’s t-tests for Codes of Problem Features............................................................92
11. Values for χ2 Test of Independence for Problem Features .........................................95
12. Overlap in Glencoe Math Connects Textbooks .........................................................104
Page 10
ix
LIST OF FIGURES
FIGURE ..................................................................................................................... PAGE
1. Major Topics of Beginning Algebra ................................................................................8
2. Linear Functions within Algebra and School Mathematics .............................................9
3. Concept Map for Linear Functions ................................................................................11
4. Example of a Linear Function in Different Representations .........................................25
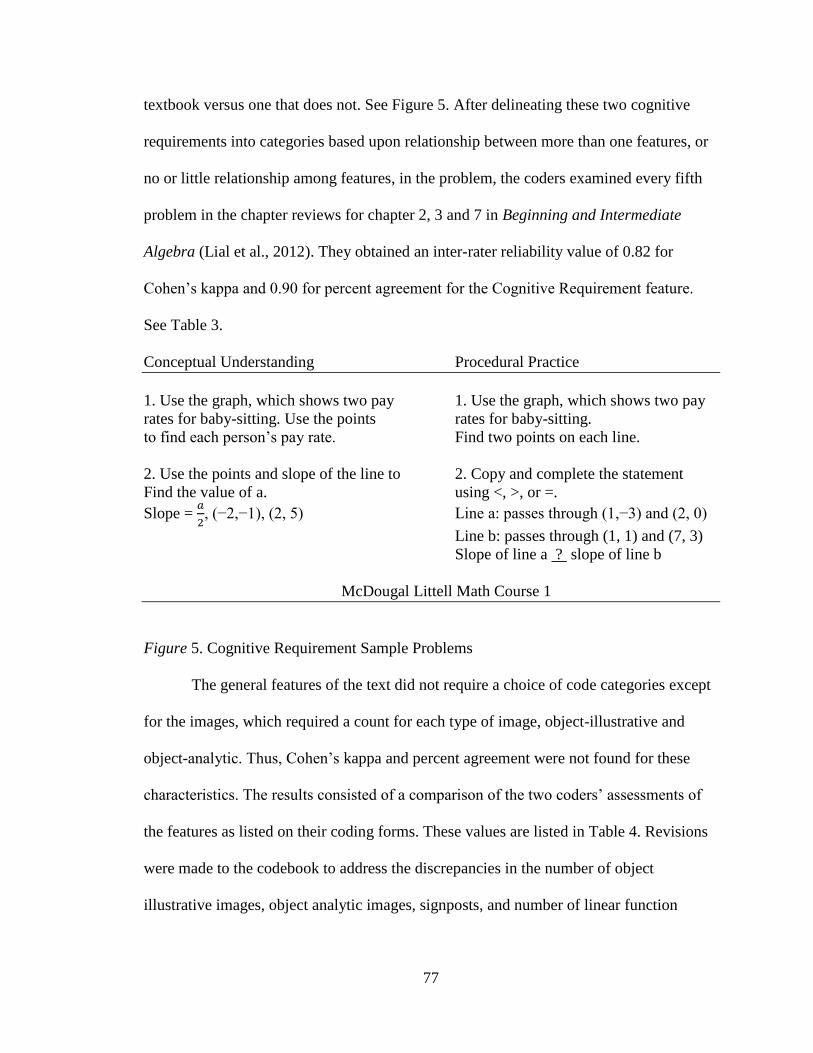
5. Cognitive Requirement Sample Problems .....................................................................77
6. Similarities and Differences of General Features of Textbooks ..................................101
7. Significantly Different Codes for Problem Features ...................................................107
8. U.S. “Other” and “Does Not Apply’ Problems ............................................................111
9. Response Type Sample Problems ................................................................................112
Page 11
1
CHAPTER I
INTRODUCTION
While teaching mathematics classes, such as college algebra, that satisfy college
and university minimum graduation requirements, the researcher observed that many
students do not do well on algebra-related topics. Upon conducting a preliminary
literature search about student success in college algebra in the United States, the
researcher found that based upon meeting ACT’s college readiness benchmarks, only
40% of high school graduates were ready for their first course in college algebra (ACT,
2004). Also, only 34% of eighth graders were projected to be ready for enrollment in
college algebra courses upon high school graduation. By 2009, the number of high school
graduates ready for college algebra was 42% (ACT, 2009). Results from the Nation’s
Report Card—the National Assessment of Educational Progress (NAEP) from 2009
showed that while the percentage of students in eighth grade at or above proficiency
levels was the largest ever for mathematics, this percentage was only 34% (U.S.
Department of Education, 2010b). In 2011, the percentage of eighth graders at or above
proficiency levels on the NAEP had increased to 35% and remained the same in 2013
(National Center for Education Statistics. 2013).
The continuing low achievement in mathematics for most American high school
graduates is a major concern to business, economic, and political leaders, due to the fact
that a “strong grasp of algebra is essential for successful preparation in the contemporary
American workforce” (Fennell et al., 2008, p. 3-1). Additionally, educators are concerned
since college algebra is necessary for entry into higher education and the pursuit of
advanced mathematics in general (Fennell et al., 2008). The lack of proficiency in
Page 12
2
mathematics is also seen as an issue of national safety (Fennell et al., 2008). In the Final
Report by the National Mathematics Advisory Panel, the panel discussed the critical
importance of teaching mathematics in the middle grades, and how this might be pivotal
to achieving the national goal of a mathematically-literate nation (Fennell et al., 2008).
Background
Historically, U.S. students have demonstrated weak performances on state,
national, and international assessments (Kilpatrick, Swafford, & Findell, 2001).
Particularly important to this study, weakness of U.S. middle school students in the area
of mathematics can be seen in the results of assessments such as (a) the eighth-grade
portion of the Third International Mathematics and Science Study of 1995 (TIMSS-95;
Beaton et al., 1996); (b) the Trends in Mathematics and Science Study (TIMSS) in 1999,
2003, 2007, and 2011 (Gonzales et al., 2000; Gonzales et al., 2004; U.S. Department of
Education, 2009; Provasnik et al., 2012); (c) Program for International Student
Assessment (PISA) for 15-year-olds (Baldi, Jin, Skemer, Green, & Herget, 2007; Kelly,
Xie, Nord, Jenkins, Chan, & Kastberg, 2013); and (d) the Nation’s Report Card—the
National Assessment of Educational Progress (NAEP) (Fennell et al., 2008; Lee, Grigg,
& Leon, 2007; National Center for Educational Assessment, 2013; U.S. Department of
Education, 2010b) for eighth-graders. The results showed that U.S. students were below
average or just above average as compared to other nations in the assessments and
showed a lack of proficiency in the area of algebra.
The Third International Mathematics and Science Study (TIMSS) of 1995 showed
that U.S. eighth graders had average mathematics achievement score, 500, below the
mean of the international average mathematics achievement score, 513, across the 41
Page 13
3
nations that took the test (Beaton et al., 1996; Schmidt et al., 2001; Zhu & Fan, 2004).
Students of the same age in East Asian countries had the highest average mathematics
achievement scores with Singapore students having the highest average score, 643, of all
the countries. After 1995, the international comparison continued at 4-year intervals with
the new name, Trends in Mathematics and Science Study (TIMSS). Subsequent TIMSS
tests in 1999 (Gonzales et al., 2000) and 2003 (Gonzales et al., 2004) showed similar
results with U.S. average scores, 502 and 504, slightly above the international TIMSS
scale average of 500, respectively. The TIMSS in 2007 showed some improvement in the
U.S. eighth grade students’ average score as compared to the averages of the 47 other
nations who participated (U.S. Department of Education, 2009). The U.S. average score,
508, was above the average scores of 39 other countries and below the average scores of
eight nations including Singapore. In 2011, U.S. eighth grade students’ average score,
509, remained about the same with 11 education systems scoring higher and 32 nations
scoring below the U.S. score (Provasnik et al., 2012). While these results showed an
improvement in mathematics achievement as compared to other nations since 1995, in
light of the NAEP results and the U.S. status as a business, economic, and higher
education leader, the fact remains that the mathematics achievement in the U.S. needs to
continue to improve.
One topic that U.S. middle school students have difficulty in is the topic of linear
functions. An example of middle school students’ lack of proficiency in the topic of
linear functions can be seen in one of the published results from the Nation’s Report
Card: Mathematics 2007 (Lee et al., 2007). The results demonstrated that 54% of eighth
graders correctly determined a symbolic representation of a linear function when given
Page 14
4
the function in table form, but only 25% of eighth graders were able to identify the graph
of a linear equation. This result is indicative of a more general lack of success of U.S.
middle school students to be able to transition from arithmetic to algebra in topics such as
linear functions (Kilpatrick et al., 2001). On the 2013 Nation’s Report Card assessment,
U.S. students showed improvement in being able to find the symbolic representation of a
line as 67% were able to find the equation of a line when given a table of values
(National Center for Educational Assessment, 2013). However, students still struggled
with some problems pertaining to linear functions as only 20% of students were able to
interpret slope from a verbal description. This lack of proficiency in linear functions by
eighth-graders continues as students proceed to take more advanced mathematics classes
as is evidenced by AP Calculus students’ difficulty with concepts of linear rate of change
(Teuscher & Reys, 2010).
Rationale for a Textual Analysis Concerning Linear Functions
The results from the landmark international comparison study, TIMSS-95, served
as the catalyst for a plethora of studies comparing the educational practices of the nations
participating in the TIMSS-95 (Kaiser, Luna, & Huntley, 1999; Zhu & Fan, 2004).
Within curriculum studies involving these nations, textbooks have been examined in an
attempt to identify differences that could possibly help explain the disparity in
achievement. The results of these studies have suggested that textbooks in countries that
placed at the top of the TIMSS were different than textbooks in the U.S. (Schmidt et al.,
2001). Also, researchers such as Fan (2011) have posited that the first step towards
improving the quality of mathematics education is to know what is in the textbook and to
make comparisons to other textbooks.
Page 15
5
Schmidt and colleagues (2001) examined the mathematics curriculum contained
in eighth-grade textbooks used in the 37 countries, including East Asian countries, which
participated in the TIMSS-95. Schmidt et al. (1997) described the United States’ intended
curriculum as repetitive when compared to the other nations’ curricula and coined the
phrase “a mile wide and an inch deep” (Schmidt et al., 2001,p. 301) to describe the U.S.
curricula. U.S. textbooks and the textbooks of other nations in that study were seen to
have general differences in topics covered. However, Schmidt and colleagues only
examined topics generally without considering individual problems within a topic. This
study was undertaken because it has been noted in the field (Li, 2000) that research that
focuses on the problems pertaining to one particular topic was needed.
Research has also shown the effectiveness of a textual analysis in revealing things
that are unclear in the text (Neuendorf, 2002) and in highlighting aspects of the
curriculum which need to be changed (Schoen & Clark, 2007). Fan and Kaeley (1998)
demonstrated that textbooks affect instructional practices in the classroom. Also,
Österholm (2005) and Tieso (2005) demonstrated that altering the text in the textbooks
students read changes student achievement. The details concerning these studies are
presented in Chapter 2 of this dissertation. In light of research that says that the textbook
is the most widely-used resource in the classroom as obtained from teacher self-reporting
data in the TIMSS-95 report (Schmidt et al., 2001) and from teacher questionnaires in
Singapore (Zhu & Fan, 2002), changes in the text of the textbooks will potentially have
an effect on several aspects of student achievement. Thus, finding out the content and
how that content is presented in a textbook will assist those making curricula changes to
find things in the text which, if altered, may affect what is taught in the classroom and
Page 16
6
what is learned by students. Furthermore, research on curriculum can be complex due to
the interplay of relationships between different curricula such as (a) ideal, (b) intended,
(c) implemented, (d) textbook, (e) tested, and (f) achieved curricula (Usiskin, 2008).
Different research programs are needed to study these different curricula. The researcher
chose to focus on textbook curriculum by doing a textbook comparison in this study.
Additionally, past textual analyses have shown that there are many differences in
elementary textbooks from the U.S. and countries that showed the highest mathematics
achievement on the TIMSS tests (Ginsburg, Leinwand, Anstrom, & Pollock, 2005;
Harries & Sutherland, 2000) and a few, general differences in the middle school texts of
these countries (Schmidt, Houang & Cogan, 2002). The differences found in the middle
school texts were based upon a general examination of topics without considering
individual problems within a topic. Therefore, the researcher has helped make up for this
lack by doing a textual analysis that emphasizes the problems within a particular topic as
suggested by Li (2000). The particular topic that the researcher has chosen to focus on is
linear functions. The reasons why this topic was chosen are presented next.
In the following paragraphs, the researcher presents a visual pathway and
overview of the most critical elements of mathematics in relation to the study. Algebra is
a branch of mathematics that consists of six major topics, (a) symbols and expressions,
(b) linear equations, (c) quadratic equations, (d) functions, (e) algebra of polynomials,
and (f) combinatorics and finite probability (Fennell et al., 2008). Of these six major
topics, the first four are within the curriculum of beginning algebra. Furthermore, three of
the four major topics of beginning algebra have two or more sub-topics that include linear
Page 17
7
functions (see Figure 1). Hereafter, these sub-topics, particularly linear functions, will be
referred to as topics.
A diagram of how linear functions fit into the algebra curriculum is presented in
Figure 2. The diagram was created by considering the details about algebra as seen in K-
12 Mathematics: What Should Students Learn and When Should They Learn It? (Center
for the Study of Mathematics Curriculum, 2007) and Principles and Standards for School
Mathematics (NCTM, 2000). Analysis of Figure 2 shows the topic of linear functions is
pervasive in the subject area of algebra. In Figure 2, algebra is shown to be made up of
general concepts found in the upper-right box and major topics found in the second-from-
the-bottom-right box. The general concepts of algebra represent the essence or nature of
algebra, that is, what algebra is. The major topics of algebra represent the linguistic
vehicles of algebra, that is, how algebra is done. The arrows going from these two
fundamental components of algebra to the middle box on the right-hand side depict that
the general concepts and major topics of algebra both affect the development of the
learning outcomes contained in the box. The arrow coming from this middle box to the
bottom box illustrates that the topic of linear functions intersects with all three of the
components of algebra, the (a) general concepts, (b) major topics, and (c) learning
outcomes. This intersection can be seen in linear functions representation in the major
topics of beginning algebra as listed in the bottom box in Figure 2. The three major
topics, (a) symbols/variables and expressions, (b) equations, inequalities, and systems,
and (c) functions correlate exactly to the major topics listed in Figure 1 when the two
topics linear equations and quadratic equations from Figure 1 are combined in the title
Equations, Inequalities, and Systems in Figure 2. The bottom box of Figure 2, thus,
Page 18
8
Symbols and Expressions
o Polynomial expressions
o Rational expressions
o Arithmetic and finite geometric series
Linear Equations
o Real numbers as points on the number line
o Linear equations and their graphs
o Solving problems with linear equations
o Linear inequalities and their graphs
o Graphing and solving systems of linear equations
Quadratic Equations
o Factors and factoring of quadratic polynomials with integer coefficients
o Completing the square in quadratic expressions
Functions
o Definition
o Linear functions
____________________________________________________________________________________________________________
Figure 1. Major Topics of Beginning Algebra.
a The list was informed by the major topics in school mathematics contained in The Report of the
Task Group on Conceptual Knowledge and Skills from Foundations for Success: Report of the
National Mathematics Advisory Panel (Fennell et al., 2008). The list was created by omitting
topics in Algebra II and adding topics which coincide more directly with the standards from the
state department of education websites in Appendix A.
Page 19
9
Figure 2. Linear Functions within Algebra and School Mathematics.
Page 20
10
shows how the topic of linear functions is pervasive in all the general concepts, major
topics, and learning outcomes within algebra.
Moreover, the representation of linear functions within the major topics of algebra
is more clearly seen as one studies a Concept Map for Linear Functions the researcher
created in Figure 3. The concept map shows the different representational forms of a
linear function and how one can transfer from one representation to another. Also, the
map shows how regardless of the representation, a person can analyze and model real
world situations that are major themes within the major topics of algebra.
Furthermore, the interconnectedness between the general concepts and major
topics is evidenced by the way linear functions are represented within each of the major
topics of algebra. Linear functions is (a) specifically classified under the major topic of
functions, (b) made up linear equations and has linear patterns and relationships within
the major topic equations, inequalities, and systems, and (c) represented by symbols and
algebraic expressions. Thus, linear functions as a topic spans more than one major topic.
Henceforth in this dissertation, the term linear functions will represent the label for the
concepts that are unique to that topic. Note, a formal definition and illustrated example of
linear functions (see Figure 4) are presented in the definition of terms section of Chapter
1.
With the lack of success in algebra by U.S. middle school students and the
importance of this topic to their future mathematical literacy development, the National
Mathematics Advisory Panel began to address this concern of preparation for success in
algebra by examining (a) the major topics of algebra, (b) the skills and concepts needed
Page 21
11
Figure 3. Concept Map for Linear Functions.
for success in algebra, and (c) the sequence of topics needed prior to and while taking
algebra (Fennell et al., 2008, p. 3-2). The Center for the Study of Mathematics
Curriculum
(CSMC, 2007) addressed this issue on a broader scale in a 2007 conference: K-12
Mathematics: What Should Students Learn and When Should They Learn It? Of the four
areas of mathematics that were emphasized in the national mathematics standards
documents the CSMC examined, algebra was the most heavily emphasized area when
excluding the area of statistics.
Page 22
12
While the standards documents reviewed by the CSMC (2007) had different grade
level foci, for example 6-12, K-8, 7-12, each document except for the Guidelines for
Assessment and Instruction in Statistics Education (GAISE) Report allowed for algebra to
be taught within Grades 6-8. The Common Core States Standards in Mathematics
(CCSSM), the voluntary national standards recently introduced to the U.S., also has
algebra being taught in Grades 6-8 (National Governors Association Center for Best
Practices, 2010). Algebra being taught in Grades 6-8 was in consensus with the 1997
nationwide decision to include algebra as a graduation requirement with the goal that all
students will take algebra by eighth grade (Riley, 1997, p. 5). This was due to algebra
being considered a “gatekeeper” of student access to higher mathematics and that taking
algebra in eighth-grade would allow more mathematical literacy in the U.S. (Spielhagen,
2006). The National Mathematics Advisory Panel (Fennell et al., 2008) recommended
that all school districts prepare more eighth-grade students for an “authentic algebra
course” (p. 23) than are currently being prepared. Thus, the trend is for algebra, including
the topic of linear functions, to be taught in eighth grade.
Linear functions is the dominant topic in beginning algebra (Wu, 2001) and is
“primary to the study of algebra” (Cunningham, 2005, p. 74). This can be seen through
its prevalence among the concepts within algebra. Within algebra, functions are a tool to
describe natural phenomena (Fennell et al., 2008). Specifically, linear functions are used
to describe common relationships such as price of gallons of gas at $4.00 per gallon
which can be represented by the linear function . With the increase in
technological tools in the study of mathematics (Garofalo, Drier, Harper, Timmerman, &
Shockey, 2000; Steen, 1990), the study of linear functions has been extended “to include
x
( ) 4f x x
Page 23
13
the data-analysis technique called linear regression” (Garofalo et al., 2000, p. 77). Hence,
another common use for linear functions is finding a line-of-best fit or linear regression
line for a set of data (Garofalo et al., 2000). The line of best fit becomes a helpful and
commonly-used modeling tool. Also, linear functions of the form allow
students to understand proportional reasoning (Fennell et al., 2008).
Linear functions represent the simplest of all functions and are used as a
foundation on which other functions are built (National Council of Teachers of
Mathematics [NCTM], 2000). Not only is the topic of linear functions the foundation for
the study of entire families of functions, that is, quadratic, exponential, and cubic, the
topic also has a place of prominence in the middle school Algebra Standards as presented
by the National Council of Teachers of Mathematics (NCTM, 2000). Linear functions’
prominence in Grades 6-8 is also seen in the recently created Common Core States
Mathematics Standards (National Governors Association Center for Best Practices,
2010).
In the Algebra Standard Expectations section for Grades 6 through 8 in The
Principles and Standards for School Mathematics [PSSM] (NCTM, 2000), the emphasis
is on the study of patterns and relationships related to linear functions. This emphasis is
found in the Expressions and Equations sections of the CCSSM (National Governors
Association Center for Best Practices, 2010). Students are expected to recognize non-
linear functions and then compare them to linear functions. Within the middle school
Algebra Standards of the PSSM (NCTM, 2000), all functions are first distinguished as
linear or nonlinear, and, consequently, all nonlinear functions are then compared and
contrasted to the characteristics, patterns, and appearance of linear functions. Hence, the
( ) , 0f x cx c
Page 24
14
topic of linear functions is considered a “mainstay and an important building block of
secondary mathematics” (Garofalo et al., 2000, p. 77).
The prominence of the topic of linear functions within algebra can also be found
in U.S. Algebra I textbooks as seen from the results of a project on the topic of linear
functions the researcher completed in the spring of 2007. That project entailed the
examination of the topic of linear functions in three U.S. Algebra I textbooks, (a) Algebra
I: An Integrated Approach (Larson, Kanold, & Stiff, 1997), (b) Discovering Algebra: An
Investigative Approach, Teacher’s Edition (Murdock, Kamischke, & Kamischke, 2002),
and (c) Cognitive Tutor Algebra I Student Text, (Hadley, Pflueger, & Covatto, 2006). The
results revealed that the total number of pages which contained the topic of linear
functions/linear equations was approximately 25% of the pages in each text. This
somewhat large percentage of the texts devoted to linear functions suggested that linear
functions is a prominent topic in beginning algebra.
Review of the research on textual analyses (see Appendix B) indicated that the
topic of linear functions has not been widely emphasized in textbook comparisons. There
are not many studies which focus on problems pertaining to the topic of linear functions.
Researchers who have examined middle school curriculum have examined middle school
addition/subtraction problems (Li, 2000; Mayer, Sims, & Tajika, 1995), middle school
instructional criteria (American Association for the Advancement of Science [AAAS],
1999), and general features of the text (Schmidt et al., 2001). Linear functions has been
included as one topic among many in Mesa’s (2004) study in which she characterized
problem types. After Mesa classified the problems by the concepts contained within the
tasks, she reported the percentage of textbooks that contained these problem types. Also,
Page 25
15
Schmidt et al. (2001) examined linear functions as one topic among many in their
examination of textbooks from countries that participated in the TIMSS of 1995.
However, they did not focus on particular problems within the text, but examined broad
categories of topics within texts. Thus, due to the limited amount of research on problems
pertaining to linear functions, the researcher chose to study linear functions.
Rationale for Comparison of Singapore and U.S. Middle School Texts
Preliminary research (Ginsburg et al., 2005; Schmidt et al., 2001) has indicated
that textbooks of the U.S. and countries that scored close to the top of the TIMSS-95, that
is, East Asian countries, differ in various ways. In subsequent years, 2003, 2007, and
2011, East Asian countries continued to score close to the top of the TIMSS (Gonzales et
al., 2004; U.S. Department of Education, 2009; Provasnik et al., 2012). Singapore’s
students consistently demonstrated mathematics achievement above every nation on the
TIMSS eighth-grade tests (Gonzales et al., 2004), until 2007 when Singapore’s average
score was below China’s average score and Korea’s average score (U.S. Department of
Education, 2009). In 2011, only Korea was above Singapore on the eighth grade portion
of the TIMSS (Provasnik et al., 2012). Of these East Asian countries, only Singapore’s
mathematics textbooks are written in English. Thus, Singapore’s textbooks seemed
ideally suited for comparison to the U.S. texts. In summary, because (a) Singapore was
the top-achieving country on the eighth-grade portion of the TIMSS tests until falling to
third in 2007, (b) Singapore’s textbooks are written in English, and (c) previous research
has shown that there are differences in the two nations’ textbooks, the researcher chose to
focus on a comparison of Singapore textbooks to U.S. textbooks with respect to the topic
of linear functions.
Page 26
16
A review of the literature indicated that middle school textbooks from Singapore
and the U.S. have not been widely studied (see Appendix B). Several researchers have
examined elementary textbooks from Singapore and the U.S. (Cai, Lo, & Watanabe,
2002; Ginsburg et al., 2005). Many researchers (Cai et al., 2002; Li, 2000; Mayer, Sims,
& Tajika, 1995; Zhu & Fan, 2004) have compared texts from the U.S. and a country other
than Singapore. Of the studies between Singapore and the U.S. (Ginsburg et al., 2005;
Harries & Sutherland, 2000; Schmidt et al., 2001), two of the three have examined
primary texts, and the third study was a general examination of topics within middle
grades textbooks with no consideration of individual exercise problems. Thus, based on
this body of research, the present study compared a variety of U.S. middle school
textbooks to Singapore textbooks to reveal how Singapore and U.S. textbooks were
similar and different in the middle grade years.
Research Questions
The research questions on which the study was based are:
1. How do the treatments of the topic of linear functions in middle grades
mathematics textbooks of Singapore compare to the treatments of the topic of
linear functions in middle grades mathematics textbooks of the U.S.?
Treatments of the topic refer to the ways linear functions are presented in
general in the text and how the topic is represented in the problems of the text
particularly with regard to the 22 features the researcher examined.
2. What are the similarities and differences of the conceptual types of problems
related to the topic of linear functions within the middle grades mathematics
textbooks of Singapore and the U. S.?
Page 27
17
3. How are problems related to linear functions in middle grades mathematics
textbooks of Singapore and the U.S. different or similar with respect to
computational requirement, context, required response, cognitive requirement,
and given information?
4. Are the characterizations of problem practices as seen in the problems related
to linear functions in middle grades mathematics textbooks from Singapore and
from the U.S. the same or different?
5. How do the problem-solving competency types in the problems related to linear
functions in middle grades mathematics textbooks from Singapore and from the
U.S. compare?
6. How do the types of transfer of representation needed to do the problems
pertaining to linear functions in middle grades mathematics textbooks from
Singapore compare to the types of transfer of representation needed to do the
problems pertaining to linear functions in middle grades mathematics textbooks
from the U.S.?
Theoretical Framework
The theoretical grounding for this study comes from sociocultural theory. From
the work of Vygotsky (Scherba de Valenzuela, 2002), sociocultural theory contains the
idea that human cognition and learning is social and cultural. Lantolf (1994) discussed
Vygotsky’s major theoretical insight that higher forms of human thought are continually
mediated by symbols. This can be observed in mathematics as “functions are the
mathematical tools used to describe the relationships between variable quantities”
(O’Callaghan, 1998, p. 24). Mediation is defined as the “introduction of an auxiliary
Page 28
18
device into an activity that then links humans to the world of objects or to the world of
mental behaviors” (Lantolf, 1994, p. 418). Symbols in textbooks represent these auxiliary
devices. Thus, functions serve as an example of Vygotsky’s symbolic mediation as they
demonstrate how symbolic tools organize and control mental processes. The graphs,
diagrams, and algebraic symbols seen in mathematics are themselves examples of these
symbolic tools through which higher forms of thought are gained. A textual analysis
allows an examination of the use of symbolic tools in a text. Due to the fact that the
symbolic tools in mathematics textbooks are the same in the student edition and teacher
edition, the researcher examined only student editions of the textbook.
Potential Usefulness of Textbook Research
The benefits of textbook analysis on different areas of the education process
including (a) alignment of textbooks to standards documents, (b) textbook content, and
(c) student achievement is presented. The first section contains the historical call to action
to change U.S. mathematics achievement through changing the curriculum including the
textbook. An analysis of the merits of performing a textual comparison follows.
Historical Background
The idea that textbooks affect mathematics achievement is nothing new (Stanic &
Kilpatrick, 2003). At the same time, there has been disagreement over what should be
contained in the textbook. Periodically there have been events that have served as a
catalyst for change in the curriculum such as the Russian’s launch of Sputnik in 1957, the
publishing of A Nation at Risk in 1983 and the publishing of the Curriculum and
Evaluation Standards for School Mathematics in 1989 and the Principles and Standards
of School Mathematics in 1999 (Stanic & Kilpatrick, 2003). In the 1990s, the results of
Page 29
19
the TIMSS-95 (Beaton et al., 1996) and TIMSS-99 (Gonzales et al., 2000) served as a
catalyst for a desire to change the U.S. curriculum. In President Clinton’s (1998) Call to
Action for American Education in the 21st Century, he specifically addressed needed
changes in the curriculum, including in textbooks, as he discussed that the U.S. does not
expect enough of students and only offers a “watered-down and boring curriculum” (p. 7)
and called for a standard of excellence. This call for higher standards was reiterated by
President Bush’s No Child Left Behind Act (NCLB) of 2001 (U.S. Department of
Education, 2001) and continued by President Obama’s Blueprint for Reform: the
Reauthorization of Elementary and Secondary Education Act of 2010 (U.S. Department
of Education, 2010a). Thus, the call for improvement in mathematics achievement scores
through changing the curriculum including in textbooks has been highlighted in the
political arena.
Merits of the Study
The usefulness of the results of a textbook comparison is manifold and is reflected
in past research. Fan (2011) states that the first step toward improving the quality of
mathematics education is to know what is in the textbook. The results of the current
textual analysis assessed the "breadth and depth of the 'intended curriculum' as suggested
by Porter (2002, p. 11) and the opportunities to learn (OTL) the topic of linear functions
within the textbooks. Knowing the content in a textbook can (a) allow taxpayers and
parents to know what content students are taught in U.S. public schools (Porter, 2002),
(b) assist with reconciling state standard documents and textbooks (Porter, 2002), and (c)
be helpful in understanding the differences in scores on international tests such as the
TIMSS and the PISA (Ferrini-Mundy, 2004). Also, research has shown that textbooks (a)
Page 30
20
affect instruction (Fan & Kaeley, 1998; Reys, Reys, & Chavez, 2004 ), (b) are widely
used guides by most teachers (Schmidt, Houang, & Cogan, 2002) including middle-
school teachers (Henning, 1996) and Singaporean teachers (Zhu &Fan, 2002), (c) affect
student achievement (Österholm, 2005; Tieso, 2005), and (d) affect the content and
sequence of the content (Reyes, Reyes, & Chavez, 2004). Hence, a change in textbooks
could theoretically affect the majority of educators within a nation.
Also, Porter (2002) posited that the “content of instruction is an essential variable
in research on factors affecting student achievement” (p. 3). This idea is echoed by the
National Mathematics Advisory Panel’s recommendations to facilitate increased
mathematics proficiency by U.S. students (Fennell et al., 2008). They suggested that “a
focused, coherent progression of mathematics learning, with an emphasis on proficiency
with key topics” (p. 22) for school algebra should be the norm in middle school. Thus,
this textual analysis examined the key topic of linear functions as a first step in evaluating
the progression of mathematics learning in the textbook.
Research has suggested the possibility of student mathematics achievement being
affected by the text. In her study concerning changing the mathematics textbook and
groupings within classes containing gifted students, Tieso (2005) found that student
achievement increased when the textbook was changed. Also, Österholm (2005) saw a
difference in reading comprehension in his study of students’ readings of mathematics
texts with and without symbols. Thus, the differences found in mathematics textbooks
may lead to determining features of the text that may contribute to increased mathematics
achievement.
Page 31
21
To summarize, the merits of the study consist of the information gleaned
concerning the curriculum and OTL as seen within the textbooks. The study highlighted
aspects of the textbook which may affect student achievement. The findings of this study
should be valuable to educators, curriculum developers, publishers, and textbook authors
who wish to improve the mathematics achievement of students in the U.S.
Delimitations of the Study
The researcher chose to de-limit this study to an examination of the textbook,
particularly focusing on the problems pertaining to linear functions as recommended by
Li (2000). The student textbook was chosen as the focus because both student and teacher
texts contain the same problems. An examination of the textbook without considering
other factors such as the classroom environment or instruction allowed the researcher to
focus on the concepts and their presentation as laid out in the problems of the text. This
deliberate focus on problems and a few general features of the text served to yield new
information about textbooks.
Another delimitation to the study was the use of averages within the Welch’s t-
tests rather than the individual values obtained from each textbook. Similarly, another
delimitation was that the values obtained from the general features of the textbook in the
study would change depending upon whether one kept or eliminated a textbook which
did not contain any linear function problems. The researcher chose to keep the textbooks
containing no linear functions in the study because that is what was seen in the textbooks
and because both countries each had a textbook with no linear function problems. The
researcher also chose to examine each textbook in a series as an individual book instead
of grouping the textbooks in a series as one group.
Page 32
22
The researcher examined eight mathematics textbooks from Singapore and nine
textbooks from the U.S. The eight Singaporean textbooks represent three different text
series in the two grade levels, Secondary 1 and Secondary 2, that is seventh and eighth
grade, which contain the topic of linear functions. The nine U.S. textbooks represent
three different text series in Grades 6-8 which contain the topic of linear functions. A
discussion of how these textbooks were selected is contained in the methodology section
in Chapter 3.
The content analysis was used to compare background features of the text
and general and specific features of the problems. The parameters were (a) 13
background features of the text, (b) six general classifications for the problems, (c)
characterization of problem practices, (d) characterization of problem-solving
competency type, and (e) characterization of transfer of representation type. The
background features were represented by such things as the number of types of images,
the number of problems pertaining to linear function, and the total number of pages in the
text. Lists and descriptions of all 13 general features, as well as the other features
examined, are in Appendices C and D. The problems were designated by a mathematical
feature, a contextual feature, a response-type feature, a cognitive requirement feature, a
given-information feature, and an application type feature. More specific characterization
of the problems addressed problem practices, problem-solving competency types, and
transfer of representation types.
The next section contains definitions that were important to this study. Following
these definitions is an overview of the study. The chapter concludes with a description of
the content of the remaining chapters.
Page 33
23
Definition of Constructs
International comparison test. This is a test that is taken by several countries for
the purpose of comparing the achievement of students on an international level. The
TIMSS test consisted of a 90 minute test containing problems created by experts from
each country participating in the study. The problems consisted of multiple choice and
free-response items which represented a wide range of mathematics topics and skills.
(Beaton et al., 1996)
East Asian countries. Countries that share a geographic location, a similar
cultural tradition, and have done well on the TIMSS tests are the East Asian countries
referred to in this study. The cultural traditions stem from the Chinese/Confucian
tradition (Graf & Leung, 2000). These countries are Singapore, Korea, Japan, Hong
Kong, China, and sometimes Taiwan. (Beaton et al., 1996).
Treatments of the topic. The ways linear functions are presented in the text. This
includes how the topic is presented in general in the text and how the topic is represented
in the problems of the text particularly with regard to the 22 features the researcher has
chosen to examine in the study. There are 13 background features and six general
classifications of problems, and three conceptual types that will be examined. See
Appendix C for more details.
Conceptual types. Types of concepts the students are asked to use within the
problems in the text in order to answer the problem. These specifically refer to the
problem practices, problem-solving competency types, and the transfer types that will be
classified for each problem in the text. The problem practices are delineated into six types
of practice inherent in the form the linear function as given in the problem. These
Page 34
24
problem practices are (a) symbolic rule, (b) ordered pair, (c) social data, (d) physical
phenomena, (e) controlling image, or (f) other. The problem-solving competency types
refer to what the student must know how to do to solve the problem. The problem-solving
competency types are (a) modeling, (b) interpreting, (c) translating, (d) reifying, or (e)
does not apply. The transfer types refer to the type of transfer necessary as a student
moves from one type of mathematics representation in the question to a different
mathematical representation for the answer. Descriptions of these transfer-types are in
Appendix D.
Spiral approach. Spiral approach is the practice of covering a topic in successive
years. One can use this procedure to deepen the understanding of a concept.
Linear functions. A linear function is a function with the property that each
number for one variable (usually the x) has exactly one value for the other variable
(usually the y) of the form ,y ax b where a and b are real numbers. An alternate
form is ( ) ,f x ax b where a and b are real numbers, which is used to emphasize that
y is a function of x and y is replaced with ( )f x . There are many ways of representing
a function: (a) symbolically (an equation), (b) graphically (a line), (c) numerically (table,
patterns, or ordered pairs), and (d) verbally (written or spoken explanation of linear
relationship). Figure 4 provides an example of a linear function, f(x) = 2x – 2, in three
different representations. A second alternative form of a linear function is the linear
equation Ax By C where , ,A B and C are real numbers such that not both A and B
are zero. To use the second form, there must be an explicit understanding that there is a
relationship between and such that for every there is exactly one . Thus, x y x y
Page 35
25
Symbolic
representation
Graphical
representation
Numerical (or
tabular)
representation
- 4 - 6
-1 -4
-0.5 -3
0 -2
1 0
1.5 1
2 2
3 4
4 6
Figure 4. Example of a Linear Function in Different Representations.
( ) 2 2f x x
8
6
4
2
-2
-4
-6
-10 -5 5 10
(-0.5, - 3)(0, - 2)
(0.5, - 1)
(1, 0)
(1.5, 1)
(2, 2)
y axis
x axis
f x = 2x-2
x ( )f x
Page 36
26
is not considered a linear function unless the text has already defined the
equation to be an equation in two variables and the context is clear that y is a function of
x .
Overview of the Study
The research on textbooks has demonstrated that the textbook affects mathematics
achievement directly (Österholm, 2005; Tieso, 2005) and potentially (Fan & Kaeley,
1998; Schoen & Clark, 2007). From the TIMSS results (Schmidt et al., 2001), President
Clinton’s (1998) address, Bush’s NCLB (U.S. Department of Education, 2001), and
Obama’s ESEA: Blueprint for Reform (U.S. Department of Education, 2010a), the need
for improved mathematics achievement of students in the United States has been
documented. The purpose of the study was to compare treatments of the topic of linear
functions in Singapore and U.S middle grades mathematics textbooks. The sections
pertaining to the topic of linear functions were examined in 14 Singaporean mathematics
textbooks (five titles in two grade levels) and nine mathematics U.S. textbooks (three
titles in three grade levels). Thirteen general features were assessed in the textbooks. The
individual problems were classified in terms of six general problem features. Also,
problems were characterized in terms of practices, competency type, and transfer of
representation type.
Overview of Remaining Chapters
In Chapter 2, the researcher presents a review of literature that is pertinent to a
textbook comparison focused on the topic of linear functions. The methodology is
presented in Chapter 3. Within Chapter 4, the researcher presents the findings. A
8 7 5x y
Page 37
27
discussion pertaining to the findings of the study and suggestions for future research on
textbook comparisons is presented in Chapter 5.
Page 38
28
CHAPTER II
REVIEW OF LITERATURE
In this study, the researcher compared the treatments of the topic of linear
functions in middle grades mathematics textbooks within the countries of Singapore and
the U.S. This chapter begins with background information pertaining to the details of the
textbook comparison. Next, four categories of research most pertinent to the mathematics
textbook comparison are highlighted. The four areas are (a) textbook features, (b)
textbooks within a larger mathematics system, (c) textbook use, and (d) textbooks and
learning comprehension. The chapter ends with a summary of the literature with respect
to the study. A synopsis of the textbook comparison literature including (a) the
characteristics examined, (b) the countries involved, (c) the level of schooling examined,
(d) the name of the researcher(s), and (e) the publication date is in Appendix B.
Background
During the 1970s, 1980s, and 1990s, research and state, national, and international
assessments demonstrated a weakness in the mathematics performance of U.S. students
(Beaton et al., 1996; Gonzales et al., 2000; Gonzales et al., 2004; Kilpatrick et al., 2001).
Students in pre-K through eighth grade struggled to obtain proficiency with rational
numbers, proportions, and transitioning from arithmetic to algebra (Kilpatrick et al.,
2001). This weakness in mathematics continued into the twenty-first century as is
demonstrated in results from various assessments. For example, the Program for
International Student Assessment (PISA) 2009 revealed that the average score of U.S. 15-
year-olds in the mathematics assessment was below the average score of the 34 countries
belonging to the Organization for Economic Cooperation and Development (OECD)
Page 39
29
(Fleischman, Hopstock, Pelczar, & Shelley, 2010). Also, Fleishman and colleagues
(2010) presented the fact that the U.S. average scores in mathematics have been below
the OECD average scores in previous PISA assessments in 2003 and 2006. In 2009, the
percent of U.S. 15-year-olds who could perform higher level mathematics was 27%
which was less than the 32% of students in the OECD countries who on average could
perform at this level. However, the results for 2009 showed that the percentage of
students in the U.S. and the other OECD countries who performed at a “baseline level”
(Fleishman et al., 2010, p. iv.) of mathematics literacy was the same, 23%.
The results of another international comparison test, the Third International
Mathematics and Science Study of 1995 (TIMSS-95) showed that U.S. eighth graders
had a mediocre average mathematics achievement score below the international mean
among the 37 nations that took the test (Beaton et al., 1996; Zhu & Fan, 2004). Students
of the same age in East Asian countries had the highest average mathematics-
achievement scores with Singapore students having the highest average of all the
countries. On subsequent eighth grade TIMSS tests, the Trends in International
Mathematics and Science Study of 1999 (TIMSS-99) and of 2003 (TIMSS-03),
Singapore continued to have the top average mathematics achievement scores of all the
nations, while the U.S. continued to maintain scores below (Gonzales et al, 2000) or
slightly above (Gonzales et al., 2004) the international mean. On the Trends in
International Mathematics and Science Study of 2007, U.S. eighth-graders showed an
increase in the U.S. average mathematics achievement score as compared to the 47 other
nations who participated (U.S. Department of Education, 2009). The U.S. average score
was above that of 39 other countries. This improvement on an international scale is
Page 40
30
tempered by results from the Nation’s Report Card—the National Assessment of
Educational Progress (NAEP) from 2009 which showed that while the percentage of
students in eighth grade at or above proficiency levels was the largest ever in
mathematics, this percentage was only 34% (U.S. Department of Education, 2010b). In
2011, the percentage of eighth graders at or above proficiency levels on the NAEP had
increased to 35% and remained the same in 2013 (National Center for Education
Statistics. 2013).
Another test taken nationally, the ACT, examines college readiness, particularly
with regard to algebra topics. In 2004, the ACT found that, based upon meeting ACT’s
college readiness benchmarks, only 40% of high school graduates were ready for their
first course in algebra, while only 34% of eighth graders were estimated to be ready for
college Algebra upon high school graduation (ACT, 2004). By 2009, the number of high
school graduates ready for college algebra was 42% (ACT, 2009). Thus, while U.S.
students may be improving in relation to other nations, the fact remains that the majority
of students struggle with algebra topics.
Results from the Nation’s Report Card: Mathematics 2007 (Lee et al., 2007)
reveal U.S. middle school students struggle with the topic of linear functions within the
area of algebra. Although 54% of eighth graders correctly determined a symbolic
representation of a linear function when given the function in table form, only 25% of
them were able to identify the graph of a linear equation. On the 2013 Nation’s Report
Card assessment, U.S. students showed improvement in being able to find the symbolic
representation of a line as 67% were able to find the equation of a line when given a table
of values (National Center for Educational Assessment, 2013). However, students still
Page 41
31
struggled with some problems pertaining to linear functions as only 20% of students were
able to interpret slope from a verbal description. This difficulty with the topic of linear
functions persists into future mathematics classes as evidenced by the finding that
students in AP Calculus continue to struggle with the concept of linear rate of change
(Teuscher & Reys, 2010).
Although U.S. students are not proficient in working with linear functions, the
topic is considered a “mainstay and an important building block of secondary
mathematics” (Garofalo et al., 2000, p. 77). The place of linear functions in secondary
mathematics and algebra in particular was presented in Figure 2 within Chapter 1. The
importance of algebra, including the topic of linear functions, is also marked by its
representation on national assessments (Lee et al., 2007). For example, problems
involving algebra topics including linear functions represent 30% of the problems on the
2009 national eighth-grade mathematics assessment, Nation’s Report Card: Mathematics
2009 (NCES, 2009). The representation of linear functions in the algebra curriculum as
seen in U.S. Algebra I textbooks (Larson, Kanold, & Stiff, 1997; Murdock, Kamischke,
& Kamischke, 2002; Hadley, Pflueger, & Covatto, 2006) underscores the prevalence of
linear functions within algebra. For instance, the researcher completed a class project in
the spring of 2007 involving the examination of three U.S. Algebra I textbooks, (a)
Algebra I: An Integrated Approach (Larson et al., 1997), (b) Discovering Algebra: An
Investigative Approach, Teacher’s Edition (Murdock et al., 2002), and (c) Cognitive
Tutor Algebra I Student Text, (Hadley et al., 2006) with respect to linear functions. The
results revealed that 25% of the pages in each text contained the topic of linear functions.
Page 42
32
Within the middle school Algebra Standards of the NCTM, the topic of linear
functions is heavily emphasized (NCTM, 2000). Also, three other national mathematics
standards documents, Middle School Model Two-Year Course Sequence (Achieve, Inc.,
2008), College Board Standards for College Success: Mathematics and Statistics
(College Board, 2006), and Curriculum Focal Points for Prekindergarten Through Grade
8 Mathematics: A Quest for Coherence (NCTM, 2006), present this heavy emphasis on
the topic of linear functions in the middle school curriculum. In recent years, the
coverage of linear functions in textbooks has expanded to include the “data analysis
technique called linear regression” (Garofalo et al., 2000, p. 77). The importance of linear
functions in the curriculum seems to be increasing yet, in view of poor national and
international assessment scores, the proficiency of U.S. mathematics students on the topic
does not appear to be improving.
Historically, the results from TIMSS-95 and TIMSS-99 were the catalyst for a
plethora of studies comparing the educational practices of the nations participating in the
TIMSS (Kaiser et al., 1999; Zhu & Fan, 2004). In curriculum research, there are many
curricula to consider, such as the intended curriculum, the implemented curriculum and
the textbook curriculum; each of which has a different research program. Within the
curriculum studies involving these nations, the textbook was examined in an attempt to
identify differences that could possibly help explain the disparity in achievement. The
results of these studies suggested that textbooks in countries that placed at the top of the
TIMSS were different than textbooks in the U.S. (Schmidt et al., 2001). Finding out what
is in a textbook and comparing it to other textbooks is the first step in improving the
Page 43
33
quality of mathematics education (Fan, 2011). A synopsis of the research considered in
this chapter follows.
The first area of research in this chapter consists of research done on the content
of the textbook. Instructional criteria along with depth of coverage (AAAS, 1999),
various types of problems (Li, 2000; Zhu & Fan, 2004), images (Harries & Sutherland,
2000), specific references to text (Harries & Sutherland, 2000), arithmetic average (Cai et
al., 2002), and lessons (Mayer et al., 1995) have been compared in textbooks. The topic
of linear functions is absent from these textbook content comparisons.
The second area of research pertains to textbooks within a larger mathematics
system. Some researchers have indicated that taking one feature of a nation’s educational
system and transplanting that one feature into another culture may not produce increased
mathematical learning (Ginsburg et al., 2005; Uttal, 1996). Ahuja (2006), Ginsburg and
Leinwand (2008), and Schmidt et al. (2002) concurred that several features within a
mathematics system such as “mathematics frameworks, textbooks, assessments, and
teachers” (Ginsburg et al., 2005, p. ix), must be addressed if the U.S. is to have a world-
class mathematics system. However, an examination of the studies that looked at
mathematics textbooks in connection to a mathematical system reveals differences in
U.S. primary/elementary textbooks as compared to other nations’ primary textbooks with
respect to general features of the text. According to Fan (2011), finding the content in a
textbook and comparing content within textbooks is the first step in improving the quality
of mathematics education.
The third area consists of studies which examine textbook use in the classroom.
Textbook use has been examined in many different ways (Fan & Kaeley, 1998; Haggarty
Page 44
34
& Pepin, 2002; Leung, 1995; Porter, 2002; Reys, Reys, & Chávez, 2004; Schmidt et al.,
2002). The research presented demonstrates that teachers’ practices can be affected by
the textbook (Fan & Kaeley, 1998).
The last area of research on mathematics textbooks consists of studies that
consider the text and learning comprehension. This research demonstrates the different
types of learning that can be affected by the textbook. This section contains studies about
reading comprehension of mathematical texts (Österholm, 2005), schemata knowledge
(Steele, 2005), conceptualizations of functions (Cunningham, 2005; Mesa, 2004;
O’Callaghan, 1998), and effects on mathematics achievement due to changing the
textbook with or without a change in the classroom grouping (Tieso, 2005). Determining
how textbooks affect the learning of mathematical concepts may allow changes in texts
that could cause greater mathematical achievement.
Textbook Features
In part due to the results of the TIMSS of 1995 and 1999 that compared the
average mathematics achievement of students in 37 nations and 38 nations, respectively,
textbook comparisons were abundant in the late 20th
century and early 21st century
(Desimone, Smith, Baker, & Uneo, 2005; Kaiser et al., 1999; Menon, 2000). These
comparisons considered different types of textbooks, textbooks within different nations,
and different features of the text such as content-topic coverage and individual problems.
In these comparison studies, researchers have provided evidence to indicate that U.S.
textbooks need to be changed if students are to learn algebra concepts. Also, researchers
have tried to determine the factors in the East Asian textbooks that contributed to these
Page 45
35
countries’ good showing in the TIMSS (Desimone et al., 2005). An examination of these
studies follows.
Project 2061
The American Association for the Advancement of Science (AAAS) (1999)
compared 13 U.S. middle school mathematics textbooks in regard to the depth of
coverage and quality of instructional support. The 13 textbooks were delineated into two
categories, “best-sellers” and new texts based upon recent research. They examined the
texts’ treatment of six benchmarks representing three important mathematical content
strands: number, geometry, and algebra. These benchmarks were taken from Project
2061’s Benchmark for Science Literacy created in 1993. The benchmarks included four
concept benchmarks dealing with (a) fractions and operations on them, (b) graphing, (c)
equations, and (d) properties of shapes and two skill benchmarks dealing with equivalent
forms of numbers and computations of circumference, area, and volume. In order to
examine the depth of coverage for each benchmark in the text, analysts identified
textbook activities that addressed all or part of the content in a benchmark. Once an
activity was recognized as representing one of the benchmarks, the activity was then
analyzed in regard to one of 24 instructional criteria divided into seven broad categories.
These categories were (a) identifying a sense of purpose, (b) building on student ideas,
(c) engaging students in mathematics, (d) developing mathematical ideas, (e) promoting
student thinking, (f) assessing student progress, and (g) enhancing the learning
environment.
The researchers (AAAS, 1999) found that none of the textbook series covered all
of the concepts and skills for the six benchmarks. Only five of the thirteen textbook
Page 46
36
series covered four or more of the benchmarks in depth. Number and Geometry skills
were covered in depth in all but one textbook series, while the concept benchmarks were
inconsistently and most often insufficiently covered in the textbooks. The Algebra
Equation Concepts were covered in depth by seven of the thirteen textbook series while
algebra graph concepts were covered in depth by only two of the textbook series. Only
four of the textbook series had a median rating in the satisfactory range for all 24
instructional criteria.
The results for the AAAS (1999) study on middle school textbook series indicated
the need for continued examination of the U.S. middle school textbooks. Only four series
were rated as excellent middle-grades mathematics textbook series. The concept
benchmarks in Algebra (Equation and Graph) were found to be inconsistently and most
often partially or minimally covered. The study itself only rated the content coverage in
general terms, (a) most content, (b) partial content, and (c) minimal content. The
proposed study will examine middle grades textbooks with respect to specific content
coverage of the topic of linear functions including representations in equation and graph
forms.
Aspects of Problems
Li (2000) examined how the textbooks from a mediocre-performing country and a
high-level-performing country, with respect to international comparison tests, differ. He
compared U.S. and Chinese mathematics textbooks. Li examined integer addition and
subtraction problems that had no accompanying solutions or answers given in five U.S.
seventh grade textbooks and four comparable level Chinese textbooks. He did this by
considering three aspects of the problems, (a) the mathematical feature—single (s) or
Page 47
37
multiple (m) computation procedure(s), (b) the contextual feature—numerical/word form
(pm) versus illustrative, that is,, pictorial/story, form (ic), and (c) the two-pronged
performance requirements feature that consisted of a response type as well as a cognitive
requirement. The response type was divided into numeric answer only (A), numeric
expression only (E), and explanation or solution required (ES). The cognitive
requirement was one of the four cognitive tasks: procedural practice (PP), conceptual
understanding (CU), problem solving, (PS), or special requirement (SR). Li coded each
problem from all textbooks in terms of the three dimensions. Coding by a second
independent rater yielded a 93% inter-rater agreement.
Li’s (2000) findings were that the two countries had the same percentage of
problems (80%) that required a single computation procedure and had similar
percentages of problems (87% for the U.S. and 90% for China) that had a purely
mathematical context. However, the performance requirement yielded more varied
results, as Li determined that U.S. textbook problems contain a wider variety of problem
requirements and more conceptual problems than Chinese textbook problems. This
observation was made from the percentages of problems requiring explanations, 19% for
the U.S. and 0% for China, and problems requiring conceptual understanding, 26% for
U.S. and 16% for China. To do his study, Li had to examine the addition and subtraction
problems to see which ones contained integers and which ones did not. He found that
99% of the U.S. and 64% of the Chinese addition and subtraction problems contained
integers. From this data, he concluded that Chinese texts may contain a higher level of
mathematical content due the higher percentage of problems not using integers in the
problems. Li suggested that future studies on textbooks should include comparisons of
Page 48
38
both mathematical problems as well as broad aspects of the text such as content-topic
coverage.
Also, Zhu and Fan (2004) conducted a study on the types of problem
representations in Chinese and U.S. mathematics textbooks from seventh and eighth
grade. The most popular series of mathematics textbooks in Junior High in China and the
University of Chicago School Mathematics Project (UCSMP) series mathematics
textbooks in the U.S. were chosen to be compared. Problems, defined as “a situation that
requires a decision and/or answer, no matter [if] the solution is readily available or not”
(Zhu & Fan, 2004, p. 3-4) [I added the “if”]. Zhu and Fan (2004) classified problems with
respect to seven variables: (a) routine versus non-routine, (b) traditional versus non-
traditional, (c) open-ended versus closed-ended, (d) application versus non-application,
(e) single-step versus multi-step, (f) sufficient data, extraneous data, and insufficient data,
and (g) pure mathematical form, verbal form, visual form, and combined form. They used
content analysis to code the problems into one category for each of the seven variables.
Quantitative and qualitative methods were used to identify the similarities and differences
within the texts. They found that the total number of problems varied with the U.S. text
having almost twice as many problems, 13,286, as the Chinese text, 6,850. The ratio of
exercise problems, located in the text part, to text problems, located in the exercises
section, was 7:1 for China and 10:1 for U.S. The majority of problems in both textbooks
were classified as traditional, 96.8% for the U.S. and 98.8% for China, while 97.2% of
U.S. problems versus 99.5% Chinese problems were classified as routine. Closed-ended
problems accounted for 98.1% for Chinese problems and 93.4% for U.S. problems while
63% of U.S. problems and 52% of Chinese problems were one-step problems. Also, 1%
Page 49
39
of U.S. and 8% of Chinese problems were classified as authentic application problems.
The results indicated that there were not many differences in the types of problems within
the countries’ textbooks.
Images and Attention-getters
Another study involving textbook feature comparisons was conducted by Harries
and Sutherland (2000). They examined the way images of mathematical operations are
represented in primary textbooks from five countries including Singapore and the U.S.
They distinguished two categories of images: object-illustrative images and object-
analytic images. Object-illustrative images represent objects in the problem with no
relationship to the mathematical structure while object-analytic images represent the
mathematical structure of the problem. Examples would be a picture of a birthday cake
(object-illustrative) versus using the candles to show that two candles plus three candles
makes five candles (object-analytic). They found that while the images in the Singapore
texts emphasized the mathematical concepts and structure, the images in the U.S. text did
not illustrate the mathematical concept or structure being taught. In fact, they purported
that the images in the U.S. text at times seemed to be a distraction for students.
The results concerning the images within the text by Harries and Sutherland
(2000) were similar to findings of a study done by Mayer et al. (1995). Mayer et al.
(1995) compared lessons on whole number addition and subtraction in Japanese and U.S.
seventh grade textbooks. They specifically examined the number of worked-out
examples, explanations, relevant illustrations, irrelevant exercises, and exercises in
corresponding lessons within three Japanese textbooks and four U.S. textbooks. They
found that the U.S. textbooks contained 19% illustrations that were irrelevant to the
Page 50
40
lessons while the Japanese textbooks contained 0% illustrations irrelevant to the lessons.
Thus, the U.S. seventh-grade mathematics textbooks were found to differ from Japanese
textbooks in regards to illustrations. Similarly, Harries and Sutherland showed that U.S.
primary texts differed from Singapore texts with respect to illustrations. This difference
has not been documented with respect to middle school texts from Singapore and the U.S.
Another observable difference between the U.S. and Singaporean primary texts
was the use of specific references to the mathematical concepts that the images were
representing (Harries & Sutherland, 2000). The Singaporean texts made some specific
references to the mathematical concepts while the U.S. texts made little direct reference
to the mathematical concepts. In discussing research concerning issues involving transfer
of learning from one problem to another, Anderson, Reder, and Simon (2000) discussed
the importance of drawing the attention of the students to key ideas. They concluded that
“instruction and training on the cues that signal the relevance of an available skill might
well deserve more emphasis than they now typically receive” (p. 8).
Goals and Development of Concepts
Cai et al. (2002) studied the treatments of learning arithmetic average in the
teacher and student editions of sixth-grade mathematics textbooks in Asian elementary
schools and U.S. middle schools. Three East Asian series: a China series, a Japan series,
and a Taiwan series, were compared to two NSF-funded reform-based curricula texts and
one “commercial” curriculum text. Cai et al. focused on four features within the text.
These features were (a) the grade level the concept was introduced, (b) the kinds of
learning goals specified, (c) how the concept was introduced and developed, and (d) the
kinds of practice problems, worked-out examples, and activities included in the text. In
Page 51
41
this qualitative study, Cai et al. (2002) established categories to describe the types of
meaning they observed in the textbook problems.
The practice problems and worked-out problems were classified into three
categories (Cai et al., 2002). These categories were distinguished by three types of
understanding about the arithmetic average: procedural understanding as an algorithm,
conceptual understanding as an algorithm, or conceptual understanding as a statistic (a
mean). The analyses and comparisons were done with respect to one curriculum as well
as across the curriculum series. The researchers provided appendices with the collected
data and examples of how the problems were classified. They then discussed in a
narrative manner the approach to arithmetic average they saw in each of the textbooks.
They found that all three East Asian texts and the U.S. “commercial” series focused on
average as an “’evening out’ or ‘equal shares process’”, that is, as a computational
algorithm. The two U.S. reform texts focused on the statistical meaning: the mean as a
statistic, used to describe, make sense of, and compare data sets (p. 398). The U.S. reform
texts presented the “evening out” process initially to introduce an algorithm for finding
an average before moving to the statistical focus of average. The examples, practice
problems, and activities within the texts demonstrated the different types of meaning that
each text expected a student to learn. Determining the types of learning contained in the
problems in different texts may help delineate the differences in student learning based
upon the text itself.
Summary
The studies presented in this section demonstrate that U.S. textbooks were lacking
with regards to helping students learn algebra and differed in approach to various
Page 52
42
mathematics topics as compared to other countries’ textbooks. The topic of linear
functions was not examined specifically by any of these researchers. Li (2000) and Zhu
and Fan (2004) recommended that further research should be done on particular problem
features to determine the kind of content in textbooks that may increase mathematical
achievement. Two features that have not been examined in middle school textbooks are
images and drawing attention to important features in the text, that is, attention-getters.
These two features, as well as other features presented in this section, were examined
with respect to the topic of linear functions in this study.
Several of the textbook features reviewed in the literature also have been
examined in consideration of both the textbooks and the mathematical systems within
different nations. The combining of these features gives a more comprehensive
understanding of how textbooks affect mathematics achievement. These studies are
presented in the next section.
Textbooks within a Larger Mathematical System
Within curriculum studies involving the nations from the TIMSS studies, the
textbook has been examined as only one of many aspects of the mathematical system
(Ahuja, 2006; Ginsburg et al., 2005; Schmidt et al., 2002). These researchers contended
that if the U.S. wants to have a world-class mathematics system, several features of the
system must be addressed. These features were identified as teacher training, teacher
practices, textbooks, assessment, and a clear, coherent framework of standards and
curriculum. Also, Ahuja (2006) included the need to make teaching a recognized
profession with salary and benefits commensurate to other professionals. While these
studies examined many aspects of curriculum, the results revealed details concerning the
Page 53
43
textbook curriculum in particular. The results showed that textbooks in countries that
placed at the top of the TIMSS were different than textbooks in the U.S. (Ahuja, 2006;
Ginsburg et al., 2005; Schmidt et al., 2001). These studies and their results are discussed
below.
TIMSS-95
Schmidt and colleagues (2001) examined the mathematics curriculum contained
in eighth-grade textbooks within the 37 countries, including East Asian countries, that
participated in the TIMSS-95 by looking at (a) content standards, (b) textbook space for
each topic, (c)”percentage of teachers who cover various topics” (p. 101), and (d)
“percentage of time that teachers indicate that they allocate to various topics” (p. 101).
They performed a general study of the topics, that is, a categorical grouping of concepts
or “subareas within the subject matter” (Schmidt, McKnight, & Raizen, 1997, p. 2). Their
results were summarized in the article “A Coherent Curriculum: The Case of
Mathematics” (Schmidt et al., 2002). They found four things to be true of the U.S.’s
intended curriculum as is evidenced in their textbooks when compared to other nations in
the TIMSS study. The U.S.’s intended content is (a) unfocused, (b) very repetitive, (c)
lacking rigor, and (d) “incoherent” (Schmidt et al., 2002, p. 3). Schmidt et al. (2001)
coined the description that America’s curricula are “a mile wide and an inch deep” (p.
301) due to the vast number of topics contained in the U.S. textbooks and the number of
topics that are actually presented in the classroom. The topics were also presented as
random “laundry lists of seemingly unrelated, separated topics” in the U.S. curriculum
(Schmidt et al., 2002, p. 3).
Page 54
44
There were limitations to the study (Schmidt et al., 2002), however, as the
researchers only determined the coverage of 44 topics without delving into the details of
the problems within the topics. Another limitation was the countries’ abilities to meet the
sampling standard requirement for the study (Holliday, 2005); even the U.S. could not
meet this requirement. Despite the limitations to the study, the results showed differences
in the U.S. textbooks as compared to textbooks from other nations. However, the TIMSS-
95 study only examined topics generally without considering individual problems within
a topic. Research that focuses on the problems pertaining to one particular topic is needed
(Li, 2000).
The differences found in the U.S. mathematics educational system by Schmidt et
al. (2001) were reiterated by Ahuja (2006) as he discussed the findings in comparisons
between U.S. and Singapore primary texts. Ahuja compiled and gave a clear presentation
of specific features of the textbooks that have been examined by other researchers. These
features included the appearance of the text, that is, illustrations and their use in the text,
and issues concerning types of problems, such as process versus conceptual learning and
simple routine problems versus deep, multi-step problems. For the overall layout of the
curriculum, he reiterated the lack of focus of the curriculum and attributed the difference
to state versus national standards. Some of the information that Ahuja compiled came
from the comprehensive study of mathematical systems, a discussion of which now
follows.
AIR Study
The American Institutes for Research (AIR) (Ginsburg et al., 2005) completed a
thorough comparison of U.S. elementary mathematics texts to Singapore elementary
Page 55
45
mathematics texts. In this study, researchers not only compared the primary textbooks of
these two countries but examined their educational systems as well. The textbooks
examined were Primary Mathematics, the only elementary text in Singapore, and the
Scott-Foresman Addison-Wesley Mathematics (2004) yearbook series for grades 1-6, and
the Everyday Mathematics textbook series (Everyday Learning Corporation, 2001) for
grades 1-6. Ginsburg et al. (2005) compared the two nations’ textbooks with regard to
structure, approach, and content. These were examined by looking at the mathematical
content at three levels: (a) the textbook level, (b) the lesson level, and (c) the
problem/exercises level. Table 1 shows the focus for each level. Singapore had many
more pages per lesson, 15 pages versus two to four pages, and fewer lessons per year to
cover, 30 lessons versus 150 lessons, than either U.S. text. The examination of the texts at
the lesson level revealed the differences in the spiral approach in the two countries. The
U.S. goes over the same material again and again, while Singapore revisits material only
to increase the depth of knowledge for that concept. Woodward and Ono (2004)
described Singapore’s spiral approach in the statement, “Over the years, the texts follow
a ‘concentric ring’ pattern, with each new grade level providing greater depth on a topic”
(pp. 5-6).
The qualitative discussion of the lesson level began with a general overview of
how the Singapore text started with pictorial representations to introduce a concept
(Ginsburg et al., 2005). Immediately following was a learning task that also included
representations to further teach the mathematical concepts. Abstract teaching came later
after students had developed a concrete understanding of the ideas. Ginsburg and
Leinwand (2008) has commended this technique, labeled “Singapore’s Concrete-
Page 56
46
Table 1
Content Examined in AIR Study
Level Focus
Textbook Space organization by number of pages, of chapters, and of lesson,
number of pages by type (development, exercises, other), and average of
pages per lesson
Lesson Percentage of content strand coverage by grade, topic coverage by grade
comparison of three specific lessons among texts
Problem Comparison of exercises in three topic areas with regard to (a) number of
steps to arrive at solution, (b) necessity of the use of an unknown
intermediate variable to solve problem, and (c) the use of routine or
non-routine strategy or approach to a solve the problem
pictorial-abstract approach” (p. 270), which is used to help students with the learning of
mathematical abstractions. The U.S. textbook was unable to give as much exposure to a
concept due to the necessity of covering so many topics (Schmidt et al., 2001). The U.S.
students were only exposed to a small amount of time for each concept. A detailed
examination of three types of selected problems yielded the conclusion that U.S.
textbooks contained more routine exercises than the Singapore text (Ginsburg et al.,
2005). However, also, they found that the nontraditional U.S. text presented interesting
real-world problems and connected the mathematical concepts to practical applications
better than the Singapore text did. Thus, there have been clear and definitive differences
within the problems and the approaches to them in primary/elementary textbooks of
Page 57
47
Singapore and the U.S. Research has neither confirmed nor denied the difference in the
problems within the middle grades textbooks of Singapore and the U.S.
Also, Ginsburg et al. (2005) presented the results of four pilot studies where U.S.
schools in Baltimore, Maryland, Massachusetts, and New Jersey used the Singapore text
in their classes. The results were variable as only two of the four sites achieved increased
mathematical achievement by their students. Sites where teachers received professional
development training on how to use the new text demonstrated better results. Three of the
four treatment groups where the teacher had greater professional training had greater
percentile score increases on national tests than the comparison group by as much as
eight percentile points. The percentage of students in the treatment groups scoring at the
advanced level rose from 13% to 45%, while in the comparison group the percentage
increase was 1%. The difference in teacher commitment to using the new text seemed to
affect the level of success in implementing the program. Teachers at the successful pilot
sites were more fully committed to the project. The school in New Jersey did not have
higher achievement results due in part to the schools’ high student body turnover rate of
about 40%. Other factors that affected the results were that the Singapore text did not
align fully to the state assessment standards nor to the topics presented in a particular
grade level. Bisk’s (2008) discussion of his use of the K-8 Singapore textbooks in
professional development courses revealed that the North Middlesex Regional School
District (NMRSD) in Massachusetts is now using the Singapore books as their primary
text in all their K-8 mathematics classrooms.
The results indicated that in order to bring a nation’s textbook or any one feature
from their educational system into another country, there should be careful, well-thought-
Page 58
48
out planning and preparation. However, these studies, which examined the text as one
aspect of a mathematical system, have been observed to have a concrete effect on
curriculum. Schoen and Clark (2007) cited results from the TIMSS-95 (Schmidt et al.,
2002) and results of the AIR study (Ginsburg et al., 2005) as being influential in the 2007
revisions of the Sunshine State Standards for mathematics in Florida. They reported a
reduction of the average number of benchmarks per grade-level for grades K-8 from 83
per grade level to 18 per grade level. In this reduction, Florida addressed the “mile wide,
inch deep” label by Schmidt et al. (2001) and the overlap seen in the spiral approach in
the U.S. (Ginsburg et al., 2005). Thus, an examination of texts can produce pertinent
changes to curriculum. The first step would be to find out the content in a textbook.
Knowing the content would then help those involved in curriculum determine what
changes, if any, need to be made both within and across the curricula in the system.
Textbook Use
Textbooks have been noted to “have a direct impact on what schools teach and
what students learn” (Reys, Reys, & Chávez, 2004, p. 62). This direct influence is seen as
textbooks (a) influence the content that is taught, (b) influence the sequence of the
content, and (c) provide ready-made lesson plans and ideas which affect the instruction in
the classroom (Reys et al., 2004). In his examination of how to measure the content of
instruction, Porter (2002) mentioned that content analyses of textbooks have “many uses
for the improvement of practice” (p. 11). Even though there is some disagreement about
the extent that teachers teach from the textbook (Schmidt et al, 2001; Freeman & Porter,
1989), if a mathematical concept is not in the textbook, few would argue that most
Page 59
49
teachers would have a more difficult time covering that information. Research that
examines textbook use in the classroom is presented next.
Textbook Use in the Classroom
In their investigation of the mathematics textbooks most frequently purchased in
grades 7, 8, and 9 in France, Germany, and England, Haggarty and Pepin (2002)
compared mathematics textbooks and how the texts were used in the classroom. The
research foci were (a) the mathematics present in textbooks, (b) how teachers mediate
mathematics in textbooks, and (c) students’ access to textbooks. Haggarty and Pepin
determined that teachers use the textbook differently in each country. Some teachers in
France use the text for problems only; others use it only for activities. In Germany,
teachers use it differently based upon the level of the school. In England, all teachers use
the textbook prolifically. The researchers then discussed the access pupils have to
textbooks and emphasized the unusual result that England’s students have limited access
to textbooks. In England, students are not able to bring their books home. Haggarty and
Pepin looked at this practice as limiting the student’s opportunity to learn mathematics.
Thus, textbook use and the mathematics available to the student in the text are seen to be
affected by culture.
A look at the research pertaining to East Asian countries and/or the U.S. reveals
that these countries use the textbooks extensively in the classroom. Leung (1995)
observed junior secondary mathematics classrooms within 18 schools in six regions in the
cities of Beijing, Hong Kong, and London and found that most teachers followed the
textbook closely during lessons presented in the classroom. Data collected from teachers
in the 41 nations that participated in the TIMMS-95 indicated that the textbook is a
Page 60
50
widely-used guide for teachers, particularly beginning ones (Schmidt et al., 2002). Zhu
and Fan (2002) similarly found that the textbook was by far the most widely used
resource among Singaporean lower secondary teachers, even though it was not the only
source. Henning (1996) also presented that middle school teachers in the U.S. use the
textbook extensively in their teaching. Thus, Singapore and U.S. Middle school teachers
use the textbooks widely in the classroom.
Textbook Use and Teaching Strategy
Fan and Kaeley (1998) compared the effects of traditional textbooks to the effects
of University of Chicago School Mathematics Project (UCSMP) textbooks on teachers’
teaching strategies in lower secondary mathematics classrooms. They wanted to
determine how textbooks affect teaching practices. Their methodology included using
data collected from four pilot studies of textbooks conducted at the University of Chicago
in 1992/93 and 1993/94 (Fan & Kaeley, 1998). Thirteen schools across 11 states in the
U.S. and 28 teachers within those schools were chosen to participate in the study. There
were 615 students, 311 in the 14 classes using UCSMP textbooks and 304 in 14 classes
using non-UCSMP textbooks.
For the observation report, teaching strategies were analyzed in terms of “
‘Lecture demonstration, Reading of textbook, Seatwork, Small group work, Whole-class
discussion, Going over homework, Laboratory work, Other instructional activity, and
Non-instructional activity’ “ (Fan & Kaeley, 1998, p. 13). The area of “Locus of activity
in the class” (p. 13) was also examined for each text. For the interview reports, questions
pertained to typical lessons and methods used in the classroom. For the UCSMP group
Page 61
51
only, the researchers included an additional question pertaining to the necessity of
adapting teaching style due to the new text.
Fan and Kaeley (1998) used t-tests to examine the data on how textbooks affect
teaching strategies. They found that the UCSMP group averaged 16% of class time on
lecturing and 30% on small group work while the non-UCSMP group averaged 36% of
class time on lecturing and 5% on small group work. These differences were significant
with p = .038 and p = .0443 respectively. Thus, one major finding was that the text
affects what goes on in the classroom. The authors recommended that the finding that
teaching strategies are affected by textbooks should be used by curriculum designers,
textbook authors, teachers, and administrators. They did not mention editors and
publishers in this list, although they pointed out that reforming the textbook should
accompany any attempt to reform teaching methods.
The researchers in this section examined how textbooks are used in and affect
classroom practice. The idea that textbooks affect what goes on in the classroom is
supported by several researchers (Fan & Kaeley, 1998; Leung, 1995; Porter, 2002; Reyes,
et al., 2004; Schmidt et al, 2002; Zhu & Fan, 2002). The next section focuses on the text
within the textbook to see how the wording, the use of symbols, and concepts inherent in
the text may affect comprehension of the text.
Textbooks and Learning Comprehension
Mathematics textbooks have been studied in connection to learning and
comprehension in several different ways. Six studies that have learning comprehension as
the focus are presented in this section (Cunningham, 2005; Mesa, 2004; O’Callaghan,
1998; Österholm, 2005; Steele, 2005; Tieso, 2005). Three of the studies examined
Page 62
52
learning when the textbook was changed while the other three studies examined the kinds
of learning inherent in the exercises already in the text.
Effects on Learning When the Textbook is Altered
Mathematics texts, unlike most texts, use a lot of symbols. The idea of reading
comprehension in light of the symbols used in mathematics was examined in a derivation
of a study that was done in the 1970s (Österholm, 2005). Österholm performed a study on
the reading comprehension of mathematics text to assist in determining “how and what
one can and cannot learn through reading mathematical texts” (2005, p. 326). He created
two mathematical textbooks, one with symbols and one without symbols, and also used a
history textbook for the study. Sixty-one upper secondary level and 34 university level
students from Sweden participated in the study. Students took a prior knowledge test in
mathematics and history, read one of the mathematics textbooks, answered questions
concerning the content of the text, read the history textbook, and answered questions
about the content in this second text. Students were divided into four groups based upon
level in school, university or secondary level, and the mathematics textbook that was
read, the textbook with symbols or the textbook without symbols.
Österholm (2005) found a significant correlation in reading comprehension from
the students who read the mathematics textbook without symbols and the history text
versus no correlation in reading comprehension from students who read the mathematics
text with symbols and the history text. He also found that the students who read the
mathematics text without symbols had a better comprehension of the text than students
who read the mathematics text with symbols had of their text. From the results,
Österholm (2005) concluded that reading mathematical texts requires “some type of
Page 63
53
content-specific literacy skill” (p. 340). However, he stated that the results cannot be
generalized. Further research is called for to determine the cause of the difference
between reading comprehension of mathematical texts with and without symbols
(Österholm, 2005). He also postulated that perhaps the difficulty in comprehending the
text with symbols is caused by applying the same process to read two different types of
texts. The proposed study will be comparing the textbooks from two countries with
regard to competency types and problem practices within the exercises of the texts to
reveal the symbolic form the linear function has been given in and what students are
asked to do with the function.
Steele (2005) used a teaching experiment research method to examine the effects
of writing on students’ development of schemata knowledge for algebraic thinking. Her
research question was, “In what ways do students write about and use schemata
knowledge when solving algebraic problems related in mathematical structure?” A
schema allows a person to process events due to similarity to prior experiences. She used
Marshall’s four types of schemata knowledge: (a) identification knowledge, (b)
elaboration knowledge, (c) planning knowledge, and (d) execution knowledge, as the
basis for knowing whether students demonstrated schemata knowledge in the study.
Steele teamed up with a seventh-grade teacher to use a combination of interviews and
teaching to understand students’ knowledge of algebraic concepts. During the one month
of the study, eight above-average seventh-grade pre-algebra students from a class of 24
solved eight problems. Steele designed these problems to help students generalize results
and see relations among problems.
Page 64
54
In the teaching portion, Steele (2005) emphasized the importance of the students’
work in solving the problems. The students were required to write down their thinking as
they solved a problem first individually and then discussed their solutions in small
groups. During the small group time, Steele and the teacher observed and asked questions
such as, “How did you reason about the problems? How did your diagram help you?” (p.
145). Steele interviewed each student four times during the duration of instruction for the
eight problems. Each student was interviewed with respect to the same four problems.
She asked questions concerning how the students did the problem as well as those
pertaining to the recognition of similarities between problems. Instruction for the next
day was adapted based upon the results of these interviews and the observations made by
Steele and the instructor during the small group discussions.
Steele (2005) found that writing demonstrated the schemata knowledge that
students were learning. She presented examples from the student interviews and from
their problem solutions that revealed how the four types of schemata knowledge were
manifested by the students. Steele’s study indicated the usefulness of getting students to
be aware of their learning, for example, metacognition. Drawing students’ attention to the
text is one way to help students with their awareness of their learning.
Tieso (2005) studied the changes in student achievement caused by altering the
textbook used with and without also changing the groupings within the 4th
- and 5th
-grade
mathematics classes of 31 teachers from four New England school districts. Tieso
examined two hypotheses for the study: Students who used the revised textbooks would
have higher learning gains than students who used the standard textbook and students
who used the revised textbook and experienced ability grouping would have higher
Page 65
55
learning gains than students who used the standard textbook. She created curriculum
materials for the differentiated textbook classes which included a unit on statistics and
probability based upon the standard textbooks from grades 3-8. Tieso verified the content
and construct validity for the curriculum-based assessment she created for the unit. The
initial 30-item assessment was tested, revised, and tested again to yield a 35-item
instrument, which received an alpha reliability of .78 during a second pilot study.
Tieso (2005) randomly divided teachers and students into the comparison group
or one of four treatment groups. Each group was further divided into low, medium, and
high subgroups with approximately one-third of the students from each group placed in
each category based upon pre-test scores. She gave strategies for teaching to each of the
differentiated groups, but she did not give any to the comparison groups nor for the
revised text, or revision, groups.
Tieso (2005) performed analysis of variance (ANOVA) with post hoc Scheffé
comparisons on preassessment scores. She found significant differences among the
preassessment scores of students assigned to the low, middle, and high prior-knowledge
groupings. She then used a repeated measures analysis of variance (RM-ANOVA) to
analyze pre- and post- test data using grouping arrangement and curricular adjustment as
the predictor variables. The results showed that there were significant differences
between scores among the comparison and the revision groups’ post-test scores. Tieso
also used a RM-ANOVA to examine the effects of grade level and treatment group
membership on student post-test scores. Students in the middle and high subgroups
within the treatment groups showed significantly higher posttest scores than students in
Page 66
56
the middle and high comparison subgroups. Thus, a major finding was that changing the
textbook may cause a change in mathematics achievement
Types of learning inherent in the text
While Österholm (2005), Steele (2005), and Tieso (2005) examined the changes
in achievement caused in part by altering the text, Cunningham (2005), Mesa (2004), and
O’Callaghan (1998) examined the potential learning already contained in a text’s
problems. All three authors examined how students learn the concept of function, more
specifically linear functions, but in the context of different environments, (a) problems in
the textbook, (b) problems presented by the teacher, and (c) a Computer Intensive
Algebra (CIA) curriculum. Within her study, Mesa (2004) discussed how “variations in
the set of problems that learners face, together with the operations, the representations,
and the metacognitive and verification strategies needed to organize the work, lead to
different characterizations of the conceptions of a function.” (p. 259). Mesa’s major
question was “What are the conceptions of functions that may be stimulated by the
solutions to exercises and problems of the seventh and eighth grade mathematics
textbooks in a given sample?” (p. 260) Mesa presented her study as an example of an
analysis designed to determine what types of learning occur when students work through
a particular mathematical concept, such as linear functions, in the textbook. Cunningham
(2005) was concerned about the curriculum being only a potential curriculum due to the
problems the teacher presented in the classroom. Cunningham (2005) questioned whether
students were being exposed to enough transfer-of-representation linear function
problems to learn the material. O’Callaghan’s (1998) interest was whether students
Page 67
57
learned the concept of linear functions better when using a Computer Intensive Algebra
(CIA) curriculum versus a traditional algebra curriculum.
Mesa (2004) examined the problems dealing with functions that were available to
students in 7th
- and 8th
-grade textbooks from 18 countries who had participated in the
TIMSS. From the original sample of 35 textbooks from these countries, 24 textbooks
were examined because they contained functions or topics closely related to functions.
Mesa then counted all the problems, henceforth called tasks, containing function in the
texts and found 1,318 tasks. She gave each of the tasks a 4-tuple code (P, O, R, Σ)
representing Biehler’s characterization of a concept with P representing the use of
function in the task, O representing the operations needed to solve the task, R standing
for the representations needed to solve the task, and Σ representing all of the activities
available for verifying the correctness of the problem, henceforth called controls. Mesa
then presented how she developed the coding categories for each part of the 4-tuple by
examining a task from the first section in each book and responding to a question for each
one of the four elements of the quadruplet. These responses were the basis for the
categories for each element of the 4-tuplet. She then had to merge categories due to the
large number of responses obtained. After testing the coding system with other raters, a
revision, and another rater test, Mesa ended up with 10 codes for the use of the function,
36 codes for operations, 9 codes for representation, and 9 codes for controls. The inter-
rater agreement ranged from 80% to 100% across the 4 groups of codes created to
categorize the 4 characteristics of concept examined within each task.
Mesa (2004) then reorganized the codes within each element based on frequency
of observations to facilitate data analysis and interpretation. She was able to create
Page 68
58
affinity groups in which to organize the codes into categories; five for uses, five for
operations, three for representations, and three for controls. Mesa then used configural
frequency analysis (CFA) to determine the configurations of the four elements of the
quadruplet where the frequency was larger or smaller than what was expected by chance.
She found 28 configurations whose frequencies differed from chance. An examination of
these configurations allowed her to characterize the types of learning that take place
during the study of functions. She was able to define five practices on functions, which
she labeled “symbolic rule, ordered pair, social data, physical phenomena and
controlling image” (p. 267). She described each practice in detail before presenting the
results.
The results were that 37% of the tasks suggested a “symbolic rule, an ordered
pair, or a controlling image practice” (Mesa, 2004, p. 272), which has no non-
mathematical context, while 10% suggested a “social data or physical phenomena
practice” (p. 272), which have an outside-mathematics context. Among the textbooks,
71% contained symbolic rule and ordered-pair practices, about 50% contained social data
tasks, 33% contained physical phenomena practices, and 38% contained controlling
images practices. Twenty-five percent of the textbooks contained only one type of
practice, and about 20% of the textbooks contained four or all of the practices. Thus,
Mesa only presented the percentage of textbooks which contained the classifications she
created.
Mesa ended by discussing how determining the types of learning that takes place
as students work through a concept in the textbook may be useful in helping students
grasp a concept more completely and avoid conflicting conceptualizations of
Page 69
59
mathematical notions. She also reiterated that teaching students how to check the
appropriateness of the method used should be in the text. Mesa suggested that a similar
analysis such as the one she carried out would indicate whether textbooks contain
multiple representations for the construction of meaning for mathematical notions and
explicit directions for students to use metacognitive strategies. She emphasized that
control strategies should be introduced explicitly in mathematics textbooks. The proposed
study will be comparing the textbooks with respect to Mesa’s five practices on functions
and attention getters/signposts to the important concepts in the text.
O’Callaghan (1998) developed a conceptual model for learning functions which
consisted of four competencies, (a) modeling—ability to represent a problem situation
using a representation for a function, (b) interpreting—ability to change the
representation of a function into terms of a real world situation, (c) translating—ability to
move from one representation of a function to another, and (d) reifying—“creation of a
mental object from what was initially perceived as a process or procedure” (25). He used
these competencies to categorize problems on a function test to assess students’
knowledge of functions. He and other instructors gave the test through a department final
exam to 802 students in 40 classes. O’Callaghan focused on three classes in particular, (a)
a class which he taught using a computer-intensive approach (CIA) , (b) a class he taught
using a traditional approach (TA1), and (c) a class taught by another professor using a
traditional approach (TA2). He also interviewed six students from each group using
problems similar to the ones on the final exam. The qualitative results demonstrated that
students in the CIA curriculum enjoyed the curriculum more and had a different
conception of what was a function. An ANOVA among the three focal groups suggested
Page 70
60
that the students in the CIA curriculum had made no less progress than the traditional
classes even though the CIA students had lower scores on the final exam. O’Callaghan
(1998) demonstrated that it is possible to categorize linear function problems with respect
to problem-solving competency types. The next researcher, Cunningham (2005) used the
same three core representational systems for functions that O’Callaghan called equation
or symbol, tables, and graphs, but only focused on the competency that O’Callaghan
called translating.
Cunningham (2005) examined the amount of class time teachers devote to
problems of transfer between algebraic (A), numeric (N), and graphic (G) representations
of linear functions and the number of transfer problems on teacher made assessments.
Cunningham examined the six transfer problems (a) A→N, (b) A→G, (c) N→A, (d)
N→G, (e) G→A, and (f) G→N. The importance of transfer between representations is
highlighted in the NCTM standards (2000) not only as a part of the Algebra strand but as
a separate strand known as the Representation strand. One of Cunningham’s (2005)
major results was that teachers spend less time on the type of transfer problems, G→N,
which students find most difficult to master. Also, he found that transfer problems
requiring moving from an algebraic representation to a numeric representation had the
second lowest number of assessments and second lowest amount of class-time.
Comparing the number of transfer problems pertaining to linear functions in textbooks in
Singapore to the number of transfer problems pertaining to linear functions in the U.S.
may provide useful information in determining if a text covers an adequate number of
problems for the student to gain mastery of transfer of representation problems.
Page 71
61
Cunningham (2005) and O’Callaghan (1998) only considered the three most
common types of mathematical representations, (a) algebraic, (b) numeric, and (c)
graphic, in their studies on functions. However, Cunningham (2005) suggested that a
fourth representation, written or verbal, should be included in future research pertaining
to transfer of representation problems. Within the definitions of the competencies of
modeling and interpreting used in his study, O’Callaghan (1998) considered going from
verbal to one of the three core representational systems and vice versa, but he did not call
the verbal terms a representational system nor did he consider these to be a transfer of
representation or a translating competency. However, Brenner et al. (1995) used a fourth
representation in her research on students’ understanding of algebra. They called this
representation a “verbal” representation (p. 12) which involves being able to explain the
relationships in word problems and being able to “explain in words the functional
relationships represented in the other representations” (p. 12). Thus, this fourth
representation is needed when considering problems involving transfer of
representational types. This representation would be general enough to include either a
written description or a verbal, that is, spoken, description of a problem.
The literature review highlights some of the ways that learning and
comprehension changes due to the textbook. The changes caused by reading a text and
writing down answers to problems were examined by Österholm (2005) and Steele
(2005) respectively. Changes in achievement due to changing the textbook with and
without changing school grouping were studied by Tieso (2005). The concepts learned
when taught the topic of functions, specifically linear functions, through a text (Mesa,
2004), a CIA curriculum (O’Callaghan, 1998), and problems in class (Cunningham,
Page 72
62
2005), have also been examined. These studies illustrated that the text is an important
part of student learning.
Summary
U.S. students are weak in mathematics as is seen through state, national, and
international assessments (Beaton et al., 1996; Gonzales et al., 2000; Gonzales et al.,
2004; Kilpatrick et al., 2001). The results from the landmark international comparison
study, TIMSS of 1995, served as the catalyst for a plethora of studies comparing the
educational practices of the nations participating in the TIMSS (Kaiser et al., 1999; Zhu
& Fan, 2004). Within curriculum studies involving these nations, the textbook has been
examined in an attempt to identify differences that could possibly help explain the
disparity in achievement. The results of these studies suggested that textbooks in
countries that placed at the top of the TIMSS were different than textbooks in the U.S.
(Schmidt et al., 2001).
Schmidt and colleagues (2001) examined the mathematics curriculum contained
in eighth-grade textbooks within the 37 countries, including East Asian countries that
participated in the TIMSS-95. U.S. textbooks and the textbooks of other nations in the
study were seen to have general differences in topics covered. However, the TIMSS
study only examined topics generally without considering individual problems within a
topic. Research that focuses on the problems pertaining to one particular topic is needed
(Li, 2000). Thus, the researcher of the present study examined middle-grades textbooks
from Singapore and the U.S. with regard to problems using an amalgamation of features
examined by Li (2000) and by Zhu and Fan (2004). As suggested by Li, this study also
included an examination of broader aspects of the text.
Page 73
63
In a study conducted by the American Institutes for Research (AIR), Ginsburg
and colleagues (2005) completed a thorough comparison of U.S. elementary mathematics
texts to Singapore elementary mathematics texts. The results of the AIR study showed
that primary texts in Singapore and the U.S. have distinct differences. Harries and
Sutherland (2000) also found differences in the images and references to the
mathematical concepts represented by the images in Singapore and U.S. primary
textbooks. Thus, the researcher compared middle school textbooks from Singapore and
the U.S. with respect to these features to see if similar results would be obtained for these
grades.
Also, research indicated that the topic of linear functions has not been widely
emphasized in textbook comparisons. There are not many studies which focus on
problems pertaining to the topic of linear functions. Linear functions has been included as
one topic among many in some textbook comparisons (Mesa, 2004; Schmidt et al, 2001).
However, one researcher focused on characterizing problem types (Mesa, 2004) and only
reported the percentage of textbooks which contained these problem types. The other
researchers (Schmidt et al., 2001) did not focus on particular problems within the text but
examined broad categories of topics within texts. Thus, past research has shown that the
differences found in the middle school texts were based upon a general examination of
topics without considering individual problems within a topic and that there is a need for
further research pertaining to the topic of linear functions.
In the textual analysis, the researcher examined the conceptualizations of the topic
of linear functions in the text through the use of a conceptualization model (O’Callaghan,
1998) previously only used on assessment items in class. The researcher also extended
Page 74
64
the transfer of representation types, previously used by Cunningham (2005) and Brenner
and colleagues (1995) in research conducted on instructional practice, to textbooks.
Page 75
65
CHAPTER III
METHOD
The purpose of the study was to compare the treatment of the topic of linear
functions in middle grades student mathematics textbooks of Singapore and the United
States. Treatments refer to the ways linear functions are presented in the text including
how the topic is represented in the problems of the text. The main focus was on the
problems pertaining to linear functions. The research questions motivating the study were
as follows:
1. How do the treatments of the topic of linear functions in middle grades
mathematics textbooks of Singapore compare to the treatments of the topic of
linear functions in middle grades mathematics textbooks of the U.S.?
Treatments of the topic refer to the ways linear functions are presented in
general in the text and how the topic is represented in the problems of the text
particularly with regard to the 22 features the researcher examined.
2. What are the similarities and differences of the conceptual types of problems
related to the topic of linear functions within the middle grades mathematics
textbooks of Singapore and the U. S.?
3. How are problems related to linear functions in middle grades mathematics
textbooks of Singapore and the U.S. different or similar with respect to
computational requirement, context, required response, cognitive requirement,
and given information?
4. Are the characterizations of problem practices as seen in the problems related
to linear functions in middle grades mathematics textbooks from Singapore and
Page 76
66
from the U.S. the same or different?
5. How do the problem-solving competency types in the problems related to linear
functions in middle grades mathematics textbooks from Singapore and from the
U.S. compare?
6. How do the types of transfer of representation needed to do the problems
pertaining to linear functions in middle grades mathematics textbooks from
Singapore compare to the types of transfer of representation needed to do the
problems pertaining to linear functions in middle grades mathematics textbooks
from the U.S.?
The chapter begins with a detailed description of the textbook selection process.
Then, a description of the 22 features that were examined in the 17 textbooks, eight from
Singapore and nine from the U.S., is presented in the data collection section. The
presentation includes a delineation of the category codes used for each feature. This is
followed by an analysis of the coding scheme as informed by the coder training process
used to attain inter-rater reliability values. The details of a pre-pilot study that had
informed the creation of the coding scheme (Appendix C and Appendix D) are found in
Appendix E. A description of the treatment of the data concludes the chapter.
Textbook Selection Process
Eight mathematics textbooks from Singapore and nine textbooks from the U.S.
were examined. The eight Singaporean textbooks represent three different text series in
Secondary 1 and Secondary 2, that is, the seventh and eighth year of education, which
contain the topic of linear functions. An examination of the Singapore mathematics
primary (Ministry of Education Singapore, 2006a) and secondary syllabi (Ministry of
Page 77
67
Education Singapore [MOE], 2006b, MOE, 2012) indicated that linear functions are
covered in Secondary 1 and Secondary 2. The nine U.S. textbooks represent three
different series in Grades 6-8 which contain the topic of linear function. A description of
how these textbooks were selected is next.
Track Determination
The textbooks were determined by examining the department of education, or
equivalent departments’, websites for Singapore and the states of Florida, Texas, and
California (See Appendix A). The states of Florida, Texas, and California were chosen
because they are the three states that drive the mathematics textbook publication market
(Seeley, 2003). Information concerning the state adopted textbooks and topics taught in
each grade was examined and compared. This information allowed the researcher to
determine the grade levels and textbooks used in this study.
After primary school in Singapore, secondary students are placed in one of three
tracks, (a) Express (Note, before 2008, this track was two tracks, the Special track and the
Express track.), (b) Normal Academic, or (c) Normal Technical (Ministry of Education
Singapore [MOE], 2013; Soh, 2008). About 60% of Singaporean students take Express
classes (MOE, 2013). The Express curriculum is designed to prepare students for college
upon passing Type O Examinations. The remaining percentage of the Singaporean
students are in the Normal Academic or Normal Technical classes and have a curriculum
that is similar to the Express track, but is slower paced (MOE, 2013; Soh, 2008). The
Normal Academic track allows students to progress to college with an extra year of study
to prepare for the Type O Exam. The common middle school mathematics curriculum in
the U.S. allows all students to be ready for college depending on the classes taken in high
Page 78
68
school. In light of the facts that a majority (61%) of Singaporean students is in the
Express track and that the curricula in the three tracks are similar but paced differently,
the researcher only focused on the Express textbooks.
Year or Level Determination
The syllabi for grade level and for each track are listed on the Singapore Ministry
of Education website (MOE, 2006b; MOE, 2012). Study of the syllabi for the Express
track indicated that students are exposed to linear functions primarily in Secondary 1
which is essentially the seventh year of education and in the Secondary 2, the eighth year
of education. For that reason, the researcher chose the textbooks in the Secondary 1 and
Secondary 2 years to examine.
An extensive review of the state content standards documents of California,
Florida, and Texas (see Appendix A) in the summer of 2012 revealed that the topic of
linear functions was within Grades 6-8. This factual finding aligned with the NCTM
algebra standards for Grades 6-8 as set forth in the Principles and Standards for School
Mathematics (NCTM, 2000). There is a difference in the Texas standards, as Texas also
has linear functions in grade 9 since Texas prepares students for Algebra 1 to be taken in
the ninth grade. The fact that the texts are on the other two states’ adoption lists makes
this a non-issue. Thus, the texts in Grades 6-8 were chosen to be examined in this study.
Textbook Determination
Three Secondary 1 (S1) and three Secondary 2 (S2) series mathematics textbooks
from Singapore were compared to three middle school series, Grades 6-8, mathematics
textbooks from the U.S.
Page 79
69
The researcher examined three textbook series in the Express track used in grades
S1 and S2 from Singapore. One of these textbook series, New Syllabus Mathematics, is
documented as being used in 80% of secondary schools in Singapore (SGBox.com,
2014). There were a total of eight Singapore textbooks examined. The two textbooks,
Discovering Mathematics 1A and Discovering Mathematics 1B, used in secondary 1 (7th
grade) in Singapore was amalgamated to be one textbook in the data collection process.
The two text-books, Discovering Mathematics 2A and Discovering Mathematics 2B, used
in secondary 2 (8th
grade) in Singapore also were combined to be one textbook in the data
collection process. Thus, in the statistical testing for the comparison of the textbooks,
there were 6 textbooks for Singapore, three textbook series for each of the two grade
levels (See Table 2). See Appendix E for a complete list of these titles.
Table 2
Textbook Setup
Textbooks Grades
Singapore
Discovering Math 1A, 1B Secondary 1 (seventh)
Discovering Math 2A, 2B Secondary 2 (eighth)
Math Matters 1 Secondary 1 (seventh)
Math Matters 2 Secondary 2 (eighth)
New Syllabus 1 Secondary 1 (seventh)
New Syllabus 2 Secondary 2 (eighth)
United States
McDougal Math 1 Sixth
McDougal Math 2 Seventh
McDougal Algebra 1 Eighth
Glencoe Math Connects 1 Sixth
Glencoe Math Connects 2 Seventh
Glencoe Math Connects 3 Eighth
Pearson Connected Math 1 Sixth
Pearson Connected Math 2 Seventh
Pearson Connected Math 3 Eighth
Page 80
70
In the U.S., each grade uses only one textbook. Three texts within each grade
level of grades 6 to 8 were used for the textbook comparison for a total of nine texts from
the U.S. An examination of the department of education websites of California, Florida,
and Texas in early summer 2012 revealed that there were three textbooks that had the
same or similar title on the adoption lists of all three states. Examining publisher websites
and talking with customer service representatives clarified that a similar title is basically
the same textbook but with a state title. For example, a personal communication with a
customer representative for Glencoe revealed that while the titles, Glencoe Florida: Math
Connects and Glencoe Math Course, are different; they are simply state versions of the
same text and therefore virtually the same. While there is an emphasis on algebra in the
eighth grade, these texts covered this emphasis as the eighth grade texts reflect this
emphasis that began before 2009. Three U.S. series titles were chosen for a total of nine
books. Table 2 shows the set-up of the Singapore texts and the U.S. texts. A complete list
of these texts with their titles, authors, publication date, and publishers is found in
Appendix E.
Data Collection
In this study, Singapore textbooks and U.S. textbooks were compared with respect
to 22 characteristics. The researcher performed a content analysis to examine the general
features of the text with a more concentrated look at the sections pertaining to linear
functions. Using these sections, the researcher compared (a) background features of the
texts, (b) general features of the problems pertaining to linear functions, and (c) specific
characterizations of problem practices within the texts. The features were coded using a
coding scheme with codebook (Appendix C, Appendix D) developed by the researcher.
Page 81
71
The coding scheme was an amalgamation of coding symbols and ideas from past studies
(Anderson et al., 2000; Cunningham, 2005; Ginsburg et al., 2005; Harries & Sutherland,
2000; Li, 2000; Mayer et al., 1995; Mesa, 2004; O’Callaghan, 1998; Tieso, 2005; Zhu &
Fan, 2004). The creation of the coding scheme and codebook was informed by the work
of Neuendorf (2002).
Thirteen background features of the text were compared. The comparison
included finding the (a) number of pages in text, (b) number of chapters, (c) number of
sections, (d) number of sections pertaining to linear functions, (e) number of pages
pertaining to linear functions, (f) number of pages for development, (g) number of pages
for exercises, (h) number of other pages, (i) number of problems pertaining to linear
functions, (j) average number of pages per section pertaining to linear functions, (k)
number of object-analytic images, (l) number of object-illustrative images, and (m)
number of signposts or attention-getters. For 12 of the 13 features, the codes were the
number of occurrences for that item while the code for the remaining feature was an
average number of pages. The categories of images came from the work of Harries and
Sutherland (2000). The designations objective-analytic images (OA) and object-
illustrative images (OI) distinguish whether the image facilitates understanding of the text
or not. The work of Ginsburg et al. (2005) inspired the examination of the number of
pages and problems. From the research by Harries and Sutherland (2000) and discussion
by Anderson et al. (2000), the importance of drawing students’ attention to important
features to assist in student achievement was emphasized. This emphasis was the
inspiration for the examination of road-signs or attention-getters feature. See Appendix D
for a more complete description of these features.
Page 82
72
Also, the researcher used the content analysis to compare general classifications
of features within problems pertaining to linear functions. A merger of classifications of
problem features from the works of Li (2000) and Zhu and Fan (2004) was used to
distinguish problems through six feature classifications (a) computational feature, (b)
contextual feature, (c) response-type feature, (d) cognitive requirement feature, (e) given-
information feature, and (f) application type feature. For the computational feature, the
researcher determined the number of mathematical procedures required to arrive at an
answer and coded each problem as requiring (a) a single computation procedure, S; (b)
multiple computation procedures, M; or (c) other, ot.
For the contextual feature, the researcher looked at the context in which the
problem was presented and coded each problem as either (a) numerical, nu; (b) visual, vi;
(c) verbal, ve; (d) combined form, co; or (e) other, ot. The researcher also examined the
type of answer that the question requires and coded the problems as requiring one of the
following types: (a) numeric answer only, A; (b) algebraic expression or equation only,
E; (c) explanation or solution required, ES; (d) Graph only, G, (e) Multiple response
types, M, or (f) other response, OP. The researcher reported the type of cognitive level
required to do the problem and coded this cognitive requirement feature as (a) procedural
practice, PP; (b) conceptual understanding, CU; (c) problem solving, PS; (d) special
requirement, SR; or (e) other, ot. For the given-information feature, the researcher
reported the amount of information given in the problem as either (a) sufficient, SF; (b)
extraneous, EX; or (c) insufficient, ISF. Lastly, for the general classification of features
within problems, the researcher reported the amount of information given in the problem
Page 83
73
statement as either applied, AP, or nonapplied, NA. See Appendix D for a more detailed
description of these features.
Problems were also classified as one of the five characterizations of problem
practices associated with functions as developed by Mesa (2004). The researcher coded
the type of practices seen in problems pertaining to linear functions as (a) symbolic rule,
sr; (b) ordered pair, op; (c) social data, sd; (d) physical phenomena, ph, (e) controlling
image, ci; or (f) other, ot. See Appendix D for a more detailed description of this feature.
O’Callaghan’s (1998) problem-solving competency types for functions were used
to analyze the problems in the text. The researcher classified the component competency
type required to solve the problem as (a) modeling, mod; (b) interpreting, int; (c)
translating, tran; (d) reifying, reif; or (e) does not apply, dna. See the Codebook in
Appendix D for a detailed description of these codes. Cunningham’s (2005) descriptions
of transfer of representation types combined with Brenner et al.’s (1995) fourth
representation were used to analyze the problems within the texts. The researcher coded
the type of transfer necessary as a student moves from one type of mathematics
representation in the question to a different mathematical representation for the answer.
These types of transfer types going from one representation to another representation
were coded as (a) A→N, algebraic to numeric; (b) A→G, algebraic to graphical; (c)
A→V, algebraic to verbal; (d) N→A, numeric to algebraic; (e) N→G, numeric to
graphical; (f) N→N, numeric to numeric, (g) N→V, numeric to verbal; (h) G→A,
graphical to algebraic; (i) G→N, graphical to numeric; (j) G→V, graphical to verbal; (k)
V→A, verbal to algebraic, (l) V→N, verbal to numeric; (m) V→G, verbal to graphical;
Page 84
74
(n) Multiple transfer types , m, or (o) Does not apply, dna. Detailed descriptions of this
feature are in Appendix D.
Analysis of Coding Scheme
The coding scheme was checked for validity and inter-rater reliability. In
preparation for this study, the researcher conducted a pre-pilot study on the first draft of
the coding scheme and codebook (Fowler, 2008). See Appendix F for more details on the
pre-pilot study. The goal of the pre-pilot study was to find ways to improve the codebook
before using it in the textbook comparison study. The pre-pilot study was beneficial in
pinpointing things that need to be changed in the codebook and the coder training process
and revealed sources of potential problems in the future textbook comparison study. Also,
the pre-pilot study highlighted how important coder-training is to the process of
achieving inter-rater reliability. Neuendorf’s (2002) 15 step process of coder-training is
explained in the next paragraph.
Neuendorf (2002) presented a 15-step process to use when creating a coding
scheme. This process involves (a) creating the codebook, (b) three iterations of coder
training, coder practice, coder discussion, and codebook revision, (c) the final coding,
and (d) analysis of the experience (Neuendorf, 2002). These 15-steps are (a) create the
codebook, (b) train coders with discussion, (c) practice coding together to reach
consensus, (d) make codebook revisions, if needed, (e) train coders on revisions, (f)
practice training independently, (g) discuss results, (h) revise codebook if needed, (i)
train coders on revisions, (j) code subsample for measures of reliability, (k) check
reliability values, (l) revise codebook if needed, (m) coder training on revisions, (n)
independent coding, and (o) coder debriefing. For this study the researcher conducted this
Page 85
75
15-step training process to determine ways to improve the coding scheme and the
appropriateness of the category choices.
After creating a coding scheme and a codebook defining the aspects of the
mathematics text book, the researcher conducted the 15-step coder training/codebook
development process with a second coder as suggested by Neuendorf (2002). The second
coder is an assistant professor of mathematics at an accredited university who has a Ph.D.
in mathematics. First, the two coders examined the initial codebook and discussed
changes that needed to be made. Also, training involved studying Mesa’s (2004) and Li’s
(2000) works. Then, the coders practiced coding together using College Algebra: Graphs
and Models (Barnett et al., 2009). Revisions were made with regard to number of pages
and more details about the characterization of problem practices, specifically the
symbolic rule and social data practices. Once revised, the researcher trained the second
coder on the new definitions. Next, the coders coded problems independently. An Excel
program was used to facilitate the recording of the coding selections while a coding form
was used to record the numbers with the general feature categories. Due to the ease of
using the Excel program, the coding form was added to the Excel worksheet. A sample
of this rubric listing all problems as columns and the feature categories as rows is found
in Appendix G. Then the coders discussed results together. Definitions for procedural
practice and conceptual understanding were the main issues of discussion and change in
the codebook. Details about the transfer types were clarified and another category of
multiple transfer types was included in the codebook. The second coder was trained on
revisions to the codebook. Then the coders went over more problems together and then
Page 86
76
coded independently before making more revisions in preparation for testing inter-rater
reliabilities.
For the features which required a choice of code, the desired value for the inter-
rater reliability coefficient was chosen to be +0.75 for Cohen’s kappa which is the level
acceptable in most situations (Lombard, Snyder-Duch, & Bracken, 2005; Neuendorf,
2002). For the initial test for inter-rater reliability values, the coders used the odd
problems from chapter tests 2, 3, and 7 from Beginning and Intermediate Algebra (Lial,
Hornsby, & McGinnis, 2012) for a total of 39 problems. Three features had the
appropriate Cohen’s Kappa values: a) given-information type with perfect agreement, b)
application type with 0.86, and c) characterization of problem practices type with 0.75.
The coders examined the problems they had coded and discussed the coding scheme.
Then, the coders did a second check for inter-rater reliability values using the 36 even
problems on chapter tests 2, 3, and 7 in Beginning and Intermediate Algebra. All but one
of the 9 features had the necessary +0.75 Cohen’s Kappa. The cognitive requirement
feature had an inter-rater reliability value of 0.51 for Cohen’s kappa and 0.72 for percent
agreement
The coders discussed the cognitive requirement type, particularly procedural
practice versus conceptual understanding. The realization that conceptual understanding
requires one to make relationships among features in the problem while procedural
practice requires little connection to relationships was key in distinguishing the difference
between the two types of cognitive requirement. The following examples may help
illustrate a problem that requires making connections between multiple features in the
Page 87
77
textbook versus one that does not. See Figure 5. After delineating these two cognitive
requirements into categories based upon relationship between more than one features, or
no or little relationship among features, in the problem, the coders examined every fifth
problem in the chapter reviews for chapter 2, 3 and 7 in Beginning and Intermediate
Algebra (Lial et al., 2012). They obtained an inter-rater reliability value of 0.82 for
Cohen’s kappa and 0.90 for percent agreement for the Cognitive Requirement feature.
See Table 3.
Conceptual Understanding Procedural Practice
1. Use the graph, which shows two pay 1. Use the graph, which shows two pay
rates for baby-sitting. Use the points rates for baby-sitting.
to find each person’s pay rate. Find two points on each line.
2. Use the points and slope of the line to 2. Copy and complete the statement
Find the value of a. using <, >, or =.
Slope = 𝑎
2, (−2,−1), (2, 5) Line a: passes through (1,−3) and (2, 0)
Line b: passes through (1, 1) and (7, 3)
Slope of line a ? slope of line b
McDougal Littell Math Course 1
Figure 5. Cognitive Requirement Sample Problems
The general features of the text did not require a choice of code categories except
for the images, which required a count for each type of image, object-illustrative and
object-analytic. Thus, Cohen’s kappa and percent agreement were not found for these
characteristics. The results consisted of a comparison of the two coders’ assessments of
the features as listed on their coding forms. These values are listed in Table 4. Revisions
were made to the codebook to address the discrepancies in the number of object
illustrative images, object analytic images, signposts, and number of linear function
Page 88
78
problems. Illustrations used to set up a problem, such as geometrical figures which were
used to show the reader which angle they were asked to find, and graphs were excluded
from the count of images. Also, the second coder did not realize that the problems in the
review sections were not going to be examined in the study, so the description of
problems to be examined was detailed more specifically in the codebook.
Table 3
Final Inter-rater Reliability Coefficients for Categories Coded in Text
Feature Cohen’s kappa Percent Agreement
Problems (N = 36)
Computational .76 .89
Contextual .75 .83
Response-Type .88 .92
Cognitive Requirement .82 .90
Given Information ---a 1.00
Application Type .91 .97
Problem Practices .84 .89
Problem-Solving Competencies .79 .78
Transfer Type .74 .78
aCohen’s kappa does not yield a value due to only one characterization, i.e., code, being chosen
for all problems. All problems were coded with the same code, so the coders agreed on the
characterization of every problem in this category.
To address validity of the coding scheme, the researcher completed a literature
review on textbook comparisons and how problems have been examined in the past. This
Page 89
79
past research was beneficial in creating the codebook which defines the features that were
examined and contains a coding scheme for each feature that encompasses all the
important aspects of the feature. Also, the coder-training helped ensure that the coding
scheme contains all essential component parts for each feature. Thus, the researcher
addressed the somewhat subjective content validity issue by defining the codebook to
reflect the entirety of the feature being examined. Also, she calculated a content validity
index (CVI), or agreement proportion, for each code of a specific feature (Wynd,
Schmidt, & Schaeffer, 2003). To be an acceptable level of inter-rater proportion
agreement, the CVI needed to be 80%, 0.80, as this value is deemed adequate by Wynd et
al. (2003).
Table 4
Comparison of Data for General Characteristics of the Text
Feature Coder 1 Coder 2
Pages in Text 1054 1057
Number of Chapters 14 14
Number of Sections 94 84
Number of Linear Sections 16 16
Linear Function Pages 209 188
Pages for Development 116 113.5
Pages for Exercises 89 70.5
Other Pages 4 4
Number of Linear Problems 1233 1591
Average Pages/Linear Function 12.06 11.75
Object-Illustrative Images 77 19
Object-Analytic Images 44 20
Signposts/Attention-Getters 46 50
After the codebook had appropriate inter-rater reliability levels for each
characteristic, the researcher and two other judges, the second coder and an assistant
professor of mathematics at an accredited university with a Ph.D. in Mathematics
Page 90
80
Education, classified each code for a specific feature as to how relevant the code is to
defining/describing the feature being examined. The three coders, each an experienced
university professor of mathematics familiar with teaching linear functions, examined
each code and judged them as (a) essential, (b) somewhat essential, (c) somewhat non-
essential, or (d) nonessential to the definition of the feature being examined. All coders
found the codes to be essential to the feature being examined. Thus, the CVI values were
1 across the board, and no changes to the codebook were needed at this point.
Treatment of the Data
The two coders examined the 17 textbooks, eight textbooks, amalgamated into six
textbooks, from Singapore and nine textbooks from U.S., and coded them with regard to
the 22 features described in the codebook. An Excel program was used to facilitate the
recording of the coding selections for the nine features concerning a choice of code for
each problem. A rubric listing all the problems in each section by section heading was
created for each book. The researcher added row- and column- sums as a check to
decrease human error during the coding process. Also, the coders used the Excel program
to record the numbers obtained for the general features from each textbook.
For the statistical testing for the general features, the average values for the
features were used in the statistical testing used for the comparison of the data. Welch’s t-
test was used to compare the values for each of the general features obtained from the
Singapore textbooks to the values for the corresponding general features obtained from
the U.S. textbooks. The null hypothesis for each feature was that the two sample means
were equal. The alternate hypothesis was that the sample means were different, i.e. that
the textbooks from the two countries were different in regard to that feature. Welch’s t-
Page 91
81
test was used because the two samples, that is, the values obtained from the two
countries’ textbooks, had different numbers of values, six for Singapore and nine for
U.S., and the samples were assumed to have unequal variances. The two sets of values
obtained from the two countries’ sets of textbooks were used to find the statistic t using
the formula
t 1 2
2 2
1 2
1 2
x x
s s
N N
.
where th
ix i sample mean, 2 th
is i sample variance, and Ni = ith
sample size. The
degrees of freedom v was approximated by the Welch-Satterthwaite equation which has
the formula
22 2
1 2
1 2
4 4
1 2
2 2
1 1 2 2
s s
N Nv
s s
N v N v
where vi = Ni – 1 is the degrees of freedom associated with the ith
variance estimate. An
Excel program was used to compute the values for t, v, and to run the two-tailed t-tests
for the collected data. Probability values of 0.05 or less for the test are values that
represent that there is a significant difference between the two sets and the null
Page 92
82
hypothesis that the textbooks from the two countries are the same for that feature should
be rejected.
For the nine features for the problems that required a choice of code, the
researcher first found the percentages that each code was used in the problems pertaining
to linear functions in each textbook. For each code of the feature, the percentages from
the two countries’ textbooks became the two sample sets used to find the statistic t which
was used to perform Welch’s t-test to compare the textbooks with respect to the codes for
each feature. The Null hypothesis for each code was that the means for the sample sets
was equal. The alternative hypothesis was that the means for the two sample sets was
different, that is the two countries’ textbooks were different with respect to the
percentages that a particular code was seen in the textbook. The significance level was
0.05.
However, the fact that there was one or two codes different for a feature
containing a choice of many codes may not have been enough to determine if the two sets
of textbooks were different. Thus, the researcher also decided to do a chi-square test of
independence for each feature to determine if the choices of codes for a particular feature
for the two sets of textbooks were independent (not related) or not independent (related)
to the country of origin. The chi-square test of independence was used to determine if the
choice of code for a feature was related to the countries’ textbooks. The Null hypothesis
was that the choice of codes for one feature is independent of the country from which the
textbooks came, that is, the country the textbook came from has no significant effect on
the choice of code for that feature. The alternative hypothesis was that the two variables,
“codes chosen for one feature” and “country”, are related (not independent), that is, the
Page 93
83
country that the textbook came from has an effect on the choice of code for that feature.
There were nine chi square tests that were done, one for each feature. For the
computational feature, the set “country” which includes U.S. and Singapore, and the set
of “codes” which includes (a) single, (b), multiple, and (c) other, are the two variables
which were tested for independence. The Null hypothesis was that the country did not
have a significant effect on the choice of codes, (a) single, (b) multiple, and (c) other, for
the problems; the alternative hypothesis was that the country did have an effect on the
choice of codes. For each of the eight other features which required a choice of code, a
similar chi square test of independence was performed. The expected frequencies
necessary for this test were found by combining both countries’ textbook codes and using
these numbers to find the percentage of problems expected from each individual
countries’ textbooks as seen by the observed percentages. The total number of problems
was 4547. An Excel program was used to compute the chi-square statistics, χ2, and
determine the associated probabilities for the chi square tests for independence. The Null
hypothesis was rejected when the calculated probability was less than 0.05.
Summary
In this section, the methods for the study were presented. The work of Neuendorf
(2002) influenced the creation of the codebook and coding scheme used in the
quantitative study. As presented, several past research studies (Anderson et al., 2000;
Cunningham, 2005; Ginsburg et al., 2005; Harries & Sutherland, 2000; Li, 2000; Mayer
et al., 1995; Mesa, 2004; O’Callaghan, 1998; Tieso, 2005; Zhu & Fan, 2004) also
influenced the coding scheme. Thus, the study is based upon prior research and theory.
Because the study is an amalgamation of ideas from several studies, the study was
Page 94
84
designed to give a broad look at how the textbooks from Singapore and the U.S. compare,
particularly with respect to the topic of linear functions. The use of two raters to test the
coding scheme reduced possible researcher bias. The validity of the coding scheme was
checked by the careful delineation of coding categories used to capture all aspects of the
feature being examined and by the calculation of a content validity index value for each
feature. Thus, the study was designed to contribute to research in the area of linear
functions. Next, Chapter 4 contains the results of the textual analysis completed on the 17
textbooks from Singapore and the U.S.
Page 95
85
CHAPTER 4
RESULTS OF STUDY
The purpose of the study was to compare treatments of the topic of linear
functions in Singapore and U.S middle grades mathematics textbooks. The textbooks
were examined with respect to 13 general features of the textbook and nine features
related to the problems pertaining to linear functions. In this chapter, the researcher first
presents the data obtained for the 13 general features with the corresponding results from
Welch’s t-tests for each feature. Then the researcher reports the data for the nine problem
features with the corresponding results of the Welch’s t-tests and chi-square tests of
independence for each feature.
Results from Data Collection
The two coders examined the 17 textbooks, eight textbooks, amalgamated into six
textbooks, from Singapore and nine textbooks from U.S., and coded them with regard to
the 22 features described in the codebook. An Excel program was used to facilitate the
recording of the coding selections for the nine features concerning a choice of code for
each problem. A rubric listing all the problems in each section by section heading was
created for each book. The total number of problems examined for each textbook is in
Table 5. The number of problems was one of the big differences between the Singapore
textbooks and the U.S textbooks. The Singaporean textbooks have far fewer homework
problems than the U.S. textbooks.
General Features
The coders used the Excel program to record the numbers obtained for the general
features from each textbook. The data for the general features from Singapore is seen in
Page 96
86
Table 6 and the data for the general features from the U.S. are in Table 7. A comparison
of the values from Table 6 and Table 7 showed that the most apparent difference between
the two countries’ values was the number of pages in the text, which in turn made the
number of pages for the other features different between the two countries’ textbooks.
The other apparent differences shown in the two tables are the number of object analytic
images and number of object illustrative images. These differences are indicated more
clearly in the averages of the textbooks from each country in Table 8. The average values
for the features were used in the statistical testing used for the comparison of the data.
Table 5
Number of Problems in each Text
Textbook Number of Problems
Singapore
Discovering Math 1 175
Discovering Math 2 85
Math Matters 1 162
Math Matters 2 0
New Syllabus 1 192
New Syllabus 2 210
United States
McDougal Math 1 297
McDougal Math 2 481
McDougal Algebra 1 1058
Glencoe Math Connects 1 357
Glencoe Math Connects 2 395
Glencoe Math Connects 3 498
Pearson Connected Math 1 0
Pearson Connected Math 2 481
Pearson Connected Math 3 234
For the statistical testing for the general features, Welch’s t-test was used to
compare the values for each of the general features obtained from the Singapore
textbooks to the values for the corresponding general features obtained from the U.S. The
Page 97
87
null hypothesis for each feature was that the two sample means were equal. The alternate
hypothesis was that the sample means were different, that is, that the textbooks from the
two countries were different in regard to that feature. Welch’s t-test was used because the
two samples, that is, the values obtained from the two countries’ textbooks, had different
numbers of values, six for Singapore and nine for U.S., and the samples were assumed to
have unequal variances. The two sets of values obtained from the two countries’ sets of
textbooks were used to find Welch’s t statistic.
Table 6
Singapore Numbers for General Features
Feature DM1a DM2 MM1 MM2 NS1 NS2
Number of
Pages in Text 428 382 417 311 420 399
Chapters 16 11 12 12 16 12
Sections 61 57 58 37 126 73
Linear Sections 7 3 11 0 14 12
Pages for
Linear Functions 41 20 46.5 0 46.5 54
Development 22.75 13.5 34.25 0 32 37.25
Exercises 11.75 5.5 11.75 0 12 15.75
Other 6.5 3.25 .5 0 2.5 1
Linear Problems 175 85 162 0 192 210
Avg. pages/section 6.04 3.33 4.23 0 3.32 4.5
Images: Object
Analytic 8 1 7 0 2 2
Illustrative 8 2 7 0 2 2
Signposts 15 2 16 0 2 4
aKey for abbreviations: DM1: Discovering Mathematics 1, DM2: Discovering Mathematics 2,
MM1: Mathematics Matters 1, MM2: Mathematics Matters2, NS1: New Syllabus Mathematics 1,
NS2: New Syllabus Mathematics 2 textbooks.
An Excel program was used to compute the values for t, v, and to run the two-
tailed t-tests for the collected data. Probability values of 0.05 or less for the test indicated
a significant difference between the two sets. Thus, the null hypothesis that the textbooks
Page 98
88
Table 7
United States Numbers for General Features
Feature ML1a ML2 HMA GM1 GM2 GM3 PM1 PM2 PM3
Number of
Pages in Text 759 757 798 753 827 605 603 658 679
Chapters 13 13 12 13 14 13 8 8
8
Sections 99 98 92 155 158 128 125 118 120
Linear Sections 7 8 21 18 22 18 0 17 8
Pages for
Linear Functions 50 62 180 85 95 110 0 96 46
Development 24 30 98 46.75 53.75 58 0 47 10.75
Exercises 26 32 79 37.25 41.25 52 0 48 28.5
Other 0 0 3 1 0 0 0 1 6.75
Linear Problems 297 403 1058 357 395 498 0 481 234
Avg. pages/section 7.14 7.75 8.57 4.72 4.32 6.11 0 5.65 5.75
Images: Object
Analytic 9 8 24 23 23 17 0 9 0
Illustrative 19 21 55 36 25 31 0 46 21
Signposts 12 14 40 12 10 16 0 11 0
aKey for abbreviations: ML1: McDougal Little Math Course 1, ML2: McDougal Little Math Course 2, HMA: Holt McDougal Algebra 1,
GM1: Glencoe Math Connects 1, GM2: Glencoe Math Connects 2, GM3: Glencoe Math Connects 3, PM1: Pearson Connected Math 1,
PM2: Pearson Connected Math 2, PM3: Pearson Connected Math 3
Page 99
89
Table 8
Average Values for General Features from Each Country
Feature Singapore United States
Number of
Pages in Text 392.8 715.44
Chapters 13.17 11.33
Sections 68.67 121.44
Linear Sections 7.83 13.22
Pages for
Linear Functions 34.67 80.44
Development 23.29 40.92
Exercises 9.46 38.22
Other 2.29 1.31
Linear Problems 137.33 413.67
Avg. pages/section 3.57 5.56
Images: Object
Analytic 3.33 12.56
Illustrative 3.50 28.22
Signposts 6.50 12.78
from the two countries are the same for that feature was rejected for p < 0.05. See Table
9. There were seven features that had probability values that were significant at the 5%
level which indicated that the Null Hypothesis should be rejected. Thus, there were seven
general features in which the countries’ textbooks differed. These features were (a)
number of pages in text, (b) number of sections, (c) number of pages for linear functions,
(d) Number of pages for exercises, (e) Number of linear function problems, (f) number of
object illustrative images, and (g) number of object analytic images.
Problem Features
For the nine features for the problems which required a choice of code, the
researcher performed Welch’s t-tests to compare the textbooks with respect to the codes
for each feature. The Null hypothesis for each code was that the means for the sample
sets were equal. The alternative hypothesis was that the means for the two sample sets
Page 100
90
Table 9
Welch’s t-test Numbers for General Features
Singapore United States
Feature M SD M SD t df p Decision
Number of
Pages in Text 392.83 43.38 715.44 81.98 -9.91 13 0000* Reject
Chapters 13.17 2.23 11.33 2.55 1.47 12 0.167 Do not Reject
Sections 68.67 30.39 121.44 23.59 -3.59 9 0.006* Reject
Linear Sections 7.83 5.49 13.22 7.63 -1.59 13 0.136 Do not Reject
Pages for
Linear Functions 34.67 20.55 80.44 50.23 -2.44 11 0.032* Reject
Development 23.29 14.35 40.92 29.10 -1.56 12 0.145 Do not reject
Exercises 9.46 5.69 38.22 21.51 -3.82 10 0.004* Reject
Other 2.29 2.40 1.31 2.27 0.80 10 0.443 Do not Reject
Linear Problems 137.33 79.87 413.67 284.49 -2.76 10 0.021* Reject
Avg. pages/section 3.57 2.01 5.56 2.50 -1.70 12 0.114 Do Not Reject
Images: Object
Analytic 3.33 3.33 12.56 9.55 -2.66 11 .023* Reject
Illustrative 13.50 3.21 28.22 16.19 -4.45 9 .002* Reject
Signposts 6.50 17.09 12.78 11.68 -1.29 13 .218 Do not reject
*Significant when p < 0.05
Note: M = Mean, SD=Standard Deviation
Page 101
91
were different. Using a significance level of 5%, the researcher found that out of the 50
codes for the nine features, there were eight codes different with respect to the percentage
of problems containing those codes within the two countries’ sets of textbooks. These
included (a) ”single” computation, (b) “multiple” response type, (c) ”other” response
type, (d) ”other” problem practice, (e) “interpreting” problem solving competency type,
(f) “does not apply” problem solving competency type, (g) ”multiple” transfer type, and
(h) “does not apply” transfer type. See Table 10 for a complete listing of the values
obtained in the statistical testing. Thus, the researcher found the specific codes for the
features which were represented differently in the two countries textbooks.
A chi-square test of independence was used to determine if the choice of code for
a feature was independent of the countries’ textbooks. For each feature, the Null
hypothesis was that the choice of codes for that feature was independent of the country
from which the textbooks came. The alternative hypothesis was that the two variables,
“codes chosen for that feature” and “country”, were related (not independent). There
were nine chi square tests that were done, one for each feature. The Null hypothesis was
rejected when the calculated probability was less than 0.05. For all nine chi square tests,
the probabilities were less than 0.05, and the Null hypotheses were rejected. The values
associated with these nine tests are found in Table 11. These results indicated that the
selection of codes for each of the nine features was dependent upon the country from
which the textbook came. Thus, the textbooks from Singapore and the U.S. were seen to
be different with respect to the problems. These results suggested that the differences
found among the specific codes in Table 11, showed how the countries’ textbooks were
indeed different with regard to specific codes. A discussion of these results in Chapter 5
Page 102
92
Table 10
Welch’s t-test Values for Codes of Problem Features
Singapore United States
Feature M SD M SD t df p Decision
Computational
Single 0.046 0.032 0.256 0.193 −3.19 9 0.012* Reject
Multiple 0.493 0.267 0.337 0.170 1.27 8 0.241 Do Not Reject
Other 0.294 0.193 0.296 0.136 −0.02 8 0.985 Do Not Reject
Contextual
Numerical 0.245 0.186 0.200 0.134 0.51 8 0.626 Do Not Reject
Visual 0.012 0.024 0.005 0.008 0.61 6 0.564 Do Not Reject
Verbal 0.167 0.112 0.207 0.112 −0.68 11 0.509 Do Not Reject
Combined 0.410 0.264 0.473 0.245 −0.47 10 0.651 Do Not reject
Other 0.000 0.000 0.003 0.009 −1.00 8 0.347 Do Not Reject
Response-Type
Numeric Answer 0.463 0.272 0.323 0.156 1.14 7 0.289 Do Not Reject
Numeric Expression 0.110 0.113 0.111 0.084 −0.02 9 0.988 Do Not Reject
Explanation/Solution 0.018 0.027 0.054 0.044 −1.97 13 0.070 Do Not Reject
Graph Only 0.121 0.110 0.041 0.019 1.76 5 0.136 Do Not Reject
Multiple Response 0.062 0.058 0.196 0.090 −3.49 13 0.004* Reject
Other Response 0.059 0.083 0.163 0.074 −2.50 10 0.032* Reject
Cognitive Requirement
Procedural Practice 0.513 0.254 0.449 0.197 0.52 9 0.614 Do Not Reject
Conceptual 0.206 0.105 0.272 0.128 −1.08 12 0.300 Do Not Reject
Problem Solving 0.084 0.061 0.131 0.079 −1.31 13 0.213 Do Not Reject
Special Requirement 0.000 0.000 0.003 0.004 −2.11 8 0.068 Do Not Reject
Other 0.030 0.045 0.0.034 0.035 −0.18 9 0.864 Do Not Reject
Given Information
Sufficient 0.828 0.406 0.884 0.332 −0.28 9 0.783 Do Not Reject
(Continued)
Page 103
93
Table 10 (Continued)
Welch’s t-test Values for Codes of Problem Features
Singapore United States
Feature M SD M SD t df p Decision
Extraneous 0.000 0.000 0.001 0.001 −1.50 8 0.171 Do Not Reject
Insufficient 0.006 0.010 0.004 0.013 0.26 13 0.800 Do Not Reject
Application Type
Applied 0.223 0.122 0.294 0.156 −0.99 13 0.343 Do Not Reject
Non Applied 0.610 0.304 0.595 0.249 0.10 9 0.919 Do Not Reject
Problem Practices
Symbolic Rule 0.471 0.240 0.441 0.174 0.27 8 0.793 Do Not Reject
Ordered Pair 0.116 0.105 0.079 0.042 0.80 6 0.451 Do Not Reject
Social Data 0.167 0.096 0.188 0.097 −0.40 11 0.695 Do Not Reject
Physical Phenomena 0.000 0.000 0.001 0.003 −1.54 8 0.161 Do Not Reject
Controlling Image 0.069 0.056 0.090 0.060 −0.69 11 0.506 Do Not Reject
Other 0.010 0.018 0.090 0.068 −3.35 10 0.008* Reject
Problem-Solving
Modeling 0.165 0.096 0.184 0.092 −0.38 11 0.712 Do Not Reject
Interpreting 0.003 .005 0.037 0.030 −3.29 9 0.010* Reject
Translating 0.606 0.308 0.493 0.204 0.79 8 0.451 Do Not Reject
Reifying 0.025 0.062 0.018 0.020 0.27 6 0.795 Do Not Reject
Does Not Apply 0.034 0.065 0.157 0.078 −3.30 12 0.006* Reject
Transfer Type
Algebraic to Numeric 0.325 0.206 0.271 0.133 0.57 8 0.586 Do Not Reject
Algebraic to Verbal 0.012 0.029 0.023 0.020 −0.83 8 0.429 Do Not Reject
Algebraic to Graphical 0.083 0.087 0.028 0.018 1.50 5 0.192 Do Not Reject
Numeric to Algebraic 0.020 0.032 0.026 0.027 −0.40 10 0.697 Do Not Reject
Numeric to Verbal 0.002 0.005 0.004 0.006 -0.88 13 0.396 Do Not Reject
(Continued)
Page 104
94
Table 10 (Continued)
Welch’s t-test Values for Codes of Problem Features
Singapore United States
Feature M SD M SD t df p Decision
Numeric to Graphical 0.042 0.032 0.021 0.010 1.62 6 0.159 Do Not Reject
Numeric to Numeric 0.024 0.033 0.020 0.021 0.21 8 0.842 Do Not Reject
Graphical to Algebraic 0.013 0.028 0.020 0.026 -0.49 10 0.633 Do Not Reject
Graphical to Numeric 0.037 0.033 0.032 0.025 0.33 9 0.747 Do Not Reject
Graphical to Verbal 0.009 0.014 0.011 0.011 -0.30 9 0.771 Do Not Reject
Verbal to Algebraic 0.051 0.065 0.067 0.049 -0.53 9 0.611 Do Not Reject
Verbal to Numeric 0.099 0.064 0.051 0.031 1.70 7 0.135 Do Not Reject
Verbal to Graphical 0.023 0.041 0.004 0.005 1.07 5 0.333 Do Not Reject
Multiple Transfer Types 0.034 0.037 0.133 0.073 -3.47 12 0.004* Reject
Does Not Apply 0.060 0.078 0.175 0.096 -2.55 12 0.025* Reject
*Significant when p < 0.05
Note: M = Mean, SD=Standard Deviation
Page 105
95
Table 11
Values for χ2 Test of Independence for Problem Features
Singapore United States
Feature n n χ2 df p Decision
Computational 824 3723 199.38 2 0.000* Reject
Single 50 991
Multiple 504 1463
Other 270 1269
Contextual 43.21 4 0.000* Reject
Numerical 264 821
Visual 7 21
Verbal 179 815
Combined 374 2058
Other 0 8
Response Type 953.71 5 0.000* Reject
Numeric Answer 477 1355
Numeric Expression 116 509
Explanation/Solution 17 202
Graph Only 104 182
Multiple Response 68 765
Other Response 0 8
Cognitive Requirement 15.19 4 0.006* Reject
Procedural Practice 502 2019
Conceptual 204 1070
Problem Solving 90 499
Special Requirement 0 9
Other 28 126
Given Information 3.37 2 0.186* Reject
Sufficient 819 3712
(Continued)
Page 106
96
Table 11 (Continued)
Values for χ2 Test of Independence for Problem Features
Singapore United States
Feature n n χ2 df p Decision
Extraneous 0 2
Insufficient 5 9
Application Type 4.48 1 0.034* Reject
Applied 216 1114
Non Applied 608 2609
Problem Practices 95.34 4 0.000* Reject
Symbolic Rule 476 1858
Ordered Pair 99 322
Social Data 171 713
Physical Phenomena 0 5
Controlling Image 69 419
Other 9 406
Problem-Solving 132.14 4 0.000* Reject
Modeling 169 694
Interpreting 3 134
Translating 586 2152
Reifying 32 86
Does Not Apply 34 657
Transfer Type 0.133 254.57 14 0.000* Reject
Algebraic to Numeric 338 1136
Algebraic to Verbal 6 82
Algebraic to Graphical 66 140
Numeric to Algebraic 19 152
Numeric to Verbal 2 15
Numeric to Graphical 39 81
(Continued)
Page 107
97
Table 11 (Continued)
Values for χ2 Test of Independence for Problem Features
Singapore United States
Feature n n χ2 df p Decision
Numeric to Numeric 22 92
Graphical to Algebraic 8 126
Graphical to Numeric 40 143
Graphical to Verbal 8 46
Verbal to Algebraic 55 253
Verbal to Numeric 102 201
Verbal to Graphical 14 19
Multiple Transfer Types 38 499
Does Not Apply 67 738
*Significant when p < 0.05.
Note: N=4547, For Singapore, n = 824, for U.S. n = 3723.
Page 108
98
will further clarify concrete ways in which the countries’ textbooks appear to differ, as
well as distinguishing ways they are similar. The researcher will also discuss how the
results relate to the six research questions on which the study was based.
Page 109
99
CHAPTER V
DISCUSSION
In this study, the researcher compared treatments of the topic of linear functions
in Singapore and U.S middle grades mathematics textbooks. Specifically the researcher
addressed the following research questions:
1. How do the treatments of the topic of linear functions in middle grades
mathematics textbooks of Singapore compare to the treatments of the topic of
linear functions in middle grades mathematics textbooks of the U.S.?
Treatments of the topic refer to the ways linear functions are presented in
general in the text and how the topic is represented in the problems of the text
particularly with regard to the 22 features the researcher examined.
2. What are the similarities and differences of the conceptual types of problems
related to the topic of linear functions within the middle grades mathematics
textbooks of Singapore and the U. S.?
3. How are problems related to linear functions in middle grades mathematics
textbooks of Singapore and the U.S. different or similar with respect to
computational requirement, context, required response, cognitive requirement,
and given information?
4. Are the characterizations of problem practices as seen in the problems related
to linear functions in middle grades mathematics textbooks from Singapore and
from the U.S. the same or different?
5. How do the problem-solving competency types in the problems related to linear
Page 110
100
functions in middle grades mathematics textbooks from Singapore and from the
U.S. compare?
6. How do the types of transfer of representation needed to do the problems
pertaining to linear functions in middle grades mathematics textbooks from
Singapore compare to the types of transfer of representation needed to do the
problems pertaining to linear functions in middle grades mathematics textbooks
from the U.S.?
In this chapter, the discussion has two parts: (a) examining the general features of the
textbook and (b) examining the general features of problems and the specific
characterizations of problem features. The researcher has included possible reasons for
findings within these sections before addressing (a) areas of future research, (b)
significance of the study, (c) implications for practice, and (d) limitations of the study.
Research Questions
The first research question was a general question concerning the entire study and
focused on both general features of the textbooks and also on features pertaining to the
problems in the textbooks of the two countries. Research questions 2 through 6 focused
specifically on the features pertaining to the linear functions problems in the textbooks.
Thus, the researcher chose to divide the discussion of the research questions up into two
parts, an examination of the general features of the textbook and then an examination of
the features pertaining to problems.
Examination of General Features
To address research question 1 with respect to the general features of the
textbook, the researcher used Welch’s t-test for the 13 general features. The Welch’s t-
Page 111
101
tests conducted on the general features showed that the two countries’ textbooks were
different with respect to seven general aspects of the text and were not significantly
different with respect to six features of the text. A compilation of the general features that
were significantly different versus not significantly different, according to Welch’s t-
tests, showed the general trends in the two countries’ textbooks. See Figure 6. The greater
number of pages, of problems, and of images in the U.S. textbooks coincided with what
has been noted in research about primary textbooks from Singapore and the U.S.
(Ginsburg et al., 2005). While the number of pages in the two countries’ textbooks was
different, the number of chapters in the two countries’ textbooks was similar. Thus,
chapters were longer in the U.S. textbooks compared to Singapore textbooks. Also, while
the number of sections was different in the two countries’ textbooks, the number of
sections pertaining to linear functions was not significantly different. However, the
number of pages pertaining to linear functions was significantly different between the
two countries’ textbooks with the U.S. textbooks averaging over twice the Singapore
average, 80.44 pages versus 34.67 pages respectively.
Similar Different
Number of Chapters Number of Pages in Text
Number of Linear Function Sections Number of Sections
Number of Pages for Development Number of Pages for Linear Functions
Number of Other Pages Number of Pages for Exercises
Average Pages per Section Number of Linear Function Problems
Number of Signposts Number of Object Analytic Images
Number of Object Analytic Images
Figure 6. Similarities and Differences of General Features of Textbooks.
An examination of the breakdown of number of pages for linear functions into
”development”, ”exercises”, and ”other” pages, revealed that the U.S. and Singapore
Page 112
102
textbooks had similar numbers of pages for ”development” and for ”other” but differed
significantly in regard to the number of pages for exercises. The U.S. average for number
of pages for exercises in the linear functions sections was over 4 times greater than the
Singapore average, 38.22 versus 9.46, respectively. When calculating the percentage of
exercise pages in the textbooks using the average of the number of exercise pages divided
by the average of the number of pages in the text, Singapore textbook averages yielded
2.4% of the pages for exercises while the U.S. textbook averages yielded 5.3% of the
pages were for exercises. The fact that U.S. textbooks had a greater number of pages for
exercises corresponds to the fact that there were a greater number of exercises in U.S.
textbooks.
The greater number of exercises in the U.S. textbooks may be partly explained by
the type of student being taught. In Singapore, the students come with a known skill set
established by a national curriculum and high stakes testing, which ensure that students
know prerequisite information (Soh, 2008). The U.S. has had state established curricula
that have been documented as being quite different between states (Reys, Dingman,
Nevel, & Teuscher, 2007). Thus, U.S. students in the same grade level may not have the
same curriculum as other students from different states. Having different state curricula
affects the exercises contained in the textbook as publishing companies cater to the
widest market available and include problems for the standards from many states (Seeley,
2003). Thus, the researcher suggests that this has the two-pronged effect of increasing the
number of problems in the textbook and causing repetition of similar problems in
different sections.
Page 113
103
An additional reason for the difference in the number of exercises in the
countries’ textbooks may be due to Singapore’s reduction in content that has been
developed over years of examining the scope and sequence of the mathematics
curriculum in an effort to ensure that students learn the concepts well and are prepared
for future learning (Soh, 2008). The carefully planned Singapore curriculum also has a
built-in spiral approach that calls for a revisiting of material but only at a deeper level.
This reduces the number of exercises that a textbook contains because the publisher does
not feel pressure to include all concepts every time the topic is presented.
An examination of the U.S. textbooks shows that this is not the case for the U.S.
Comparing the 6th
grade and 7th
grade textbooks shows that there are problems which
cover the very same material in both years. A very clear example of this overlap in
material is seen in Glencoe’s Math Connects Course 1 and Course 2 textbooks for sixth
and seventh grades. There is a chapter where the section headings are almost the same,
and the problems are very similar within these sections. See Table 12 for an example.
There is little spiral approach and little discernable difference between some of the topics
covered in the two grades. Thus, differences in the scope and sequence of the countries’
mathematics curricula seem to be one cause of differences in the textbooks. In 2001,
Schmidt et al. described the U.S. mathematics curricula as being “a mile wide and an inch
deep” (p. 301) and noted the repetitiveness of the content covered. Although changes
have been made to state curricula as a direct result of this description (Teuscher & Reyes,
2010) and there is an awareness of the problem (National Governors Association Center
for Best Practices, 2010), more needs to be done to address this issue.
Page 114
104
Table 12
Overlap in Glencoe Math Connects Textbooks
Feature Course 1 (Sixth Grade) Course 2 (Seventh Grade)
Chapter 7 Solve Equations 3 Linear Equations
Section Addition and Subtraction Equations Addition and Subtraction Equations
Problem 5. Number Sense: A number is 5. Number Theory: A number is
multiplied by 4, and then 6 is multiplied by −3. Then 6 is
added to the product. The subtracted from the product. After
result is 18. What is the adding −7, the result is −25. What
number? is the number?
Until some policy is in place to ensure that all students are taught the same
content in the same year, U.S. students will continue to have the different levels of
preparedness (Reys, 2014; Reys, Dingman, Nevel, & Teuscher, 2007). In 2009, the U.S.
began the process of establishing a voluntary national curriculum known as the Common
Core State Standards for Mathematics. The task of changing the 50 individual state
curricula and creating one national curriculum is in the beginning stages. The number of
states that have adopted the Common Core has fallen from 45 states to 42 states
(Standards in Your State, 2015) within the past year. Several states have legislation
pending regarding repealing or delaying the Common Core and/or the testing associated
with the Common Core (Bidwell, 2014). The curriculum is so new that it is unclear what
the effects will be on student learning.
The 2014-2015 school year is scheduled to be when assessments designed
specifically for the Common Core will be used to make sure students are progressing
Page 115
105
appropriately (Frequently Asked Questions, 2015). The recent advent of the Common
Core and the upcoming test scores present an opportune time for curriculum developers
to make a concerted effort to follow Singapore’s example. Curriculum developers and
those who create curriculum materials should examine the scope and sequence of the
mathematics curriculum meticulously to make sure it is doing what is expected, allowing
teachers to teach and students to learn the concepts well.
Concerning the number of images, object analytic and object illustrative,
Singapore textbooks had few images while the U.S. textbooks contained an abundance of
images. Many pages in the U.S. textbooks seemed to be full not just of images but of text
and patterns. Singapore textbooks, on the other hand, had pages which contained a lot of
blank space. This openness and simplicity seemed to increase the readability of the
Singapore textbooks. One could describe the two presentations of images as orderly and
bare for Singapore versus full and busy for the U.S. See Appendix H for a sample
textbook page from each country. A future study would be to measure and compare the
amount of space covered by images and text in each textbook.
The difference that was seen in the number of images in the textbook may be
rooted in sociocultural theory which has as its premise that all learning is affected by
one’s beliefs and values which come from the surrounding culture (Cherry, 2015). The
number of images seen in the text may be due to differences in culture as described by
Leung (2001) when he described the western countries’ culture of “pleasurable learning”
seen in the U.S. versus a culture of “hard work” seen in East Asian countries (p. 41). U.S.
publishers and textbook authors seem to fill the book with something to entertain and get
students interested in the subject while Singapore publishers and textbook authors seem
Page 116
106
to stick with an all-business, no frills approach. This could also be indicative of the
difference noted between students’ intrinsic motivation to learn mathematics in East
Asian countries and students’ extrinsic motivation to learn mathematics in the U.S.
(Leung, 2001). Chen and Uttal (1988) also determined that Chinese students have “a
belief system that focuses on internal goals” (p. 357) that has been passed down from
their culture. This intrinsic motivation to learn is also seen in Singapore as 74% of the
population is classified as Chinese (Department of Statistics Singapore, 2013). Thus,
Singapore students seem to have an inner drive to learn mathematics while U.S. students
seem to need an outward source to motivate them to learn. In an age where many students
are often bombarded by an array of technological distractions, if one believes that
students are mainly motivated to learn through external stimuli, then the textbook should
look ”busy” in an attempt to keep the student’s attention. Of course, the next step would
be an electronic form of the textbook, but that is beyond the scope of this discussion.
Interestingly, both countries’ textbooks contain similar numbers of signposts/attention-
getters such as caution or connection boxes. However, the signposts in the Singapore
textbooks typically had a smaller font and were positioned so they did not detract from
the main text.
Examination of Problem Features
To determine how the two countries’ textbooks compared in regard to the nine
problem features, chi-square tests for independence indicated that the choice of code for
each problem feature was dependent upon the country of origin. Welch’s t-tests revealed
the individual codes for each feature that were significantly different within the two
countries’ textbooks. Interestingly, out of the 50 codes for the nine features, eight of them
Page 117
107
were found to be significantly different and 42 of them were found to be similar. See
Figure 7.
Problem Feature Significantly Different Codes
Computational Single
Contextual No Codes
Response-type Multiple, Other
Cognitive Requirement No Codes
Given Information No Codes
Application-type No Codes
Problem Practices Other
Problem-solving Competency Interpreting, Does Not Apply
Transfer Type Multiple, Does Not Apply
Figure 7. Significantly Different Codes for Problem Features.
For research question 2, “What are the similarities and differences of the
conceptual types of problems related to the topic of linear functions within the middle
grades mathematics textbooks of Singapore and the U.S.?”, the countries’ textbooks
initially looked as if they were very similar. The statistical testing showed that both
countries had similar percentages of applied problems versus non-applied problems.
Similarly with the Cognitive Requirement feature, the types of cognitive level required to
do the problems was similar in both countries. However, for the Response-Type feature,
the codes “Multiple Response” and “Other Response” were found to be different with the
U.S. textbooks containing a higher percentage of these response types than the Singapore
textbooks. The Problem Practices feature differed in the code “Other” with the U.S.
textbooks containing more of this type of practice. For the Problem-Solving feature, the
categories “Interpreting” and “Does Not Apply” were found to be different with the U.S.
textbooks containing more problems with these features. The Transfer-type feature
differed in the codes “Does Not Apply” and “Multiple” with the U.S. textbooks
Page 118
108
containing more of each of these codes. Thus, the two countries’ textbooks did differ in
some way with respect to the conceptual types of problems.
The textbooks differed in the way the problems directed students to demonstrate
conceptual learning. The codes which were different for each of these categories mostly
occurred when U.S. problems directed students to (a) define or explain a definition or
rule, (b) state the name of the rule being used in the problem, or (c) create a problem that
uses a particular concept. These problems were designed to make sure that students
gained conceptual knowledge. When a problem has a code of “Multiple” response type or
representation, these problems were also designed to make certain that students could
make connections between multiple concepts in a problem. Singapore textbooks had very
few of these problems. Thus, the textbooks differed in the way that students were asked
to show they have conceptual understanding of the problem.
The lack of definition problems in Singapore textbooks may be influenced by
sociocultural factors as seen by the difference in the importance given to rote learning by
Eastern culture versus the importance given to “meaningful learning” (p. 39) by Western
culture as presented by Leung (2001). This is also supported by the averages of the
percentage of procedural practice problems and the conceptual understanding problems in
the Cognitive Requirement feature. While not evidencing a significant difference, the
procedural practice averages, 0.513 vs. 0.449, and the conceptual understanding averages,
0.206 vs. 0.272, for Singapore and the U.S. respectively, seem to hint at this tendency.
The inter-play of the importance of memorization and of intrinsic motivation to learn and
do well, which has been documented as a part of East Asian culture (Leung, 1995; Chen
& Uttal, 1988), may help explain why there are not as many definition problems in the
Page 119
109
Singapore textbooks. Singaporean students are assumed to learn definitions and rules
without problems to help them do so. Another reason may be the differentiated
mathematics curriculum by ability that Singapore has in place starting in primary 5 which
may assume that students who want to advance will know the material adequately (Soh,
2008). Another reason for this difference may also stem from the carefully delineated
curriculum that Singapore has in place which has been meticulously examined to reduce
the number of problems and skills in the textbook (Soh, 2008). This would eliminate the
need to repeat definitions as problems.
For research question 3, “How are problems related to linear functions in middle
grades mathematics textbooks of Singapore and the U.S. different or similar with respect
to computational requirement, context, required response, cognitive requirement, and
given information?”, the two countries’ textbooks differed with respect to the
Computational Requirement feature. The code “Single computations” was significantly
different in the countries’ sets of textbooks. U.S. textbooks contained a much higher
percentage of problems requiring only a single computation to answer the question than
the Singapore textbooks, an average percentage of 25.6% versus 4.6% respectively. The
difference in number of single vs. multi-computation problems may affect results on
international comparison assessments like the TIMSS. An examination of the released
items from the TIMSS 2011 (Foy, Arora, & Stanco, 2013) revealed that more than one
computation is typically required to answer the problem. With fewer single computation
problems, Singapore students are able to practice problems which are more similar to
those seen on these assessments.
Page 120
110
There are a few reasons why U.S. textbooks contain more single computation
problems. U.S. schools have students with a more varied knowledge base due to lack of
conformity to the same curriculum (Reys et al. 2007; Seeley, 2003). Thus, one of the
reasons why U.S. textbooks have more single computation problems may be to help
students who are lacking in prior knowledge get caught up to other students. Another
reason may well be due to Singapore’s spiral approach which delineates the topics in the
curriculum in such a way that repetitiveness is unnecessary. Singapore students only
revisit a topic to go into further depth with the topic. This is not the case for U.S.
textbooks. Glencoe’s Florida Math Connects 1 and Glencoe’s Florida Math Connects 2
has a chapter where the sections are called almost the same name. The intent seemed to
be to revisit the old material with new terminology and a little more depth, but the
attempt of the use of the spiral approach falls short. There was no evidence of a proper
usage of the spiral approach in Ginsburg et al.’s (2005) examination of U.S. primary
textbooks.
There were features relating to problems that were similar in the countries’
textbooks. There were no codes that were different for the Contextual feature, so how the
problem statement was presented in the text was similar in both countries. Similarly, for
the Computational Requirement feature, the countries’ textbooks had a similar proportion
of problems that require no computations such as “graph the line”. Also, the two
countries’ textbooks were similar in the information given in the problem with almost all
of the problems containing sufficient information to do the problem. Thus, the textbooks
were similar in regard to the general appearance of the problems.
Page 121
111
The discussion of the Required Response feature will now be done as a larger
discussion of research questions 4-6 concerning the three classifications of problem
practices. The differences that were seen in the two countries’ textbooks concerning these
four problem features all related to the same observances between the two countries’
textbooks. Both the Required Response feature and the Problem Practices feature differed
in the code “Other” between the two countries’ textbooks. Also, the Problem-Solving
Competency feature and the Transfer of Representation Type feature differed in the code
“Does not apply”. The codes “Other” and “Does not apply” occurred when U.S. textbook
problems contained directions which indicated that students were to use a definition, state
a rule, or create a problem in which the concept they were learning could be used. See
Figure 8 for examples of these types of problems. The Singapore textbooks had very few
problems that asked students to explain definitions, state which definition or theorem is
being used, or create a problem which must be solved using the concept they were
learning. This may well stem from the differences in the two countries’ curriculum and in
the attitudes concerning rote learning, memorization, and motivation as postulated
previously within the discussion of Research Question 2. Another reason may be that
Singapore teachers discuss these types of problem in the classroom.
Other Use Rule to Find the Error
Write a real-world problem that could be Daniella is finding the output when
represented by a relation. the function rule is 10÷ 𝑥 and the
input is 2. Find her mistake and
correct it. 2 ÷ 10 = 0.2
Glencoe Math Connects 1 (p. 420) Glencoe Math Connects 1 (p. 426)
Figure 8. U.S. “Other” and “Does Not Apply” Problems.
Page 122
112
The Response type feature and the Transfer of representation feature also had the
appearance of the code of “Multiple” being different in the countries’ textbooks. In U.S.
textbooks, students were asked for several different responses for one problem, while
Singapore students were only asked for one response. The U.S. textbooks also directed
students to perform multiple transfer of representation types in a single problem, while
Singapore textbooks only required at most one transfer of representation type to obtain
the answer. Many problems in the U.S. textbooks required students to do multiple things
within one problem, so a question would require multiple response types and/or multiple
transfer types in order for the student to answer the problem. Problems from the
textbooks from Singapore, however, typically contained only one thing for students to do,
and, usually, there was a whole set of problems where students were directed to find just
this one thing. See Figure 9 for sample problems from each country.
United States Singapore
You spend 39 minutes walking and There are twice as many 50₵ coins
brushing your dog. Brushing takes 15 as there are $1 coins in a box. If the
minutes. Write and solve an addition total amount of money in the box is
equation to find the number of minutes $154, how many 50₵ coins are
you spend walking your dog. Explain there left in it?
another method you could use to Mathematics Matters S1
find your walking time.
McDougal Littell Math Course 1
Figure 9. Response Type Sample Problems.
The U.S. seemed to emphasize making connections between different
representations as this is deemed a necessary mathematics skill particularly by the NCTM
(2000). The transfer of representation types is also established as a standard in eighth
grade in the Common Core Mathematics States Standards (National Governors
Page 123
113
Association Center of Best Practices, 2010). U.S. textbooks had several questions which
asked for several transfer of representation types in one problem. In Singapore, the
problems seemed to be designed for students to concentrate on one objective at a time
before moving on to a different representation type or different response type in a
different problem. This may be directly related to the established sequence in the
curriculum of Singapore designed to ensure that students learn the concepts well and are
prepared for future learning (Soh, 2008). Having students, many of whom struggle with
mathematics, focus on only one aspect of a problem at a time seems like a good approach
to help students learn a topic well. Another reason for the lack of multiple response or
transfer of representation types in Singapore textbooks may stem from differences in
cognitive complexity or cognitive demand of the problem which this study did not
specifically examine. The two examples in Figure 9 seem to indicate that there is a
difference in cognitive complexity. Examining cognitive complexity within the exercises
in Singapore versus U.S. textbooks would be an interesting future study.
An examination of the released test items from TIMSS-2011 (Foy, Arora, &
Stanco, 2013) revealed that the problems do require a transfer of representation type to
get the answer as set forth as important by NCTM (2000) and CCMSS (National
Governors Association Center of Best Practices, 2010). However, the questions are
formatted in such a way that more closely aligns to the problems in the Singapore
textbooks. There are no directions which guide the student in how to go about thinking
through the problem. The directions are formatted as find x, find area or similar wording.
For example, when given a rectangle whose sides are labeled x and x + 2 respectively, the
directions are, “What is the area of this rectangle?” (Foy, Arora, & Stanco, 2013) Another
Page 124
114
example is as follows: “A piece of wood was 40 cm long. It was cut into 3 pieces. The
lengths in cm are 2x – 5, x + 7, x + 6. What is the length of the longest piece?” (Foy,
Arora, & Stanco, 2013). Thus, the problem directions in the Singapore texts may help
prepare the students better for international assessments.
All forms of transfer of representation types as seen in the Concept Map from
Figure 3 in Chapter 1 are contained in the U.S. problems. In Singapore, however, there is
a dearth of transfer of representation problems going to the verbal representation. This
difference is also seen in the Problem-solving Competency feature, as the two countries’
textbooks were also found to be different with regard to the code “Interpreting”.
Interestingly, many of the problems from the U.S. required a student to interpret an
answer into words, while very few problems within the Singapore textbooks had this
requirement. This seemed to be a surprising revelation until one begins to consider that
the careful planning of the curriculum in Singapore uses the spiral approach (Soh, 2008)
that allows for students to master one aspect of a topic before revisiting the topic at
greater depth in a future class. An examination of the Mathematics Syllabus in Singapore
indeed showed that interpretation is covered in Secondary 3 and Secondary 4, that is,
ninth and tenth grade (Ministry of Education Singapore, 2006b). Thus, the Singapore
curriculum is designed for students to master solving equations and application problems
before being introduced to the additional concept of interpreting what a numeric answer
means in words. This delay in introducing every aspect of solving a word problem to the
student may help some students who need to learn one aspect of solving the problem well
before proceeding on to another aspect.
Page 125
115
Interestingly, an examination of the released items for the PISA-2012 showed that
the PISA contains all four of the transfer of representation types which includes
interpreting (OECD, 2013). This test is given to students who are 15 years old.
Singapore’s curriculum aligns with the timing of this international test.
While the discussion thus far has addressed mainly differences, the two countries’
textbooks were similar in many respects. Both contained the typical problems that one
would expect to see in a beginning algebra program: (a) solve the equation, (b) solve the
application problem, (c) find the slope, (d) graph the line or point, (e) find the equation of
the line, (f) evaluate y when given a x, and many others. With respect to the problem
features, of the 50 codes, 42 of them were similar. The main similarities in the problems
were that the problems were similar in how they were presented in the text, the
information contained in the problem, and the number of applied versus non-applied
problems. The main differences seemed to be in the assessment of conceptual learning
through the use of definitions, multiple representations, multiple response types, and
interpreting problems and in the number of computations needed to solve the problem.
Future Research
This study revealed several areas for potential research. Broadly, these areas
include (a) multiple response types, particularly in relation to cognitive complexity, (b)
number of pages and problems, (c) spiral approach in U.S. textbooks, (d) meticulous
examination of U.S. curricula and (e) measuring the amount of space or amount of
images on a page.
The first area of study would be studies concerning multiple responses or
representations versus single responses or representations in a problem. Does asking one
Page 126
116
question per problem affect student learning differently than asking more than one
question per problem? One possible study would be to examine the cognitive complexity
within the single- versus multi- response types. Is the single-response question more
challenging than the multi-response question? Perhaps, asking students to do one thing
per problem may be a useful technique to help students who are struggling in
mathematics. Another interesting study would be to look at problems with regard to
cognitive complexity without any connection to the computation requirement.
Another study would be try to determine why there is such a difference in the
number of pages and the number of problems in the textbook between the two countries?
Which problems and pages are actually assigned in the classroom? Are there more
multiple computation problems assigned than single computation problems? The number
of pages and problems in the U.S. textbook is much greater than the number of pages and
problems in Singapore textbooks. A closer examination of Singapore’s reduction in
content that developed over years and the process of attaining the reduction as mentioned
by Soh (2008) should be useful.
Another follow-up study to what has been seen in this study is a study concerning
the spiral approach. Should the spiral approach be used in U.S. textbooks? At what level
is the spiral approach already seen in U.S. textbooks? The spiral approach may be a
useful way to eliminate repetitive problems in the U.S. mathematics curriculum. Does a
spiral approach more similar to that used in Singapore produce higher student
achievement in the US?
Another area of potential research involves studies which facilitate a meticulous
examination of the developing U.S. mathematics curriculum, presumably the Common
Page 127
117
Core. The Common Core begins with stating that a focus of the document is to create a
“greater focus and coherence” (National Governors Association Center for Best
Practices, 2010, p. 3) in the U.S. mathematics curriculum. Further studies will continue
the process of creating a well-delineated curriculum that allows teachers to teach each
concept completely and with rigor and allows students to learn the concepts well and be
prepared for future learning. Soh (2008) described such a task as a necessary process
when Singapore changed its curriculum. Similarly, Usiskin (2014) recommended
continued examination and revision of the Common Core mathematics curriculum.
Within this examination should be attention to textbooks with respect to (a) number of
pages and number of problems, (b) multiple tasks within one problem, and (c) the spiral
approach.
The final area of potentially valuable research includes studies which measure the
space on the page. Similar to past studies on primary textbooks from Singapore and the
U.S. (Ginsburg et al., 2005), the current study found the number of images in middle
school textbooks in the U.S. to be greater than the number of images in middle school
textbooks from Singapore. The difference in appearance of the two countries’ textbooks
went beyond just the number of images in the text. U.S. textbooks were full of text,
pictures, even colors and patterns while Singapore’s textbooks were sparse with little
extra text, pictures, and colors and patterns. A future study would be to measure and
compare the amount of space covered by images and text in each textbook.
The idea of measuring the white space on a page or web page is known as
measuring text density and is thought to affect search time of a webpage (Weller, 2004).
Weller discusses the differences between overall density, “a percentage of the characters
Page 128
118
present in relation to overall space available” (p. 1), local density, “number of other
characters in proximity to a character…a measure of how tightly packed the information
is on the screen” (p. 1), and white space, “blank space on a screen that does not contain
text” (p. 1) in her study on the effects of white space on visual search time.
The appearance of the textbooks examined in this dissertation along with the
finding that the two countries’ textbooks differ in the number of object-illustrative and
object-analytic images lead the researcher to suggest that a study comparing the densities
of the pages within the textbooks from Singapore and the U.S. would be worthwhile. The
appearance of the page may affect readability of the text which in turn may affect
comprehension of the concepts presented. Alacaci, Bulut and Erbaş (2012) classified text
density as an examination of visual design and readability in their comparison of 6th
grade textbooks from Turkey, Singapore, and the U.S. However, no details were given in
the article about how they measured this feature. If the empty space can be quantified and
compared, this would be the first step in developing studies to determine if the amount of
empty space on textbook pages affects student learning.
Significance of Study
The textual analysis was a comparison of the breadth and depth of the
mathematics curriculum pertaining to linear functions as seen in the middle grades
mathematics textbooks from Singapore and the U.S. The textbooks from the two
countries were found to be similar in many aspects. One interesting similarity was that
the problem statements, that is, the context of the problems, were similar in both
countries’ textbooks. However, the U.S. texts contained significantly more problems
requiring (a) the use of a definition in some way, (b) a single computation, (c)
Page 129
119
interpreting, and (d) multiple responses or representations within one problem. The U.S.
textbooks contained many more problems and pages than the Singapore textbooks.
Knowing the similarities and differences in the two countries’ textbooks will allow those
involved with curriculum and educational materials to focus on these aspects and
determine which features, if any, need to be changed to affect the content and sequence
of the content in the textbooks. Additionally, knowing about the textbook features and
these similarities and differences can inform individuals providing professional
development to teachers to help U.S. teachers think more deeply about the problems they
are selecting for their students to complete. The similarities and differences also provide
avenues for further research toward improvement of U.S. student mathematics learning
and achievement.
During the 2014-2015 school-year, assessments made specifically for the
Common Core are scheduled to be used to check student progress (Frequently Asked
Questions, 2015). The upcoming Common Core assessments present an opportune time
for curriculum developers to make a concerted effort to examine textbooks to see if there
are any features that may need to be altered. This would include checking for a possible
reduction in number of problems. At the Annual Conference of the Association of
Mathematics Teacher Educators in February, 2014, Barbara Reys said, “To be successful,
the Common Core and the aligned assessments must be partnered with content-rich
curriculum materials…”, “…there is an immediate need for new curriculum materials”
(p. 9). There is also the need for constantly assessing the materials and curriculum
currently being used. The process of changing the Common Core and subsequently
Page 130
120
changing the curriculum materials, including textbooks, will not be an easy one (Usiskin,
2014).
In An Overview of Mathematics Education in Singapore, Soh (2008) discussed the
careful and painstaking process that Singapore goes through in creating and changing the
mathematics curriculum. In particular, he points out the need to make sure that
extraneous content is culled but essential content is kept in order to make sure that
teachers have time to teach without losing rigor and that students have time to learn the
content well in each grade level. Indeed, he surmised that the process of reducing
quantity while keeping core skills and concepts necessary for future learning is a long,
arduous process. A process which necessarily has feedback from all groups involved, (a)
curriculum specialists, (b) curriculum planning officers, (c) teachers from every level, (d)
mathematicians and mathematics educators from all levels of education above secondary
level, and (e) representatives from the Singapore Examination and Assessment Board and
other assessment groups. This process of enacting change is something that those
involved with curriculum development and implementation in the U.S., including
textbook writers and publishers, should be aware of. With the upcoming Common Core
assessments, all involved with curriculum need to begin the process of re-assessing the
scope and sequence of the U.S. mathematics curriculum and make changes where
needed.
The results of this study revealed examples of where having a well-thought out
sequence and plan for the curriculum affects the problems in the textbook. For example,
the lack of “interpret” problems in the Singapore textbooks shows how the curriculum is
set up so students learn how to solve equations one year and then are introduced to the
Page 131
121
new concept of interpreting the equations they solve in the next grade level. This re-
visiting of a concept only to deepen knowledge is the spiral approach that Singapore uses
to reduce the number of concepts learned each year. U.S. students are exposed to all parts
of a concept all at once and then repeat the same concept the next year. Such repetition is
one reason for the greater number of problems seen in the U.S. textbooks. The
discrepancy in the numbers of problems between the two countries’ textbooks was
another result which demonstrated the need for a more well-planned-out curriculum in
the U.S. Without a clear-cut sequence of skills and concepts to teach at each grade level
in the U.S. mathematics curriculum, U.S. textbooks present a wide collection of problems
encompassing the curriculum in as many states as possible (Seeley, 2003). Thus, the need
to have a clear-cut sequence of skills and concepts at each grade level is seen from
differences found in the two countries’ textbooks. This was an unexpected conclusion
based upon the results of the study. Mathematics curricula described as “a mile wide and
an inch deep” (Schmidt et al., 2002, p. 301) continues to be a problem in the U.S.
Examining the textbook is a natural accompaniment to the change in mathematics
curriculum that is set to take place with the Common Core. This study highlighted some
things that need to be examined further which may lead to changes that are needed in the
textbooks. The amount of space covered on a page by images and print needs to be
examined in greater detail with regard to readability. The readability of the text is one
aspect of the textbook which may affect student achievement. The two countries’
textbooks differed greatly in regard to the appearance of the page. Another aspect of the
textbook which may affect student achievement is problems that require more than one
response or transfer of representation to answer the question. U.S. students were asked
Page 132
122
for multiple responses while Singapore students were only asked for one. Further
research is needed to see if requiring multiple responses helps, hinders, or does not affect
student learning. The researcher suggests that publishers and textbook writers should
carefully re-consider putting problems with multiple responses or multiple transfers of
representation types in one problem. An examination of exercises with respect to
cognitive complexity is also recommended.
Implications for Practice
The coding process used in this study may be beneficial as a tool to assist
textbook adoption committee members in examining textbooks before adopting a
textbook. The codebook not only provides a way to compare problems between textbooks
but also provides a way to determine the features in a single textbook. Being able to
systematically examine problems in a textbook for content can be helpful in the adoption
process as well as in the writing and publication of a textbook. The codebook provides a
way for publishers to ensure that the textbooks contain the content educators desire.
The coding process could also be used as a tool to scientifically examine how
textbooks align to international comparison assessments. By using the codebook to code
released items from the international tests, one could get a better understanding of how
the problems from the textbooks align with the problems from international assessments.
Limitations of Study
Some limitations to this study related to the coder training. While two textbooks
and at least 210 problems were used in the coder training for this dissertation, future
researchers should use more than two textbooks for the coder training process. This will
allow the coders to see a greater variety of problems and have enough experience with
Page 133
123
coding to determine if there needs to be a new code added to the codebook before starting
to code in the actual study. The study was limited due to the Transfer of Representation
Types feature needing to be split into more detailed categories. For example, the numeric
representation should have been split into three different categories, (a) numeral, (b)
ordered pair, and (c) table. The graphical representation could also have been split into
the two categories graphical and image as there was not a separate category for geometric
diagrams. Geometric diagrams were addressed in the study in the characterization of
problem practices feature under the code “controlling image”.
Another limitation to the study was human error. During the coder training
process, there were errors made in the entry of the codes into the Excel worksheet.
Because the errors were found in the coder-training process, for the actual study, column
sums and row sums were added to the Excel worksheet as a check for human error.
A final limitation was the fact that as many states are moving toward the Common
Core, textbooks are in a time of transition. The U.S. textbooks that were examined for
this study are already changing. There is a need for continued study of the new textbooks
that are being made for the Common Core.
Summary Remarks
The researcher found some ways in which the textbooks from Singapore and the
United States were similar and some ways in which they were different. In general, the
two countries’ textbooks were similar in the number of (a) chapters, (b) linear function
sections, (c) pages for development, (d) other pages, and (e) signposts. However, the
overall appearance of the page was quite different in the two countries’ textbooks. The
different number of object-illustrative images and object-analytic images in the two
Page 134
124
countries’ textbooks supported a more distinct difference seen in the overall appearance
of the page. This difference could be described as bare for the Singapore texts and busy
for the U.S. texts. The U.S. texts also contained a greater number of (a) pages, (b)
exercises, (c) sections, (d) linear function pages and (e) pages for exercises. Thus the
general overall appearance of the countries’ textbooks was quite different.
However, the two countries’ textbooks were quite similar with regard to the way
the problems were presented. Both contained typical problems that one would expect to
see in a beginning algebra program. The main similarities were that the problems were
similar in how they were presented in the text, the information contained in the problem,
and the ratio of applied versus non-applied problems. The main differences seemed to be
in the assessment of conceptual learning through the use of definitions, multiple
representations, multiple response types, interpreting problems and in the number of
computations needed to solve the problem. Thus, the U.S. textbooks contained a greater
variety of problems than the textbooks from Singapore.
Areas of future research include studies on (a) the density of the textbook page,
(b) the number of assigned pages and problems, (c) the spiral approach, (d) multiple
responses, and (e) the Common Core mathematics curriculum. The researcher also
suggests that all involved in U.S. mathematics curricula should make a concerted effort to
examine the scope and sequence of the current curricula and proposed Common Core
State Standards for mathematics in order to develop a carefully delineated curriculum
designed so teachers may teach each concept completely and with rigor and students can
learn the concepts well and be prepared for future learning. An examination of curricula
Page 135
125
necessitates an examination of the textbook. Thus, the researcher concludes by asserting
the need for more textbook examination studies as well as textbook comparison studies.
Page 136
126
References
Achieve, Inc. (2008). Middle school model two-year course sequence. Washington, D.C.,
Achieve, Inc. 1-12. Retrieved from
http://www.achieve.org/files/MiddleSchoolModelTwo-YearSequence.pdf
ACT. (2004). Crisis at the core: Preparing all students for college and work. Iowa City,
IA: Author.
ACT (2009). ACT Profile Report-National. Graduating Class 2009. Retrieved from
http://www.act.org/news/data/09/pdf/National2009.pdf
Ahuja, O. P. (2006). World-class high quality mathematics education for all K-12
American students. The Montana Mathematics Enthusiast, 3(2), 223-248.
Alacaci, C., Bulut, & M., Erbaş, A.K. (2012). A comparison of mathematics textbooks
from Turkey, Singapore and the United States. Educational Sciences: Theory and
Practice, 12(3), 2324-2329.
American Association for the Advancement of Science. (1999). Project 2061 textbook
evaluations: Middle grades mathematics textbooks. Retrieved from
http://project2061.aaas.org./publications/textbook/default.htm
Anderson, J. R., Reder, L. M., & Simon, H. A. (2000). Applications and misapplications
of cognitive psychology to mathematics education. Texas Educational Review.
[Online] http://act-r.psy.cmu.edu/papers/misapplied.html
Baldi, S., Jin, Y., Skemer, M., Green, P. J., & Herget, D. (2007). Highlights from PISA
2006: Performance of U.S. 15-year old students in science and mathematics
literacy in an International Context. Retrieved from
http://nces.ed.gov/pubsearch/pubsinfo.asp?pubid=2008016
Barnett, R. A., Ziegler, M. R., Byleen, K. E., & Sobecki, D. (2009). College algebra:
Graphs and models (3rd
ed.). Boston, MA: McGraw-Hill.
Beaton, A. E., Mullis, I. V. S., Martin, M. O., Gonzalez, E. J. Kelly, D. L., & Smith, T.
A. (1996). Mathematics achievement in the middle school years: IEA's Third
International Mathematics and Science Study (TIMSS). International Association
for the Evaluation of Educational Achievement. Center for the Study of Testing,
Evaluation, and Educational Policy. Chestnut Hill, MA: Boston College.
Bidwell, A. (2014). Common Core in flux as states debate standards, tests. U.S. News
and World Report. Retrieved February 27, 2015 from
http://www.usnews.com/news/articles/2014/07/15/common-core-status-in-flux-
as-states-debate-standards-tests
Page 137
127
Bisk, R. (2008). Singapore math: perspectives and experiences of a college professor. In
Z. Usiskin and E. Willmore (Eds.), Mathematics curriculum in Pacific rim
countries—China, Japan, Korea, and Singapore: Proceedings of a Conference.
(pp. 283-290). Charlotte, NC: Information Age Publishing.
Brenner, M. E., Brar, T., Durán, R., Mayer, R. E., Moseley, B., Smith, B. R., et al.
(1995, October). The role of multiple representations in learning algebra.
Presented at the Annual conference of the North American Chapter of the
International Study Group for the Psychology of Mathematics Education.
Columbus, OH.
Cai, J., Lo, J. J., & Watanabe, T. (2002). Intended treatments of arithmetic average in
U.S. and Asian school mathematics textbooks. School Science and Mathematics,
102(8), 391-404.
Center for the Study of Mathematics Curriculum. (2007, February). K-12 Mathematics:
What Should Students Learn and When Should They Learn It? Conference
Proceedings. Arlington, VA: Author.
Chen, C. & Uttal D.H. (1988). Cultural values, parents’ beliefs, and children’s
achievement in United States and China. Human Development, 31, 351-358.
Cherry, K. (2015). What is sociocultural theory?: Definition and information. Retrieved
on February 28, 2015 from
http://psychology.about.com/od/developmentecourse/f/sociocultural-theory.htm
Clinton, W. (1998). President Clinton’s call to action for American education in the 21st
Century. Washington, DC: Department of Education. (ERIC Document
Reproduction Service No. ED468585).
College Board. (2006). College Board standards for college success: Mathematics and
Statistics, adapted for integrated curricula. New York, NY: College Board.
Cunningham, R. F. (2005). Algebra teachers’ utilization of problems requiring transfer
between algebraic, numeric, and graphic representations. School Science and
Mathematics, 105(2), 73-81.
Department of Statistics Singapore. (2013). Table 3.4 Singapore Residents by Age
Group, Ethnic Group and Sex, End June 2013 (Cont.). Retrieved on February 28,
2015 from http://www.singstat.gov.sg/statistics/browse-by-theme/population-
and-population-structure
Page 138
128
Desimone, L. M., Smith, T., Baker, D., & Ueno, K. (2005). Assessing barriers to the
reform of U.S. mathematics instruction from an international perspective.
American Educational Research Journal, 42(3), 501-535.
Fan, L. (2011, October). Textbook research as scientific research: Towards a common
ground for research on mathematics textbooks. Paper presented at the 2011
International Conference on School Mathematics Textbooks. Shanghai, China.
Fan, L., & Kaeley, G. S. (1998, April). Textbooks use and teaching strategies: An
empirical study. Paper presented at the annual meeting of the American
Educational Research Association. San Diego, CA.
Fennell, F. S., Faulkner, L. R., Ma, L., Schmid, W., Stotsky, S., Wu, H., et al. (2008).
Report of the task group on conceptual knowledge and skills. Foundations for
Success: The Final Report of the National Mathematics Advisory Panel.
Washington, DC: U.S. Department of Education.
Ferrini-Mundy, J. (2004). Invited commentary: The TIMSS 2003 and PISA 2003 reports:
Sustaining focus and concern for about the state of mathematics education in the
United States. Educational Statistics Quarterly, 6(4), 26-28.
Fleischman, H. L., Hopstock, P.J., Pelczar, M. P., & Shelly, B. E. (2010). Highlights
from PISA 2009: Performance of U.S. 15-Year Old Students in Reading,
Mathematics, and Science Literacy in an International Context (NCES 2011-004).
U.S. Department of Education. National Center for Education Statistics.
Washington DC: U.S. Government Printing Office.
Fowler, L. D. (2008, April). Examination and Critique of Codebook for Textual Analysis.
Presented at The Seventh Annual College of Education Research Conference.
Miami, FL. Retrieved from
http://digitalcommons.fiu.edu/cgi/viewcontent.cgi?article=1117&context=sferc
Foy, P, Arora, A., & Stanco, G. M. (2013). TIMSS 2011 User guide for the international
data base: Mathematics eighth grade released items. International Association for
the Evaluation of Educational Achievement (IEA). Publisher: TIMSS & PIRLS
International Study Center, Lynch School of Education, Boston College, Chestnut
Hill, MA and International Association for the Evaluation of Educational
Achievement (IEA), IEA Secretariat, Amsterdam, the Netherlands. Retrieved
April 14, 2015 from http://timss.bc.edu/timss2011/international-released-items.
html
Freeman, D. J., & Porter, A. C. (1989). Do textbooks dictate the content of mathematics
instruction in elementary schools? American Educational Research Journal,
26(3), 403-421.
Page 139
129
Frequently Asked Questions: Implications and Future Work/Will common assessments
be developed? (2015) Retrieved January 21, 2015 from
http://www.corestandards.org/about-the-standards/frequently-asked-questions/
Common Core State Standards Initiative.
Garofalo, J., Drier, H., Harper, S., Timmerman, M.A., & Shockey, T. (2000). Promoting
appropriate uses of technology in mathematics teacher preparation. Contemporary
Issues in Technology and Teacher Education [Online serial], 1(1). Available:
http://www.citejournal.org/vol1/iss1/currentissues/mathematics/article1.pdf
Ginsburg, A., & Leinwand, S. (2008). Singapore math: Can it help close the U.S.
mathematics learning gap? In Z. Usiskin and E. Willmore (Eds.), Mathematics
curriculum in pacific rim countries—China, Japan, Korea, and Singapore. (pp.
265-282). Charlotte, NC: Information Age Publishing.
Ginsburg, A., Leinwand, S., Anstrom, T., & Pollock, E. (2005) What the United States
can learn from Singapore’s world-class mathematics system (and what Singapore
can learn from the United States): An exploratory study. American Institutes for
Research. Retrieved from
http://www.air.org/files/Singapore_Report_Bookmark_Version1.pdf
Gonzales, P., Calsyn, C. Jocelyn, L., Mak K., Kastberg, D., Arafeh, S., et al. (2000).
Highlights from the Third International Mathematics and Science Study-Repeat
(TIMSS-R) (NCES 2001-027). U.S. Department of Education, Office of
Educational Research and Improvement. Washington, DC: U.S. Government
Printing Office.
Gonzales, P., Guzman, J. C., Partelow, L., Pahike, E., Jocelyn, L., Kastberg, D., et al.
(2004). Highlights from the Trends in International Mathematics and Science
Study (TIMSS) 2003 (NCES 2005-005). U.S. Department of Education, National
Center for Education Statistics. Washington, DC: U.S. Government Printing
Office.
Graf, K., & Leung, F. K. S. (2000). The thirteenth ICMI study on mathematics
education in different cultural traditions. Educational Studies in Mathematics,
43(1), 95-116.
Hadley, W. S., Pflueger, J., & Covatto, M. (2006). Cognitive tutor algebra I student text.
Pittsburgh, PA: Carnegie Learning.
Haggarty, L., & Pepin, B. (2002). An investigation of mathematics textbooks and their
use in English, French and German classrooms: Who gets an opportunity to learn
what? British Educational Research Journal, 28(4), 567-590.
Page 140
130
Harries, T., & Sutherland, R. (2000). The representation of mathematical concepts in
primary mathematics textbooks: A focus on multiplication. In A. Rogerson (Ed.)
Mathematics for living: The mathematics education into the 21st century project,
(pp. 142-146). Amman, Jordan: Third World Forum.
Henning, C. A. (1996). Overcoming the limitations of mathematics textbooks in the
middle school classroom. (ED401102). Retrieved February 26, 2015 from
http://files.eric.ed.gov/fulltext/ED401102.pdf
Holliday, W. G. (2005). Slowing the influence of flawed mathematics and science
education studies. School Science and Mathematics, 105(1), 1-4.
Kaiser, G., Luna, E., & Huntley, I. (Eds.). (1999). International comparisons in
mathematics education. Philadelphia, PA: Falmer Press.
Kelly, D., Xie, H., Nord, C.W., Jenkins, F., Chan, J.Y., & Kastberg, D. (2013).
Performance of U.S. 15-year-old students in mathematics, science and reading
literacy in an international context (NCES 2014-024). National Center for
Education Statistics. U.S. Department of Education.
Kilpatrick, J, Swafford, J, & Findell, B. (2001). Adding it up: Helping children learn
mathematics. Washington, DC: National Academies Press.
Lantolf, J. P. (1994). Sociocultural theory and second language learning: Introduction to
the special issue. The Modern Language Journal, 78(4), 418-420.
Larson, R. E., Kanold, T. D., & Stiff, L. (1997). Algebra I: An integrated approach.
Lexington, MA: D.C. Heath.
Lee, J., Grigg, W., & Dion, G. (2007). The Nation’s Report Card: Mathematics 2007
(NCES 2007-494). National Center for Education Statistics, Institute of
Education Sciences. U.S. Department of Education. Washington, D.C.
Leung, F. K. S. (1995). The mathematics classroom in Beijing, Hong Kong, and London.
Educational Studies in Mathematics, 29, 297-325.
Leung, F. K. S. (2001). In search of an East Asian identity. Educational Studies in
Mathematics, 47(1), 35-51.
Li, Y. (2000). A comparison of problems that follow selected content presentations in
American and Chinese mathematics textbooks. Journal for Research in
Mathematics Education, 31(2), 234-241.
Lial, M. L., Hornsby, J. I., & McGinnis, Jr., T. (2012). Beginning and intermediate
algebra (5th ed.). Boston, MA: Pearson-Addison Wesley.
Page 141
131
Lombard, M, Snyder-Duch, J., & Bracken, C. C. (2005). Practical resources for assessing
And reporting intercoder reliability in content analysis research projects.
Retrieved March 2, 2015 from http://matthewlombard.com/reliability/index_print
.html
Mayer, R. E., Sims, V., & Tajika, H. (1995). A comparison of how textbooks teach
mathematical problem solving in Japan and the United States. American
Educational Research Journal, 32(2), 443-460.
Menon, R. (2000). Should the United States emulate Singapore’s education system to
achieve Singapore’s success in the TIMSS? Mathematics Teaching in the Middle
School, 5(6), 345-347.
Mesa, V. (2004). Characterizing practices associated with functions in middle school
textbooks: An empirical approach. Educational Studies in Mathematics, 56,
255-286.
Ministry of Education Singapore. (2006a). Mathematics Syllabus Primary. Retrieved
February 21, 2015 http://www.moe.gov.sg/education/syllabuses/sciences/files/
maths-primary-2007.pdf
Ministry of Education Singapore. (2006b). Secondary Mathematics Syllabuses.
Retrieved June 22, 2011 from
http://www.moe.gov.sg/education/syllabuses/sciences/files/maths-secondary.pdf
Ministry of Education Singapore. (2013). The Education Statistics Digest 2013.
Retrieved February 28, 2015 from http://www.moe.gov.sg/education/education-
statistics-digest/files/esd-2013.pdf
Ministry of Education Singapore (2012). O- & N(A)- Level Mathematics Teaching and
Learning Syllabus. Retrieved February 21, 2015 from http://www.moe.gov.sg/
education/syllabuses/sciences/files/ordinary-and-normal-academic-level-maths-
2013.pdf
Murdock, J., Kamischke, E., & Kamischke, E. (2002). Discovering algebra: An
investigative approach, Teacher’s Edition. Emeryville, CA: Key Curriculum
Press.
National Center for Education Statistics. (2009). The Nation’s Report Card: Mathematics
2009 (NCES 2010-451). Institute of Education Sciences. U.S. Department of
Education, Washington, DC.
National Center for Education Statistics. (2013). The Nation’s Report Card A First Look:
2013 Mathematics and Reading (NCES 2014-451). Institute of Education
Sciences. U.S. Department of Education, Washington, DC.
Page 142
132
National Council of Teachers of Mathematics. (2000). Principles and standards for
school mathematics. Reston, VA: NCTM.
National Council of Teachers of Mathematics. (2006). Curriculum focal points for
prekindergarten through grade 8 mathematics: A quest for coherence. Reston,
VA: NCTM.
National Governors Association Center for Best Practices, Council of chief State School
Officers. (2010). Common Core State Standards Mathematics. Washington D.C.:
Author. Copyright Date: 2010.
Neuendorf, K. A. (2002). The content analysis guidebook. Thousand Oaks, CA: Sage.
O’Callaghan, B. R. (1998). Computer-intensive algebra and students’ conceptual
knowledge of functions. Journal for Research in Mathematics Education, 29,
21-40.
OECD (2013). PISA 2012 Assessment and analytic framework: Mathematics reading,
science, problem solving and financial literacy, PISA, OECD Publishing, Paris.
http://dx.doi.org/10.1787/9789264190511-en
Österholm, M. (2005). Characterizing reading comprehension of mathematical texts.
Educational Studies in Mathematics, 63, 325-346.
Porter, A. C. (2002). Measuring the content of instruction: Uses in research and practice.
Educational Researcher, 31(7), 3-14.
Provasnik, S., Kastberg, D., Ferraro, D., Lemanski, N., Roey, S., & Jenkins, F. (2012).
Highlights from TIMSS 2011: Mathematics and Science Achievement of U.S.
Fourth- and Eighth-Grade Students in an International Context (NCES 2013-009
Revised). U.S. Department of Education. National Center for Education Statistics.
Washington DC.
Reys, B. J. (2014, February). Curriculum matters! For students, for teachers, for teacher
educators. Paper presented at the Annual Conference of the Association of
Mathematics Teacher Educators. Irvine, CA.
Reys, B. J., Reys, W. R., & Chávez, O. (2004). Why mathematics textbooks matter.
Educational Leadership, 61(5), 61-66.
Reys, B. J., Dingman, S, Nevel N., & Teuscher, D. (2007). High school Mathematics:
State-level curriculum standards and graduation requirements. Retrieved
December 18, 2014 from
http://www.mathcurriculumcenter.org/PDFS/HSreport.pdf . Center for the
Study of Mathematics Curriculum.
Page 143
133
Riley, R. W. (1997). Mathematics equals opportunity. White paper prepared for U.S.
Secretary of Education Richard W. Riley. Washington, DC: Department of
Education.
Scherba de Valenzuela, J. (2002). Sociocultural theory. Retrieved November 27, 2007
from http://www.unm.edu/%7Edevalenz/handouts/sociocult.html
Schmidt, W., Houang, R., & Cogan, L. (2002). A coherent curriculum: The case of
mathematics. American Educator, 26(2), 1-18.
Schmidt, W. H., McKnight, C. C., Houang, R. T., Wang, H., Wiley, D. E., Cogan, L. S.,
et al. (2001). Why schools matter: A cross-national comparison of curriculum and
learning. San Francisco, CA: Jossey Bass.
Schmidt, W. H., McKnight, C. C., & Raizen. (1997). A splintered vision: An
investigation of U.S. Science and mathematics curriculum, Executive Summary.
Retrieved on July 1, 2011, http://ustimss.msu.edu/splintrd.pdf
Schoen, R. C., & Clark, J. T. (2007). Florida’s answer to “a mile wide and an inch deep:”
Mathematics content standards that allow time for in-depth teaching and learning.
Dimensions in Mathematics, 27(2), 6-12.
Seeley, C. L. (2003). Mathematics textbook adoption in the United States. In M. A.
Stanic & J. Kilpatrick (Eds.), A history of school mathematics (pp. 957-988).
Reston, VA: National Council of Teachers of Mathematics.
SGBox.com. (2014). Which Singapore math textbooks are Singapore schools using?
Retrieved from http://www.sgbox.com/singaporetextbooks.html on December 16,
2014.
Soh, C. K. (2008). An overview of mathematics education in Singapore. In Z. Usiskin
and E. Willmore (Eds.), Mathematics curriculum in pacific rim countries—China
Japan, Korea, and Singapore: Proceedings of a Conference. (pp. 23-36).
Charlotte, NC: Information Age Publishing
Spielhagen, F. R. (2006). Closing the achievement gap in math: The long-term effects of
eighth-grade algebra. Journal of Advanced Academics, 18(1), 34-59.
Standards in Your State. (2015). Retrieved February 26, 2015 from
http://www.corestandards.org/about-the-standards/frequently-asked-questions/
Common Core State Standards Initiative.
Stanic, G. M. A., & Kilpatrick J. (Eds.). (2003). A history of school mathematics (pp.
819-842). Reston, VA: National Council of Teachers of Mathematics.
Page 144
134
Steele, D. (2005). Using writing to access students’ schemata knowledge for algebraic
thinking. School Science and Mathematics, 105(3), 142-154.
Steen, L. A. (1990). On the shoulders of giants: New approaches to numeracy.
Washington, DC: National Academies Press.
Teuscher D. & Reys, R. E. (2010). Slope, rate of change, and steepness: Do students
understand these concepts?. Mathematics Teacher, 103(7), 519-524.
Tieso, C. (2005). The effects of grouping practices and curricular adjustments on
achievement. Journal for the Education of the Gifted, 29(1), 60-89.
U.S. Department of Education. (2001). No Child Left Behind Act of 2001.
Retrieved July 1, 2011 from
http://www.ed.gov/policy/elsec/leg/esea02/index.html
U.S. Department of Education. (2009). Highlights from TIMSS 2007. Retrieved on July
1, 2011 from http://nces.ed.gov/pubs2009/2009001_1.pdf
U.S. Department of Education. (2010a). ESEA Blueprint for Reform. Office of Planning,
Evaluation, and Policy Development, Washington, D.C. Retrieved on June 30,
2011 from http://www2.ed.gov/policy/elsec/leg/blueprint/blueprint.pdf
U.S. Department of Education. (2010b). National Assessment of Educational
Progress. National Center for Education Statistics. Retrieved on June 14, 2010
from http://nces.ed.gov/nationsreportcard/
Usiskin, Z. (2008). Introductions. In Z. Usiskin and E. Willmore (Eds.), Mathematics
curriculum in Pacific rim countries—China, Japan, Korea, and Singapore:
Proceedings of a Conference. (pp. 1-5). Charlotte, NC: Information Age
Publishing.
Usiskin, Z. (2014, April). What changes should be made next for the next edition of
Common Core State Standards of Mathematics?. Paper presented at the
NCTM Annual Meeting. New Orleans, LA.
Uttal, D. H. (1996). Beliefs, motivation, and achievement in mathematics: A cross-
national perspective. In M. Carr (Ed.), Motivation in mathematics (pp. 25-37).
Cresskill, NJ: Hampton Press.
Weller, D. (2004). The effects of contrast and density on visual websearch. Posted on
July 12, 2004 on Software Usability Research Laboratory. Retrieved December
16, 2014 from http://psychology.wichita.edu/surl/usabilitynews/62/density.htm
Page 145
135
Woodward, J., & Ono, Y. (2004). Mathematics and academic diversity in Japan. Journal
of Learning Disabilities, 37, 74-82.
Wu, H. (2001). How to prepare students for algebra. American Educator, 25(2), 10-17.
Wynd, C. A., Schmidt, B., & Schaefer, M. A. (2003). Two quantitative approaches for
estimating content validity. Western Journal for Nursing Research, 25(5), 508-
518.
Zhu, Y., & Fan, L. (2002). Textbook use by Singaporean mathematics teachers at lower
secondary school level. Proceedings of ICME-EARCOME 2 (Vol. 2), 94-201.
Zhu, Y., & Fan, L. (2004, July). An analysis of the representation of problem types
in Chinese and U.S. mathematics textbooks. Paper accepted for ICME-10,
Discussion group 14, (pp. 4-11). Copenhagen, Denmark.
Page 146
136
Appendix A
Education Websites
General Education Websites (Most go directly to Curriculum and Instruction)
California: DOE Curriculum Frameworks and Instructional Materials:
http://www.cde.ca.gov/ci/cr/cf/index.asp
Florida: DOE Curriculum: http://www.fldoe.org/bii/Instruct_Mat/
Texas: http://www.tea.state.tx.us/index2.aspx?id=3373
Singapore: http://www.moe.gov.sg/
Websites of Adopted Texts/ Adoption Schedules
California: Mathematics Publishers List: http://www.cde.ca.gov/ci/cr/cf/mathpub.asp
Current Adoptions: http://www.cde.ca.gov/ci/ma/im/mathprogramnov2007.asp
Florida: Current Adoptions: http://www.fldoe.org/bii/Instruct_Mat/pdf/Adopted0910.pdf
Adoption Schedule: http://www.fldoe.org/bii/curriculum/sss/#math
Texas Adoptions: http://www.tea.state.tx.us/textbooks/materials/bulletin/programs.pdf
https://faulk.tea.state.tx.us/ematevi/EMATREPORTS/RptInst/EM_CURR_ADPN.pdf
Adoption Schedule:
http://ritter.tea.state.tx.us/textbooks/adoptprocess/adoptioncycle.pdf
Singapore: Adoptions http://atl.moe.gov.sg/Current.aspx
Websites for Standards/Skills/Syllabi
California: Mathematics Framework for California Public Schools Kindergarten through
Grade Twelve (2006): http://www.cde.ca.gov/ci/cr/cf/documents/mathfrwk.pdf
Florida: Standards Search website:
http://www.floridastandards.org/Standards/FLStandardSearch.aspx
Page 147
137
Standards by Grade: http://www.corestandards.org/the-standards/mathematics
Printable standards: http://www.floridastandards.org/Downloads.aspx
Texas: Standards by grade: http://ritter.tea.state.tx.us/rules/tac/chapter111/ch111b.pdf
General standards: http://www.tea.state.tx.us/index2.aspx?id=2147499971
Singapore: Syllabi:
http://www.moe.gov.sg/education/syllabuses/sciences/files/maths-secondary.pdf
Page 148
138
Appendix B
International Textbook Comparisons
Characteristic Country/Grade Level Researcher(s)/Year
Integer addition/ China, U.S./7th
grade Li/2000
subtraction
Problems UCSMP China, U.S./7th
-8th Zhu & Fan/2004
Images/specific Five countries/Singapore Harries &
references and U.S./primary Sutherland/2000
Lessons Japan, U.S./7th
Mayer, Sims, &
Tajika/1995
Arithmetic average Korea, Taiwan, Japan Cai, Lo, &
and U.S./ 5th
-6th
Watanabe/2002
Instructional criteria U.S./middle AAAS/1999
General features 37 countries in TIMSS Schmidt et al./2001
Singapore & U.S./ 8th
Layout/lessons/ Singapore & U.S./ Ginsburg et al./2005
Problems elementary
How text is used France, Germany, & Haggarty &
England/7th
-9th Pepin/2002
Effect on teacher U.S./lower secondary Fan & Kaeley/1998
practices
Page 149
139
Characteristic Country/Grade Level Researcher(s)/Year
Characteristics of Beijing, Hong Kong, Leung/1995
Chinese culture London/ middle
Reading comprehension Sweden University Österholm/2005
Schemata knowledge U.S./7th
grade Steele/2005
Textbook/achievement U.S./5th
grade Tieso/2005
Characterizing TIMSS countries Mesa/2004
problem-types
Problem-solving U.S./College O’Callaghan/1998
competency
Transfer of representation U.S./8th
-10th
Cunningham/2005
Page 150
140
Appendix C
Coding Scheme
Part I
Background features
1. Number of pages in text
2. Number of chapters
3. Number of sections
4. Number of sections pertaining to linear functions
5. Number of pages pertaining to linear functions
6. Number of pages for development
7. Number of pages for exercises
8. Number of other pages
9. Number of problems pertaining to linear functions
10. Average number of pages per section pertaining to linear functions
11. Number of object-analytic images
12. Number of object-illustrative images
13. Number of signposts or attention-getters
Part II
General classification of problem
1. Computational feature
(S) single computation procedure (M) multiple computation procedures
(ot) other
2. Contextual feature
(nu) numerical (vi) visual (ve) verbal (co) combined form (ot) other
3. Response-type feature
(A) numeric answer only (E) algebraic expression or equation only
(ES) explanation or solution required (G) Graph only
Page 151
141
(M) Multiple response types (OP) other response
4. Cognitive requirement feature
(PP) procedural practice (CU) conceptual understanding
(PS) problem solving (SR) special requirement (ot) other
5. Given-information feature
(SF) sufficient (EX) extraneous (ISF) insufficient
6. Application type
(AP) applied (NA) nonapplied
Part III
Classification of problem practices
1. Characterization of problem practices
(sr) symbolic rule (op) ordered pair (sd) social data
(ph) physical phenomena (ci) controlling image (ot) other
2. Problem-solving competency type
(mod) modeling (int) interpreting (tran) translating
(reif) reifying (dna) does not apply
3. Transfer type
(A→N) algebraic to numeric (A→G) algebraic to graphical
(A→V) algebraic to verbal (N→A) numeric to algebraic
(N→G) numeric to graphical (N→N) numeric to numeric
(N→V) numeric to verbal (G→A) graphical to algebraic
(G→N) graphical to numeric (G→V) graphical to verbal
(V→A) verbal to algebraic (V→N) verbal to numeric
(V→G) verbal to graphical (m) multiple transfer types
(dna) does not apply
Page 152
142
Appendix D
Codebook
Textbook Content Analysis
Textbook ID: Fill in the textbook ID number, as indicated on the textbook list.
Coder ID: Indicate the number of the individual who coded that sheet, according to the
coder ID List.
Part I: Background features of the textbook
Unit of data collection: The textbook pages will give us the data for Part I.
Number of pages in text: Report the number of pages in the textbook. Start with the
beginning of Chapter 1. Include any “answer to exercises” sections but do not include
indices or other appendices. Do not include formula pages in back or front of book. Do
not count include Spanish/English or similar glossaries.
Number of chapters: Report the number of chapters in the textbook. This includes any
pseudo- chapters which look like a chapter but are not labeled chapters.
Number of sections: Report the total number of sections in the textbook. Chapters are
made up of sections, that is, 1.2 = Chapter 1 section 2. A pseudo-chapter may have
sections with titles but no numbers; include these pseudo-sections in your count.
Include extra teaching lessons within the chapter as a new section. Chapter reviews,
Review Exercises, Chapter Tests, Summary Exercises, and the like are not included as
sections. Optional sections are not counted.
Number of sections pertaining to linear functions: Report the total number of sections
pertaining to linear functions/equations. A linear function is an equation of the form
( )f x mx b where m and b are real numbers. An alternative form is the linear
equation Ax By C where , ,A B and C are real numbers such that not both A and
B are zero. While 8 7 5x is not considered a linear function, knowing how to solve
such equations are an integral part of working with linear functions and will also be
examined. The pages to include would contain solving linear equations, graphing linear
equations, finding linear equations, fitting a line to data, and definition of and concepts
related to linear functions/equations.
Number of pages pertaining to linear functions: Report the number of pages in the text
pertaining to linear functions/equations. Count the number of pages in each section
pertaining to linear functions/equations.
Number of pages for development: Report the fractional number of pages for concept
Page 153
143
development contained within the sections pertaining to linear functions. This does not
include exercises at the end of the chapter. If multiple categories, such as development,
exercises or other, occur on one page, then round to the most appropriate quarter page.
Number of pages for exercises: Record the fractional number of pages for exercises
contained within the sections pertaining to linear functions. Exercises are the problems
after the concept development pages. The students work on these problems to further
their understanding of the concept. Include pages that contain problems that follow an
extra teaching lesson. If multiple categories occur on one page, such as development,
exercises, or other, then round to the most appropriate quarter page.
Number of other pages: Record the fractional number of pages that do not contain
concept development or exercises within the sections pertaining to linear functions.
These pages may contain illustrations, may be blank, give historical information, etc. If
multiple categories occur, then round to the most appropriate quarter page.
Number of problems pertaining to linear functions: Record the number of problems
within the sections pertaining to the topic of linear functions. These are problems that
do not have an answer or solution within the section. Do not include the examples or
practice problems in the development pages. Count a problem with multiple questions
separated by a, b, c or i, ii, iii, etc. as separate problems. Problems at the end of the
chapter referred to as review exercises, mixed review, review, chapter review, self-test,
chapter test, and similarly titles problems will not be examined. Group activity
problems and summary exercises will not be examined.
Average number of pages per section pertaining to linear functions: Report the
average number of pages per section pertaining to linear functions. Calculate by
dividing the total number of pages pertaining to linear functions by the total number of
sections pertaining to linear functions.
Number of object-analytic images: Count the number of images that represents the
mathematical structure in the problems within the sections pertaining to linear
functions/equations. An image is any drawing, picture, cartoon, or photo seen in the
text. Graphs, tables, and screen-shots of calculator output are not included as an image.
Illustrations used to set up a problem, such as geometrical figures which are used to
show the reader which angle they were asked to find, and graphs will not be counted.
Number of object-illustrative images: Count the number of images that represents
objects with no relationship to the mathematical structure in the problems within the
sections pertaining to linear functions. An image is any drawing, picture, cartoon, or
photo seen in the text. Graphs, tables, and screen-shots of calculator output are not
included as an image. Illustrations used to set up a problem, such as geometrical figures
which are used to show the reader which angle they were asked to find, and graphs
will not be counted.
Page 154
144
Number of signposts or attention-getters: Within the sections pertaining to linear
functions, report the number of signposts or attention-getters in the textbook. Signposts
or attention-getters are instances where the text directs the student to look at or to learn
a particular formula or definition, warns of common errors, or directs the student to
consciously focus on his/her thinking. Examples include Caution Boxes and hints to
relate material to previously-learned material. A definition listed is not an example
unless the text directly relates it to previously learned material.
Part II: General classification of problems.
Unit of data collection: The problems pertaining to linear functions after the concept
developmental pages within the student textbooks will be the source of data collected in
Part II. The problems will be those with no solution or answer given within the section.
Computational feature: Report the number (one, more than one, or none) of
mathematical operations required to arrive at an answer.
1. Single computation procedure, S: The problem requires a single computation to
arrive at an answer. If a problem directs the student to do a simple computation
multiple times, for example, Calculate 2x + 3 when x = 2, x = -2, this is classified as
a single computation procedure.
2. Multiple computation procedures, M: The problem requires multiple computations
to arrive at an answer.
3. Other, ot: The problem requires something other than computations.
Contextual feature: Report the main contextual form in which the problem is presented.
Many problems have verbal directions before the main contextual form of the problem.
When the verbal directions are minimal, the problem may be classified as numerical or
visual form.
1. Numerical, nu: The problem is represented in a purely numerical form. A table
would be classified under this category.
2. Visual, vi: The problem is only represented in a picture, graph, or diagram form.
3. Verbal, ve: The problem is only represented in word or story form.
4. Combined form, co: The problem is represented by more than one form.
5. Other, ot: The problem is represented by a form not already listed.
Response-type feature: Report the type of answer that the question requires.
1. Numeric answer only, A: The answer only requires a number or an ordered pair.
2. Algebraic expression or equation only, E: The answer only requires an algebraic
expression, that is, a letter or any combination of numbers, letters, operation symbols
( , , , ) and grouping symbols or an algebraic equation, that is, a statement that
two algebraic expressions are equal. The single number answer will not be in this
category.
3. Explanation or solution required, ES: The answer requires an explanation or the
presentation of how a solution is found.
4. Graph only, G: The answer only requires a graph.
Page 155
145
5. Multiple response types, MR: The problem requires more than one type of answer.
6. Other response, OP: The problem requires a response other than the above
categories. This may refer to matching, true/false, multiple choice, or
comparison/selection problems where no explanation is asked for.
Cognitive requirement feature: Report the type of cognitive level required to do the
problem.
1. Procedural practice, PP: The problem requires only processes that use rules and
algorithms with little connection to relationships among features in the problem.
2. Conceptual understanding, CU: The problem requires the ability to make
relationships among features in the problem in order to solve the problem. These
problems do not require but may have multi-step procedures to solve them. Focus is
on concepts.
3. Problem solving, PS: Problems in which the situation in the problem must be put in
mathematical form before it can be solved. These problems are multi-step. Focus is
on solving a problem.
4. Special requirement, SR: The problem may require a higher level of thought such as
proving a conjecture.
5. Other, ot: The problem requires some other cognitive requirement.
Given-information feature: Report the amount of information given in the problem
statement.
1. Sufficient, SF: The problem has exactly the amount of information to do the problem.
2. Extraneous, EX: The problem contains extra information that is not pertinent to the
problem.
3. Insufficient, ISF: The problem does not contain enough information to do the
problem.
Application type feature: Report the applicability of the problem to real world or
everyday problems.
1. Applied, AP: The problem is based on or has applications to a real life situation.
2. Nonapplied, NA: The problem does not have any practical connection to every day
life.
Part III Classification of problem practices
Unit of data collection: The problems pertaining to linear functions after the concept
development pages within the student textbooks will be the source of data. The
problems will be those with no solution or answer given within each section.
Characterization of problem practices: Report on the type of practice seen in the
problems pertaining to linear functions in the textbook.
1. Symbolic rule, sr: The problem emphasizes the use of the function as a rule, that is,
an equation. Problem will often start with an equation.
2. Ordered pair, op: The problem emphasizes the use of the function as an ordered pair.
Page 156
146
The ordered pair relationship can be seen through several different representations
such as an arrow diagram, Cartesian plane, an equation, and others.
3. Social data, sd: The problem emphasizes the use of the function as a relation. The
relation is constructed from given information. The problem rarely starts with an
equation. Example: Make a table for the following relation: A shirt costs $17 at
Costco. Show the relationship of the amount paid to the number of shirts bought.
Problem may require using relationship to find values once relationship is found.
4. Physical phenomena, ph: The problem emphasizes the use of the function as a
physical relationship, such as cause-effect or time relationships. No symbolic
representation is used. Data is usually gathered by the student or is given as data that
has been collected. The problem does not ask you to create an equation.
5. Controlling image, ci: The problem emphasizes the use of the function as figural,
that is, is defined by graph, pattern, or geometrical figures.
6. Other, ot: The practice is one not previously defined or cannot be determined.
Problem-solving competency type: Report the competency needed to solve the problem.
1. Modeling, mod: The problem requires the student to take a problem situation in
words and translate it into a mathematical representation. The most used
mathematical representations are algebraic (symbols), numeric (numbers), and
graphical (graphs).
2. Interpreting, int: The problem requires the student to translate the mathematical
representation (algebraic, numeric, or graphical) of a function into real-life terms.
3. Translating, tran: The problem requires the student to change form one mathematical
representation (algebraic, numeric, or graphical) to another mathematical
representation.
4. Reifying, reif: The problem requires the student to recognize that a linear function is
a mathematical object and not just a process or procedure. Examples would include
composition, algebra, and transformations of functions. May include a transfer of
representation type.
5. Does not apply, DNA: None of these competencies apply.
Transfer type: Report the type of transfer present as the student moves from the
mathematical representation of the question to a different mathematical representation
for the answer. Algebraic refers to equation or algebraic expression form. Numeric
refers to table or number form, including ordered pair form. Graphical refers to graph,
diagram, or picture form.
Verbal form refers to written or verbal word or sentence form.
1. A→N, Algebraic to numeric: The student is required to move from an algebraic
representation to a numeric representation
2. A→G, Algebraic to graphical: The student is required to move from an algebraic
representation to a graphical representation.
3. A→V, Algebraic to verbal: The student is required to move from an algebraic
representation to a verbal representation.
4. N→A, Numeric to algebraic: The student is required to move from a numeric
representation to an algebraic representation.
Page 157
147
5. N→G, Numeric to graphical: The student is required to move from a numeric
representation to a graphical representation.
6. N→N, Numeric to numeric: The student is required to move from a numeric
representation to a numeric representation.
7. N→V, Numeric to verbal: The student is required to move from numeric
representation to a verbal representation.
8. G→A, Graphical to algebraic: The student is required to move from a graphical
representation to an algebraic representation.
9. G→N, Graphical to numeric: The student is required to move from a graphical
representation to a numeric representation.
10. G→V, Graphical to verbal: The student is required to move from a graphical
representation to a verbal representation.
11. V→A, Verbal to algebraic: The student is required to move from a verbal
representation to an algebraic representation.
12. V→N, verbal to numeric: The student is required to move from a verbal
representation to a numeric representation.
13. V→G, verbal to graphical: The student is required to move from a verbal
representation to a graphical representation.
14. Multiple transfer types, m: The student is required to answer multiple questions
within one problem using different transfer types. Example: V→A and V→N may be
used to answer multiple questions in one problem. Note: This does not allow more
than one transfer to occur to achieve the final mathematical representation.
15. Does not apply, DNA: None of these transfers apply.
Page 158
148
Appendix E
Textbooks Used in Comparison
Singapore
Title Author(s) / Publisher
Discovering Mathematics 1A Victor Chow Wai Keung, 2010 / Starpub
Discovering Mathematics 1B Victor Chow Wai Keung, 2010 / Starpub
Mathematics Matters Secondary 1 Sin Kwai Meng Ng Song Beng
Chip Wai Lung, 2008 / Marshall Cavendish
New Syllabus Mathematics 1 6th Ed Yeap Ban Har Teh Keng Seng Loh
Cheng Yee, 2011 / Shing Lee
Discovering Mathematics 2A Victor Chow Wai Keung, 2010 / Starpub
Discovering Mathematics 2B Victor Chow Wai Keung, 2010 / Starpub
Mathematics Matters Secondary 2 Sin Kwai Meng Ng Song Beng
Chip Wai Lung, 2008 / Marshall Cavendish
New Syllabus Mathematics 2 6th Ed Yeap Ban Har Teh Keng
Seng Loh Cheng Yee, 2011 / Shing Lee
United States
Title Author(s) / Publisher
Glencoe Florida Math Connects 1 Molix-Bailey, Dr. Day, Frey, Howard, 2011 /
School Ed. Group/McGraw-Hill
Glencoe Florida Math Connects 2 Molix-Bailey, Dr. Day, Frey, Howard, 2011
School Ed. Group/McGraw-Hill
Glencoe Florida Math Connects 3 Molix-Bailey, Dr. Day, Frey, Howard, 2011 /
Page 159
149
School Ed. Group/McGraw-Hill
McDougal Little Math, Course 1 Larson, 2007 / Holt McDougal
McDougal Little Math, Course 2 Larson, 2007 / Holt McDougal
Algebra I Concepts and Skills Larson, 2010 / Holt McDougal
Florida Math Series: Course 1 Lappan et al., 2011 / Pearson Prentice Hall
Florida Math Series: Course 2 Lappan et al., 2011 / Pearson Prentice Hall
Florida Math Series: Course 3 Lappan et al., 2011 / Pearson Prentice Hall
Page 160
150
Appendix F
Highlights of Pre-Pilot Study
The pre-pilot study (Fowler, 2008) began with a brief training session and slight
revision of the codebook. Two coders, then, independently coded two randomly selected
sections of text pertaining to linear functions in a mathematics textbook from the U.S.
with respect to 23 features. An Excel program was used to facilitate the recording of the
coding selections while a coding form was used to record the numbers within the general-
feature categories. Due to the ease of using the Excel program, the coding form will be
added to the Excel worksheet. A sample of this rubric listing all problems as columns and
the feature categories as rows is found in Appendix G. The total number of problems
examined was 54 (Fowler, 2008).
For the features which required a choice of code, inter-rater reliability values were
assessed using Cohen’s kappa and percent agreement. The general features of the text did
not require a choice of code categories but only required a count for each feature. The
general features results consisted of a comparison of the two coders’ assessments of the
features as listed on their coding forms. These values are listed in Table 1. None of the
coders’ assessments were a perfect match. The coders were most in agreement about the
average number of pages per section pertaining to linear functions with values of 5.43
and 5.22.
Cohen’s kappa and percent agreement were the inter-rater reliability coefficients
calculated for the six problem characteristics and the problem practices pertaining to
linear functions. As seen in Table 2, the inter-rater reliability coefficients varied widely
Page 161
151
with respect to problem characteristics and problem practices. These values allowed the
Table 1
Comparison of Data for General Characteristics of the Text
Feature Coder 1 Coder 2
Pages in Text 794 807
Number of Chapters 12 13
Number of Sections 109 120
Linear Function Pages 38 47
Pages for Development 26 21
Pages for Exercises 32.5 26
Average Pages/Linear Function 5.43 5.22
Object-Illustrative Images 14 7
Object-Analytic Images 24 31
Signposts/Attention-Getters 24 16
researcher to determine the usefulness of the definitions and categories within the coding
scheme.
The researcher was able to use the results of the pre-pilot study to determine
changes that needed to be made in the coding scheme. First, the fact that every general
feature of the text was classified differently by the coders was an indicator that the
definitions of these characteristics should be changed. The pre-pilot study results
indicated a need for clarification of the difference between conceptual understanding and
Page 162
152
problem solving and of the effect the directions have on the coding of the contextual
feature. The researcher addressed these issues by stating the main focus of each code and
Table 2
Inter-Rater Reliability Coefficients for Categories Coded in Text
Feature Cohen’s kappa Percent Agreement
Problems (n = 54)
Computational .12 .69
Contextual .46 .87
Response-Type .52 .69
Cognitive Requirement .22 .67
Given Information ---a 1
Application Type 1 1
Problem Practices -0.04 .26
aCohen’s kappa does not yield a value due to only one characterization (i.e., code), being chosen
for all problems. All problems were coded with the same code, so the coders agreed on the
characterization of every problem in this category.
stating that the directions are included as part of the problem. Some discrepancies that
were observed and the plans to resolve the issues are as follows:
1. Does one count the introductory pages before the chapters begin? Yes.
2. Can one have half pages or one-quarter pages in the count? Yes. Pages will be
counted to the nearest quarter page.
3. Do extra teaching lessons within a section count as a new section? No.
4. Are all problems; oral, written, mixed review, computer, and self-test; counted
Page 163
153
as problems? No. Mixed review and review problems will not be examined.
5. Do graphs count as images to be classified? No, these problems are already
mathematical in nature and do not need to be classified as object analytic or
object illustrative.
6. What are more explicit examples of signposts? These would include caution
boxes and hints to relate information to previously-learned material.
7. Does the number of pages for every lesson, even ones without linear functions,
need to be determined? No, the percentage of the textbook that pertains to
linear functions should be sufficient.
8. To what extent are linear equations part of the linear functions topic? Linear
equations will be included as part of linear functions as long as the relationship
between x and y clearly exists. See Appendix D for more details.
The researcher also decided to leave some sections, such as the number of pages for each
section, out of the future comparison study and to alter other categories. The number of
features examined in the texts changed from 23 to 22 features. The pre-pilot study also
highlighted how important coder-training is to the process of achieving inter-rater
reliability.
Page 164
154
Appendix G
Sample of Excel Program Used in Coding
Page 165
155
Appendix H
Sample pages from U.S. and Singapore textbooks, respectively
United States: McDougal Little Math, Course 1
Page 166
156
Singapore: Discovering Mathematics 1A
Page 167
157
VITA
LINDA DONNELL (DONNA) FOWLER
1986-1989 B.A. Mathematics, Magna Cum Laude
Carson Newman College
Jefferson City, TN
1989 Substitute Teacher
Hamblen County, TN
1989-1992 M.S. Mathematics
Middle Tennessee State University
Murfreesboro, TN 37132
1989-1993 Teaching Assistant/Adjunct
Middle Tennessee State University
Murfreesboro, TN
1994-Present Assistant Professor of Mathematics
Palm Beach Atlantic University
West Palm Beach, FL
1998-2009 Work-Study Supervisor for Mathematics Department
Palm Beach Atlantic University
West Palm Beach, FL
Oct. 19-30, 1998 Employee of the Week.
2001-07, ’08-‘09 Mathematics Society Faculty Sponsor
2011-present
2011 Ed.S. Curriculum and Instruction
Florida International University
Miami, FL
PUBLICATIONS AND PRESENTATIONS
Fowler, L. D. (2008, April). Examination and Critique of Codebook for Textual Analysis.
Presented at The Seventh Annual College of Education Research Conference.
Miami, FL.
http://digitalcommons.fiu.edu/cgi/viewcontent.cgi?article=1117&context=sferc