J Appl Oral Sci. 167 ABSTRACT www.scielo.br/jaos http://dx.doi.org/10.1590/1678-7757201302326 Comparison of manual, digital and lateral CBCT cephalometric analyses 1 2 , Thais Maria Freire FERNANDES 2 , 3 , Ana Cláudia de Castro Ferreira CONTI 2 , Marcio Rodrigues de ALMEIDA 2 , Renato Rodrigues de ALMEIDA 2 1- DDS, MSc, PhD, Oral and Maxillofacial Surgery Division, Saint Francis Hospital, Cambé, PR, Brazil; Area of Oral and Maxillofacial Surgery, Department of Oral and Maxillofacial Surgery, Post Graduate Program State University of Maringá, PR, Brazil. 2- DDS, MSc, PhD, Assistant Professor, Department of Orthodontics, University of North Paraná (UNOPAR), Londrina, PR, Brazil. 3- DDS, MSc, Department of Orthodontics, University of North Paraná (UNOPAR), Londrina, PR, Brazil. Corresponding address: Paula Vanessa Pedron Oltramari-Navarro - Rua Paranaguá, 803 - Apto 92 - Centro - 86020-030 - Londrina - PR - Phone: (43) 3371-7991 - e-mail: [email protected]O bjective: The aim of this study was to compare the reliability of three different methods of cephalometric analysis. Material and Methods: Conventional pretreatment lateral cephalograms and cone beam computed tomography (CBCT) scans from 50 subjects from a radiological clinic were selected in order to test the three methods: manual tracings (MT), digitized lateral cephalograms (DLC), and lateral cephalograms from CBCT (LC-CBCT). The lateral cephalograms were manually analyzed through the Dolphin Imaging 11.0™ software. Twenty measurements were performed under the same conditions, and retraced after a 30-day period. Paired t tests and the Dahlberg formula were used to evaluate the intra- (ANOVA) tests were used to compare the differences between the methods. Results: Intra-examiner reliability occurred for all methods for most of the measurements. Only six measurements were different between the methods and an agreement was observed in the analyses among the 3 methods. Conclusions: The results demonstrated that all evaluated the lateral cephalograms from the CBCT proved the most reliable. Key words: Cephalometry. Reliability. Cone-beam computed tomography. INTRODUCTION Cephalometry has been widely used for the diagnosis, planning, and evaluation of craniofacial growth and development, and the follow up of longitudinal studies for different orthodontic therapies 9,15,24 . Conventional cephalometric records, as part of the orthodontic documentation, include lateral cephalograms. With the introduction of new technologies, such as digital radiographies, and cone beam computed tomography (CBCT) scans, it has become necessary to validate the images generated from these exams to afford comparisons. Because these imaging methods conventional and digital cephalograms, and images similar to cephalograms obtained from CBCT scans have not been compared, new images may not be used to evaluate the growth and longitudinal results of orthodontic therapies in relation to conventional cephalograms. The gold standard method for cephalometric imaging methods have been questioned due to a higher probability of errors while identifying landmarks, or making hand-traced measurements 27 , and for the large amount of time consumed for the evaluations 20 . Moreover, a bidimensional diagnosis shows important limitations, such as a structure superposition 12 . A number of studies 4,17,20 have out evaluations of digitized cephalograms with those of manual tracing methods, and asserted that the digital method can make linear and angular however, are not unanimous in the literature 18,28 . 2013;21(2):167-76
Comparison of manual, digital and lateral CBCT cephalometric analyses
������������ ������1��������������������������� ������2, Thais Maria Freire FERNANDES2, ����������������������3, Ana Cláudia de Castro Ferreira CONTI2, Marcio Rodrigues de ALMEIDA2, Renato Rodrigues de ALMEIDA2
1- DDS, MSc, PhD, Oral and Maxillofacial Surgery Division, Saint Francis Hospital, Cambé, PR, Brazil; Area of Oral and Maxillofacial Surgery, Department of Oral and Maxillofacial Surgery, Post Graduate Program State University of Maringá, PR, Brazil.2- DDS, MSc, PhD, Assistant Professor, Department of Orthodontics, University of North Paraná (UNOPAR), Londrina, PR, Brazil.3- DDS, MSc, Department of Orthodontics, University of North Paraná (UNOPAR), Londrina, PR, Brazil.
Objective: The aim of this study was to compare the reliability of three different methods of cephalometric analysis. Material and Methods: Conventional pretreatment lateral
cephalograms and cone beam computed tomography (CBCT) scans from 50 subjects from a radiological clinic were selected in order to test the three methods: manual tracings (MT), digitized lateral cephalograms (DLC), and lateral cephalograms from CBCT (LC-CBCT). The lateral cephalograms were manually analyzed through the Dolphin Imaging 11.0™ software. Twenty measurements were performed under the same conditions, and retraced after a 30-day period. Paired t tests and the Dahlberg formula were used to evaluate the intra-�������������� ������������������������������������������������������(ANOVA) tests were used to compare the differences between the methods. Results: Intra-examiner reliability occurred for all methods for most of the measurements. Only six measurements were different between the methods and an agreement was observed in the analyses among the 3 methods. Conclusions: The results demonstrated that all evaluated ����������������������������������������������������������������������the lateral cephalograms from the CBCT proved the most reliable.
Cephalometry has been widely used for the diagnosis, planning, and evaluation of craniofacial growth and development, and the follow up of longitudinal studies for different orthodontic therapies9,15,24. Conventional cephalometric records, as part of the orthodontic documentation, include lateral cephalograms. With the introduction of new technologies, such as digital radiographies, and cone beam computed tomography (CBCT) scans, it has become necessary to validate the images generated from these exams to afford comparisons. Because these imaging methods conventional and digital cephalograms, and images similar to cephalograms obtained from CBCT scans have not been compared, new images may not be used to
evaluate the growth and longitudinal results of orthodontic therapies in relation to conventional cephalograms.
The gold standard method for cephalometric ��������� ��� �� ���� ������ ���� ���������imaging methods have been questioned due to a higher probability of errors while identifying landmarks, or making hand-traced measurements27, and for the large amount of time consumed for the evaluations20. Moreover, a bidimensional diagnosis shows important limitations, such as a structure superposition12. A number of studies4,17,20 have ��������������������������������������out evaluations of digitized cephalograms with those of manual tracing methods, and asserted that the digital method can make linear and angular �������������������������������!�����������however, are not unanimous in the literature18,28.
2013;21(2):167-76
J Appl Oral Sci. 168
In addition, since cephalometric analyses are subject to human judgment6, and because of errors of different magnitudes such as landmark ����������������������������������"������of radiographic exams20,23, methods are sought that will minimize such errors. New technologies are emerging, aiming at improving the quality of such evaluations.
Despite the countless advantages of the current programs, no consensus exists regarding the best way to accomplish the migration from manual tracing to digital tracing. Since the change to digital methods is eminent26, professionals must be prepared, so that the transition is accomplished in the safest way possible. Before adopting new methods in scientific research, however, their ��������� ���� �� ������ �� �������� �traditional exams with those using digital images, and with those obtained from CBCT scans is fundamental, with a view to making this transition from bidimensional to tridimensional methods.
Thus, the aim of this study was to evaluate whether a difference exists between cephalometric measurements based on manual tracings (MT), digitized lateral cephalograms (DLC), and in lateral cephalograms obtained from CBCT scans (LC-CBCT).
MATERIAL AND METHODS
The protocol of this study was approved by the Ethics in Research of the University North of Paraná.
The sample size for each group was calculated ������������������������������#�#$����beta of 0.2 to achieve 80% of power. Fifty patient exams [conventional lateral cephalograms and cone beam computer tomography (CBCT) scans] from a radiological clinic were selected. For the manual tracings, the cephalograms were traced manually,
and evaluated according to the conventional method, for the digitized lateral cephalograms, the cephalograms were digitized and measured by using the Dolphin Imaging 11™ program (Dolphin Imaging, Chatsworth, CA, USA), and for the lateral cephalograms from the CBCT, the cephalometric measures were made on images similar to lateral cephalograms obtained from the CBCT scans by using the same program as that used with the DLC.
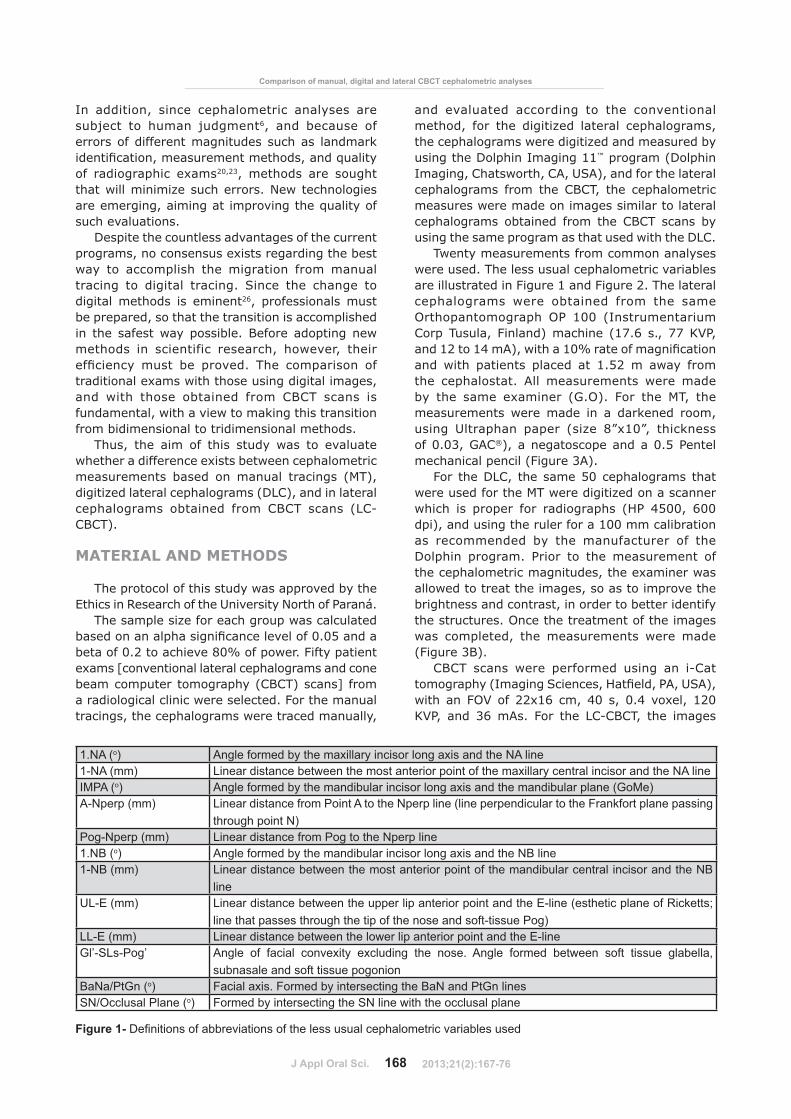
Twenty measurements from common analyses were used. The less usual cephalometric variables are illustrated in Figure 1 and Figure 2. The lateral cephalograms were obtained from the same Orthopantomograph OP 100 (Instrumentarium Corp Tusula, Finland) machine (17.6 s., 77 KVP, ���&'�&*�+/������&#;����������������and with patients placed at 1.52 m away from the cephalostat. All measurements were made by the same examiner (G.O). For the MT, the measurements were made in a darkened room, using Ultraphan paper (size 8”x10”, thickness of 0.03, GAC®), a negatoscope and a 0.5 Pentel mechanical pencil (Figure 3A).
For the DLC, the same 50 cephalograms that were used for the MT were digitized on a scanner which is proper for radiographs (HP 4500, 600 dpi), and using the ruler for a 100 mm calibration as recommended by the manufacturer of the Dolphin program. Prior to the measurement of the cephalometric magnitudes, the examiner was allowed to treat the images, so as to improve the brightness and contrast, in order to better identify the structures. Once the treatment of the images was completed, the measurements were made (Figure 3B).
CBCT scans were performed using an i-Cat ��������<=������!��������>��������+�?!+/�with an FOV of 22x16 cm, 40 s, 0.4 voxel, 120 KVP, and 36 mAs. For the LC-CBCT, the images
1.NA (o) Angle formed by the maxillary incisor long axis and the NA line1-NA (mm) Linear distance between the most anterior point of the maxillary central incisor and the NA lineIMPA (o) Angle formed by the mandibular incisor long axis and the mandibular plane (GoMe)A-Nperp (mm) Linear distance from Point A to the Nperp line (line perpendicular to the Frankfort plane passing
through point N)Pog-Nperp (mm) Linear distance from Pog to the Nperp line1.NB (o) Angle formed by the mandibular incisor long axis and the NB line1-NB (mm) Linear distance between the most anterior point of the mandibular central incisor and the NB
lineUL-E (mm) Linear distance between the upper lip anterior point and the E-line (esthetic plane of Ricketts;
line that passes through the tip of the nose and soft-tissue Pog)LL-E (mm) Linear distance between the lower lip anterior point and the E-lineGl’-SLs-Pog’ Angle of facial convexity excluding the nose. Angle formed between soft tissue glabella,
subnasale and soft tissue pogonionBaNa/PtGn (o) Facial axis. Formed by intersecting the BaN and PtGn linesSN/Occlusal Plane (o) Formed by intersecting the SN line with the occlusal plane
were exported to the Dolphin program, in a DICOM format. Prior to making the measurements, a standardization for each image was made, with a conventional lateral skull, and a view of the right side of the patients. These reconstructed images were lined up, with the orbits parallel to the horizontal plane, and with a corrected head’s rotation. After the alignment of the skull, an image similar to the right lateral cephalograms was generated, and stored in a JPEG format (1360x2045-8 bits). The landmarks were established and the measurements generated automatically by the software (Figure 3C). With the CBCT scans, in addition to the
resources used previously for the DLC (variation of brightness and contrast), the Dolphin program ������� ����� ������ �� ��������� ���� �����were used, to make it easier to see the anatomic repairs (Figure 4).
Error study ������������������������������< &/�������
exams were retraced by the same examiner (T2). The error of the method was carried out for each variable individually, by using the paired t test and the Dahlberg formula.
Statistical analysisA mean value and SD was calculated for each
measurement. Data distribution was analyzed with the Kolmogorov-Smirnov tests. All the cephalometric variables were normally distributed. For comparison between the methods, analysis of variance (ANOVA) was used, followed by the Tukey ���� ����������� ��������� ����������+�� ���tests were made using the Statistical for Windows v.5.1 (StatSoft Inc., Tulsa, OK, USA) program, with �$;�����������������<�@#�#$/�
RESULTS
The results obtained showed a systematic error for 7 of the variables in the MT (SNA; Pog-NB; ANS-Me; 1-NA, UL-E; LL-E, and Gl’-SLs-Pog’) and 6 variables in the DLC (Co-A; ANS-Me; IMPA; 1-NA; 1-NB, and Gl’-SLs-Pog’). The range of casual errors for the MT varied from 0.63 to 2.38, and 0.52 to 3.00 for the DLC (Tables 1 and 2), with most of the variables below 2º or 2 mm. No systematic errors were detected for the LC-CBCT, and the range of casual errors varied from 0.27 to 0.91 (Table 2).
����������������������������������������among the three methods studied (Table 3). Six
������������������������������������������������(SNA; Co-A; ANB; UL-E; IS-NA; and Gl’-SLs-Pog’) among the methods (Table 4). Measurements made in the DLC had a statistically greater SNA than those made in the MT and LC-CBCT. Regarding maxillary length (Co-A), the measurements performed using the MT and DLC were statistically greater than the LC-CBCT. With regards to the evaluation of the maxillomandibular relationship, the DLC was greater than that evaluated on the MT. The protrusion of the upper incisor was lower in the DLC than the measurements made on the MT and LC-CBCT. Regarding the evaluation of the soft tissue, the DLC showed statistically lower values than the MT and LC-CBCT for variable Gl’-SLs-Pog’, and for variable UL-E, the DLC had lower values compared to the LC-CBCT.
DISCUSSION
Variations between the cephalometric and CBCT ��������X����������������������������������to each system. In a cephalostat, the distance between the midsagittal plane of the head and the �����������������������������������������������������������������=�YZY �����������radiation source moves around the patient, very much like an orthopantogram. However, there is �������������������� lateral cephalograms. These ������������������������������������������and distortion5,28. For angular measurements, this is not a problem28. However, absolute distances between landmarks can show differences between methods, especially if they are located in different
tomographic planes, as previously reported5.One problem in this study was that none of
the 3 imaging methods could be taken as the gold standard. For this reason, our focus was on the reproducibility of the parameters obtained on the 3 types of cephalograms. The results of the analyses showed that the measurements performed were independent of the type of image used (conventional, scanned or CBCT). The cephalometric analyses performed on CBCT cephalograms were more reproducible than the measurements made on both the conventional and the digital cephalograms (Tables 1, 2 and 3). The �������������������������������\�����present in the conventional cephalograms, and, ��������������������������������^�����������
structures offer some inaccuracy2. To convert a �����������������������������������������by scanning can result in image distortion21. This is the reason why the cephalogram data sets must be prepared so that the structures may be clearly seen.
In the MT, the measurements that showed a statistically significant difference were the SNA(1.82º), Pog-NB (1.45 mm), ANS-Me (0.94 mm), 1-NA (0.86 mm), UL-E (0.94 mm), LL-E (0.84 mm), and Gl’-SLs-Pog’ (1.65 mm) (Table 1). �������������������\���������������������of locating the A point30, the anterior nasal spine, �����������������������������������������all evaluated cephalograms, since these landmarks are of subjective location and low radiopacity16. Furthermore, the mechanical errors introduced by
drawing lines between landmarks manually and by measuring with a ruler and protractor were common in conventional cephalometric analyses4. Although �����������������"����������������������information for many years, due to its physical nature, it is not always a dependable means � �����10. Film deterioration has been a major source of information loss in craniofacial biology; therefore, digital archiving of lateral cephalograms is a valuable method for orthodontic clinics19. Today, due to technological advancements and the need for data mobility, the manual method is becoming a handicap27.
��_`Y����������� ������������� ����������differences in 6 cephalometric measurements; Co-A (1.96 mm); ANS-Me (1.12 mm); IMPA (2.02º); 1-NA (1.90 mm); 1.NB (2.49º), and Gl’-SLs-Pog’ (1.19º) (Table 2). Previous studies4,20 have already reported errors between manual and
digitized tracings similar to those found in this study, but concluded that although these values are ����������������������������������������������relevance (2 degrees or 2 mm). The digitalization process of scanners changes the nature of the image from an analog form to a digital form13. However, the use of computers for cephalometric analyses does not increase the measurement error when compared with hand tracing14. Most studies evaluating the accuracy of on-screen computer tracing software have transferred conventional �����������������������������������������a procedure that may result in image distortion21. Recommendations from Dolphin Imaging is 150 dpi; Held, et al.13 (2001) indicate that 75 dpi is enough for scanning lateral cephalograms. During �������^ ��������{����� ����������� ��� ����used to identify certain structures more accurately. =� ������� ���������� ��� ����������� ������
�����4�� MT X DLC MT X LC-CBCT DLC X LC-CBCT r P r P r P
Table 5- Intergroup comparisons of the cephalometric variables among the 3 methods evaluated (ANOVA and Tukey tests)
��������������������������������������������������������������������������������������A higher scanning dpi was suggested to assist in circumventing this problem1, and for this reason all radiographs were scanned at 600 dpi in this study. =� ��� ��� �� ������� ��� ����������� � �������format, such as in the present study, the quality of ����������������������������������������in validating the results, and all radiographs offered excellent quality.
The measurements of the LC-CBCT did not ������������������������������� &��� '�thus affording more reliable tracings (Table 3). �����������������������������\����������������������������������������������������������������������������������������������landmarks. Previous studies20,22 have stated that the ����������� �� ������� � ��� �������������
landmarks, which depends especially on the level of ���������������������������������������landmark itself, and on the density and clearness of the images. Nevertheless, there are other ways of reducing errors, such as, care when carrying out exams, standardization of the analysis of cephamometric measurements, and, more recently, �������������������������������������������and planning in Orthodontics17. An important source ��������������^���������������"������� ��Dolphin software affords the enhancement of the cephalograms, which is advantageous especially while precisely marking soft tissue landmarks23.
+������ � ���������� ���������� ��� ����for some of the variables in the MT and DLC methods, the Pearson’s correlation analysis proved significant among the three methods studied, for all magnitudes evaluated. Moreover, most
measurements showed a high correlation (Table 4). Such results corroborate with Grauer, et al.11 (2010), wherein cephalometric measurements obtained from digitized lateral cephalograms were compared to those obtained from CBCT, using the same program as that used in this study.
Thus, although individually, the first two ��������������������������������������the variables, identifying cephalometric landmarks seems to get increasingly easier by using tools that make the contrast between anatomic structures clearer. Therefore, the three methods may be used safely, in that the precision of the LC-CBCT must ���������{��� ���������������^������������method with monitor-displayed images has the following advantages: excellent repeatability and reproducibility, time saving because of no tracing, ������������������������������"�������and supplies to print out hard copies of the digital images30� +����������� �� ������������ � ���3D craniofacial structures with a 2D approach have been addressed, cephalometry has been and still is a valuable method to diagnose and evaluate the treatment outcomes of orthodontic patients2.
The importance of testing different available methodologies to make cephalometric analyses must be pointed out. These studies afford excellent results during the inevitable transition from analog to digital records25,28. In the current study, only six of the 20 cephalometric variables (SNA; Co-A; ANB; 1-NA; UL-E, and STC) offered statistically ���������� ����������� ������� ������ < ����5). No difference was found in the mandibular and vertical components. But for soft tissue variables, all the measurements that showed statistically ������������������������������������+�����This point lies at the edge of the skeletal structures and most of the time is the least reliable16. Although the human eye can determine the edge of a skeletal structure with precision, it is not always ���� � ����� ��� �������� ���������� ���������accuracy16. The idea behind the software feature investigated in this study was that a cursor and the software tools could facilitate this coordination during landmark digitization and facilitate the measurements. Furthermore, differences between soft tissue measurements were found20, because some information can be obtained by enhancing the contrast or creating a mask that can highlight �����������������7.
In contrast to conventional cephalograms, errors due to malposition of the patient during image acquisition could be corrected in CBCT data sets by interactive adjustment. The innate 3D characteristics of the CBCT data sets allow the generation of virtually countless reformatted images3, and orthogonal cephalograms (parallel x-rays)2. Furthermore, it is possible to represent
the right and left parts of skulls separately, avoiding superimposition of the bilateral structures. However, the CBCT scans are valued when 3D morphology is necessary, and should be used only when the inherent 3D information could improve the diagnosis and treatment plan8. CBCT demands a higher radiation dose than traditional cephalometric images. For these reasons, its use should be ��������������������������������������������impacted teeth, or those with facial asymmetries or craniofacial anomalies, in which CBCT is better able to quantify the differences between the right and the left side of craniofacial structures.
CBCT data sets can provide undistorted 3D morphology, making it possible to identify craniofacial structures more naturally. However, �������^ ������������ �� |_ �� �� ������2. To obtain a high level of precision is very important, ���������� ���� ��� ��� ��� ���� �� ���������research, since image visualization errors would result in altered diagnoses, and, thus, in erroneous plans of treatment. Therefore, the use of inadequate tools could lead researchers to misinterpretations29. Furthermore, there should be concerns that persons who are inappropriately trained to read images, regardless of the method used, will misinterpret the data with consequent misdiagnoses and inappropriate patient treatment.
CONCLUSIONS
1- All the methods tested proved to be reliable ����������������������������������������������acceptable differences between the manually and digitally traced radiographs.
2- Greater reliability was obtained from the CBCT scans.
REFERENCES
1- Bruntz LQ, Palomo JM, Baden S, Hans MG. A comparison of scanned lateral cephalograms with corresponding original radiographs. Am J Orthod Dentofacial Orthop. 2006;130:340-8.2- Cattaneo PM, Bloch CB, Calmar D, Hjortshoj M, Melsen B. Comparison between conventional and cone-beam computed tomography-generated cephalograms. Am J Orthod Dentofacial Orthop. 2008;134:798-802.3- Cevidanes LH, Styner MA, Proffit WR. Image analysis and superimposition of 3-dimensional cone-beam computed tomography models. Am J Orthod Dentofacial Orthop. 2006;129:611-8.4- Chen YJ, Chens K, Yao JCC, Chang HF. The effects of differences �� �������^ ������������� ���������������������������in traditional versus digitized cephalometry. Angle Orthod. 2004;74:155-61.5- Chidiac JJ, Shofer FS, Al-Kutoub A, Laster LL, Ghafari J. Comparison of CT scanograms and cephalometric radiographs in craniofacial imaging. Orthod Craniofac Res. 2002;5:104-13.6- Damstra J, Fourie Z, Huddleston Slater JJ, Ren Y. Reliability and the smallest detectable difference of measurements on 3-dimensional cone-beam computed tomography images. Am J Orthod Dentofacial Orthop. 2011;140:e107-14.
7- Farman AG. Fundamentals of image acquisition and processing in the digital era. Orthod Craniofac Res. 2003;6(Suppl 1):17-22.8- Farman AG. ALARA still applies. Oral Surg Oral Med Oral Pathol Oral Radiol Endod. 2005;100:395-7.9- Freitas LM, Freitas KM, Pinzan A, Janson G, Freitas MR. A comparison of skeletal, dentoalveolar and soft tissue characteristics in white and black Brazilian subjects. J Appl Oral Sci. 2010;18:135-42.10- Geelen W, Wenzel A, Gotfredsen E, Kruger M, Hansson LG. ����������������������������������^����������������hardcopy, and monitor-displayed images obtained by the storage phosphor technique. Eur J Orthod. 1998;20:331-40.11- Grauer D, Cevidanes LHS, Styner MA, Heulfe I, Harmon ET, Zhu H, et al. Accuracy and landmark error calculation using cone-beam computed tomography-generated cephalograms. Angle Orthod. 2010;80:286-94.12- Halazonets DJ. From 2-dimensional cephalograms to 3-dimensional computed tomography scans. Am J Orthod Dentofacial Orthop. 2005;127:627-37.13- Held CL, Ferguson DJ, Gallo MW. Cephalometric digitization: A determination of the minimum scanner settings necessary for ��������������^�������������+�������_���������������2001;119:472-81.14- Houston WJB. The analysis of errors in orthodontic measurements. Am J Orthod Dentofacial Orthop. 1983;83:382-90.15- Janson G, Quaglio CL, Pinzan A, Franco EJ, Freitas MR. Craniofacial characteristics of Caucasian and Afro-Caucasian Brazilian subjects with normal occlusion. J Appl Oral Sci. 2011;19:118-24.16- Kazandjian S, Kiliaridis S, Mavropoulos A. Validity and reliability �����������������������{����������������������cephalometric landmarks. Angle Orthod. 2006;76:619-24.17- Kusnoto B. Two-dimensional cephalometry and computerized orthognathic surgical treatment planning. Clin Plast Surg. 2007;34:417-26.18- Leonardi R, Giordano D, Maiorana F, Spampinato C. Automatic cephalometric analysis. Angle Orthod. 2008;78:145-51.19- Melsen B, Baumrind S. Clinical research applications of cephalometry. In: Athanasiou AE. Orthodontic cephalometry. Saint Louis: Mosby-Wolfe; 1995. p. 181-202.
20- Naoumova J, Lindman R. A comparison of manual traced images and corresponding scanned radiographs digitally traced. Eur J Orthod. 2009;31:247-53.21- Polat-Ozsoy O, Gokcelik A, Toygar Memikoglu TU. Differences in cephalometric measurements: a comparison of digital versus hand-tracing methods. Eur J Orthod. 2009;31:254-9.22- Santoro M, Jarjoura K, Cangialosi TJ. Accuracy of digital and analogue cephalometric measurements assessed with the sandwich technique. Am J Orthod Dentofacial Orthop. 2006;129:345-51.23- Sayinsu K, Isik F, Trakyali G, Arun T. An evaluation of the errors in cephalometric measurements on scanned cephalometric images and conventional tracings. Eur J Orthod. 2007;29:105-8.24- Souza KRS, Oltramari-Navarro PVP, Navarro RL, Conti ACCF, Almeida MR. Reliability of a method to conduct upper airway analysis in cone-beam computed tomography. Braz Oral Res. 2013;27:48-54.25- Swennen GRJ, Schutyser F. Three-dimensional cephalometry: spiral multi-slice vs cone-beam computed tomography. Am J Orthod Dentofacial Orthop. 2006;130:410-6.26- Tan SS, Ahmad S, Moles DR, Cunningham SJ. Picture archiving and communications systems: a study of reliability of orthodontic cephalometric analysis. Eur J Orthod. 2011;33:537-43.27- Thurzo A, Javorka V, Stanko P, Lysy J, Suchancova B, Lehotska V, et al. Digital and manual cephalometric analysis. Bratisl Lek Listy. 2010;111:97-100.28- Vlijmen OCv, Maal TJJ, Bergé SJ, Bronkhorst EM, Katsaraos C, Jagtman AMK. A comparison between two-dimensional and three-dimensional cephalometry on frontal radiographs and on cone beam computed tomography scans of human skulls. Eur J Orthod. 2009;117:300-5.29- Yitschaky O, Redlich M, Abed Y, Faerman M, Casap N, Hiller N. Comparison of common hard tissue cephalometric measurements between computed tomography 3D reconstruction and conventional 2D cephalometric images. Angle Orthod. 2011;81:13-8.|#���!>�����_!�Z��^!>��������������������^������������on monitor-displayed lateral cephalometric images. Am J Orthod Dentofacial Orthop. 2008;133:790 e1-6; discussion e1.