Comparison of Marshall and Superpave Gyratory Volumetric Properties of Saskatchewan Asphalt Concrete Mixes Miranda Carlberg, P. Eng. Saskatchewan Highways and Transportation Dr. Curtis Berthelot, P. Eng. University of Saskatchewan Neil Richardson, P. Eng. Saskatchewan Highways and Transportation Paper prepared for presentation at the “Superpave Implementation and Experience in Canada” Session of the 2003 Annual Conference of the Transportation Association of Canada St. John’s, Newfoundland and Labrador The research work reported was sponsored and supported by the Saskatchewan Department of Highways and Transportation. The authors are grateful for this sponsorship and support. Many Department of Highways and Transportation employees contributed to this work. These include: Kelvin Shuvera, Magdy Beshara, Rock Gorlick, Ron Genest, Kerry Bray, Stacy Bowen, Scott McLeod, Chris Gauthier, Terry Haldorson, Jorge Antunes, Barry Thomas, Dale Hancock, Gary Uhren, and Carol Stulberg. Thanks also to Dan Bonnet, Greg Chartier, David Linnen, and Ciprian Raducanu for their contributions. 1
Transcript
Comparison of Marshall and Superpave Gyratory Volumetric Properties of Saskatchewan
Asphalt Concrete Mixes
Miranda Carlberg, P. Eng. Saskatchewan Highways and Transportation
Dr. Curtis Berthelot, P. Eng. University of Saskatchewan
Neil Richardson, P. Eng.
Saskatchewan Highways and Transportation
Paper prepared for presentation at the “Superpave Implementation and Experience in Canada” Session
of the 2003 Annual Conference of the Transportation Association of Canada
St. John’s, Newfoundland and Labrador
The research work reported was sponsored and supported by the Saskatchewan Department of Highways and Transportation. The authors are grateful for this sponsorship and support. Many Department of Highways and Transportation employees contributed to this work. These include: Kelvin Shuvera, Magdy Beshara, Rock Gorlick, Ron Genest, Kerry Bray, Stacy Bowen, Scott McLeod, Chris Gauthier, Terry Haldorson, Jorge Antunes, Barry Thomas, Dale Hancock, Gary Uhren, and Carol Stulberg. Thanks also to Dan Bonnet, Greg Chartier, David Linnen, and Ciprian Raducanu for their contributions.
1
ABSTRACT
Saskatchewan Highways and Transportation is investigating adding higher percentages of fractured coarse aggregate to asphalt concrete pavements to improve rutting performance. Higher percentages of fractured coarse aggregate are more costly to use, as aggregate is obtained from increasingly scarce glacial gravel deposits in Saskatchewan.
The objective of this research was to investigate the influence of coarse aggregate fracture on rutting performance of typical Saskatchewan dense-graded mixes. Three Marshall mixes were compacted with varying percentages of fractured coarse aggregate. The asphalt content and gradation of the mixes were held constant, as was the asphalt cement. Seventy-five blow Marshall specimens and modified Superpave gyratory compacted (SGC) samples of the test mixes were manufactured.
Analysis of the volumetric properties between types of samples showed a difference between 75-blow Marshall and SGC samples of the same test mix. Duncan’s pairwise comparison statistical analysis found that the 65 percent fracture mix and the 85 percent fracture mix were similar, but the 45 percent fracture mix was different across the Marshall specimens. The same analysis across the SGC samples found that the 85 percent fracture mix was different, where the 45 percent and 65 percent fracture mixes grouped together.
Several rut performance predictors were investigated for these test mixes; however, the volumetric investigation of the SGC samples was the only analysis to show a benefit to having 85 percent fracture in asphalt mixes. Subsequent analysis of the SGC samples shows differences in compaction slopes and densities at initial and design gyration levels between test mixes.
2
1 – INTRODUCTION
Analysis of Marshall versus Superpave gyratory compacted (SGC) volumetric properties of asphalt mixes was a part of a larger experiment to determine the effect that fracture has on the rutting performance of asphalt mixes. Three test mixes with varying percentages of coarse aggregate fracture were compacted, the volumetric properties analyzed, and the rut performance predictors were examined (Marshall stability and flow, as well as complex modulus, phase angle, and Poisson’s ratio) [1]. The SGC volumetric properties obtained were quite different from the Marshall properties, and showed distinct differences between mixes. Because the Superpave gyratory compaction process identified more discrete distinctions between the different proportions of coarse aggregate fracture, gyratory compaction could possibly identify differences in mix consolidation.
1.1 Purpose
The objective of this research was to investigate the influence that coarse aggregate fracture has on the rutting performance of typical Saskatchewan dense-graded mixes. The research attempted to isolate coarse aggregate angularity and its effect on rutting performance, thus minimizing the effect of other mix properties.
1.2 Background
Because of a recent shift of the transportation of bulk commodities from rail line to road, rutting performance of asphalt concrete pavements is a critical performance element in the management of Saskatchewan’s infrastructure [2]. Saskatchewan Highways and Transportation (DHT) recently began specifying higher angularity (fracture) of coarse aggregate for high traffic volume asphalt concrete pavements to improve the rutting resistance of the asphalt concrete pavement.
Approximately 8,900 km of Saskatchewan’s highest traffic volume roads are surfaced with asphalt concrete pavement structures. Asphalt concrete pavements comprise 33.8 percent of the total length of provincial highways in Saskatchewan. Of all the kilometers traveled by the public in Saskatchewan, 74.4 percent is on asphalt concrete highways [3]. DHT spent $41.7 million on asphalt concrete pavements in 2001, which was more than 35 percent of the total preservation spending [3]. Additional aggregate costs for the higher fracture coarse aggregate on arterial highways would range from $340,000 to $1,605,000 [4] [5]. Increasing the aggregate fracture percentages on the National Highway System (NHS) alone comprised four percent of all preservation funding on the provincial highway asphalt concrete pavements in 2001.
Unfortunately, the amount of Saskatchewan’s asphalt concrete pavements characterized as in poor condition (defined by DHT as having a rut depth of over 15 mm) due to rutting is increasing. In 2001, 19.1 percent of the NHS and 14.6 percent of the provincial highway system asphalt concrete pavements were in poor condition [3]. Improving the rutting performance of asphalt concrete pavements would reduce maintenance spending over time.
Coarse aggregate fracture is defined by the Transportation Association of Canada (TAC) as the percent by weight of aggregate particles retained on the 5 mm sieve with one or more faces that have been fractured by an aggregate reduction (crushing) process [6]. Angular aggregate surfaces provide improved
3
particle interlocking and a presumably superior aggregate skeleton, which induces increased compressive load-carrying capacity, strength and stiffness of asphalt concrete pavement [7].
Aggregate for use in road construction is becoming scarce. Most of Saskatchewan has been glaciated (except the Cypress Hills area) at least four times [8]. Saskatchewan’s hot mix asphalt concrete aggregate supply is, therefore, primarily derived from glacial deposits of sand and gravel. Large areas of thick glacial lake basin clay exist in southern Saskatchewan; aggregate hauls in such areas can reach 70 km at present. Much longer hauls are projected, and the entire resource will be exhausted within 50 years. Remaining aggregate sources typically have a high natural sand content with significant amounts of material passing the 0.075 mm sieve [9].
Higher coarse aggregate fracture is typically more costly to produce and also generates significant volumes of rejected aggregate. The extra cost and aggregate wastage associated with higher fracture percentages alone may not add equivalent benefit in terms of improved performance of asphalt concrete pavements relative to other asphalt mix properties.
1.3 Saskatchewan’s Current Mix Design Procedure
Saskatchewan currently designs and specifies asphalt concrete mixes using the Marshall method of mix design. For the typical mix design procedure, aggregate is separated into at least three stockpiles: natural fine aggregate, crushed fine aggregate, and crushed coarse aggregate. Natural fine aggregate is produced by screening the aggregate over a 9 mm sieve prior to it being passed through the crusher. The crusher produces the crushed aggregate – coarse aggregate particles are defined as larger than 9 mm in size, and crushed fine particles are smaller than that threshold produced via the crushing process.
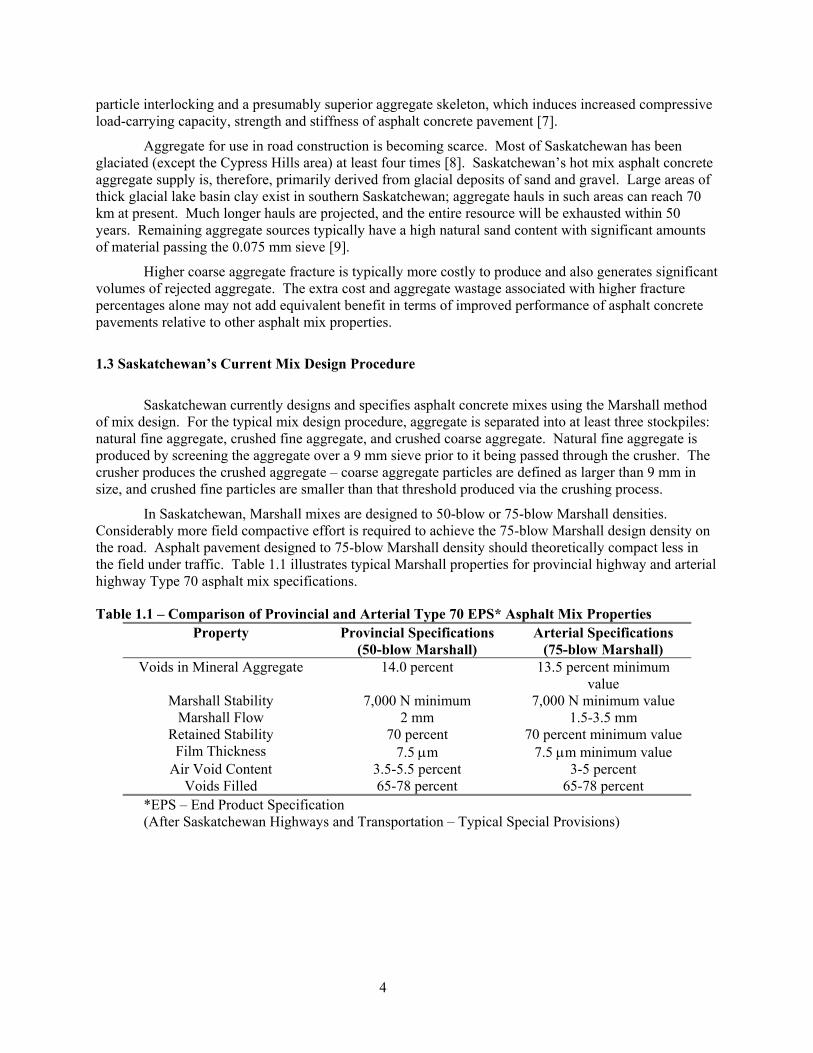
In Saskatchewan, Marshall mixes are designed to 50-blow or 75-blow Marshall densities. Considerably more field compactive effort is required to achieve the 75-blow Marshall design density on the road. Asphalt pavement designed to 75-blow Marshall density should theoretically compact less in the field under traffic. Table 1.1 illustrates typical Marshall properties for provincial highway and arterial highway Type 70 asphalt mix specifications.
Table 1.1 – Comparison of Provincial and Arterial Type 70 EPS* Asphalt Mix Properties Property Provincial Specifications
(50-blow Marshall) Arterial Specifications
(75-blow Marshall) Voids in Mineral Aggregate 14.0 percent 13.5 percent minimum
value Marshall Stability 7,000 N minimum 7,000 N minimum value
Marshall Flow 2 mm 1.5-3.5 mm Retained Stability 70 percent 70 percent minimum value
Film Thickness 7.5 µm 7.5 µm minimum value Air Void Content 3.5-5.5 percent 3-5 percent
Voids Filled 65-78 percent 65-78 percent *EPS – End Product Specification (After Saskatchewan Highways and Transportation – Typical Special Provisions)
4
2 – TESTING PROGRAM
The laboratory component of this research employed DHT Type 70 specifications for asphalt concrete pavement mix design. Test mixes were composed attempting to maintain similar material properties by using a constant asphalt cement and aggregate source, but varying coarse aggregate fracture. The test mixes were characterized in a conventional Marshall framework, as well as by Superpave Level 1 gyratory compaction.
A similar experiment by Wedding and Gaynor [10], characterizing the effect of fracture on Marshall compacted dense mixes, evaluated four different mixes with varying percentages of crushed gravel (0, 50, 75, 100 percent). They found that Marshall stability increased as the percent of crushed gravel increased, the unit weight decreased slightly as the percentage of crushed gravel used increased, the volume of air voids was largely unaffected by the percentage of crushed gravel, the voids in mineral aggregate increased slightly as the percent crush increased, the optimum asphalt content was largely unaffected, as were the Marshall flow values. They did find only a slight increase in stability when considering 100 percent crushed gravel versus 75 percent crushed gravel. They conclude that requiring more than 75 percent crushed gravel may only increase the cost without any significant advantage to the asphalt mix performance in the field.
2.1 The Test Mixes
Laboratory characterization of test mixes consisted of manufacturing three asphalt mixes with 45 percent (T45 test mix), 65 percent (T65 test mix), and 85 percent (T85 test mix) coarse aggregate fracture. The test mixes used in this study were based on a mix design for an in-service pavement. The test mixes were analyzed using conventional physical property analysis techniques in the Marshall framework (as specified in Saskatchewan’s Standard Test Procedure [STP] 204-21 and STP 204-11) [11]. Typical Marshall mix design methodology requires duplicate or triplicate test results; thus, triplicate samples were used in this characterization.
Although Marshall mix design procedures were used in this experiment; a full Marshall mix design was not completed for the test mixes. The T85 mix was based on the original Marshall mix design; however, it was not tested at varying asphalt contents. The mix design parameters are outlined in Table 2.1.
A goal of the mix design procedure is to use an aggregate gradation that matches the produced aggregate in the field as closely as possible, while obtaining suitable volumetric and stability values. This will result in minimized aggregate wastage.
The aggregate source selected was crushed for hot mix asphalt concrete used on Highway 1 (Control Section 1-22) near the Alberta border. This source is an ice contact glacial gravel deposit containing hard, rounded quartzite [12]. The design fracture percentage for the coarse aggregate was 84.2 percent. The lower fracture mixes were obtained by replacing part of the crushed coarse aggregate with natural rounded coarse aggregate. This natural rounded aggregate was rejected during the production of aggregate in order to meet the 85 percent fracture target.
The T85 mix was to duplicate the C00157 mix. The T65 and T45 test mixes had the same gradation and asphalt content. The samples were composed using the gradation and asphalt content noted in Table 2.1, with the assumption that they would fall within DHT specifications for the original asphalt mix.
DHT specifies that aggregate must meet several criteria in addition to percent fractured faces. The other criteria are assessed at the initial investigation and mix design phases. These criteria are:
5
limited lightweight pieces (STP 206-9), low plasticity index (STP 206-4), and limited clay and friable particles (STP 206-15) in the aggregate.
Fracture 98 0 0 84 (mix design by Clifton Associates for Carmacks Construction)
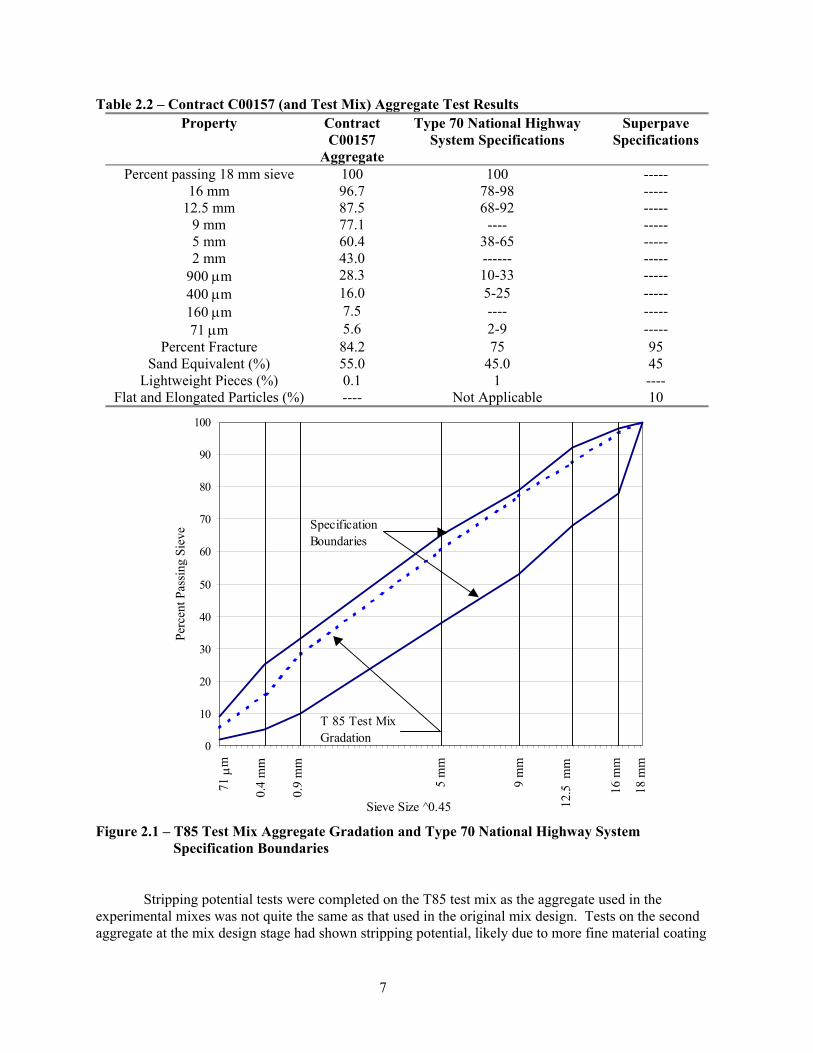
Table 2.2 shows the test results for the aggregate used for contract C00157, (which is also the aggregate used for the three test mixes), as well as the applicable DHT specified limits. Although Saskatchewan does not specify aggregate or asphalt mix by the Superpave mix design methodology, the Superpave allowable limits are also shown in Table 2.2 (Superpave sieve sizes do not match those currently used by DHT; therefore, the Superpave gradation limits are not shown) for comparison. The results are illustrated in Figure 2.1.
Stripping (also called moisture susceptibility) occurs when the aggregate loses its bond with the asphalt cement when exposed to water. In the most advanced stages, stripped asphalt concrete loses the adhesion between the asphalt cement and the aggregate, and therefore, the mix reverts to unbound aggregate, with little strength. A “stripped” asphalt concrete structure will exhibit a higher permanent deformation rate under traffic loading [13]. Most aggregate found in Saskatchewan exhibits stripping potential. A non-stripping aggregate was desirable for this experiment, to minimize the stripping effects on rutting performance (as well as to eliminate the need for an anti-stripping agent), and to reduce the variability of lab test results. Thus an aggregate source with low stripping potential aggregate was identified.
6
Table 2.2 – Contract C00157 (and Test Mix) Aggregate Test Results Property Contract
C00157 Aggregate
Type 70 National Highway System Specifications
Superpave Specifications
Percent passing 18 mm sieve 100 100 ----- 16 mm 96.7 78-98 -----
12.5 mm 87.5 68-92 ----- 9 mm 77.1 ---- ----- 5 mm 60.4 38-65 ----- 2 mm 43.0 ------ -----
ure 2.1 – T85 Test Mix Aggrega rada e 70 National Hi
Flat and Elongated Particles (%) ---- Not Applicable 10
0
10
20
30
40
50
60
70
80
90
100
Sieve Size ^0.45
Perc
ent P
assi
ng S
ieve
71 µ
m
0.4
mm
0.9
mm
5 m
m
9 m
m
12.5
mm
16 m
m
18 m
m
Specification Boundaries
T 85 Test Mix Gradation
Fig te G tion and Typ ghway System
Stripping potential tests were completed on the T85 test mix as the aggregate used in the
experim cond
Specification Boundaries
ental mixes was not quite the same as that used in the original mix design. Tests on the seaggregate at the mix design stage had shown stripping potential, likely due to more fine material coating
7
the aggregate particles. The test procedure for stripping potential is outlined in STP 204-15. The averagestripping potential was 20 percent. Anti-stripping agent is not required if the stripping potential is 20 percent or less, so none was added to the experimental mixes.
.2 Traditional Marshall Samples
The Marshall volumetric analysis is performed as part of the Marshall mix design procedure. Samples ce
Table 2.3 – Average Marshall Physical Properties for Test Mixes
ient of V
Average
Coefficient of
2
of all three test mixes were physically analyzed to determine volumetric properties in accordanwith STP 204-21. Properties determined include the density, percentage of air voids, the voids in mineral aggregate, and the voids filled.
Property Average Coefficient of Average Coefficfor T45
Test Mix
Variation for T45 Test Mix
(%)
for T65 Test Mix
ariation for T65Test Mix (%)
for T85 Test Mix
Variation for T85 Test Mix
(%)
(kg/m3)
Air Void C ) 4.2 6.1 5.0 3.1 4.9 1.2
A 14.0 1.8 14.7 1.0 14.6 0.4
Voids Filled 70.3 2.1 66.1 1.2 66.6 0.3
ontent (%
Voids in Mineral ggregate
(%)
(%)
Density 2409 0.3 2387 0.2 2390 0
he values shown in Table 2.3 are based on averages of triplicate test results. As Table 2.3 indicate nge
that the T85 test mix matches the mix design very closely. The T45 and T65
2.3 Superpave Level 1 Gyratory Compacted Samples
Superpave asphalt mix design methodology may be conducted at three levels. Superpave Level 1 covers v
rent
ties
Ts, the volumetric properties for the T85 and T65 test mixes are very similar. However, a cha
is seen between those two test mixes and the T45 test mix. All average results fall within acceptable values for a DHT EPS asphalt mix.
Tables 2.1 and 2.3 illustrates test mixes vary from the mix design values, as would be expected due to different coarse
aggregate fracture.
olumetrics, aggregate gradation and properties. Superpave mix design is based on the properties of the asphalt binder and aggregate, and volumetric properties of the hot mix asphalt [14]. Level 2 includes tests for performance prediction, using the Superpave Shear Tester (SST) and the Indirect Tension Tester (IDT). Level 3 uses the SST and IDT at different stress state conditions, and at diffetemperatures to conduct enhanced performance tests. The equipment to conduct these tests is expensive, and a retrospective study of Superpave was carried out by National Co-operative Highway Research Program (NCHRP) to determine if analyzing SGC sample properties could predict compaction proper
8
[15]. Select parameters evaluated by NCHRP 9-19 are evaluated for the test mixes used in this experiment in Section 3.
Once the test mixes were determined by the Marshall method, three additional SGC samples from each tes
n
d
traffic set in the surfacing design was 1.41 x 10⁷ Equivalent Single Axle Loads (ESALs ion
ent
Table 2.4 – Superpave Gyratory Compactive Effort for Test Mixes mber of
t mix were composed using Superpave Level 1 protocol (American Association of State Highway Officials (AASHTO) MP-2). A Superpave design was not completed, but the Marshall design mix was used in conjunction with the SGC and select Superpave protocol. The compactive effort was selected in accordance with the original design traffic, and the high air temperature [7] according to the Superpave mix design procedure. These samples were 150 mm in diameter, and approximately 150 mm tall. This size is not standard for Superpave characterization, but required for the dynamic modulus characterizatiothat was carried out for these samples [1]. The dry weight of these samples was approximately 6000 g, but the volumetric properties and compaction should not be different than those determined for a standarSGC sample [16].
The design). Climactic data shows that the daily maximum air temperature for the nearest weather stat
(Maple Creek) is 27.4 °C [17]. The Superpave gyratory compactive effort suitable for the original construction environment is thus noted in Table 2.4 below. All test mixes had constant asphalt cemgrade and content, as well as aggregate source. Triplicate samples were used.
Nini (Initial Number of Ndes (Design Number of Nmax (Maximum NuGyrations) Gyrations) Gyrations)
8 109 174 ab itute,Taken from T le 5.1, after Asphalt Inst [7] for 1.41 x 10⁷ ESALS and < 39 oC
The air void content is determined for the final height of the gyratory sample, however the height (and the
Table 2.5 – Average Gyratory Physical Properties for Test Mix Samples
T T
verage
T
Coefficient of
refore number of gyrations) for a predetermined air void content can be interpolated. In this case, the design number of gyrations was used to compact the gyratory samples. Asphalt mix properties for the maximum number of gyrations were not determined. Volumetric results (averaged from triplicate samples) for the design gyrations of each test mix are presented in Table 2.5 below.
Property Average Coefficient of Average Coefficient of Aat Ndes for the
45 MixVariation for T45 Test Mix
(%)
for the 65 Mix
Variation for T65 Test Mix
(%)
for the 85 Mix
Variation for T85 Test Mix
(%)
Density (kg/m3)
ir Voids
2436 0.3 2428 0.1 2415 0.2
A 3.1 9.4 3.4 3.4 3.9 4.0
V
A 12.9 1.8 13.2 0.4 13.7 1.1
VF ) 76.4 2.2 74.6 0.9 71.7 1.3
(%)
oids inMineral ggregate
(%)
oids illed (%
Gyrations 109 109 109
9
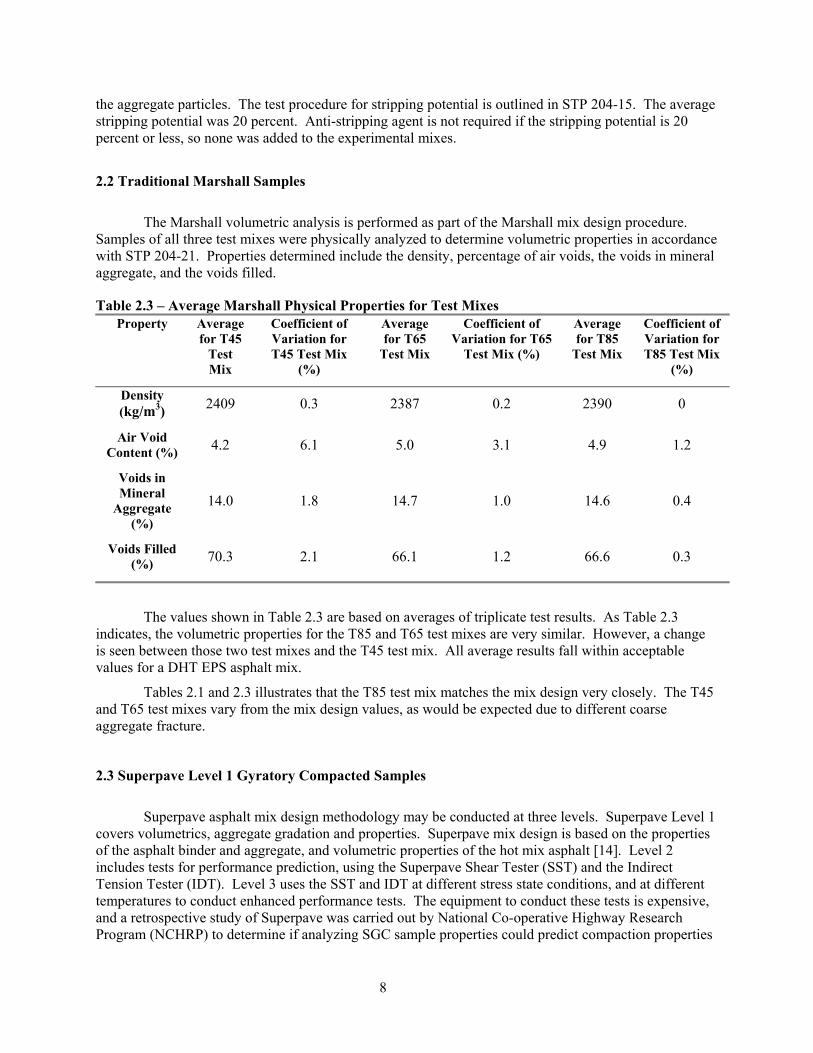
The Superpave mix design methodology aims to have four percent air voids at the design gyration level of
compaction. As seen in Table 2.5, none of the test mixes met this objective, however, the T85 test mix air void percentage at the design gyration level was 3.9 percent. Air voids are evaluated at the initial gyration level of compaction to identify a mix that will compact too quickly. Average values for percentage of maximum theoretical density the SGC samples reached at the initial gyration level (Nini ) and at the design gyration level (Ndes) values are shown in Figure 2.2 below. None of the test mixes metthe targets for Superpave mix design [16]; however the T85 test mix was on the threshold.
90.189.7
89.1
96.9 96.696.1
84
86
88
90
92
94
96
98
T45 T65 T85
Perc
ent o
f Max
imum
The
oret
ical
Den
sity
Nini (8 G) Ndes(109 G)
Target for Ndes
Target for Nini
Figure 2.2 – Percent of Maximum Theoretical Density at Initial Gyrations (Nini ) and Design
.0 ANALYSIS
The Superpave gyratory compactor was adapted to more realistically compact mix specimens to densitie
f
Gyrations (Ndes) Levels for Test Mixes
3
s achieved under actual construction and loading conditions. As well, a goal was to measure compactibility so that potential tender mix behavior and similar compaction problems could be identified [7]. The SGC could provide a convenient way to evaluate the densification characteristics oasphalt concrete mixes. All of the analysis in this section was carried out at the design level of gyrations.
10
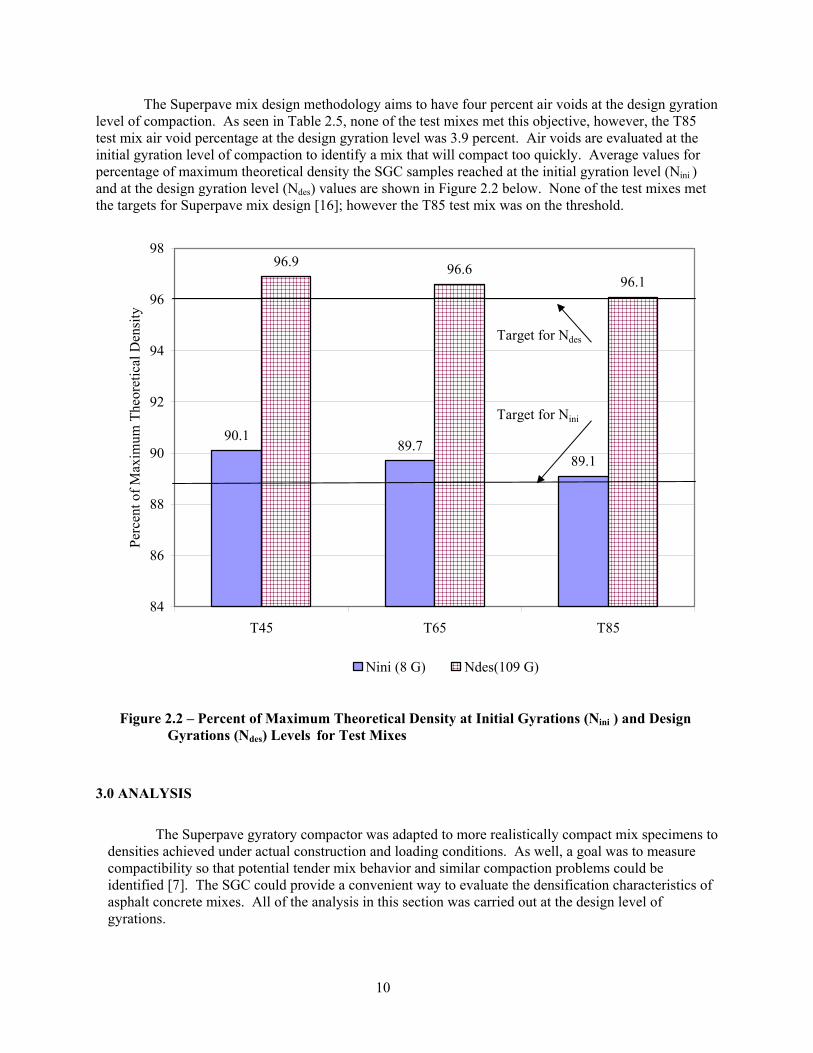
3.1 Comparison of Volumetric Properties between Compaction Methods
Figure 3.1 illustrates average Marshall and SGC densities obtained across the test mixes. As seen in Figure 3.1, the SGC densities are higher than the Marshall compacted samples. In addition, the SGC samples showed a trend decreasing density with increasing fracture across the test mixes.
2408.5
2387.0 2390.0
2436.02428.3
2415.3
2360
2370
2380
2390
2400
2410
2420
2430
2440
T 45 Test Mix T 65 Test Mix T 85 Test Mix
Ave
rage
Den
sity
(kg/
m3 )
Marshall Gyratory
Figure 3.1 – Comparison of Average Marshall and Average Gyratory Densities for Test Mixes
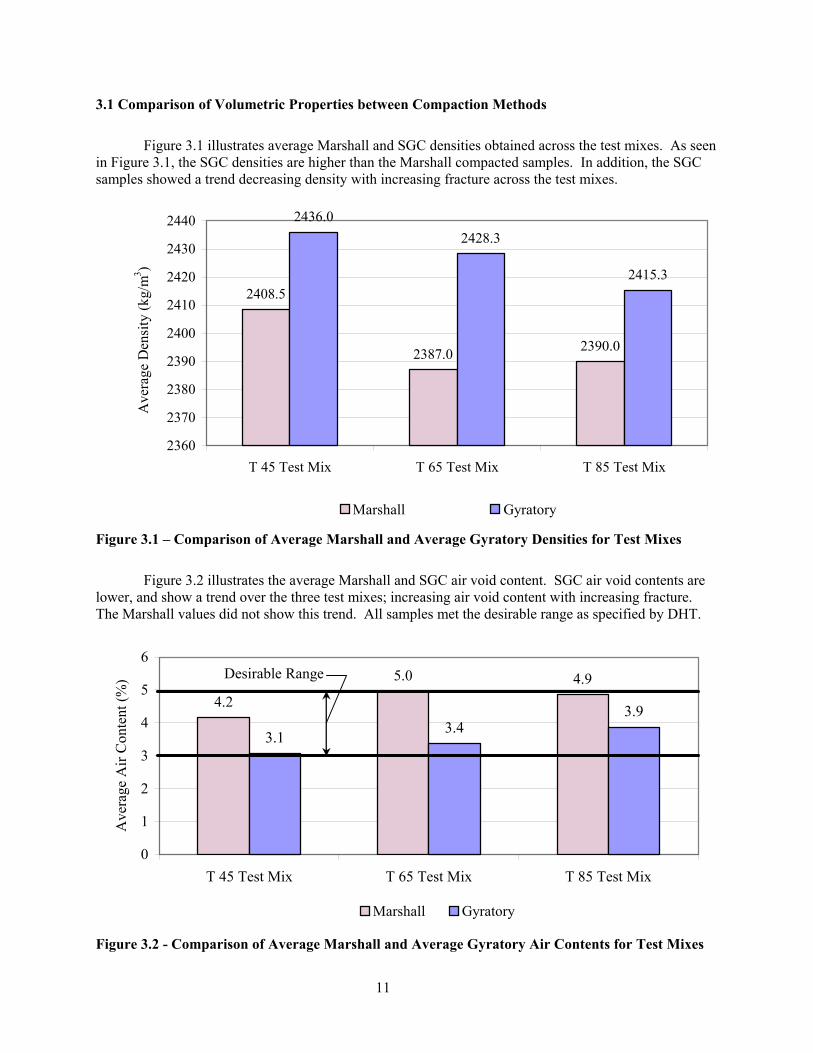
Figure 3.2 illustrates the average Marshall and SGC air void content. SGC air void contents are lower, a
nd show a trend over the three test mixes; increasing air void content with increasing fracture.
The Marshall values did not show this trend. All samples met the desirable range as specified by DHT.
4.2
5.0 4.9
3.1 3.43.9
0
1
2
3
4
5
6
T 45 Test Mix T 65 Test Mix T 85 Test Mix
Ave
rage
Air
Con
tent
(%)
Marshall Gyratory
Desirable Range
Figure 3.2 - Comparison of Average Marshall and Average Gyratory Air Contents for Test Mixes
11
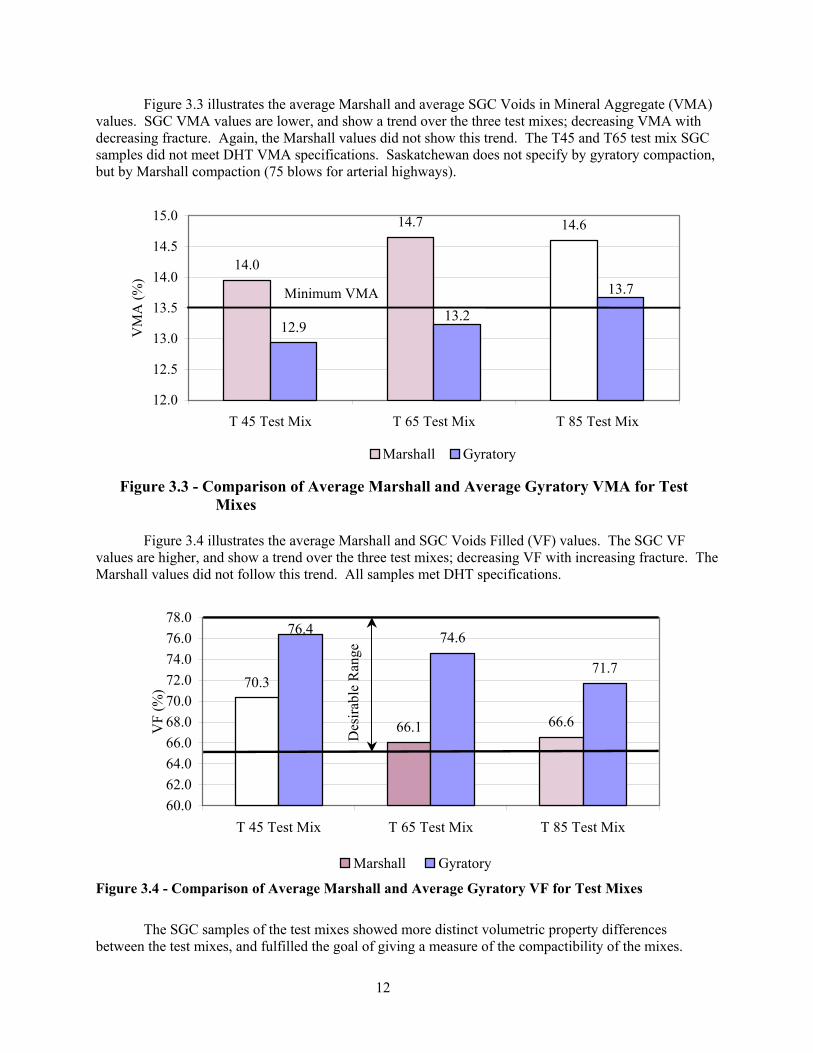
Figure 3.3 illustrates the average Marshall and average SGC Voids in Mineral Aggregate (VMA) values. SGC VMA values are lower, and show a trend over the three test mixes; decreasing VMA with decreasing fracture. Again, the Marshall values did not show this trend. The T45 and T65 test mix SGC samples did not meet DHT VMA specifications. Saskatchewan does not specify by gyratory compaction, but by Marshall compaction (75 blows for arterial highways).
14.715.0
14.0
14.6
12.9
13.7
13.2
12.0
12.5
13.0
13.5
14.0
14.5
T 45 Test Mix T 65 Test Mix T 85 Test Mix
VM
A (%
)
Marshall Gyratory
Minimum VMA
Figure 3.3 - Comparison of Average Marshall and Average Gyratory VMA for Test
Mixes
Figure 3.4 i the average Marshall and SGC Voids Filled (VF) values. The SGC VF values are higher, and show a trend over the three test mixes; decreasing VF with increasing fracture. The Marsh
llustrates
all values did not follow this trend. All samples met DHT specifications.
78.0
70.3
66.1 66.6
74.6
71.7
76.4
60.062.064.066.068.070.072.074.076.0
T 45 Test Mix T 65 Test Mix T 85 Test Mix
VF
(%)
Marshall Gyratory
Des
irabl
e R
ange
Figure 3.4 - Comparison of Average Marshall and Average Gyratory VF for Test Mixes
ces between the test mixes, and fulfilled the goal of giving a measure of the compactibility of the mixes.
The SGC samples of the test mixes showed more distinct volumetric property differen
12
Contrary to the Marshall analysis, differences in the volumetric properties of the SGC test are evident over all three test mixes. Density and voids filled values consistently decrease over the T45
mixes ,
T65, an
A) and Duncan’s pairwise comparisons were performed for fracture related to air void content, density, VMA, and VF for the Marshall samples using the statistical analysis
bulated in Table 3.1.
Table 3Duncan’s Group
d T85 test mixes, and air content and VMA consistently increase. This indicates that as the coarseaggregate fracture is higher, the asphalt mix is less compactable.
3.2 Interpretation and Statistical Analysis
One-way analysis of variance (ANOV
software package Statistica. Fracture was found to have an effect on all volumetric properties of Marshall compacted samples.
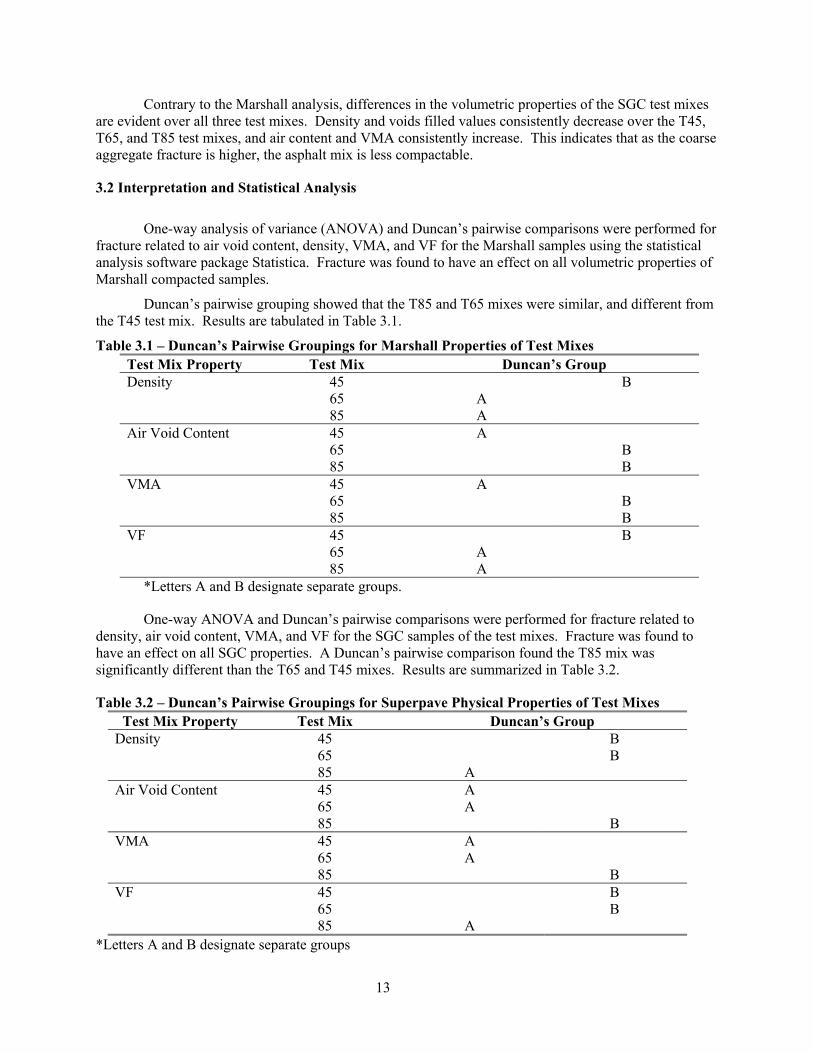
Duncan’s pairwise grouping showed that the T85 and T65 mixes were similar, and different from the T45 test mix. Results are ta
.1 – Duncan’s Pairwise Groupings for Marshall Properties of Test Mixes Test Mix Property Test Mix Density 45 B 65 A
A Content
ir Void
85 A 45 A 65 B
B MA
85 A V 45
65 B B
F 85
V 45 B 65 A
A
85 *Letters A and B designate separate groups.
mparisons were performed for fracture related to density, samples of the test mixes. Fracture was found to have an
Test Mix Property Test Mix Duncan’s Group
One-way ANOVA and Duncan’s pairwise co air void content, VMA, and VF for the SGC effect on all SGC properties. A Duncan’s pairwise comparison found the T85 mix was
significantly different than the T65 and T45 mixes. Results are summarized in Table 3.2.
Table 3.2 – Duncan’s Pairwise Groupings for Superpave Physical Properties of Test Mixes
Density 45 B B
A Content A
65
ir Void85
A 45 65 A
MA 85 B
V 45 A 65 A
B F
85 V 45 B 65 B 85 A
*Letters A and B designate separate groups
13
The statistical analysis above shows that the Marshall analysis method found no ing
ate in the asphalt mix, where the SGC analysis found that ere was a benefit to having 85 percent fracture over 65 percent fracture.
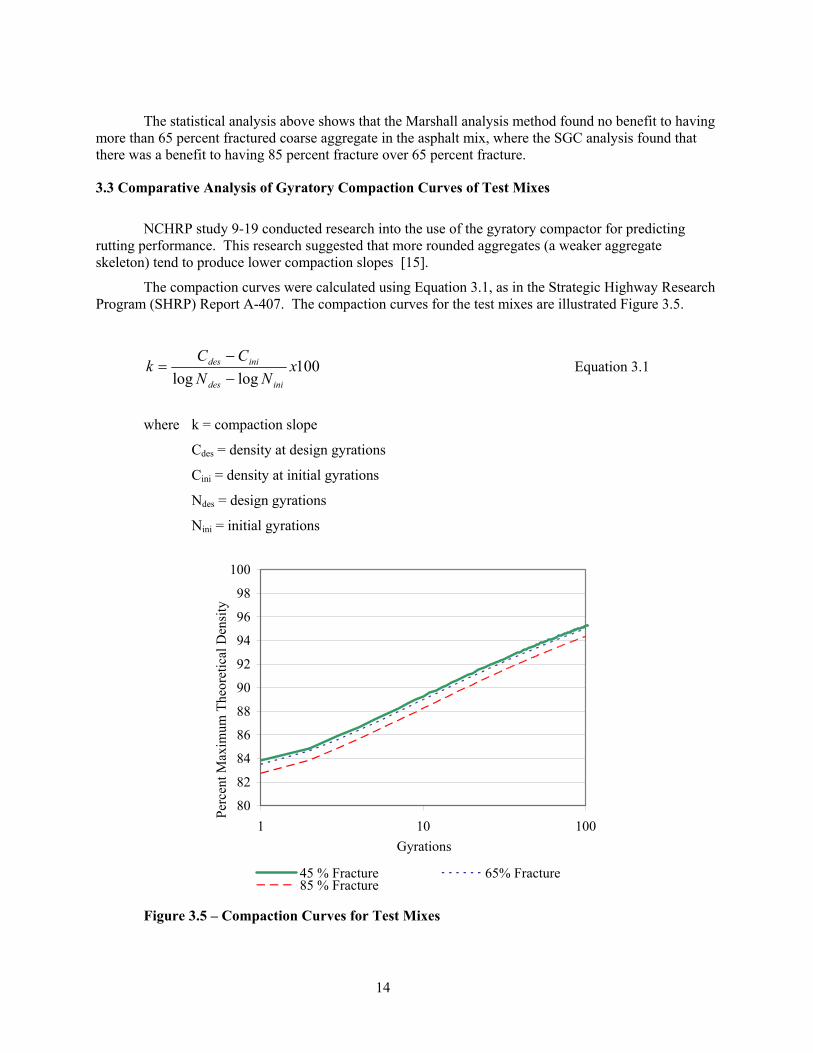
NCHRP study 9-19 conducted research into the use of the gyratory compactor for predicting weaker aggregate
skeleton) tend to produce lower compaction slopes [15].
rch .5.
benefit to havmore than 65 percent fractured coarse aggregth
3.3 Comparative Analysis of Gyratory Compaction Curves of Test Mixes
rutting performance. This research suggested that more rounded aggregates (a
The compaction curves were calculated using Equation 3.1, as in the Strategic Highway ReseaProgram (SHRP) Report A-407. The compaction curves for the test mixes are illustrated Figure 3
loglog NN inides −100x
CCk inides −= Equation 3.1
where k = compaction slope
Cdes = density at design gyrations
gyrations
Cini = density at initial
Ndes = design gyrations
Nini = initial gyrations
80
82
84
86
88
90
92
94
96
98
1 10 100Gyrations
Perc
ent M
axim
um T
heor
etic
al D
ensi
ty
45 % Fracture 65% Fracture85 % Fracture
Figure 3.5 – Compaction Curves for Test Mixes
100
14
Figure 3.6 illustrates the compaction slopes obtained for the test mixes. Figure 3.6 shows that the T45 mix had the lowest compaction slope, followed by the T65 and T85 test mixes. This corresponds with the conclusions of NCHRP 9-19, that rounded aggregates tend to produce flatter compaction slopes. However, the differences between the compaction slopes of the test mixes used in this research are not large.
15.25
15.34
15.52
15.10
15.15
15.20
15.25
15.30
15.35
15.40
15.45
15.50
15.55
T45 T65 T85
Com
pact
ion
Slop
e
Compaction Slopes of Test Mixes
Figure 3.6 –
analysis tool from the gyratory compactor would be the number
(k X AV) is considered a superior analysis tool to the compac
of
NCHRP 478 [15] stated that the preferred of gyrations at maximum stress ratio (N-SR), however, the SGC used did not have the capability
to measure stress during the compaction process.
The compaction slope and air void product tion slope by itself, as it has been shown to represent changes in the asphalt cement content, where
the compaction slope relies on the aggregate skeleton [15]. The k X AV values for the test mixes are illustrated in Figure 3.7. Asphalt content is constant across the test mixes, therefore any effect of differences in asphalt content on the k X AV is factored out and all sensitivity in k X AV is a function fracture.
15
47.3
52.2
60.5
40
45
50
55
60
65
T45 T65 T85
k x
AV
Figure 3.7 – Compaction Slope and Air Void Product (k X AV) Values for Test Mixes
4 – SUMMARY
Volumetric constituents are assumed to be important in rutting performance of asphalt concrete. If volumetric constituents stray from a range deemed to be rut resistant, component properties (fracture, for example) will not have an effect on rutting performance [18].
Volumetric analysis of the Marshall test mix samples found that the properties (density, air void content, VMA, and VF) for the T85 and T65 mixes were quite similar. The T45 mix differed marginally from the two higher fracture mixes. All volumetric values fell within the applicable DHT specification limits. Therefore, the volumetric constituents determined by the Marshall procedure would be deemed to be rut resistant.
Through the SHRP program, Superpave was developed to create “performance-based” mix designs, and with that, a trend toward characterization of actual material properties of asphalt concrete in order to predict rutting performance. New (mechanistic) asphalt mix characterization methods using basic asphalt material properties were more reliable in predicting rutting performance.
Fracture was found to affect the SGC volumetric properties of the lab mixes. Although volumetric properties were not investigated directly as a rutting predictor in this research framework, they are considered critical to the rutting performance of asphalt concrete pavements. Duncan’s pairwise comparison of the SGC samples found that the T85 mix was significantly different from the T45 and T65 test mixes.
The T45 and T65 test mixes did not pass the Superpave VMA criteria, or the targets for percent of maximum theoretical density at the initial and design gyration levels outlined in this paper, while the T85 mix approached the target density values. The SGC VMA criteria identified the T85 test mix as superior to the T45 and T65 test mixes in a lab setting.
16
SGC properties k and k X AV properties for the test mixes were compared. Both properties showed that the asphalt mix compacted less under the SGC process as the fracture increased.
Although a “field verification” site does not exist at present, the laboratory characterization of the 85 percent fracture (T85 test mix) experimental mix will be directly compared to the in-place performance of the asphalt mix on Highway 1, as the field manufactured mix and the test mix will be very similar.
SGC identified differences between the test mixes that the Marshall compaction procedure did not. SGC analysis of Saskatchewan’s Marshall mixes could be an inexpensive tool to further evaluate compactibility of asphalt mixes at the mix design phase.
LIST OF REFERENCES
1. Carlberg, M. 2002 The Effect of Coarse Aggregate Angularity on Rutting Performance of Saskatchewan Asphalt Concrete Mixes. University of Saskatchewan 2. Berthelot, C. F. 1999 Mechanistic Modeling of Saskatchewan SPS-9A Asphalt Concrete Pavements. 3. Miller, B. 2001 Annual Infrastructure Assessment Report. Saskatchewan Highways and Transportation. 4. Schmidt, Terry 2001 Special Aggregate Issues. Saskatchewan Highways and Transportation 5. Kwon, David. 2001 Industry Capacity by Contractor. Saskatchewan Highways and Transportation 6. Transportation Association of Canada. 1997 Pavement Design and Management Guide. 7. Asphalt Institute. 1996 Superpave Mix Design (SP-2). 8. Sauer, E.K. 2000 Terrain Evaluation Reference Notes. University of Saskatchewan, Civil Engineering Department. 9. Marjerison, Brent. 2001. Gravel Resource Utilization – Saskatchewan Highways and Transportation –Year 2000 and Beyond. 10. Wedding, P. A., Gaynor, R. D. 1961. The Effects of Using Crushed Gravel as the Coarse and Fine Aggregate in Dense-Graded Bituminous Mixtures. Proceedings of the Association of Asphalt Paving Technologists. pp 469-492. 11. Saskatchewan Highways and Transportation. Standard Test Procedure Manual.1999. 12. Frank, Terry.2000. Surfacing Design – Twinning of Trans-Canada Highway Control Section 1-22 A: km 20.5 to km 39.6, west of Highway No. 21 to Alberta Border. AMEC. 13. Roberts, F. L., Kandhal P.S., Brown, E.R. Lee, D. Y., Kennedy, T. W. 1996. Hot Mix Asphalt Materials, Mixture, Design and Construction 2nd Ed. NAPA Education Foundation. 14. National Cooperative Highway Research Program. www.2002designguide.com. August 5, 2002.