41
Comparison of Methods for Analyzing and Interpreting Censored Exposure Data Paul Hewett Ph.D. CIH Exposure Assessment Solutions, Inc. Gary H. Ganser Ph.D. West Virginia University

Comparison of Methods for Analyzing and Interpreting Censored Exposure Data
Paul Hewett Ph.D. CIHExposure Assessment Solutions, Inc.
Gary H. Ganser Ph.D.West Virginia University

Copyright 2005 Exposure Assessment Solutions, Inc. 2
Comparison of Methods for Analyzing and Interpreting Censored Exposure Data
I. IntroductionII. MethodsIII. ResultsIV. RecommendationsV. Research Opportunities

Copyright 2005 Exposure Assessment Solutions, Inc. 3
I. IntroductionA review of the censored data literature revealed …
poorly described methodscontradictory recommendationsconfusing articlesfew articles directed toward the IH scenario.
The purpose of this study was to …compare four standard methods and a proposed method for analyzing low to medium censored datasets.

Copyright 2005 Exposure Assessment Solutions, Inc. 4
For more information …Hewett, P. and Ganser, G.H.:
A Comparison of Several Methods for Analyzing Censored Data(submitted to AOH, April 2006)
Ganser, G.H. and Hewett, P.:An Accurate Substitution Method for Analyzing Censored Data(in preparation)

Copyright 2005 Exposure Assessment Solutions, Inc. 5
DefinitionsLeft censored
measurements occurred that were below the limit of detection (LOD)
Right censoredmeasurements occurred that were above the maximum measurable concentration
Left truncatedmeasurements less than the LOD were removed from the dataset
Right truncatedmeasurements above the maximum measurable concentration were removed from the dataset

Copyright 2005 Exposure Assessment Solutions, Inc. 6
Type of Censored DatasetSimple Censored
A dataset with a single or multiple censoring points, but all are at the low end.e.g., x = {<LOD, <LOD, x3, x4, … , xn} e.g., x = {<LOD1, <LOD2, x3, x4, … , xn}
Complex CensoredA dataset with multiple censoring points spread throughout the data.
e.g., x = {<LOD1, x2, x3, <LOD2, … xn}

Copyright 2005 Exposure Assessment Solutions, Inc. 7
Degree of Censoring
>50%High
80% to 100%Severe
20% - 50%Medium
<20%Low
Percent CensoredDegree of Censoring

Copyright 2005 Exposure Assessment Solutions, Inc. 8
Example Datasets (OEL = 100 µg/m3)
<20.3
<19.9
<9.5
<8.3
<7.2
<4.4
<3.1
<3
<3
<3
Dataset 3(µg/m3)
20.3
19.9
<9.5
8.3
<7.2
4.4
<3.1
<3
<3
<3
Dataset 2(µg/m3)
<30
<30
<30
<30
<30
<30
<30
<30
<30
<30
Dataset 4(µg/m3)
20.25
19.94
9.52
8.29
7.23
4.41
3.06
<3
<3
<3
Dataset 1*(µg/m3)
10
9
8
7
6
5
4
3
2
1
Case
* Data source: Finkelstein and Verma, 2001.

Copyright 2005 Exposure Assessment Solutions, Inc. 9
How can we analyze a simple censored dataset (i.e., Dataset 1)?
Simple substitution (LOD/2 & LOD/√2)Log-Probit Regression (LPR)Maximum Likelihood Estimation (MLE)β-Substitution (β-Sub; proposed)
There are other methods, as well as variations of the LPR and MLE methods.

Copyright 2005 Exposure Assessment Solutions, Inc. 10
β-Substitution (a proposed method)

Copyright 2005 Exposure Assessment Solutions, Inc. 11

Copyright 2005 Exposure Assessment Solutions, Inc. 12

Copyright 2005 Exposure Assessment Solutions, Inc. 13
Minimum Censored Datasets
LOD/2 and LOD/√2 Substitutionn>2 and at least 1 meas. > LOD
Log-Probit Regression (LPR)n>3 and at least 2 meas. > LOD
Maximum Likelihood Estimation (MLE)n>3 and at least 2 meas. > LOD
β-Substitutionn>3 and at least 2 meas. > LOD

Copyright 2005 Exposure Assessment Solutions, Inc. 14
Analysis of Dataset 1(n’=number of uncensored data)
25.53
26.66
28.38
23.93
26.78
X0.95
7
7
7
7
7
n’
7.74*2.735.11β-Substitution
7.78**
8.10**
7.91*
7.72*
Mean
2.775.31Log-Probit Regression
2.765.04Substitute LOD/2
2.645.17Max. Likelihood Estimation
2.425.59Substitute LOD/√2
GSDGMMethod
* Simple arithmetic mean** MVUE where n=10 for MLE and β-Sub and n=7 for LPR

Copyright 2005 Exposure Assessment Solutions, Inc. 15
Issue
In the long run, across a variety of datasets where the true GSD, true %censored, and sample size varies, which method is preferable for estimating…
GM and GSD (i.e., distribution parameters)95th percentile (i.e., a compliance statistic)Mean (useful when construction a JEM).

Copyright 2005 Exposure Assessment Solutions, Inc. 16
II. MethodsComputer simulation 1:
Generated 100,000 datasets for each combination of:GSD: 1.5, 2, 3, and 4n: 3, 5, 10, 20, 50, and 100%censored: 0%, 10%, 20%, 30%, 40%, and 50%
Calculated bias, precision, and overall accuracy for each method and the four parameters:
GM, GSD, X0.95, and Mean
Note: the root mean square error (rMSE) is used to indicate the overall accuracy

Copyright 2005 Exposure Assessment Solutions, Inc. 17
Accuracy = Bias + PrecisionWhere x = mean of results of N repeated simulationsand θ = true value.
_
rMSE =

Copyright 2005 Exposure Assessment Solutions, Inc. 18
Computer simulation 2:Generated 3 sets of 100,000 datasets where n, %censored, and the GSD were allowed to vary:n: 10 to 100%censored: 0% to 50%GSD:
1.2 – 2 (low variability)2 – 3 (medium variability)3 – 4 (high variability)
Calculated bias, precision, and overall accuracy (i.e., rMSE)

Copyright 2005 Exposure Assessment Solutions, Inc. 19
Note:Valid, censored datasets were analyzed using the selected censored data method.Valid, uncensored datasets were analyzed using standard formulae.Invalid datasets were not analyzed:
Completely censoredToo few uncensored data[An issue when n was small (<10)]

Copyright 2005 Exposure Assessment Solutions, Inc. 20
III. Results –Computer simulation 1
Notes:Use the 0 %censored curve as the baseline for comparison.32 charts were generated for each method For illustrative purposes only the results for GSD=2 and %censored=50% are shown.Different methods were used to calculate the mean:
MVUE equation for the MLE and LPR methodsArithmetic mean for the substitution methods

Copyright 2005 Exposure Assessment Solutions, Inc. 21
GM Bias(GSD=2 and %censored=50%)(Legend: X 0%, # MLE, Q LPR, LOD/2, LOD/√2, ! β-Sub)

Copyright 2005 Exposure Assessment Solutions, Inc. 22
Possible Outcomes
↑ ↓ ↓↓ ↑ ↓↓ ↓ ↑
m=2
↑ ↑ ↑↓ ↑ ↑↑ ↓ ↑↑ ↑ ↓
↓ ↓ ↓
m=0(uncensored)
m=1m=3(completely censored)
n = 3, true %censored = 50%m = (number of measurements < LOD)

Copyright 2005 Exposure Assessment Solutions, Inc. 23
GSD Bias(GSD=2 and %censored=50%)(Legend: X 0%, # MLE, Q LPR, LOD/2, LOD/√2, ! β-Sub)

Copyright 2005 Exposure Assessment Solutions, Inc. 24
X0.95 Bias(GSD=2 and %censored=50%)(Legend: X 0%, # MLE, Q LPR, LOD/2, LOD/√2, ! β-Sub)

Copyright 2005 Exposure Assessment Solutions, Inc. 25
Mean(GSD=2 and %censored=50%)(Legend: X 0%, # MLE, Q LPR, LOD/2, LOD/√2, ! β-Sub)
Copyright 2005 Exposure Assessment Solutions, Inc. 26
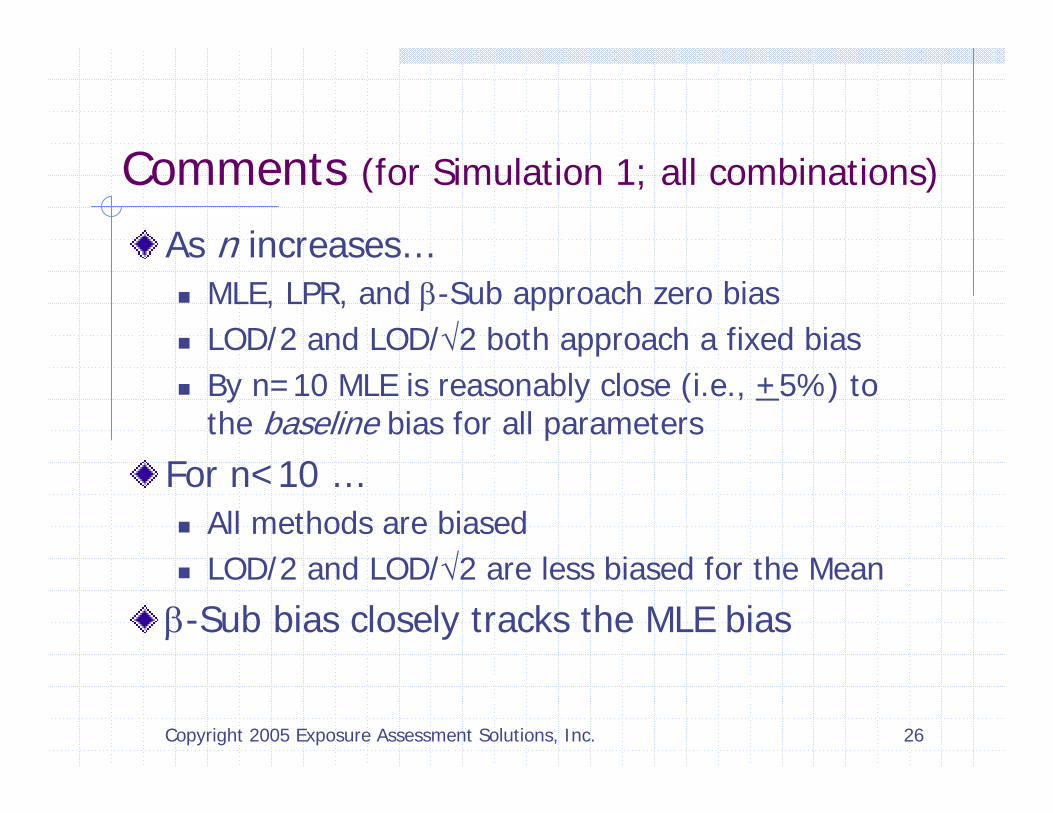
Comments (for Simulation 1; all combinations)
As n increases…MLE, LPR, and β-Sub approach zero biasLOD/2 and LOD/√2 both approach a fixed biasBy n=10 MLE is reasonably close (i.e., +5%) to the baseline bias for all parameters
For n<10 …All methods are biasedLOD/2 and LOD/√2 are less biased for the Mean
β-Sub bias closely tracks the MLE bias

Copyright 2005 Exposure Assessment Solutions, Inc. 27
Results –Computer simulation 2

Copyright 2005 Exposure Assessment Solutions, Inc. 28
GM Bias(Composite datasets) (Legend: X 0%, # MLE, Q LPR, LOD/2, LOD/√2, ! β-Sub)

Copyright 2005 Exposure Assessment Solutions, Inc. 29
GSD Bias(Composite datasets) (Legend: X 0%, # MLE, Q LPR, LOD/2, LOD/√2, ! β-Sub)

Copyright 2005 Exposure Assessment Solutions, Inc. 30
X0.95 Bias(Composite datasets) (Legend: X 0%, # MLE, Q LPR, LOD/2, LOD/√2, ! β-Sub)

Copyright 2005 Exposure Assessment Solutions, Inc. 31
Mean Bias(Composite datasets) (Legend: X 0%, # MLE, Q LPR, LOD/2, LOD/√2, ! β-Sub)
Copyright 2005 Exposure Assessment Solutions, Inc. 32
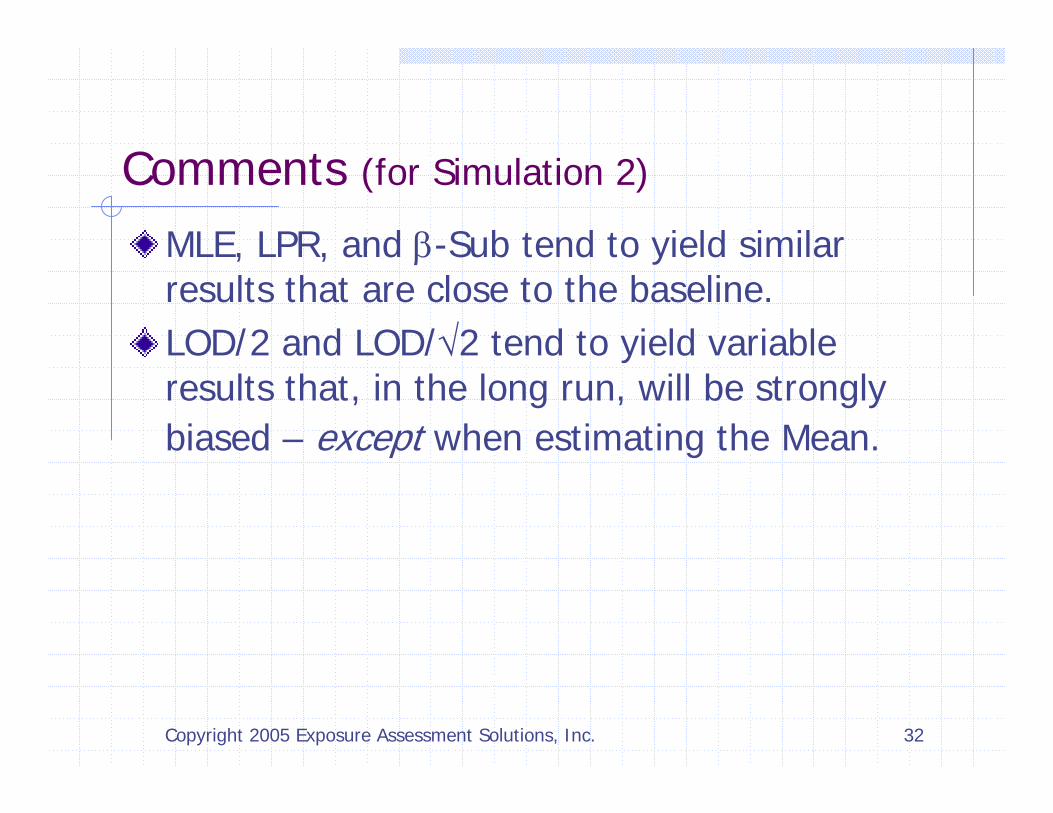
Comments (for Simulation 2)
MLE, LPR, and β-Sub tend to yield similar results that are close to the baseline.LOD/2 and LOD/√2 tend to yield variable results that, in the long run, will be strongly biased – except when estimating the Mean.
Copyright 2005 Exposure Assessment Solutions, Inc. 33
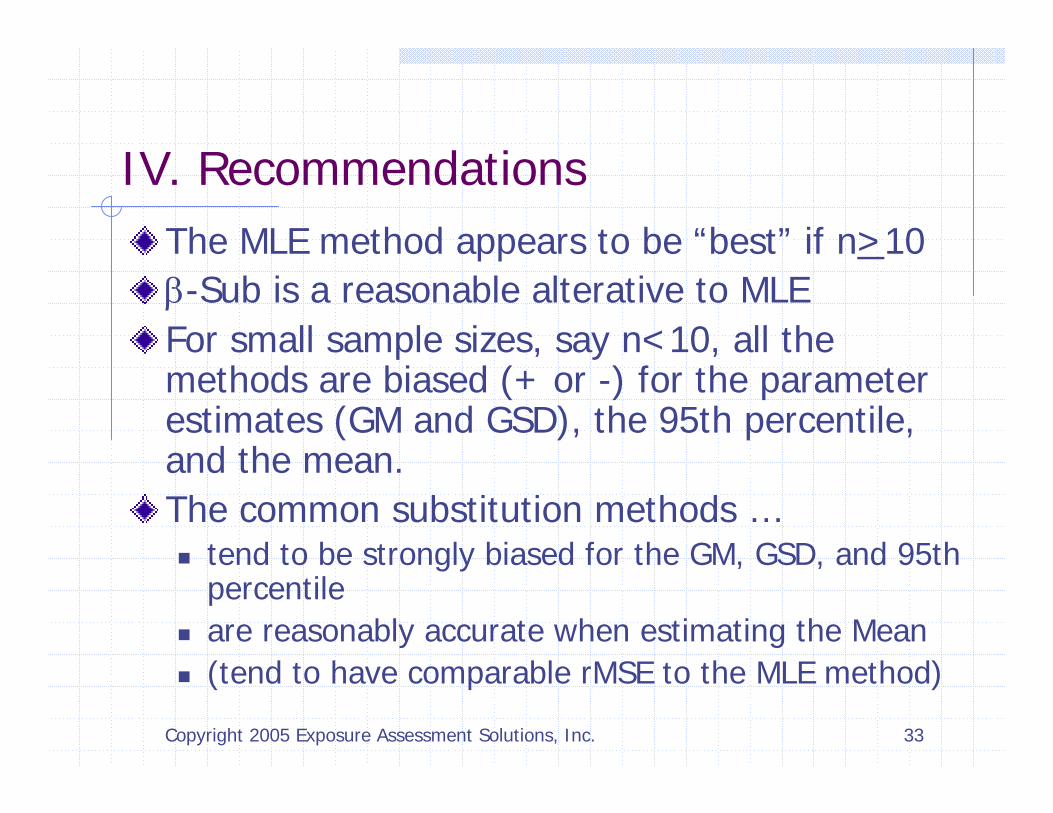
IV. RecommendationsThe MLE method appears to be “best” if n>10β-Sub is a reasonable alterative to MLEFor small sample sizes, say n<10, all the methods are biased (+ or -) for the parameter estimates (GM and GSD), the 95th percentile, and the mean.The common substitution methods …
tend to be strongly biased for the GM, GSD, and 95th percentile are reasonably accurate when estimating the Mean(tend to have comparable rMSE to the MLE method)

Copyright 2005 Exposure Assessment Solutions, Inc. 34
Caution should exercised when making important decisions based upon a highly censored and limited dataset.
Be aware of the direction and magnitude of the potential bias.
Eliminate or reduce the need for Censored Data Analysis by reducing the LOD.
All of the above assumes that the appropriate model for occupational exposure data is the lognormal distribution.
Copyright 2005 Exposure Assessment Solutions, Inc. 35
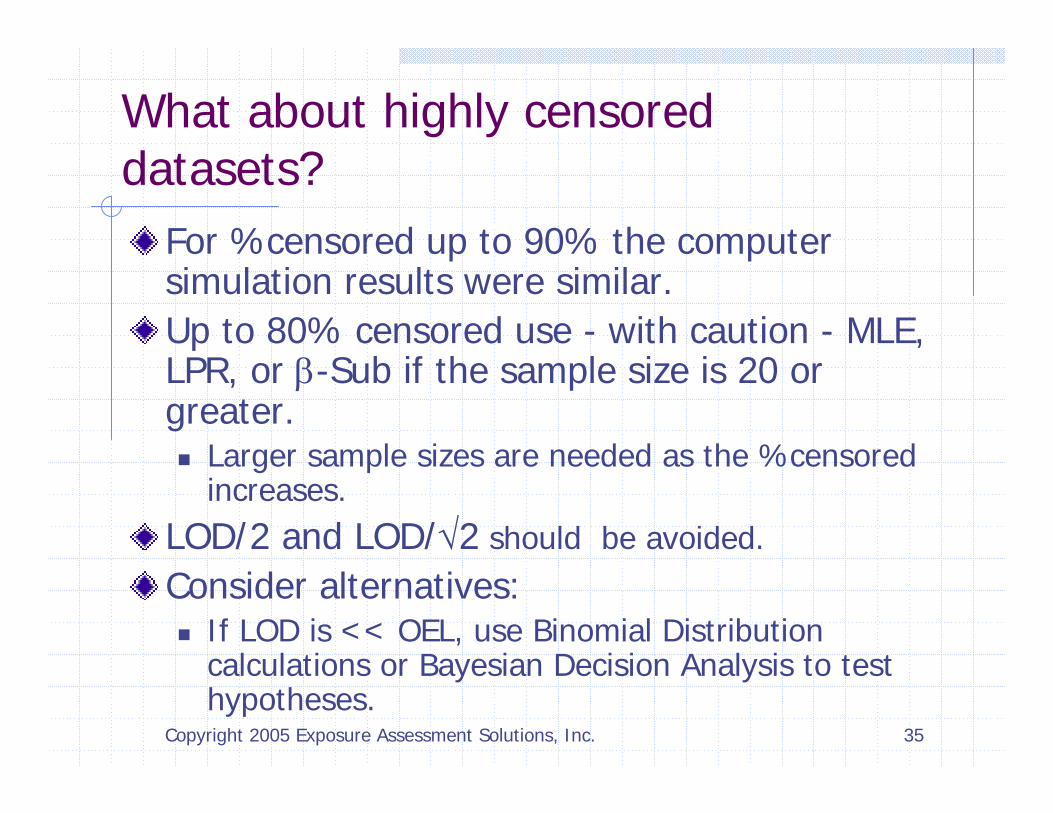
What about highly censored datasets?
For %censored up to 90% the computer simulation results were similar.Up to 80% censored use - with caution - MLE, LPR, or β-Sub if the sample size is 20 or greater.
Larger sample sizes are needed as the %censored increases.
LOD/2 and LOD/√2 should be avoided.
Consider alternatives:If LOD is << OEL, use Binomial Distribution calculations or Bayesian Decision Analysis to test hypotheses.

Copyright 2005 Exposure Assessment Solutions, Inc. 36
What about severely censored datasets?
Parameter estimation is not recommended or simply not possible.If LOD is << OEL, …
use Binomial Distribution calculations or Bayesian Decision Analysis to test hypotheses.

Copyright 2005 Exposure Assessment Solutions, Inc. 37
There are other CDA methods“Robust” variations
robust LPR and robust MLEsee Helsel (2005)
Non-parametric statistics and methodsNon-parametric percentiles and exceedance fractionsKaplan-Meier Method
Based upon “survival statistics”See Helsel (2005)
Decision makingTest hypotheses using non-parametric methods or Bayesian Decision Analysis

Copyright 2005 Exposure Assessment Solutions, Inc. 38
V. Research OpportunitiesCalculation of confidence limits
For each method, what sample size should be used to calculate confidence intervals, or should the confidence interval coefficient be adjusted?
Analysis of complex censored datasetsShould the MLE method always be preferred, even for a highly complex censored dataset?
Analysis of non-lognormal datasetsWhich is preferred when the data are not well described by a single lognormal distribution?How robust are the so-called robust methods?

Copyright 2005 Exposure Assessment Solutions, Inc. 39
Contact Information
Paul Hewett PhD CIHExposure Assessment Solutions, [email protected]

Copyright 2005 Exposure Assessment Solutions, Inc. 40
AbstractExposure datasets often occur where one or more measurements are below the limit of detection (LOD). The purpose of this study was to test various standard censored data analysis methods when applied to low (i.e., <20% censored) and medium (20%-50%) censored datasets, and compare these results to those for beta-substitution, a newly developed substitution technique.Using computer simulation, the bias and root mean square error (rMSE) for the two commonly used substitution methods (i.e., LOD/2 and LOD/sqrt(2)), beta-substitution, log-probit regression (LPR), and maximum likelihood estimation (MLE) were determined for the scenario where there is a single LOD. The parameters estimated in the computer simulation were the distribution parameters (i.e., geometric mean and geometric standard deviation), the 95th percentile, and the mean.

Copyright 2005 Exposure Assessment Solutions, Inc. 41
The MLE method has substantial bias for small n, but for the larger sample sizes is nearly unbiased. The bias for the common substitution methods can be positive or negative, depending upon the sample size, fraction censored, and geometric standard deviation. LPR is substantially biased for small sample sizes. The bias and rMSE for the beta-substitution method is nearly identical to that of the MLE method for all combinations of sample size, fraction censored, and GSD considered.The sample estimates for the parameters selected tend to be substantially biased for n<10, so it is important to understand the direction and magnitude of the potential bias for each method. The common substitution methods are biased for all sample sizes and should be used with caution. LPR could be used whenever n>=20, but is clearly not suitable for small n unless only the mean is of interest. MLE is preferred above allothers, but the beta-substitution method, which is easier to calculate, is nearly equal to the MLE method in terms of both bias and rMSE.


