Comparison of MISR aerosol optical thickness with AERONETmeasurements in Beijing metropolitan area
Xin Jiang a,⁎, Yang Liu b, Bin Yu c, Ming Jiang a
a LMAM, School of Mathematical Sciences, Peking University, Beijing 100871, Chinab Harvard School of Public Health, Boston, MA 02215, U.S.
c Department of Statistics, University of California, Berkeley, CA 94720–3860, U.S.
Received 28 February 2006; received in revised form 7 June 2006; accepted 10 June 2006
Abstract
Aerosol optical thickness (AOT) data retrieved by the Multi-angle Imaging SpectroRadiometer (MISR) from 2002 to 2004 were compared withAOT measurements from an Aerosol Robotic Network (AERONET) site located in Beijing urban area. AERONETAOT data were first averagedwithin a two-hour time window andMISR data were collected using AOTs of the central regions covering the AERONETsite and the average AOTsof the surrounding 3×3 regions. MISR and AERONETAOTs are highly correlated, with an overall linear correlation coefficient of 0.93 at 558 nmwavelength. On average, MISR AOT at 558 nm is 29% lower than the AERONETAOT at 558 nm interpolated from 440 nm and 675 nm. A linearregression analysis usingMISRAOTas the response yields a slope of 0.58 ± 0.03 and an intercept of 0.07 ± 0.02 in the green bandwith similar resultsin the other three bands, indicating that MISRmay underestimate AERONETAOT. After applying a narrower averaging time window to AERONETdata and controlling their temporal variabilities, the agreement between MISR and AERONETAOTs is significantly improved with the correlationcoefficient of 0.97 and a slope of 0.71 ± 0.03 in an ordinary linear least squares fit. Aweighted linear least squares, which reduces the impact of spatialaveraging, yields a better result with the slope going up to 0.73 ± 0.03. When only the central region MISR AOTs are included in the regressionanalysis, the best agreement is achieved with a slope of 0.91 ± 0.03 and an intercept of 0.00 ± 0.01, andMISRAOT is only 9% lower than AERONETAOT on average. By investigating PM10 spatial distribution of Beijing, we found substantial spatial variations of aerosol loading with higher PM10
Keywords: MISR; Aerosol optical thickness; AOT; AERONET; PM10; Correlation; Ordinary least squares; Weighted least squares
1. Introduction
Atmospheric aerosols affect our environment from globalto regional to local scale. On global and regional scales, theirimpacts on Earth radiation budget and cloud microphysics areconsidered a major uncertainty in climate change. Ground levelaerosols, also known as particulate matter (PM), have beenassociated with multiple adverse health effects (Pope et al.,1995). Many countries in the world have designated PM as acriteria air pollutant. Therefore, long term PM monitoring has
been of importance, especially for those heavily pollutedlocations.
The Multi-angle Imaging SpectroRadiometer (MISR),aboard the NASA's Earth Observing System (EOS) Terrasatellite, provides global information on tropospheric aerosolproperties. Viewing the sunlit Earth almost simultaneously atnine angles along its track, MISR obtains 4-spectral (446, 558,672 and 866 nm) imagery at 1.1 km spatial resolution in thenon-red bands and 275 m resolution in the red band. It has aperiodic coverage between two and nine days depending on thelatitude (Diner et al., 1998; Martonchik et al., 2002). MISR'sunique combination of multiple bands and angles enables it toretrieve aerosol optical thickness (AOT) and additional particle
46 X. Jiang et al. / Remote Sensing of Environment 107 (2007) 45–53
properties at a resolution of 17.6 km over both land and ocean,with no assumption about the absolute land surface reflectanceor its spectral characteristics in the aerosol retrieval algorithm(Martonchik et al., 2002, 1998).
Generally, MISR AOT retrieval is validated by comparingwith ground-based sun photometer measurements. The AerosolRobotic Network (AERONET) is a worldwide network of auto-matic sun photometers and data archive, providing spectral aero-sol optical thickness as well as aerosol microphysical properties(Holben et al., 1998). Due to their relatively high accuracy (AOTuncertainty b ±0.01 at wavelengths N 440 nm), AERONET datahave beenwidely used as a standard for validating satellite aerosolretrievals (Dubovik et al., 2000; Holben et al., 1998).
Early MISR AOT data (prior to version 15) have beenvalidated under various scenarios. Diner et al. (2001) for the firsttime compared the MISR AOT with AERONET over southernAfrica from the August to September 2000, showing that MISRAOTcompare favorably with AERONETwith a positive bias of0.02 and an overestimation of 10%. Liu et al. (2004b) conducteda validation based on 16 AERONETsites over the United States,and found a good agreement between the MISR and AERONETAOTs after two outliers were excluded (linear regressionanalysis using MISR AOT as the response variable yielded anR2 of 0.80, a slope of 0.88 and an intercept of 0.04). Goodagreement was also obtained in the desert regions, where thesurface reflectance is high (Christopher and Wang, 2004;Martonchik et al., 2004). In Abdou et al. (2005), AOT retrievedby both the Moderate Resolution Imaging SpectroRadiometer(MODIS) and MISR were both compared with AERONET toexplore the similarities and differences between them, and resultshowed MISR has a lower bias than MODIS over land(regression result: MISR=0.83×AERONET+0.03, r=0.86).Kahn et al. (2005) conducted a comprehensive global validationof MISR AOT using two years of MISR and AERONET AOTdata, stratified by season and expected aerosol type. Detailedanalyses were made on the likely causes for the trends andoutliers to improve the MISR aerosol retrieval algorithm. Itshould be noted that validation of the MISR aerosol product isstill underway, and the retrieval algorithm is still being refined.
Although Kahn et al. (2005) covered three polluted urbansites, i.e., Mexico City, Kanpur in northern India, and Shirahamain southern Japan, the AOT values at these sites are substantiallylower than those found in Beijing as shown in the currentanalysis. Beijing is one of the largest metropolitan areas in theworld. Studies have demonstrated that the aerosol loading isextremely high in the urban areas of Beijing (Eck et al., 2005).Traditionally, the major particle emission sources consist ofindustrial emissions, coal burning for winter heating and powersupply, and long-range transported dust. In recent years, trafficemission has become a major contributor to the severe airpollution in Beijing, making the particle composition morecomplex and variable (He et al., 2001; Sun et al., 2004). Thisstudy is to assess MISR AOT quality in Beijing using infor-mation from AERONET, and analyze the likely causes of theMISR–AERONET discrepancies. In addition, because of therapid economic growth and urbanization, air pollution has be-come a serious problem for Beijing. Several pollution-control
measures have been deployed since 1990 s, such as natural gassubstitution to coal and use of low-sulfur coal. However,inhalable particles (PM10, particles smaller than 10 μm inaerodynamic diameter) pollution is still at a level higher than theChinese national ambient air quality standard. It has beendemonstrated that satellite remote sensing aerosol products, suchas MISR AOT, combined with the surface monitoring networks,can provide a cost-effective way to monitor and forecast airquality (Chu et al., 2003; Liu et al., 2004a, 2005). Therefore, it isalso a motivation of this study to explore the application ofsatellite remote sensing in monitoring pollution in China.
The rest of the paper is organized as follows. In Section 2, wedescribe the data used in the current study. In Section 3, we firstsummarize the matched MISR and AERONET AOT data, andthen we use various statistical tools to study the impacts of theaveraging time window of AERONET AOT and the spatialaveraging of MISR AOTon the agreement between AERONETand MISR AOT values. In addition to the analysis of MISR andAERONETAOT data, we also examine the spatial variability ofground-level PM mass concentrations as an indicator of theparticle loading in the air column. The final section summarizesthe results and draws the conclusions.
2. Data
We downloaded the AERONET level 2 (quality assured) dataof the AERONET Beijing site from April 2002 to October 2004from the AERONET data archive (http://aeronet.gsfc.nasa.gov).This site is at the Institute of Atmospheric Physics (IAP),Chinese Academy of Sciences, which is located in denselypopulated urban area of Beijing. A sun photometer (CimelElectronique, France) at this site was installed on the roof of theIAP building (39.98°N, 116.38°E, and 30 m above the ground,shown in Fig. 1). Data provided by AERONET include AOTvalues recorded every 15 min in seven spectral bands (340, 380,440, 500, 670, 870 and 1020 nm), Angstrom exponents, singlescattering albedos and sampling dates and times. AERONETAOT at 440 nm and 670 nm were interpolated to 558 nm usingAngstrom exponent (α440–670 nm) provided by AERONET inorder to compare with MISR AOT value at green band.
TheMISR level 2 aerosol data (version 15) were downloadedfrom the NASALangley Research Center Atmospheric SciencesData Center (http://eosweb.larc.nasa.gov/PRODOCS/misr/table_misr.html). In this analysis, we used data covering thesame period and geographic location as the AERONET Beijingsite. The MISR AOT parameter used in this study is the regionalmean AOT (MISR parameter name: RegMeanSpectralOpt-Depth), which is computed as the unweighted mean of opticalthicknesses of all successful aerosol models in the retrievalalgorithm (Jet Propulsion Laboratory (JPL), 2004). This is therecommended parameter by the MISR team among the AOTparameters (best fit AOT, regional mean AOT and weightedregional mean AOT) (Abdou et al., 2005). It was shown that thethree MISR AOT parameters in early versions of MISR datawere highly comparable (Liu et al., 2004b). Regional meansingle scattering albedo (MISR parameter name: RegMeanSpec-tralSSA) were also extracted.
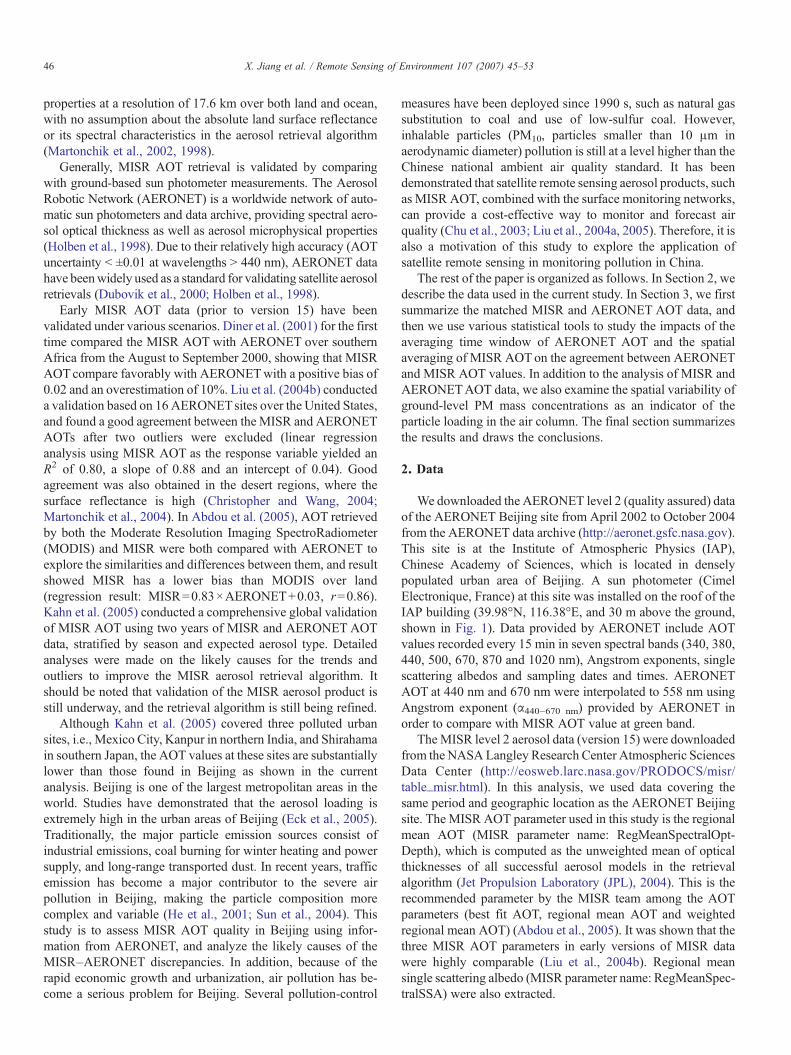
Fig. 1. The map of Beijing and locations of AERONETsite (blue triangle) and API/PM10 monitoring sites (red dots). The API sites are numbered as follow: (1) Qianmen,(2) Dongsi, (3) Tiantan, (4) Olympic Center, (5) Nongzhanguan, (6) Chegongzhuang, (7) Gucheng, (8) Dingling, (9) Guanyuan, (10) Wanshougong, (11) Yuquanlu,(12) Fengtaizhen, (13) Yungang, (14) Longquanzhen, (15) Liangxiangzhen, (16) Tongzhouzhen, (17) Renhezhen, (18) Huangcunzhen, (19) Changpingzhen,(20) Pingguzhen, (21) Huairouzhen, (22) Miyunzhen, (23) Yanqingzhen and (24) Yizhuang. The solid gray lines represent the major roads of Beijing.
47X. Jiang et al. / Remote Sensing of Environment 107 (2007) 45–53
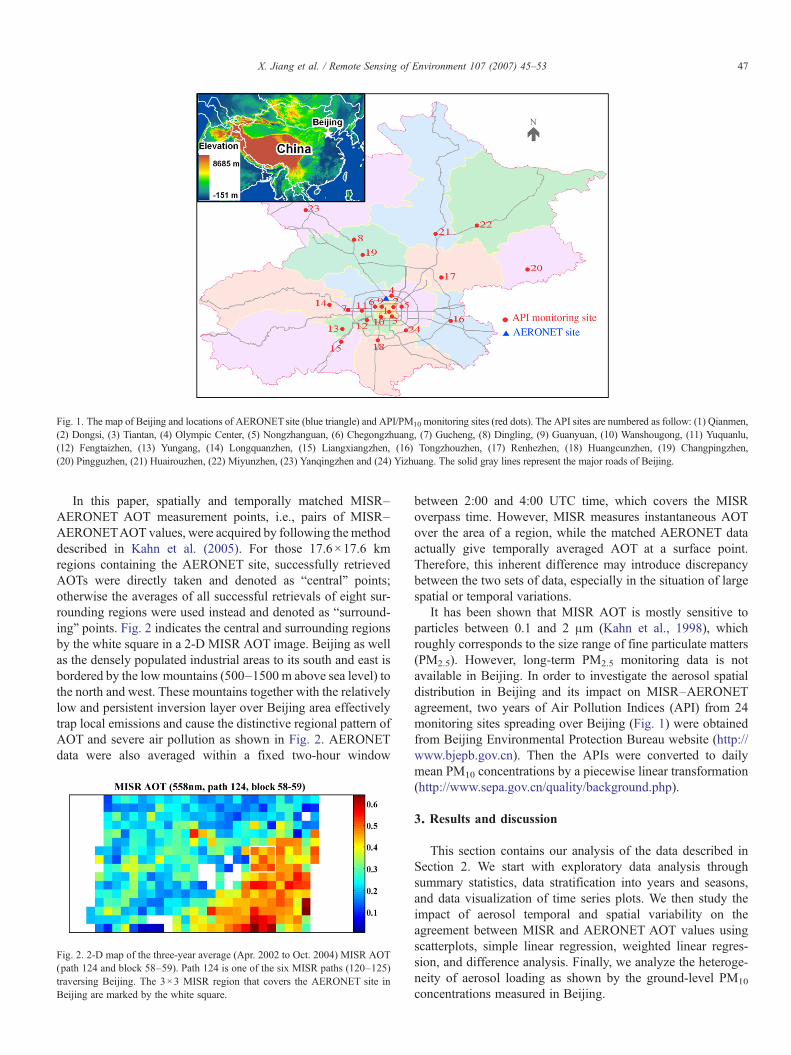
In this paper, spatially and temporally matched MISR–AERONET AOT measurement points, i.e., pairs of MISR–AERONETAOT values, were acquired by following the methoddescribed in Kahn et al. (2005). For those 17.6×17.6 kmregions containing the AERONET site, successfully retrievedAOTs were directly taken and denoted as “central” points;otherwise the averages of all successful retrievals of eight sur-rounding regions were used instead and denoted as “surround-ing” points. Fig. 2 indicates the central and surrounding regionsby the white square in a 2-D MISR AOT image. Beijing as wellas the densely populated industrial areas to its south and east isbordered by the low mountains (500–1500 m above sea level) tothe north and west. These mountains together with the relativelylow and persistent inversion layer over Beijing area effectivelytrap local emissions and cause the distinctive regional pattern ofAOT and severe air pollution as shown in Fig. 2. AERONETdata were also averaged within a fixed two-hour window
Fig. 2. 2-D map of the three-year average (Apr. 2002 to Oct. 2004) MISR AOT(path 124 and block 58–59). Path 124 is one of the six MISR paths (120–125)traversing Beijing. The 3×3 MISR region that covers the AERONET site inBeijing are marked by the white square.
between 2:00 and 4:00 UTC time, which covers the MISRoverpass time. However, MISR measures instantaneous AOTover the area of a region, while the matched AERONET dataactually give temporally averaged AOT at a surface point.Therefore, this inherent difference may introduce discrepancybetween the two sets of data, especially in the situation of largespatial or temporal variations.
It has been shown that MISR AOT is mostly sensitive toparticles between 0.1 and 2 μm (Kahn et al., 1998), whichroughly corresponds to the size range of fine particulate matters(PM2.5). However, long-term PM2.5 monitoring data is notavailable in Beijing. In order to investigate the aerosol spatialdistribution in Beijing and its impact on MISR–AERONETagreement, two years of Air Pollution Indices (API) from 24monitoring sites spreading over Beijing (Fig. 1) were obtainedfrom Beijing Environmental Protection Bureau website (http://www.bjepb.gov.cn). Then the APIs were converted to dailymean PM10 concentrations by a piecewise linear transformation(http://www.sepa.gov.cn/quality/background.php).
3. Results and discussion
This section contains our analysis of the data described inSection 2. We start with exploratory data analysis throughsummary statistics, data stratification into years and seasons,and data visualization of time series plots. We then study theimpact of aerosol temporal and spatial variability on theagreement between MISR and AERONET AOT values usingscatterplots, simple linear regression, weighted linear regres-sion, and difference analysis. Finally, we analyze the heteroge-neity of aerosol loading as shown by the ground-level PM10
48 X. Jiang et al. / Remote Sensing of Environment 107 (2007) 45–53
3.1. Summary statistics
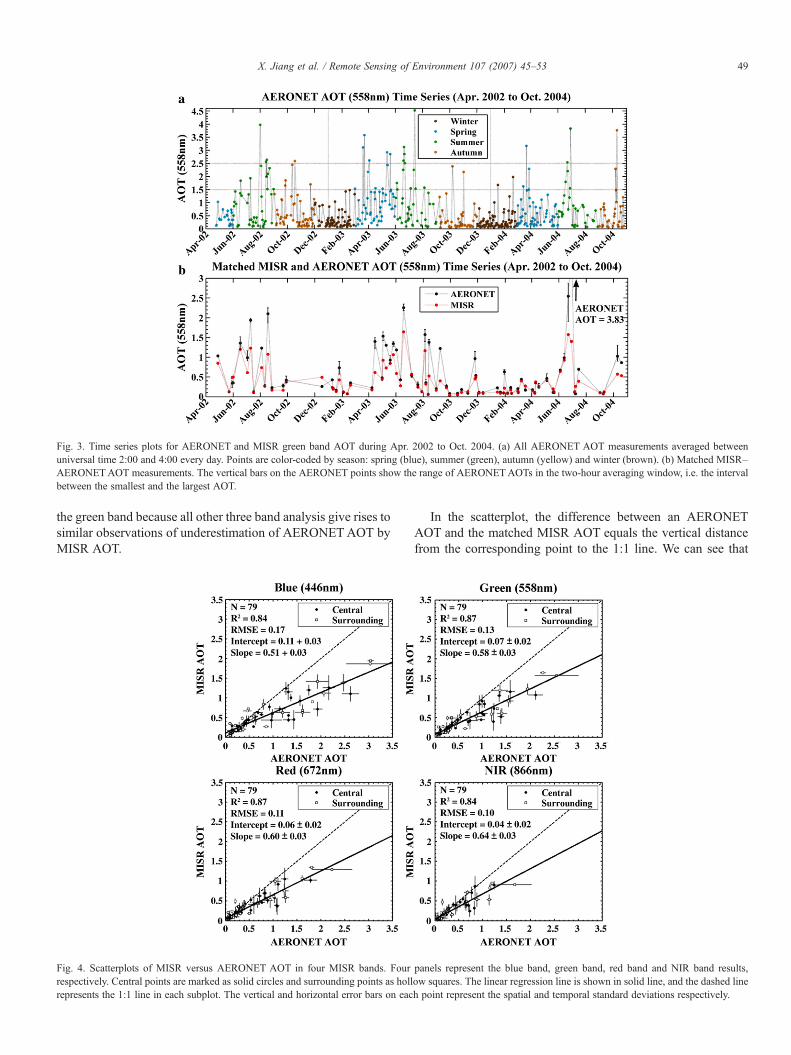
A total of 80 matched MISR–AERONETAOTmeasurementpoints were obtained, including 48 central points and 32 sur-rounding points. One potential outlier, where the AERONETAOT value at 558 nm equaled 3.83, was eliminated from thefollowing analysis, because the current MISR aerosol retrievalalgorithm discards all AOT values greater than 3.0. Summarystatistics for overall and stratified matched MISR and AERO-NET green band AOT values are presented in Table 1. Onaverage, both AERONET and MISR AOT are at least twice aslarge as those found in previous MISR validation analyses(Diner et al., 2001; Kahn et al., 2005; Liu et al., 2004b). Over all,the correlation between MISR and AERONET AOT is verystrong (Pearson's linear correlation coefficient r=0.93), but onaverage MISR is approximately 29% lower (This relative dif-ference is computed as (mean(AERONET) −mean(MISR)) /mean(AERONET)). Approximately 56% of the MISR AOTvalues fall within the expected uncertainty envelope: 0.05 or20%×AERONET AOT, whichever is larger (theoretically de-rived AOT uncertainties over calm ocean) (Kahn et al., 2001).
The percentage of MISR AOT falling in the expecteduncertainty range increases over the years probably due to theoverall decreasing trend in matched AOT values. It should benoted that Fig. 3a indicates that AERONETAOT level is aboutthe same as in the calendar years 2002 and 2003 (annul averageAOT=0.66), while slightly lower in 2004 (annul averageAOT=0.55). Thus, the decreasing trend observed in the
Table 1Summary statistics of MISR and AERONET AOT at 558 nm
Year/season(samplesize) a
AERONETmean±std b
MISRmean±std
Regressionslope;intercept c
Correlationcoefficient
MISR AOTwithinexpecteduncertainty d, %
Total(79) e
0.55±0.58 0.39±0.36 0.58; 0.07 0.93⁎ 56
2002(15)
0.74±0.64 0.56±0.37 0.53; 0.17 0.92⁎ 40
2003(35)
0.61±0.57 0.40±0.36 0.59; 0.04 0.92⁎ 57
2004(29)
0.39±0.50 0.30±0.31 0.60; 0.07 0.95⁎ 62
Winter(18)
0.23±0.18 0.18±0.12 0.44; 0.07 0.70⁎⁎ 61
Spring(21)
0.54±0.48 0.44±0.29 0.55; 0.14 0.91⁎ 57
Summer(26)
0.84±0.74 0.58±0.47 0.59; 0.08 0.95⁎ 50
Autumn(14)
0.44±0.39 0.27±0.19 0.42; 0.08 0.87⁎ 57
a Winter is December through February, spring is March through May,summer is June through August, and fall is September through November.b Std refers to arithmetic standard deviation.c Linear regression analysis: MISR AOT is the response variable, and
AERONET AOT is the explanatory variable.d MISR uncertainty envelope: the maximum of ±0.05 or 20%×AOT of
AERONET.e One potential outlier is excluded.⁎ Significant at the α=0.01 level.⁎⁎ p-value=0.013.
matched AOT values is probably because some episodes ofhigh aerosol loadings observed by AERONET were notcaptured by the matched measurements.
A strong seasonal pattern is clearly shown in thematchedAOTdata with higher AOT values in the spring and summer and lowerAOTvalues in the autumn andwinter (Fig. 3b). There are frequentoccasions in the spring and summer when AOT values are greaterthan 1.5. The MISR AOT closely follows the temporal variationof AERONET AOT although it is often lower than AERONETmeasurements at very high AOT values. Summer has the highestAOT level among four seasons, primarily because of the in-creased secondary particle generation due to strong solar radi-ation, lowwind speed and high relative humidity (Li, 2002). Sandstorms are an important contributor to the high AOT levels inspringtime. Correlation between AERONET and MISR AOT isvery strong in the summer (r=0.95), spring (r=0.91) and autumn(r=0.87). Regression results show MISR AOT compares worsewith AERONET AOT in the winter (r=0.70, regressionslope=0.44), it is possibly because winter heating substantiallyincrease coal-burning emissions in entire northern China includ-ing Beijing, resulting in more light-absorbing particles (blackcarbon) in the air. An investigation of the single scattering albedo(SSA) fromAERONET data shows that particles commonly haveSSA values around 0.88 at 672 nm in the winter, whereas theaveraged MISR SSA during the same period is 0.97. A statisticalhypothesis testing confirms that the mean of AERONET issignificantly lower than that of MISR. This indicates that thecurrent MISR retrieval algorithm might lack appropriate aerosolmodels with sufficiently low single scattering albedos tocharacterize this type of polluted air observed in Beijing.
3.2. Linear regression and differences analysis
The summary statistics and time series plots show a consistentunderestimation of AOT by MISR when compared withAERONET, especially at high AOT values. It might be causedby the lack of appropriate aerosol models in the MISR aerosolretrieval algorithm, or by other factors such as the temporal andspatial variabilities of aerosols. Next we use various statisticaltools to study these possible causes of this underestimation.
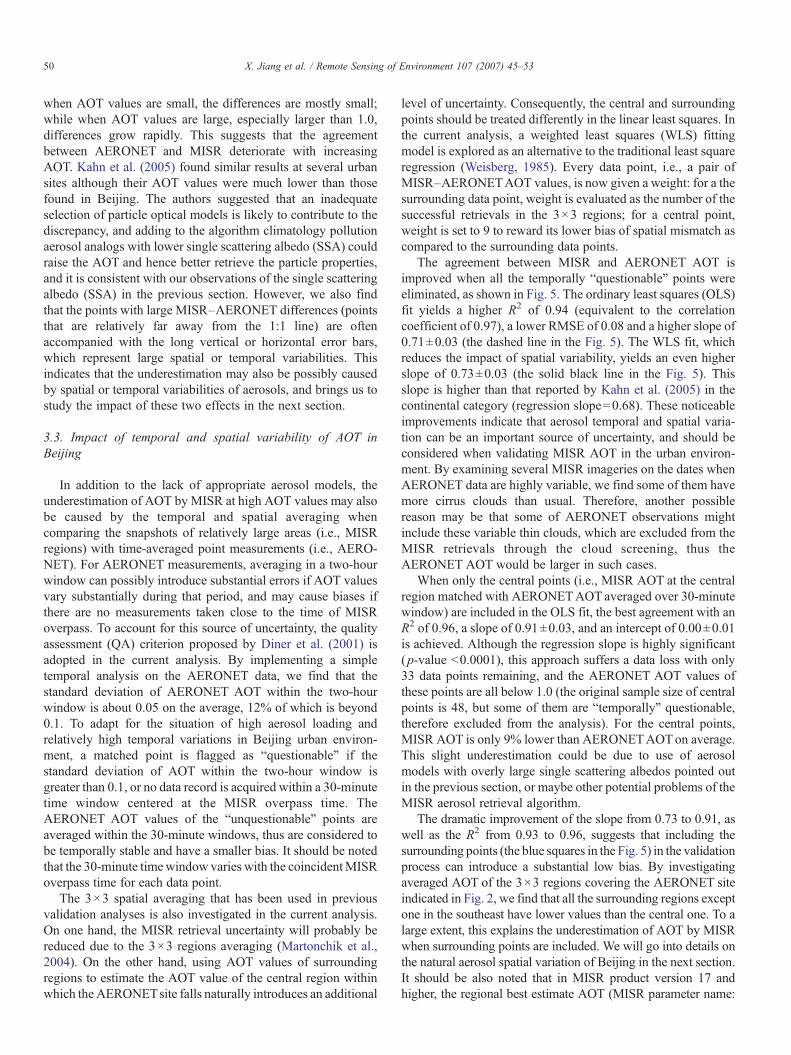
The scatterplots of MISR versus AERONETAOTs in all fourMISR bands are shown in Fig. 4. The dashed lines represent the1:1 line and the MISR expected uncertainty envelope, while thevertical and horizontal error bars on each point represent thespatial and temporal standard deviations due to spatial andtemporal averaging. Regressing MISR AOTagainst AERONETAOT yields an R2 of 0.87 and an RMSE of 0.13 in MISR greenband. The regression slope of 0.58±0.03 as well as the interceptof 0.07±0.02 indicates that MISR substantially underestimatesthe AERONET AOT. Overall, the four bands show similartrends, with R2 ranging from 0.84 to 0.87. Regression slopesincrease slightly with wavelengths (slope=0.51, 0.58, 0.60, 0.64in four MISR bands), but they are still significantly lower thanthose reported in previous MISR–AERONETcomparisons. It isunlikely that interpolation of AERONETAOT values at 440 and670 nm introduced substantial errors into the AERONET558 nm AOT values. From now on, our analysis focuses on
Fig. 3. Time series plots for AERONET and MISR green band AOT during Apr. 2002 to Oct. 2004. (a) All AERONET AOT measurements averaged betweenuniversal time 2:00 and 4:00 every day. Points are color-coded by season: spring (blue), summer (green), autumn (yellow) and winter (brown). (b) Matched MISR–AERONETAOT measurements. The vertical bars on the AERONET points show the range of AERONETAOTs in the two-hour averaging window, i.e. the intervalbetween the smallest and the largest AOT.
49X. Jiang et al. / Remote Sensing of Environment 107 (2007) 45–53
the green band because all other three band analysis give rises tosimilar observations of underestimation of AERONETAOT byMISR AOT.
Fig. 4. Scatterplots of MISR versus AERONET AOT in four MISR bands. Fourrespectively. Central points are marked as solid circles and surrounding points as hollrepresents the 1:1 line in each subplot. The vertical and horizontal error bars on eac
In the scatterplot, the difference between an AERONETAOT and the matched MISR AOT equals the vertical distancefrom the corresponding point to the 1:1 line. We can see that
panels represent the blue band, green band, red band and NIR band results,ow squares. The linear regression line is shown in solid line, and the dashed lineh point represent the spatial and temporal standard deviations respectively.
50 X. Jiang et al. / Remote Sensing of Environment 107 (2007) 45–53
when AOT values are small, the differences are mostly small;while when AOT values are large, especially larger than 1.0,differences grow rapidly. This suggests that the agreementbetween AERONET and MISR deteriorate with increasingAOT. Kahn et al. (2005) found similar results at several urbansites although their AOT values were much lower than thosefound in Beijing. The authors suggested that an inadequateselection of particle optical models is likely to contribute to thediscrepancy, and adding to the algorithm climatology pollutionaerosol analogs with lower single scattering albedo (SSA) couldraise the AOT and hence better retrieve the particle properties,and it is consistent with our observations of the single scatteringalbedo (SSA) in the previous section. However, we also findthat the points with large MISR–AERONET differences (pointsthat are relatively far away from the 1:1 line) are oftenaccompanied with the long vertical or horizontal error bars,which represent large spatial or temporal variabilities. Thisindicates that the underestimation may also be possibly causedby spatial or temporal variabilities of aerosols, and brings us tostudy the impact of these two effects in the next section.
3.3. Impact of temporal and spatial variability of AOT inBeijing
In addition to the lack of appropriate aerosol models, theunderestimation of AOT by MISR at high AOT values may alsobe caused by the temporal and spatial averaging whencomparing the snapshots of relatively large areas (i.e., MISRregions) with time-averaged point measurements (i.e., AERO-NET). For AERONET measurements, averaging in a two-hourwindow can possibly introduce substantial errors if AOT valuesvary substantially during that period, and may cause biases ifthere are no measurements taken close to the time of MISRoverpass. To account for this source of uncertainty, the qualityassessment (QA) criterion proposed by Diner et al. (2001) isadopted in the current analysis. By implementing a simpletemporal analysis on the AERONET data, we find that thestandard deviation of AERONET AOT within the two-hourwindow is about 0.05 on the average, 12% of which is beyond0.1. To adapt for the situation of high aerosol loading andrelatively high temporal variations in Beijing urban environ-ment, a matched point is flagged as “questionable” if thestandard deviation of AOT within the two-hour window isgreater than 0.1, or no data record is acquired within a 30-minutetime window centered at the MISR overpass time. TheAERONET AOT values of the “unquestionable” points areaveraged within the 30-minute windows, thus are considered tobe temporally stable and have a smaller bias. It should be notedthat the 30-minute timewindow varies with the coincidentMISRoverpass time for each data point.
The 3×3 spatial averaging that has been used in previousvalidation analyses is also investigated in the current analysis.On one hand, the MISR retrieval uncertainty will probably bereduced due to the 3×3 regions averaging (Martonchik et al.,2004). On the other hand, using AOT values of surroundingregions to estimate the AOT value of the central region withinwhich the AERONETsite falls naturally introduces an additional
level of uncertainty. Consequently, the central and surroundingpoints should be treated differently in the linear least squares. Inthe current analysis, a weighted least squares (WLS) fittingmodel is explored as an alternative to the traditional least squareregression (Weisberg, 1985). Every data point, i.e., a pair ofMISR–AERONETAOT values, is now given a weight: for a thesurrounding data point, weight is evaluated as the number of thesuccessful retrievals in the 3×3 regions; for a central point,weight is set to 9 to reward its lower bias of spatial mismatch ascompared to the surrounding data points.
The agreement between MISR and AERONET AOT isimproved when all the temporally “questionable” points wereeliminated, as shown in Fig. 5. The ordinary least squares (OLS)fit yields a higher R2 of 0.94 (equivalent to the correlationcoefficient of 0.97), a lower RMSE of 0.08 and a higher slope of0.71±0.03 (the dashed line in the Fig. 5). The WLS fit, whichreduces the impact of spatial variability, yields an even higherslope of 0.73±0.03 (the solid black line in the Fig. 5). Thisslope is higher than that reported by Kahn et al. (2005) in thecontinental category (regression slope=0.68). These noticeableimprovements indicate that aerosol temporal and spatial varia-tion can be an important source of uncertainty, and should beconsidered when validating MISR AOT in the urban environ-ment. By examining several MISR imageries on the dates whenAERONET data are highly variable, we find some of them havemore cirrus clouds than usual. Therefore, another possiblereason may be that some of AERONET observations mightinclude these variable thin clouds, which are excluded from theMISR retrievals through the cloud screening, thus theAERONET AOT would be larger in such cases.
When only the central points (i.e., MISR AOT at the centralregion matched with AERONETAOTaveraged over 30-minutewindow) are included in the OLS fit, the best agreement with anR2 of 0.96, a slope of 0.91±0.03, and an intercept of 0.00±0.01is achieved. Although the regression slope is highly significant(p-value b0.0001), this approach suffers a data loss with only33 data points remaining, and the AERONET AOT values ofthese points are all below 1.0 (the original sample size of centralpoints is 48, but some of them are “temporally” questionable,therefore excluded from the analysis). For the central points,MISR AOT is only 9% lower than AERONETAOTon average.This slight underestimation could be due to use of aerosolmodels with overly large single scattering albedos pointed outin the previous section, or maybe other potential problems of theMISR aerosol retrieval algorithm.
The dramatic improvement of the slope from 0.73 to 0.91, aswell as the R2 from 0.93 to 0.96, suggests that including thesurrounding points (the blue squares in the Fig. 5) in the validationprocess can introduce a substantial low bias. By investigatingaveraged AOT of the 3×3 regions covering the AERONET siteindicated in Fig. 2, we find that all the surrounding regions exceptone in the southeast have lower values than the central one. To alarge extent, this explains the underestimation of AOT by MISRwhen surrounding points are included. We will go into details onthe natural aerosol spatial variation of Beijing in the next section.It should be also noted that in MISR product version 17 andhigher, the regional best estimate AOT (MISR parameter name:
Fig. 5. Scatterplot of MISR versus AERONET green band AOT. “Questionable”points are shown as asterisks. The other “unquestionable” points are shown asgreen circles for central points and blue squares for surrounding ones. Theordinary least squares (OLS) and the weighted least squares (WLS) fit results aregiven in the upper left corner of the plot, with the dashed line representing thefitted line of the OLS and the solid black line representing the fitted line of theWLS. The linear regression line for those “unquestionable” central points isshown as the green solid line, with the estimated parameters shown in the lowerright corner. The dotted lines represent the 1:1 line and the MISR expecteduncertainty envelope for reference.
51X. Jiang et al. / Remote Sensing of Environment 107 (2007) 45–53
RegBestEstimateSpectralOptDepth) is the same as the regionalmean AOT for a successful retrieval, while in the case of a failedretrieval, the regional best estimate AOTwill be filled in with theaverage of 3×3 successful regional mean AOTs with anassociated quality flag. Our finding suggests that special attentionshould be paid when the regional best estimate AOT is used foraerosol studies in heavily polluted urban environments, becausethe spatial averaging can possibly introduce bias due to theaerosol spatial variability.
3.4. Indication of spatial variability by ground pollutionmonitoring data
While the AERONET site in the current study is surroundedby heavy traffic and residential apartments, analysis using
Fig. 6. Bar chart of seasonal average PM10 mass concentrations in 24 monitoring sitePM10 concentrations and labeled by their site numbers designated in Fig. 1.
geographic information system (GIS) indicates that the MISRregions within which the AERONET site falls covers urban,suburban and rural areas of Beijing. Road and traffic conditions,industrial emission sources, and population distribution arelikely to cause the aerosol loadings to vary within these MISRregions. Li et al. (2005b) derived 1-km MODIS AOT data overBeijing urban and suburban area (retrieval errors within 20%).A contour plot of yearly averaged AOT in Li et al. (2005b)showed that the aerosol is highly variable, and the high AOTvalues are mainly concentrated in the central urban areas withdense population, heavy traffic or industrial emissions. While inthis study, we further examine the ground-level PM data todescribe the aerosol spatial variation in Beijing.
Although affected by factors such as aerosol vertical profileand particle composition, ground-level particle concentrationsare often found to be highly correlated with column particlelight extinction properties (Chow et al., 2002; Liu et al., 2005).Due to the lack of long-term PM2.5 concentrations data, we usePM10 converted from API values as an indicator of the spatialvariation of AOT in Beijing. PM10 concentrations measured atthe Olympic Center, the closest API site to the AERONET sitein Beijing were compared with the AERONET AOT measure-ments. The correlation coefficients are 0.72, 0.61 and 0.59 in theautumn, summer and winter, respectively. The correlation inspringtime is weaker (0.32), owing to the long-range transportof Asian dust, which is usually above the boundary layer andtherefore not relevant to ground-level PM10 concentrations.This reasonably good correlation between PM10 concentrationsand AOT provides support that the spatial variability of PM10
concentrations is a reasonable indicator of the spatial variabilityof AOT in Beijing area.
Fig. 6 shows the seasonal averaged PM10 concentrations in 24monitoring sites, sorted by the overall mean PM10 concentra-tions. Most of the sites are covered byMISR 3×3 regions used inthe current analysis (Fig. 1). PM10 concentrations showsignificant spatial variations across the sites. The spatial standarddeviation of daily PM10 concentrations among the 24 monitoringsites is 31 μg/m3, or 23.7% of the mean city-wide PM10
concentration. The maximum difference of daily PM10 concen-trations among the 24 sites is 122 μg/m3, or 93.6% of the meancity-wide PM10 concentration. Overall, PM10 concentrations
s of Beijing in the year 2003 and 2004. The sites are sorted by their overall mean
52 X. Jiang et al. / Remote Sensing of Environment 107 (2007) 45–53
exhibit a clear spatial pattern, with lower concentrations in thesites located the northern region of Beijing, such as Dingling(#8), Huairouzheng (#21), Yangqingzhen (#23), and higherconcentrations in the sites in the central and southern region.The highest annual PM10 concentration is found in thesouthernmost site Liangxiangzhen (#15) (187 μg/m3). This isprobably because the dominant northerly wind blows pollutedair plumes from city center to the suburban and rural areas in thesouth. Gucheng (#7) and Yuquanlu (#11) sites, which are to thewest of the city center and near a major iron and steel manu-facturer, also observe very high PM10 levels due to proximity toheavy industrial emission sources. These results are consistentwith previous findings of the PM spatial distribution in Beijing(Zhao et al., 2004), and also moderately comparable with AOTspatial distribution obtained by Li et al. (2005b). The spatialheterogeneity is more obvious in the summer, autumn, andwinter, when local emission sources play a dominant role indetermining PM10 concentrations. Due to frequent dust storms,PM10 concentrations tend to more uniform in springtime(Fig. 6). On average, the daily spatial standard deviation is20.0% of the mean city-wide PM10 concentration in the spring,while 23.6% in the summer, 24.5% in the winter and 26.7% inthe autumn.
The heterogeneity of PM10 concentrations observed withinthe MISR regions confirms that averaging of 3×3 MISRregions may introduce substantial uncertainty in MISR AOTvalidation. The MISR central region (covering the AERONETsite) covers most of the heavily polluted central urban area,while some of the surrounding regions extend to suburban orrural areas where the aerosol abundance is substantially lowerthan the urban center. Regression analysis in the previoussection has showed a considerable improvement of the slopefrom 0.73 to 0.91 when surrounding points are all excluded.Consequently, we believe the 3×3 spatial averaging is one ofthe main reasons of the MISR's underestimation found in ourstudy. This also suggests that MISR's resolution of 17.6 kmmay be insufficient to characterize the highly variable aerosolloadings in large metropolitan areas such as Beijing. A finerresolution AOT derived from MISR product would benecessary to better characterize AOT on a local scale. Li et al.(2005a,b) retrieved MODIS AOT at 1-km resolution (10-km inthe standard MODIS AOT product) over Hong Kong andBeijing by modifying the MODIS algorithm, and thus bettercharacterize the aerosol spatial variation. Similar approachescould be taken on MISR data.
4. Conclusions
MISR retrieved AOTs are compared with AERONET AOTmeasurements in Beijing metropolitan area with extremely highaerosol loadings. Data are collected with methods used inprevious validation studies by using two-hour temporal aver-aging for AERONET AOT and both central and 3×3 sur-rounding averaged retrievals for MISR AOT. When all thematched MISR–AERONET AOT data are included in theanalysis, our results show that MISR AOT is strongly cor-related with AERONET AOT, but on average is 29% lower. A
linear regression analysis using MISR AOT as the responseyielded a slope of 0.58±0.03 and an intercept of 0.07±0.02 inthe green band with similar results in the other three bands,suggesting that MISR may underestimate AERONET AOT,especially at high AOT values. After applying a 30-minuteaveraging time window to the AERONET data and controllingtheir temporal variabilities, the agreement between MISR andAERONET AOT is significantly improved with the correlationcoefficient of 0.97 and a slope of 0.71±0.03 in an ordinary leastsquares fit. Aweighted linear least square fit, which reduces theimpact of spatial averaging, yields better results with the slopegoing up to 0.73±0.03. When only the central regions (without3×3 regions averaging) are used, the best result is achievedwith a slope of 0.91±0.03 and an intercept of 0.00±0.01, andthe mean MISR AOT of the central regions is only 9% lowerthan AERONET AOT. By investigating PM10 spatial distribu-tion in Beijing, we find substantial spatial variability of aerosolloading with higher PM10 concentrations observed in the ur-ban center where the AERONET site is located. When assessedtogether, the above findings indicate that the substantialunderestimation seen in MISR AOT may to a large extent beexplained by the low bias introduced by the 3×3 regionsspatial averaging. When the temporal and spatial variability ofAOT are better controlled, the agreement between MISR andAERONET AOT can be much better than the previouslyreported results.
In addition, our findings suggest that MISR aerosol retrievalalgorithm might need to be adjusted for the high aerosolloadings and substantial spatial variations that it will probablyencounter in heavily polluted metropolitan areas. New aerosolmixtures with lower SSAs might need to be introduced to betterdescribe the aerosols present in such environments. Theinadequate aerosol models in MISR retrieval algorithm mightpartially explain the discrepancies as pointed out by Kahn et al.(2005). Further studies are needed to explore alternativestatistical methods for MISR AOT validation in order to moreaccurately characterize the data. With the retrieval algorithmcontinuously being refined, MISR will provide AOT at higheraccuracy. Finally, as the AOT is closely related to PM massconcentration, MISR has the potential capability of assisting inurban air pollution monitoring.
Acknowledgements
This study is supported in part by Microsoft Research Asia,through a research grant to the Microsoft Statistics andInformation Technology Laboratory of Peking University. Theinternational collaboration is also supported in part by NationalScience of Foundation of China (60325101,60628102) andMinistry of Education of China (306017). The work of Bin Yuis partially supported by U.S. NSF Grant DMS-0306508 and U.S. ARO Grant W911NF-05–1-0104. The authors would like tothank Dr. Ralph Kahn and the MISR team for their advice andtechnical support. We also thank the AERONET PIs HongbinChen and Philippe Goloub for theirs effort in establishing andmaintaining the Beijing site, and Professor Zhanqing Li forproviding source information about the API/PM10 data.
53X. Jiang et al. / Remote Sensing of Environment 107 (2007) 45–53
References
Abdou, W. A., Diner, D. J., Martonchik, J. V., Bruegge, C. J., Kahn, R. A.,Gaitley, B. J., et al. (2005). Comparison of coincident Multiangle ImagingSpectroradiometer and Moderate Resolution Imaging Spectroradiometeraerosol optical depths over land and ocean scenes containing AerosolRobotic Network sites. Journal of Geophysical Research-Atmospheres, 110(D10), D10S07.
Chow, J. C., Watson, J. G., Lowenthal, D. H., & Richards, L. W. (2002).Comparability between PM2.5 and particle light scattering measurements.Environmental Monitoring and Assessment, 79(1), 29−45.
Christopher, S. A., & Wang, J. (2004). Intercomparison between multi-angleimaging spectroradiometer (MISR) and sunphotometer aerosol opticalthickness in dust source regions over China: Implications for satellite aerosolretrievals and radiative forcing calculations. Tellus. Series B, Chemical andPhysical Meteorology, 56(5), 451−456.
Chu, D. A., Kaufman, Y. J., Zibordi, G., Chern, J. D., Mao, J., Li, C. C., et al.(2003). Global monitoring of air pollution over land from the EarthObserving System-Terra Moderate Resolution Imaging Spectroradiometer(MODIS). Journal of Geophysical Research-Atmospheres, 108(D21).
Diner, D. J., Abdou,W. A., Bruegge, C. J., Conel, J. E., Crean, K. A., Gaitley, B. J.,et al. (2001). MISR aerosol optical depth retrievals over southern Africa duringthe SAFARI-2000 dry season campaign. Geophysical Research Letters, 28(16), 3127−3130.
Diner, D. J., Beckert, J. C., Reilly, T. H., Bruegge, C. J., Conel, J. E., Kahn, R. A.,et al. (1998).Multi-angle Imaging SpectroRadiometer (MISR)— Instrumentdescription and experiment overview. IEEE Transactions on Geoscience andRemote Sensing, 36(4), 1072−1087.
Dubovik, O., Smirnov, A., Holben, B. N., King,M. D., Kaufman, Y. J., Eck, T. F.,et al. (2000). Accuracy assessments of aerosol optical properties retrievedfrom Aerosol Robotic Network (AERONET) Sun and sky radiancemeasurements. Journal of Geophysical Research-Atmospheres, 105(D8),9791−9806.
Eck, T. F., Holben, B. N., Dubovik, O., Smirnov, A., Goloub, P., Chen, H. B.,et al. (2005). Columnar aerosol optical properties at AERONET sites incentral eastern Asia and aerosol transport to the tropical mid-Pacific.Journal of Geophysical Research-Atmospheres, 110(D6).
He, K. B., Yang, F. M., Ma, Y. L., Zhang, Q., Yao, X. H., Chan, C. K., et al.(2001). The characteristics of PM2.5 in Beijing, China. AtmosphericEnvironment, 35(29), 4959−4970.
Holben, B. N., Eck, T. F., Slutsker, I., Tanre, D., Buis, J. P., Setzer, A., et al.(1998). AERONET— A federated instrument network and data archive foraerosol characterization. Remote Sensing of Environment, 66(1), 1−16.
Jet Propulsion Laboratory (JPL) (2004). Multi-angle Imaging Spectro-Radiometer Data Product Specifications, Revision L: California Instituteof Technology.
Kahn, R., Banerjee, P., & McDonald, D. (2001). Sensitivity of multiangleimaging to natural mixtures of aerosols over ocean. Journal of GeophysicalResearch-Atmospheres, 106(D16), 18219−18238.
Kahn, R., Banerjee, P., McDonald, D., & Diner, D. J. (1998). Sensitivity ofmultiangle imaging to aerosol optical depth and to pure-particle size dis-
tribution and composition over ocean. Journal of Geophysical Research-Atmospheres, 103(D24), 32195−32213.
Kahn, R. A., Gaitley, B. J., Martonchik, J. V., Diner, D. J., Crean, K. A., &Holben, B. (2005). Multiangle Imaging Spectroradiometer (MISR) globalaerosol optical depth validation based on 2 years of coincident AerosolRobotic Network (AERONET) observations. Journal of GeophysicalResearch-Atmospheres, 110(D10).
Li, C. C. (2002). Remote sensing of Aerosol Optical Depth with MODIS and itsapplication in the regional environmental air pollution studies. Ph.D. thesis,Beijing: Peking University.
Li, C. C., Lau, A. K. H., Mao, J. T., & Chu, D. A. (2005a). Retrieval, validation,and application of the 1-km aerosol optical depth from MODIS measure-ments over Hong Kong. IEEE Transactions on Geoscience and RemoteSensing, 43(11), 2650−2658.
Li, C. C., Mao, J. T., Lau, A. K. H., Yuan, Z. B., Wang, M. H., & Liu, X. Y.(2005b). Application of MODIS satellite products to the air pollution researchin Beijing. Science in China Series D-Earth Sciences, 48, 209−219.
Liu, Y., Park, R. J., Jacob, D. J., Li, Q. B., Kilaru, V., & Sarnat, J. A. (2004a).Mapping annual mean ground-level PM2.5 concentrations using MultiangleImaging Spectroradiometer aerosol optical thickness over the contiguousUnited States. Journal of Geophysical Research-Atmospheres, 109(D22),D22206.
Liu, Y., Sarnat, J. A., Coull, B. A., Koutrakis, P., & Jacob, D. J. (2004b).Validation of multiangle imaging spectroradiometer (MISR) aerosol opticalthickness measurements using aerosol robotic network (AERONET)observations over the contiguous United States. Journal of GeophysicalResearch-Atmospheres, 109(D6), D06205.
Liu, Y., Sarnat, J. A., Kilaru, A., Jacob, D. J., & Koutrakis, P. (2005). Estimatingground-level PM2.5 in the eastern United States using satellite remotesensing. Environmental Science & Technology, 39(9), 3269−3278.
Martonchik, J. V., Diner, D. J., Crean, K. A., & Bull, M. A. (2002). Regionalaerosol retrieval results from MISR. IEEE Transactions on Geoscience andRemote Sensing, 40(7), 1520−1531.
Martonchik, J. V., Diner, D. J., Kahn, R. A., Ackerman, T. P., Verstraete, M. E.,Pinty, B., et al. (1998). Techniques for the retrieval of aerosol properties overland and ocean using multiangle imaging. IEEE Transactions on Geoscienceand Remote Sensing, 36(4), 1212−1227.
Martonchik, J. V., Diner, D. J., Kahn, R., Gaitley, B., & Holben, B. N. (2004).Comparison of MISR and AERONET aerosol optical depths over desertsites. Geophysical Research Letters, 31(16), L16102.
Pope, C. A., Thun, M. J., Namboodiri, M. M., Dockery, D. W., Evans, J. S.,Speizer, F. E., et al. (1995). Particulate air pollution as a predictor ofmortality in a prospective-study of US adults. American Journal ofRespiratory and Critical Care Medicine, 151(3), 669−674.
Sun, Y. L., Zhuang, G. S., Ying, W., Han, L. H., Guo, J. H., Mo, D., et al. (2004).The air-borne particulate pollution in Beijing— concentration, composition,distribution and sources. Atmospheric Environment, 38(35), 5991−6004.
Weisberg, S. (1985). Applied Linear Regression (pp. 84−92). New York: Wiley.Zhao, Y., Pan, J., Zhang, H. Y., Guo, J. Y., Wei, Q., & Shi, J. G. (2004). Analysis
of inhalable particles pollution in the atmosphere in Beijing area. Researchof Environmental Sciences, 17(1), 67−69.