Journal of Tropical Forest Science 27(1): 80–91 (2015) Nemec P
COMPARISON OF MODERN FOREST INVENTORY METHOD WITH THE COMMON METHOD FOR MANAGEMENT OF TROPICAL RAINFOREST IN THE PERUVIAN AMAZON
NĚMEC P. 2015. Comparison of modern forest inventory method with the common method for management of tropical rainforest in the Peruvian Amazon. Electronic devices consisting of field computer, laser rangefinder, electronic compass and global positioning system unit were used for data collection in the tropical rainforest of the Peruvian Amazon with the objective of comparing forest inventory methods. Forest stand was studied by mapping trees to obtain spatial dimensions and basic tree characteristics. The inventory conducted on 200 ha of forest in the Loreto Department were compared with inventory conducted using the common method (tapes and mechanical compasses). A map of the study site was created. Attributes of all trees with diameter at breast height (dbh) ≥ 400 mm were recorded: position, species, total height, trunk height and dbh. The study showed that the method using electronic devices was more exact and faster. The difference in timber stock measured by both inventories was 24.5 m³ ha-1. Our results may play an important economic role in forest planning and management in the region. Mitigation of the inaccuracies in inventories may weaken illegal logging in the Peruvian Amazon.
Keywords: Electronic compass, laser rangefinder, western Amazonia
P Němec
Department of Forest Botany, Dendrology and Geobiocoenology, Mendel University in Brno, Zemedelska 3, 613 00 Brno, Czech Republic; [email protected]
INTRODUCTION
Peru’s forest cover is estimated at 67.9 million ha, which is 53% of the total land area; 92% of these forests are in the Amazon Basin (FAO 2010). The main forest type in Peru is humid forest in the Amazon. It covers approximately 57 million ha, with sub-types that depend on altitude, soil and particularly their position in relation to rivers. Terrace and hill forests, on terrain with moderate slopes, are the most widespread humid forest sub-type, covering approximately 37 million ha. Alluvial forests, including those on lower river terraces, offer some of the greatest potential for integrated forest management and agroforestry because of their vigorous growth, flat terrain and good accessibility (Blaser et al. 2011).
Forest management in Peru follows the Forestry and Wildlife Law, which came into effect in 2000. This law prescribes several options for sustainable forest management, including 40-year concessions for timber, non-timber forest products and reforestation. Forest concessions for timber in Peru occupy
a relatively small average area of 12,900 ha. Due to their small size, their financial viability mainly depends on the prices of timber. Many concessions are located in former selectively harvested areas, especially along Amazonian bodies of water. Since many primary species are no longer present in large volumes, concessions are increasingly harvesting lesser-known species and intensifying their logging operations (Blaser et al. 2011). The forest law specifies forest audits every five years and obligates the authority to evaluate the results of forest concession inventories. The regulations for concession agreements require the application of detailed silvicultural prescriptions. Concessionaires must apply a polycyclic management system with a minimum cutting cycle of 20 years. A minimum diameter limit is determined for each species and at least 10% of adult trees of each species must be retained in each harvest area as seed trees. Thinning, refinement and enrichment planting are specified to help
Journal of Tropical Forest Science 27(1): 80–91 (2015) Nemec P
regenerate forests after harvesting (Blaser et al. 2011).
Large areas of Peruvian forests are endangered by deforestation. A myth has been created about the Amazon, representing it as a vast territory that is full of inexhaustible natural resources (Ruiz Murrieta 1992). Some areas of rainforest were cleared by logging and mining companies. However, the most current deforestation in Peru is likely caused by small-scale farmers (Lojka et al. 2012). This paper shows that forest inventories conducted by concessionaires are not always correct. Errors in height measurement, dbh and navigation inside the forest stand cause distinctive differences in characteristics of the forest stands, especially the timber stock. The application of methods that use a set of electronic devices can thus minimise errors and provide satisfactory results.
MATERIALS AND METHODS
Study site
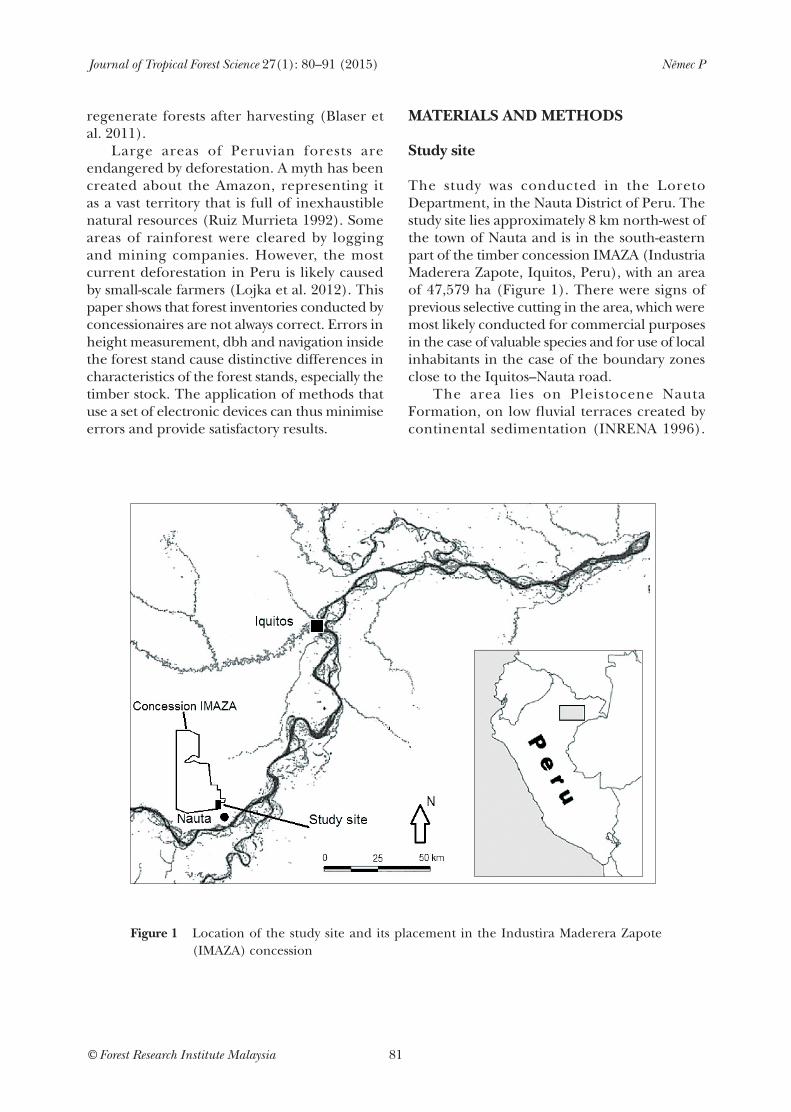
The study was conducted in the Loreto Department, in the Nauta District of Peru. The study site lies approximately 8 km north-west of the town of Nauta and is in the south-eastern part of the timber concession IMAZA (Industria Maderera Zapote, Iquitos, Peru), with an area of 47,579 ha (Figure 1). There were signs of previous selective cutting in the area, which were most likely conducted for commercial purposes in the case of valuable species and for use of local inhabitants in the case of the boundary zones close to the Iquitos–Nauta road.
The area lies on Pleistocene Nauta Formation, on low fluvial terraces created by continental sedimentation (INRENA 1996).
Figure 1 Location of the study site and its placement in the Industira Maderera Zapote (IMAZA) concession
Journal of Tropical Forest Science 27(1): 80–91 (2015) Nemec P
The hydrographic system is a net of rivulets and small rivers that converge and flow into the Marañon River. Soils in the area are dystrophic kambisols and their characteristics depend on the topography of the site. There is tendency towards higher vitality of trees on habitats with low and medium positions, where edaphic conditions are more favourable than habitats in higher positions (Zúñiga 2012).
The forest type in the area is tropical humid forest with low hills (INRENA 1995). The Peruvian Amazon Research Institute in 2005 classifies the area as forest on low, moderately dissected hills. Most of the area has an inclination of 0 to 18%. On the slopes of some hills, the inclination is between 18 and 48%. The climate data from the region come from the meteorological station at the Jenaro Herrera Research Centre, which is approximately 48 km south of the study area. Average annual precipitation of 2730 mm, average annual temperature of 26.4 °C and mean annual sunshine level of 1652 hours per year were registered between 1972 and 1994 (Spichiger et al. 1989). The climate of the region is characterised by a short, relatively dry season from June till September, which is stronger in some years. The area is situated in the Western Amazonian Zone and has a western Amazonian subclimate, which includes two dry seasons. The area is also near the climatic boundary with the central Amazon, which has a Manaus subclimate, with only one dry season (Marmillod 1982).
2007 forest inventory
The first forest inventory of the study area was conducted by a concessionaire in 2007, when 14 people participated in the field work (Table 1). The materials and equipment used for field work was a global positioning system (GPS), two compasses, three 25-m tapes, four callipers, plastic labels, hammers and nails, field paper notebooks and machetes (Table 2). The initial point of the inventory with UTM (Universal Transverse Mercator) coordinates 651985 and 9508146 in 18 M zone was established at the south-east corner of the study area. This point was given the x, y, z coordinates of 0, 0, 0. The study area was divided into 10 south–north-oriented subplots with 2000 m × 100 m format. A south–north-oriented trace was conducted through the centre of each subplot, while the inventory
of the plot was conducted, beginning from the southern boundary. With respect to the initial point, the positions of trees and other points in the plot were mapped with relative coordinates. The positions of all trees ≥ 400 mm dbh were recorded using a compass and tape. Diameters were measured at breast height using wooden callipers. A minimum size of 400 mm was selected because it is a frequently selected cut-off point in forest inventory measurements. Total heights and trunk heights (merchantable heights) were estimated and recorded. The species, presence or absence of generative organs and tree health were recorded. The tree basal area was calculated as ab = πr2 where r = dbh/2. The trunk volumes were calculated as V = ab× hm × f where ab = basal area (m2), hm = trunk height (m) and f = form factor with constant value of 0.65. The data were digitalised using computers and MS Excel as well as ArcView 3.2.
2008 forest inventory
The second forest inventory of the study area was conducted in 2008 by a team of 14 people comprising specialists and local staff (Table 2). The materials and equipment used for field work included PDA (personal digital assistant) field computer with accessories running Field-Map Data Collector specialised software, standard laser rangefinder and an electronic compass. The measuring set was assembled on a heavy-duty monopod and communicated through cables. Auxiliary tools used were a GPS, wooden callipers, extendible sticks with reflectors and machetes. The application of a similar set of measuring electronic devices and field computers using the Field-Map software was described in Hédl et al. (2009). The same point within the south-east corner of the study area was used as the initial point of the second inventory. This point was given the x, y, z coordinates of 0, 0, 0. The study area was divided into 10 south–north-oriented subplots with a 2000 m × 100 m format. A south–north-oriented trace was drawn through the centre of each subplot and the inventory was recorded, starting from the southern boundary. The navigation on the plot was conducted using a measuring set. Within each subplot, the positions of all trees ≥ 400 mm dbh were mapped given their coordinates by measuring the distance from the measuring set with respect
Journal of Tropical Forest Science 27(1): 80–91 (2015) Nemec P
RESULTS AND DISCUSSION
Time and staff
Much of the effort necessary to inventorise sites in Amazon is expended on travel, such that time
to the initial point. The horizontal and vertical angles were registered with an electronic compass and a built-in tilt sensor. The position of each tree appeared in the predefined map on the PDA screen. The total height and trunk height were measured using a laser rangefinder; other characteristics including the number identification, species, presence of generative organs and tree health were recorded. After measuring all visible trees from one location, the measuring set was repositioned within the subplot using two reference points. First, the distance and the azimuth of the reference points from the original position were registered. The measuring equipment was then moved to the new proper position from which the distance and the azimuth to the reference points were measured. By conducting the inventory in this way, the system of reference points allowed repositioning of the measuring set without losing spatial reference. The tree basal area and the volume of trunks were calculated the same way as in the 2007 inventory. The data were then processed on personal computers using the Field-Map Project Manager software and ArcGIS 9.2.
Figure 2 Comparison of time for inventory tasks
in the field becomes extremely valuable (Baraloto et al. 2013). The fieldwork was completed in 12 days in the 2007 inventory and 7 days in 2008 (Figure 2). Faster fieldwork markedly influenced the cost of the inventory. Data processing in 2008 took 6 days fewer than in 2007. It was also necessary to train local staff in the use of electronic devices for inventory completion. In 2008, this training was completed in 3 days. The total time spent for completion of inventory in 2007 was 34 days while that for 2008, 25 days (Table 2).
Positions of plots and trees
Navigation inaccuracies using compass and tape caused zigzag trajectories and shortening of traces on subplots of the 2007 inventory. The 2000-m distance was not reached on the subplots (Table 3) and the entire width was not mapped (Figure 3). This caused many trees in the study area to be overlooked. The magnetic declination, which in the site was over 4.7°, was not considered during the first inventory. Inaccuracies in measurement and non-consideration of magnetic declination caused distances to arise between starting points of subplots in both inventories. The starting points of the first subplot were at the same location, but the distance between the starting points in the last plot was 69.7 m. Trees mapped in the 2007 inventory and their equivalents in the 2008 inventory presented differences in coordinates.
Journal of Tropical Forest Science 27(1): 80–91 (2015) Nemec P
Errors, which were caused mainly by inaccuracies in the common method, varied between the distances of 1 and 178 m from mapped position of the tree. According to the field test, the error of the measuring set was in the scale of metres as well as the error of the GPS unit (http://www.trimble.com/junosd.shtml).
First approach
Total height
The largest number of trees measured in the 2007 inventory (Figure 4) had a height in the 15–19 m class (694 individuals). In the 2008 inventory, most trees fell in the 20–24 m class (457 individuals). Mean and maximum
Subplot no. Trace length(m)
Length missed(m)
1 1226 774
2 1587 413
3 1656 344
4 1687 313
5 1646 354
6 1674 326
7 1713 287
8 1695 305
9 1610 390
10 1656 344
Table 3 Numerical illustration of tracing errors in the 2007 inventory
Figure 3 Visual positions of trees in the study area
Number of determined species
In the 2007 inventory, the common names of trees were identified by one local specialist directly in the field, where 92 species were identified from 955 evaluated trees (Table 4). In the 2008 inventory, the common names of trees were identified by two local specialists and verified by dendrologists from La Molina National Agrarian University. The most represented species were taxonomically determined. A total of 163 species were identified from the 3648 evaluated trees.
In the 2007 inventory, 15 of the most represented species composed 61.78% of the total number of evaluated trees and 73% of the timber stock. Only four species possessed stock greater than 1 m³ ha-1. In the 2008 inventory, 15 of the most represented species composed 56.85% of the total number of evaluated trees and 61.2% of the timber stock. Nine species possessed stock greater than 1 m³ ha-1. Twenty-five species were represented by only one specimen in the 2007 inventory, while 38, in the 2008 inventory. The difference was most likely caused by abilities of the local specialist from the first inventory and by the fact that the study site was not completely mapped in 2007 and many of the large-sized trees were thus omitted.
Tree characteristics
Comparison of parameters such as height, dbh, basal area and timber stock from both inventories was performed using two approaches. The marked approach was a comparison of 955 trees measured in both inventories (trees were marked during the first inventory with plastic labels; two trees were dead at the time of the 2008 inventory). The second approach was a comparison of all measured trees: 955 in the 2007 inventory and 3648 in the 2008 inventory (Table 4).
Journal of Tropical Forest Science 27(1): 80–91 (2015) Nemec P
total heights were 17.6 and 30 m in the first inventory respectively, and 21.9 and 36 m in the second inventory respectively, (Figure 4). The more precise method using laser rangefinder revealed that total heights in the first inventory were undervalued using the visual estimation method. This arbitrary method also caused the absence of trees in the 5–9 m and 35–39 m classes in the 2007 inventory. The upper stories of alluvial and river terrace forests in the Peruvian Amazon are generally 35–40 m in height (Blaser et al. 2011). The height distribution of trees ≥ 400 mm dbh in wet forests of the Western Amazon varies between 17 and 38 m in height (Feldpausch et al. 2011).
Trunk height
The mean and maximum trunk heights were 14.1 and 20 m in the first inventory respectively, and 10.9 and 22 m in the second inventory respectively. In the 2007 inventory, no trees were found in the 0–4 m class
(Figure 5). However, 19 individuals were found there in the 2008 inventory. The biggest differences were in the 5–9 and 15–19 m classes, in which 26 and 457 trees were found in the 2007 inventory respectively, and 333 and 110 trees in the 2008 inventory respectively. These large differences were, again, mainly caused by the visual estimation errors in the 2007 inventory.
Trunk diameter
The mean and maximum dbhs were 572 and 1200 mm in the first inventory respectively, and 635 and 1500 mm in the second inventory respectively. The highest number of diameters measured in both inventories fell under the 400–499 mm class (Figure 6). The dbh had a declining tendency and t h e d i f f e r e n c e i n n u m b e r o f t r ee s wa s m odera t e i n a l l c l a s se s . The largest diameters over 800 mm were undervalued in the 2007 inventory, which caused the difference in average dbh.
Table 4 Comparison of both inventories on selected resulting parameters
Parameter Inventory
2007 2008
No. of measured trees 955 3648
No. of tree species found 92 163
Mean dbh of 955 trees measured in both inventories (mm)
572 635
Mean dbh of all measured trees (mm) 572 559
Mean total height of 955 trees measured in both inventories (m)
17.6 21.9
Mean total height of all measured trees (m) 17.6 22.7
Mean trunk height of 955 trees measured in both inventories (m)
14.1 10.9
Mean trunk height of all measured trees (m) 14.1 11.1
Mean tree basal area of 955 trees measured in both inventories (m²)
0.266 0.351
Mean tree basal area of all measured trees (m²) 0.266 0.262
Basal area of all measured trees per hectare (m² ha-1) 1.27 4.78
Mean trunk volume of 955 trees measured in both inventories (m³)
2.44 2.62
Mean trunk volume of all measured trees (m³) 2.44 1.98
Timber stock of all measured trees per hectare (m³ ha-1 ) 11.64 36.15
Journal of Tropical Forest Science 27(1): 80–91 (2015) Nemec P
Basal area
Using only 955 trees in both inventories, the basal area was 1.27 m² ha-1 in the 2007 inventory and 1.67 m² ha-1 in the 2008 inventory (Figure 7).
Timber stock
Using only 955 trees in both inventories, the mean trunk volume was 2.44 m³ and the timber stock was 11.64 m³ ha-1 in the 2007 inventory. The mean trunk volume was 2.62 m³ and the timber stock was 12.52 m³ ha-1 in the 2008 inventory (Table 4, Figure 8). This comparison shows the importance of precise measurement for calculating the stock of forest stands.
Second approach
Total height
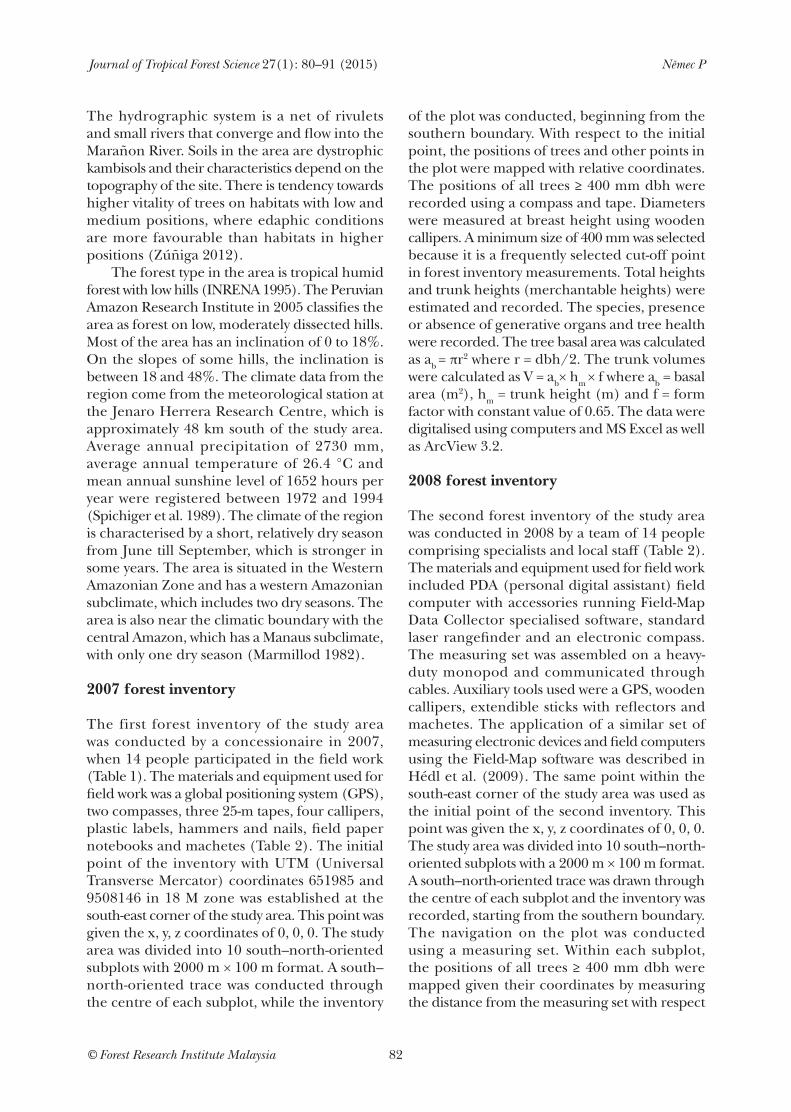
Total heights measured in the 2007 inventory fell under five classes, contrary to the seven classes that were used in the 2008 inventory. The first inventory did not consider the 5–9 and 35–39 m classes, in which 1 and 7 individuals respectively fell during the second inventory. The mean and maximum total heights were 17.6 and 30 m in the first inventory respectively, and 22.7 and 36 m in the second inventory respectively (Figure 9).
Figure 7 Comparison of basal area of trees measured in both inventories
Figure 8 Comparison of timber stock of trees measured in both inventories
Trunk height
The first inventory did not consider the 0–4 m class, in which 32 individuals fell in the second inventory. The mean and maximum trunk heights were 14.1 and 20 m in the first inventory respectively and 11.1 and 26 m in the second inventory respectively (Table 4, Figure 10). According to both methods of comparison, the visual estimation error used in the 2007 inventory was lower in the case of trunk height than in the case of total height.
Trunk diameter
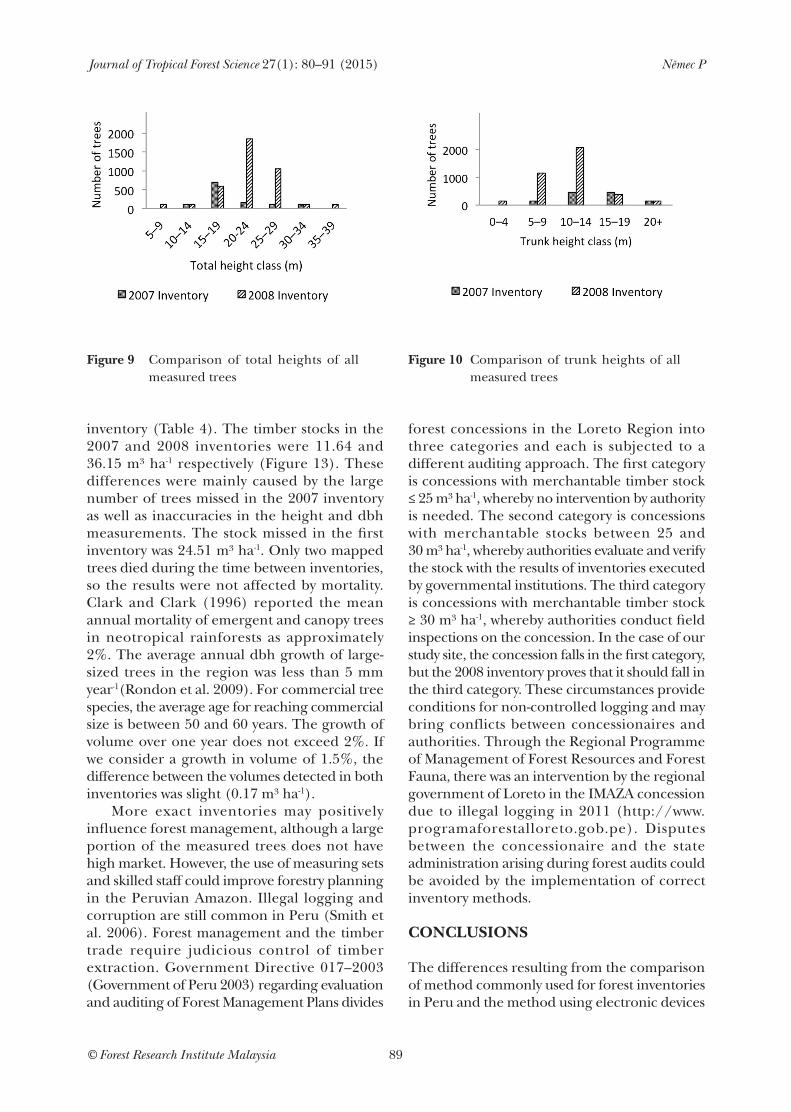
The mean and largest dbhs were 572 and 1200 mm in the first inventory respectively and 559 and 1700 mm in the second inventory respectively (Figure 11).
Basal area
The basal areas were 1.27 m² ha-1 in the 2007 inventory and 4.78 m² ha-1 in the 2008 inventory (Figure 12).
Timber stock
The mean trunk volume was 2.44 m³ in the 2007 inventory and 1.98 m³ in the 2008
Journal of Tropical Forest Science 27(1): 80–91 (2015) Nemec P
forest concessions in the Loreto Region into three categories and each is subjected to a different auditing approach. The first category is concessions with merchantable timber stock ≤ 25 m³ ha-1, whereby no intervention by authority is needed. The second category is concessions with merchantable stocks between 25 and 30 m³ ha-1, whereby authorities evaluate and verify the stock with the results of inventories executed by governmental institutions. The third category is concessions with merchantable timber stock ≥ 30 m³ ha-1, whereby authorities conduct field inspections on the concession. In the case of our study site, the concession falls in the first category, but the 2008 inventory proves that it should fall in the third category. These circumstances provide conditions for non-controlled logging and may bring conflicts between concessionaires and authorities. Through the Regional Programme of Management of Forest Resources and Forest Fauna, there was an intervention by the regional government of Loreto in the IMAZA concession due to illegal logging in 2011 (http://www.programaforestalloreto.gob.pe). Disputes between the concessionaire and the state administration arising during forest audits could be avoided by the implementation of correct inventory methods.
CONCLUSIONS
The differences resulting from the comparison of method commonly used for forest inventories in Peru and the method using electronic devices
inventory (Table 4). The timber stocks in the 2007 and 2008 inventories were 11.64 and 36.15 m³ ha-1 respectively (Figure 13). These differences were mainly caused by the large number of trees missed in the 2007 inventory as well as inaccuracies in the height and dbh measurements. The stock missed in the first inventory was 24.51 m³ ha-1. Only two mapped trees died during the time between inventories, so the results were not affected by mortality. Clark and Clark (1996) reported the mean annual mortality of emergent and canopy trees in neotropical rainforests as approximately 2%. The average annual dbh growth of large-sized trees in the region was less than 5 mm year-1(Rondon et al. 2009). For commercial tree species, the average age for reaching commercial size is between 50 and 60 years. The growth of volume over one year does not exceed 2%. If we consider a growth in volume of 1.5%, the difference between the volumes detected in both inventories was slight (0.17 m³ ha-1).
More exact inventories may positively influence forest management, although a large portion of the measured trees does not have high market. However, the use of measuring sets and skilled staff could improve forestry planning in the Peruvian Amazon. Illegal logging and corruption are still common in Peru (Smith et al. 2006). Forest management and the timber trade require judicious control of timber extraction. Government Directive 017–2003 (Government of Peru 2003) regarding evaluation and auditing of Forest Management Plans divides
Figure 9 Comparison of total heights of all measured trees
Figure 10 Comparison of trunk heights of all measured trees
Journal of Tropical Forest Science 27(1): 80–91 (2015) Nemec P
Figure 11 Comparison of dbh of all measured trees; dbh = diameter at breast height
Figure 12 Comparison of basal area of all measured trees
Figure 13 Comparison of timber stock of all measured trees per hectare
were significant. These differences arose from the use of different navigation techniques in the field, different devices for measurement and probably also from differently skilled staff during the fieldwork of each inventory. The amount of stock missed in the first inventory could play an important role in the management of a concession.
The results of the comparison study provided important evidence of inventory mistakes that, in practice, negatively influenced the accuracy of forest planning. The use of more precise inventory methods in the region would collect more accurate data on evaluated forests and might positively influence the creation of annual operative plans. This process might have positive impact on the transparency and legitimacy of the management process of permanent production forests, reduce illegal logging and restrict the sale of timber in the black market.
The main advantages found in using the measuring set were, ultimately, more exact navigation in plots and better measurement of trees, less time conducting fieldwork, and less time required for digitalising and processing the data. However, the disadvantages were the need for qualified staff to operate the devices and conduct data processing and the high price of devices.
ACKNOWLEDGEMENTS
Thanks are due to JM Olavarría and MAP GeoSolutions for material and technical support during fieldwork and to IMAZA concession for use of information. Thanks also go to CMZ Loyaza and VB Arroyo from La Molina National Agrarian University for professional support and aid in processing the inventory results.
Journal of Tropical Forest Science 27(1): 80–91 (2015) Nemec P
REFERENCES
Baraloto C, Molto Q, Rabaud S, Hérault B, Valencia R, Blanc L, Fine PVA & Thompson j. 2013. Rapid simultaneous estimation of aboveground biomass and tree diversity across neotropical forests: a comparison of field inventory methods. Biotropica 45: 288–298.
Blaser J, Sarre A, Poore D & Johnson S. 2011. Status of Tropical Forest Management 2011. International Tropical Timber Organization Technical Series No. 38. International Tropical Timber Organization, Yokohama.
Clark DB & Clark DA. 1996. Abundance, growth and mortality of very large trees in neotropical lowland rain forest. Forest Ecology and Management 80: 235–244.
FAO (Food and Agriculture Organization). 2010. Evaluación de los recursos forestales mundiales 2010. FAO, Rome
Feldpausch TR et al. 2011. Height–diameter allometry of tropical forest trees. Biogeosciences 8: 1081–1106.
Government of Peru. 2003. Directiva Parala Autorizacion de Volumenes De Madera en los Planes De Manejo Forestal. Directiva No 017-2003. Lima.
Hédl R, Svátek M, Danèák M, Rodzay AW, Salleh AB & Kamariah AS. 2009. A new technique for inventory of permanent plots in tropical forests: a case study from lowland dipterocarp forest in Kuala Belalong, Brunei Darussalam. Blumea 54: 124–130.
INRENA (Instituto Nacional de Recursos Naturales). 1995. Guía Explicativa del Mapa Forestal . INRENA, Lima.
INRENA. 1996. Mapa de Suelos del Perú. INRENA, Lima.
Lojka B, Preininger D, Van Damme P, Rollo A & Banout J. 2012. Use of the Amazonian tree species Inga edulis for soil regeneration and weed control. Journal of Tropical Forest Science 24: 89–101.
Marmillod D. 1982. Methodik und ergebnisse von untersuchungen über zusammensetzung und aufbau eines terrassenwaldes in peruanischen Amazonien. PhD thesis, University of Göttingen, Göttingen.
Rondon XJ, Gorchov DL & Noble RB Jr. 2009. Projection of tree growth and timber volume following strip clear-cutting in the Peruvian Amazon. Forest Ecology and Management 257: 588–599.
Ruiz Murrieta J. 1992. Food from the forest: the Peruvian case. Journal of Tropical Forest Science 5: 115–129.
Smith J, Colan V, Sabogal C & Snook L. 2006. Why policy reforms fail to improve logging practices: the role of governance and norms in Peru. Forest Policy and Economics 8: 458–469.
Spichiger R, Méroz J, Loizeau PA & Stutz de Ortega L. 1989. Contribución a la Flora de la Amazonía Peruana. Los Arboles del Arboretum Jenaro Herrera. Volume 1. Conservatoire et Jardin Botanique de Genéve, Geneva.
Zúñiga CM. 2012. Uso del sistema electrónico colector de datos Field-Map en el censo de una parcela de corta anual del bosque tropical, en Loreto. Diploma thesis, La Molina National Agrarian University, Lima.