An Acad Bras Cienc (2020) 92(3): e20190603 DOI 10.1590/0001-3765202020190603 Anais da Academia Brasileira de Ciências | Annals of the Brazilian Academy of Sciences Printed ISSN 0001-3765 I Online ISSN 1678-2690 www.scielo.br/aabc | www.fb.com/aabcjournal An Acad Bras Cienc (2020) 92(3) ENGINEERING SCIENCES Comparison of modified alpha functions of the PR-EoS for volume and enthalpy prediction of natural gases ANDRÉ F. GONÇALVES, ESLY F. DA COSTA JUNIOR & ANDRÉA O.S. DA COSTA Abstract: Proper simulation of processes of the natural gas industry such as dehydration, liquefaction and regasification require accurate prediction of thermodynamic properties of the working fluids. For such processes, cubic equations of state are the calculation methods most frequently employed. Among them, the Peng-Robinson equation is usually the one recommended for gas, refinery and petrochemical applications in many simulators. Numerous works have been proposed in order to improve the temperature dependence relation of the attraction parameter of the equation – the so called alpha function. In this work, five currently available alpha functions are evaluated for the prediction of molar volumes and enthalpies of natural gas samples. Additionally, parameters of one of the models are readjusted to volumetric data of methane, in order to represent its supercritical behavior more accurately. Experimental data of 44 mixtures are compared with calculated results. Van der Waals mixing rules are used, with binary interaction parameters set as zero. In the case of the original alpha function, it is also tested how the inclusion of non-zero binary parameters affects the predictions. The extended Saffari-Zahedi model presents the smallest average deviation for the molar volumes (1.35%). For the enthalpy calculation, the inclusion of the binary parameters results in deviation values of 2.62% for gas-gas transitions and 4.44% for gas-liquid transitions. Key words: Alpha function, enthalpy, equation of state, natural gas, Peng-Robinson, volume. INTRODUCTION Increasing global energy demand and growing concern with environmental issues accelerate the development of clean and economical energy sources. Low greenhouse gas and air pollutant emissions make the natural gas an attractive possibility, in comparison with other fossil fuels (Qyyum et al. 2018). The U.S Energy Information Administration expects the natural gas global consumption to grow 1.9% annually. Projections of the same agency indicate that by 2030 natural gas will surpass coal as the second most consumed fuel (U.S. EIA 2016). For long-distance trading, natural gas is liquefied and stored in cryogenic tanks of ships (Wang et al. 2011). The design and optimization of liquefaction processes are usually conducted with software packages like Aspen Hysys, Aspen Plus and Honeywell UniSim Design, which employ accurate thermodynamic models for the estimation of physical properties of natural gas and refrigerant fluids (Yuan et al. 2015). Saffari & Zahedi (2013) consider that the favorable balance between precision, simplicity and computational time of cubic equations of state (EoSs) – especially Peng-Robinson (PR), Soave- Redlich-Kwong (SRK) and Lee-Kesler-Plocker
Transcript
An Acad Bras Cienc (2020) 92(3): e20190603 DOI 10.1590/0001-3765202020190603Anais da Academia Brasileira de Ciências | Annals of the Brazilian Academy of SciencesPrinted ISSN 0001-3765 I Online ISSN 1678-2690www.scielo.br/aabc | www.fb.com/aabcjournal
An Acad Bras Cienc (2020) 92(3)
Running title: Enthalpy and volume calculations of natural gases
Academy Section: Engineering
Sciences
e20190603
92 (3)92(3)
ENGINEERING SCIENCES
Comparison of modifi ed alpha functions of the PR-EoS for volume and enthalpy prediction of natural gases
ANDRÉ F. GONÇALVES, ESLY F. DA COSTA JUNIOR & ANDRÉA O.S. DA COSTA
Abstract: Proper simulation of processes of the natural gas industry such as dehydration, liquefaction and regasifi cation require accurate prediction of thermodynamic properties of the working fl uids. For such processes, cubic equations of state are the calculation methods most frequently employed. Among them, the Peng-Robinson equation is usually the one recommended for gas, refi nery and petrochemical applications in many simulators. Numerous works have been proposed in order to improve the temperature dependence relation of the attraction parameter of the equation – the so called alpha function. In this work, fi ve currently available alpha functions are evaluated for the prediction of molar volumes and enthalpies of natural gas samples. Additionally, parameters of one of the models are readjusted to volumetric data of methane, in order to represent its supercritical behavior more accurately. Experimental data of 44 mixtures are compared with calculated results. Van der Waals mixing rules are used, with binary interaction parameters set as zero. In the case of the original alpha function, it is also tested how the inclusion of non-zero binary parameters affects the predictions. The extended Saffari-Zahedi model presents the smallest average deviation for the molar volumes (1.35%). For the enthalpy calculation, the inclusion of the binary parameters results in deviation values of 2.62% for gas-gas transitions and 4.44% for gas-liquid transitions.
Increasing global energy demand and growing concern with environmental issues accelerate the development of clean and economical energy sources. Low greenhouse gas and air pollutant emissions make the natural gas an attractive possibility, in comparison with other fossil fuels (Qyyum et al. 2018). The U.S Energy Information Administration expects the natural gas global consumption to grow 1.9% annually. Projections of the same agency indicate that by 2030 natural gas will surpass coal as the second most consumed fuel (U.S. EIA 2016).
For long-distance trading, natural gas is liquefi ed and stored in cryogenic tanks of ships (Wang et al. 2011). The design and optimization of liquefaction processes are usually conducted with software packages like Aspen Hysys, Aspen Plus and Honeywell UniSim Design, which employ accurate thermodynamic models for the estimation of physical properties of natural gas and refrigerant fl uids (Yuan et al. 2015). Saffari & Zahedi (2013) consider that the favorable balance between precision, simplicity and computational time of cubic equations of state (EoSs) – especially Peng-Robinson (PR), Soave-Redlich-Kwong (SRK) and Lee-Kesler-Plocker
ANDRÉ F. GONÇALVES, ESLY F. DA COSTA JUNIOR & ANDRÉA O.S. DA COSTA ENTHALPY AND VOLUME CALCULATIONS OF NATURAL GASES
An Acad Bras Cienc (2020) 92(3) e20190603 2 | 16
(LPL) – make them the calculation methods most frequently used in practical applications. According to the authors, the PR EoS is probably the most popular.
Improvements of thermodynamic properties predictions employing EoSs can be achieved by proper parameter adjustment for pure components or improvements in mixing rules, when mixtures are involved (Novak et al. 2018). For pure components a better performance of the equation can be obtained through refinements in the temperature dependence relation of the term of attraction – the so-called alpha function – by adjusting the function parameters to experimental data of vapor pressures, pressure-volume-temperature (PVT) data (Rijkers 1991, Trebble & Bishnoi 1987) or fugacity data (Flöter et al. 1998). Gasem et al. (2001) proposed modifications in the original PR alpha function and obtained 1.1% mean deviation in the vapor pressure prediction of 28 pure components, including heavy hydrocarbons (> C10), totaling 1100 experimental points. Saffari & Zahedi (2013) proposed a new alpha function for the Peng-Robinson equation, comparing calculated and experimental vapor pressure data of 10 components usually found in natural gases, from the triple point to the critical point. The new model presented a mean deviation of 1.42%. Coquelet et al. (2004) compared the functions of Mathias & Copeman (1983), Trebble & Bishnoi (1987) and original PR (Peng & Robinson 1976), as well as proposing a new model, based on the first two equations. They evaluated 22 components and found an average absolute deviation of 1.2% for vapor pressure predictions, compared to 2.1% of the original PR equation.
Some researchers also reported how alpha functions affect phase equilibrium calculations for mixtures (Danesh et al. 1995, Twu et al. 1996, Flöter et al. 1998). However, works in which the models are evaluated for the estimation of
volumetric or calorific properties of mixtures are scarce (Li et al. 2016). In order to study how alpha functions influence the prediction of these propertie, especially for natural gases, 5 different models are analyzed: PR’s original alpha function, Gasem (Gasem et al. 2001), Mathias-Copeman (Mathias & Copeman 1983), Saffari-Zahedi (Saffari & Zahedi 2013) and Coquelet (Coquelet et al. 2004). The models are tested for the prediction of molar volumes of 10 natural gas samples and enthalpy variation of 34 mixtures of species commonly found in natural gases. Classical mixing rules are used, in which the binary interaction parameters (BIPs) are set equal to zero for all components (kij= 0). The results are compared with the original PR EoS with non-zero BIPs.
THEORETICAL BACKGROUND: THERMODYNAMIC PROPERTIES DERIVED FROM EQUATIONS OF STATE
Equations of state together with models for ideal-gas heat capacities enable the calculation of physical properties of fluids (Vestfálová 2017). Using a modified version of Benedict-Webb-Rubin’s equation, fundamental relations of classical thermodynamics and properly chosen thermodynamic paths, Younglove & Ely (1987) calculated the entropy, enthalpy, internal energy, heat capacities at constant pressure and volume, and speed of sound for methane, ethane, propane, isobutane and n-butane. A similar methodology was used by Vestfálová (2017) to calculate the thermal properties of water vapor. By applying mixing rules, one can extend the calculations for mixtures (Terron 2017).
The PR EoS (Peng & Robinson 1976) can be written as (equation 1):
( )( ) ( )
a TRTPv b v v b b v b
= −− + + − (1)
ANDRÉ F. GONÇALVES, ESLY F. DA COSTA JUNIOR & ANDRÉA O.S. DA COSTA ENTHALPY AND VOLUME CALCULATIONS OF NATURAL GASES
An Acad Bras Cienc (2020) 92(3) e20190603 3 | 16
where P is the pressure, T is the temperature, v is the molar volume and R is the universal gas constant. Parameters a(T) and b result from mathematical restrictions on the critical point (equations 2 and 3):
( ) ( )2 2
2
0.45724 C
C
R Ta T TP
α
=
(2)
0.0780 C
C
RTbP
= (3)
where subscript c indicates critical property and α(T) represents the alpha function.
When written in terms of compressibility factor (z), equation 1 becomes:
( )( ) ( )
/a T RTvzv b v v b b v b
−= +
− + + − (4)
The PR alpha function, originally proposed by Soave (1972) has the form (equations 5 and 6):
( )20.5
1 1C
TTT
α κ = + −
(5)
20.37464 1.54226 0.26992κ ω ω= + − (6)
where ω is the acentric factor. Parameter κ is generated by fitting vapor pressure data of a set of pure compounds. Equation 6 relates κ to the acentric factor of each substance.
When mixtures are involved, mixing rules must be employed for the calculation of the parameters a(T) and b. In this work, the classical mixing rules of Van der Waals were adopted, as follows (equations 7, 8 and 9):
( ) i j iji j
a T y y a=∑∑ (7)
i ii
b x b=∑ (8)
where
( ) ( ) ( )1ij iji ja a T a T k= − (9)
The term kij is the binary interaction parameter, specific for each pair of components of the mixture. They are usually adjusted from vapor-liquid equilibrium data, as described by Abudour et al. (2014).
The specific enthalpy variation (Δh) of a gas that undergoes a temperature and volume change from T1 to T2 and v1 to v2 is given by equation 10:
( ) ( )2
1
1 2 2 2 2 1 1 1, ,T
id res res
T
h Cp dT h T v h T v→∆ = + −∫ (10)
where the abbreviation res relates to residual properties and Cpid is the heat capacity of the ideal gas at constant pressure.
The specific residual Helmholtz free energy (ares) offers a convenient possibility for deriving properties such as residual enthalpy and heat capacity at constant pressure, as described by Neau et al. (2009). It can be calculated as follows (equation 11):
( ) 1v
res dva RT zv∞
=− −∫ (11)
From the fundamentals of classic thermodynamics, it is possible to relate the residual Helmholtz free energy to specific residual enthalpy (equation 12):
( ) 2 / )1res
res
v
a Th RT z TT
∂= − − ∂
(12)
Subscript v denotes that the specific volume is kept constant during differentiation.
By coupling equations 11 and 12, an expression for the residual enthalpy as a function of compressibility factor is obtained (equation 13):
( )v
21res
v
z dvh RT z RTT v∞
∂ = − + ∂ ∫ (13)
Using equation 4 for the compressibility factor and solving the resulting integral, the
ANDRÉ F. GONÇALVES, ESLY F. DA COSTA JUNIOR & ANDRÉA O.S. DA COSTA ENTHALPY AND VOLUME CALCULATIONS OF NATURAL GASES
An Acad Bras Cienc (2020) 92(3) e20190603 4 | 16
specific residual enthalpy becomes (equation 14):
( ) ( ) ( ) ( )( )
2 111 . ln2 2 2 1
resv bda T
h RT z a T TdT b v b
− − = − + − + + (14)
Equation 15 results from rewriting the first integral of equation 10 in terms of the ideal-gas heat capacities of the components, weighted by their mole fractions. Once the residual enthalpies are computed using expression 14, the determination of the enthalpy variation for a mixture is straightforward (equation 15).
( ) ( )1 2 2 2 2 1 1 1
2, ,
1
id res resi i
i
Th Cp y dT h T v h T v
T→∆ = + −∫ ∑
(15)
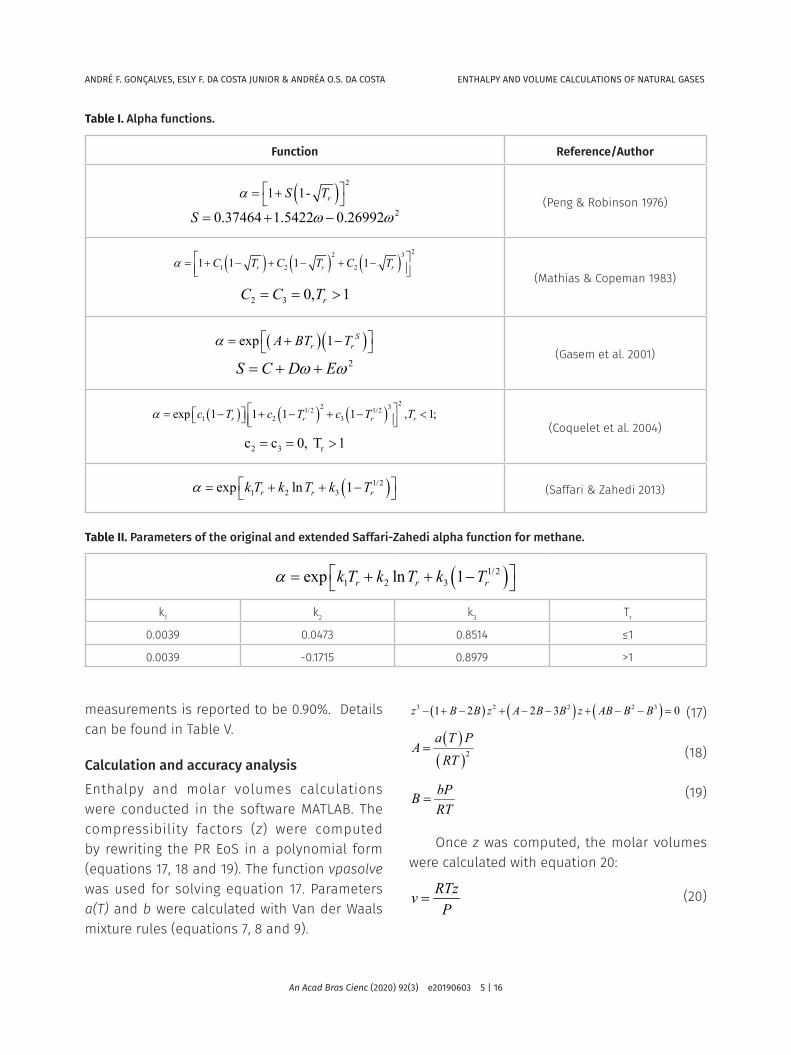
MATERIALS AND METHODSAlpha functionsThe alpha functions used in molar volume and enthalpy calculations are shown in Table I. It must be noted that the models of Mathias & Copeman (1983) and Coquelet et al. (2004) make use of switching functions in order to represent supercritical behavior more accurately. The other 3 models consist of one function each.
The terms Ci, ci and ki are constants for each component. A, B and C are constants of the Gasem model and Tr is the reduced temperature.
The Saffari-Zahedi model was originally proposed under saturation conditions. In order to evaluate how a better adjustment of the alpha function for methane, only, would impact the results, the parameters of the same function were readjusted to the data generated by Setzmann & Wagner (1991), based on a fundamental equation explicit in Helmholtz free energy containing 40 fitted coefficients. The authors reported deviations from experimental densities of 0.03% for pressures below 12 MPa and temperatures below 350K and deviations of 0.03% to 0.15% for higher pressures and temperatures. A total of 200 points in the temperature range of 195 K to 430 K
and pressure range of 200 kPa to 8000 kPa was used. The first parameter k1 was kept the same value as in the original function. By doing so, it is possible to avoid discontinuities in the alpha function. The two remaining parameters, k2 and k3 were recalculated by minimizing the objective function f – sum of the square of relative density (ρ) deviations –, given by equation 16:
( ) ( )( )
2expN
calc exp
i exp
i if
iρ ρ
ρ −
=
∑ (16)
The subscripts calc and exp relate to calculated and experimental values, respectively. Parameter Nexp is the number of experimental points used.
The optimization code was developed in the software MATLAB. The function fminsearch was used. Parameters of the original and extended models for methane are given in Table II, where Tr is the reduced temperature.
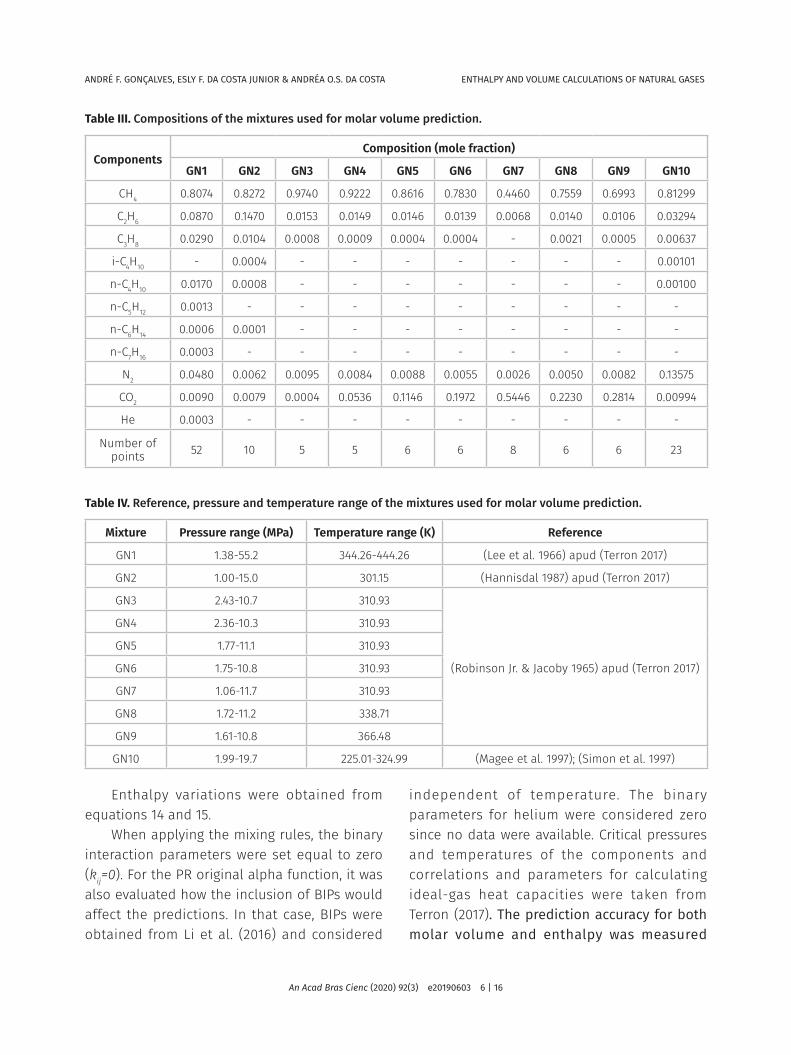
Data sourcePVT data of 10 natural gases (GN) were obtained from different sources in the literature. Details of the data sources, compositions and ranges of temperature and pressure are given in Tables III and IV. Uncertainties of volume and density measurements were only found for mixture GN10, for which uncertainties of 0.044% are estimated for the first 4 experimental points (Magee et al. 1997). For the remaining points (Simon et al. 1997), uncertainties of 0.04% are estimated.
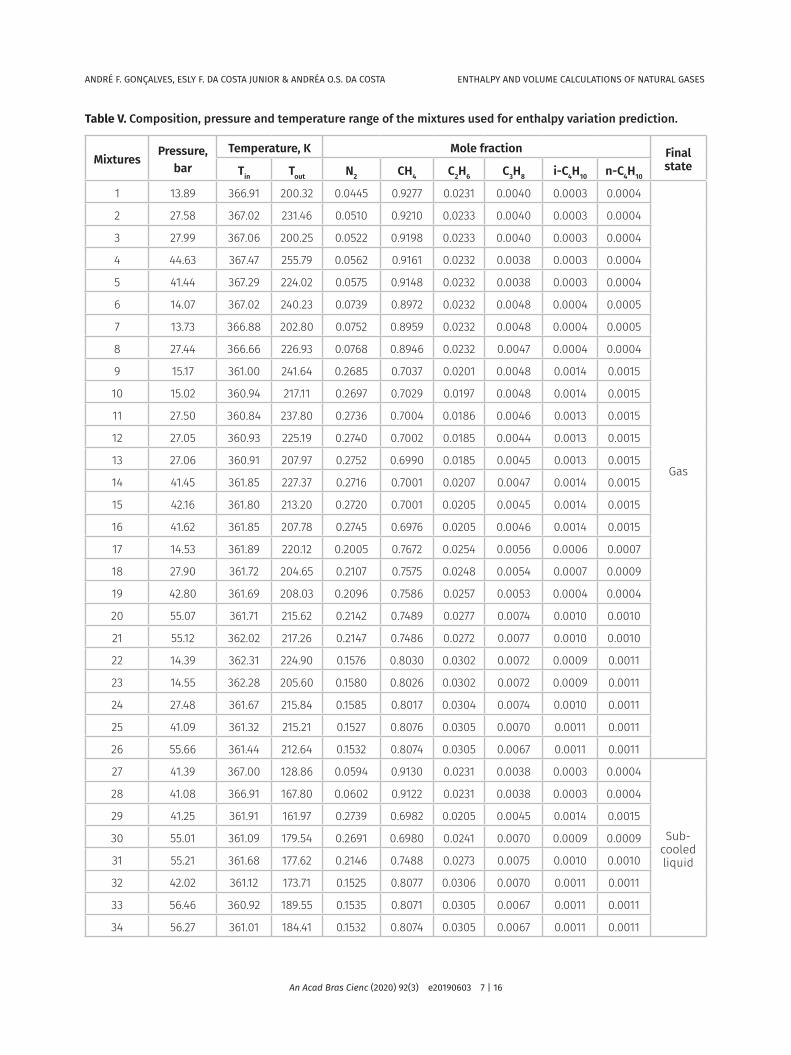
Experimental enthalpy data were obtained from Ashton & Haselden (1980). The authors have measured the enthalpy variation of 34 mixtures containing different mole fractions of nitrogen, methane, ethane, propane, isobutane and n-butane, undergoing a cooling process at constant pressure. A total of 8 points includes transitions between gas and sub-cooled liquid regions. The total uncertainty of enthalpy
ANDRÉ F. GONÇALVES, ESLY F. DA COSTA JUNIOR & ANDRÉA O.S. DA COSTA ENTHALPY AND VOLUME CALCULATIONS OF NATURAL GASES
1 2 3exp 1 1 1 1 , 1;r r r rc T c T c T Tα = − + − + − <
2 3 rc c 0, T 1= = >(Coquelet et al. 2004)
( )1/21 2 3exp ln 1r r rk T k T k Tα = + + − (Saffari & Zahedi 2013)
Table II. Parameters of the original and extended Saffari-Zahedi alpha function for methane.
( )1/21 2 3exp ln 1r r rk T k T k Tα = + + −
k1 k2 k3 Tr
0.0039 0.0473 0.8514 ≤1
0.0039 -0.1715 0.8979 >1
measurements is reported to be 0.90%. Details can be found in Table V.
Calculation and accuracy analysisEnthalpy and molar volumes calculations were conducted in the software MATLAB. The compressibility factors (z) were computed by rewriting the PR EoS in a polynomial form (equations 17, 18 and 19). The function vpasolve was used for solving equation 17. Parameters a(T) and b were calculated with Van der Waals mixture rules (equations 7, 8 and 9).
( ) ( ) ( )3 2 2 2 31 2 2 3 0z B B z A B B z AB B B− + − + − − + − − = (17)
( )( )2
a T PA
RT= (18)
bPBRT
= (19)
Once z was computed, the molar volumes were calculated with equation 20:
RTzvP
= (20)
ANDRÉ F. GONÇALVES, ESLY F. DA COSTA JUNIOR & ANDRÉA O.S. DA COSTA ENTHALPY AND VOLUME CALCULATIONS OF NATURAL GASES
An Acad Bras Cienc (2020) 92(3) e20190603 6 | 16
Table III. Compositions of the mixtures used for molar volume prediction.
Table IV. Reference, pressure and temperature range of the mixtures used for molar volume prediction.
Mixture Pressure range (MPa) Temperature range (K) Reference
GN1 1.38-55.2 344.26-444.26 (Lee et al. 1966) apud (Terron 2017)
GN2 1.00-15.0 301.15 (Hannisdal 1987) apud (Terron 2017)
GN3 2.43-10.7 310.93
(Robinson Jr. & Jacoby 1965) apud (Terron 2017)
GN4 2.36-10.3 310.93
GN5 1.77-11.1 310.93
GN6 1.75-10.8 310.93
GN7 1.06-11.7 310.93
GN8 1.72-11.2 338.71
GN9 1.61-10.8 366.48
GN10 1.99-19.7 225.01-324.99 (Magee et al. 1997); (Simon et al. 1997)
Enthalpy variations were obtained from equations 14 and 15.
When applying the mixing rules, the binary interaction parameters were set equal to zero (kij=0). For the PR original alpha function, it was also evaluated how the inclusion of BIPs would affect the predictions. In that case, BIPs were obtained from Li et al. (2016) and considered
independent of temperature. The binary parameters for helium were considered zero since no data were available. Critical pressures and temperatures of the components and correlations and parameters for calculating ideal-gas heat capacities were taken from Terron (2017). The prediction accuracy for both molar volume and enthalpy was measured
ANDRÉ F. GONÇALVES, ESLY F. DA COSTA JUNIOR & ANDRÉA O.S. DA COSTA ENTHALPY AND VOLUME CALCULATIONS OF NATURAL GASES
An Acad Bras Cienc (2020) 92(3) e20190603 7 | 16
Table V. Composition, pressure and temperature range of the mixtures used for enthalpy variation prediction.
ANDRÉ F. GONÇALVES, ESLY F. DA COSTA JUNIOR & ANDRÉA O.S. DA COSTA ENTHALPY AND VOLUME CALCULATIONS OF NATURAL GASES
An Acad Bras Cienc (2020) 92(3) e20190603 8 | 16
by calculating the average absolute deviation (%AAD) - given by equations 21 and 22 – and maximum absolute deviation (max. %AD) – given by equations 23 and 24.
( ) ( )( )
1% 100%expN
calc exp
iexp exp
h i h iAAD
N h i
∆ −∆ = × × ∆
∑ (21)
( ) ( )( )
1% 100%expN
calc exp
iexp exp
v i v iAAD
N v i
− = × ×
∑ (22)
( ) ( )( )
.% max 100%calc exp
iexp
h i h imax AD
h i
∆ −∆ = × ∆
(23)
( ) ( )( )
.% max 100%calc exp
iexp
v i v imax AD
v i
− = ×
(24)
where Nexp is the number of experimental points.
RESULTS
The volumes of the natural gas samples – GN1 to GN10 – were calculated by solving equation 1 for v. Table VI comprises calculated volumes for the mixture GN10, as an example.
The smallest deviations were obtained with the Saffari-Zahedi extended model, as seen in Table VI. Apart from that model, for the first four experimental points, the inclusion of the BIPs resulted in a small improvement in the prediction of specific volumes. The effects associated with the difference in size and polarity between the molecules of hydrocarbons and the molecules of nitrogen and carbon dioxide seem to become more intense as the temperature decreases. Up from 249.996 K the effect of including the BIPs
Table VI. Experimental and calculated molar volumes for mixture GN10.
ANDRÉ F. GONÇALVES, ESLY F. DA COSTA JUNIOR & ANDRÉA O.S. DA COSTA ENTHALPY AND VOLUME CALCULATIONS OF NATURAL GASES
An Acad Bras Cienc (2020) 92(3) e20190603 9 | 16
is surpassed by the better adjustment of the Coquelet model.
The average deviations between the experimental and predicted volumes for all mixtures and the alpha function used in the predictions are shown in Table VII.
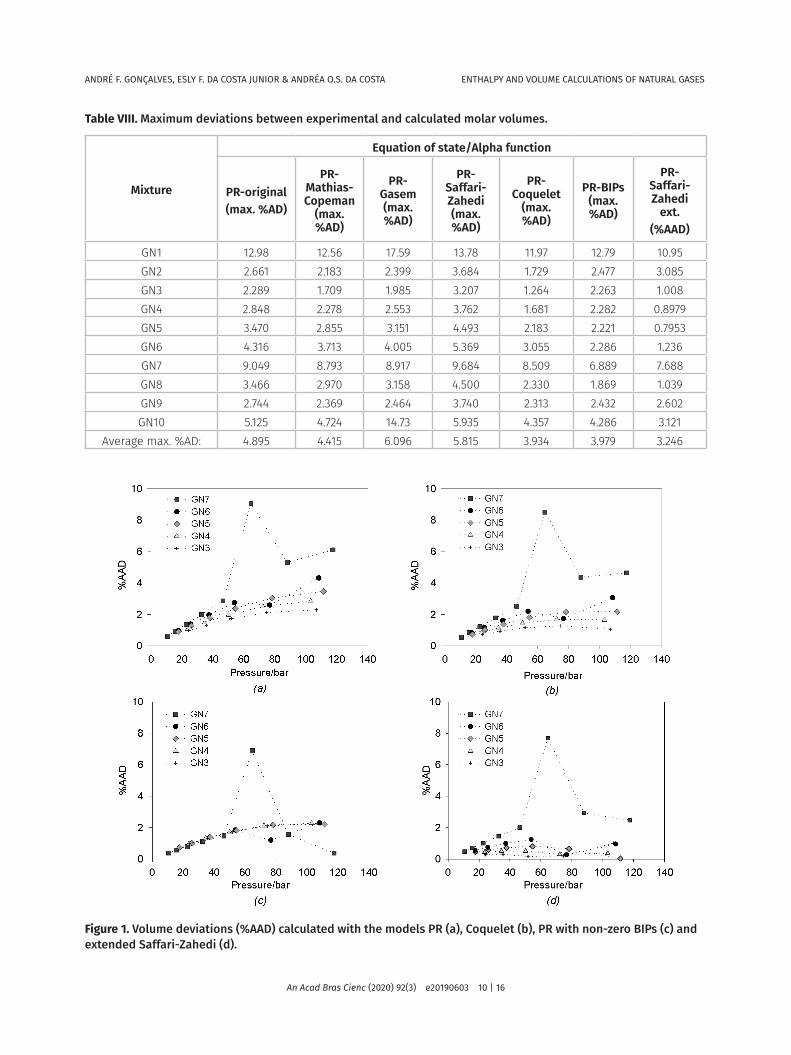
Table VIII presents the maximum absolute deviation of each mixture, employing different alpha-functions.
The mixtures GN3, GN4, GN5 and GN6 differ essentially by the concentration of carbon dioxide, being all under the same temperature, 310 K. As this concentration increases, an increase in the deviations of the models for which the binary interaction parameters are equal to zero becomes evident. This trend was also observed by Li et al. (2016), who suggest that large deviations between experimental and calculated compressibility factors may occur when the PR EoS is applied to high CO2-content natural gas mixtures, especially when the CO2
mole fraction exceeds 10%. Only for the mixture GN7, whose concentration of carbon dioxide exceeds 50% and methane concentration is less
than 45%, the effect of including BIPs becomes more significant than the adjustment of the alpha function proposed for methane, as seen in figures 1a, 1b, 1c and 1d. Figures 1a and 1b illustrate the behavior of the original PR EoS and the Coquelet model, respectively. Figure 1c and 1d represent the PR EoS with non-zero BIPs and extended Saffari-Zahedi model, in that order.
The effects of a temperature increase can be analyzed with the data of the mixtures GN1, GN8 and GN9. For GN1 an increase in temperature results in reduction of deviations for 4 of the 5 original models for each pressure value analyzed (figures 2a, 2b, 2c and 2d). The Gasem model do not follow a similar trend (figure 2e). For the extended model, there is a pressure range (100kPa-250kPa) in which an increase in temperature causes the deviation to increase. Above this range, the trend is the same as that described for the first 4 models. The point within the curve of 444.26 K with an abnormally small deviation is believed to be an outlier.
In the case of the pair GN8-GN9, the same reduction trend can be verified for pressures
Table VII. Deviations of experimental and calculated molar volumes.
Average max. %AD: 4.895 4.415 6.096 5.815 3.934 3.979 3.246
Figure 1. Volume deviations (%AAD) calculated with the models PR (a), Coquelet (b), PR with non-zero BIPs (c) and extended Saffari-Zahedi (d).
ANDRÉ F. GONÇALVES, ESLY F. DA COSTA JUNIOR & ANDRÉA O.S. DA COSTA ENTHALPY AND VOLUME CALCULATIONS OF NATURAL GASES
An Acad Bras Cienc (2020) 92(3) e20190603 11 | 16
up from 50 bar (figure 3). An exception is the extended model (figure 3f), for which deviations are slightly bigger for higher temperatures in the pressure range 0-120 kPa. Though the point corresponding to the pressure of 34.83 bar is expected to be an outlier, more experimental points in the pressure range from 20 bar to 50 bar would be needed in order to draw a conclusion.
For enthalpy calculation, the same alpha functions were used. The models were employed for the calculation of the parameter a(T), in equation 14. Mixing rules given by equations from 7 to 9 were also used. Table IX comprises the deviations for mixtures with no phase change while Table X contains results only for gas-liquid transitions.
The results from tables VI to X indicate that the inclusion of binary parameters in the mixing rules must be analyzed carefully, since the prediction accuracy is affected by temperature and concentrat ion of incondensable components. When such components – in this work, N2 and CO2 – are present in high concentrations, the incorporation of BIPs results in improvements in the prediction of volumes and enthalpies. When not, adjusting the alpha function to volumetric data of supercritical methane produces better volume estimations.
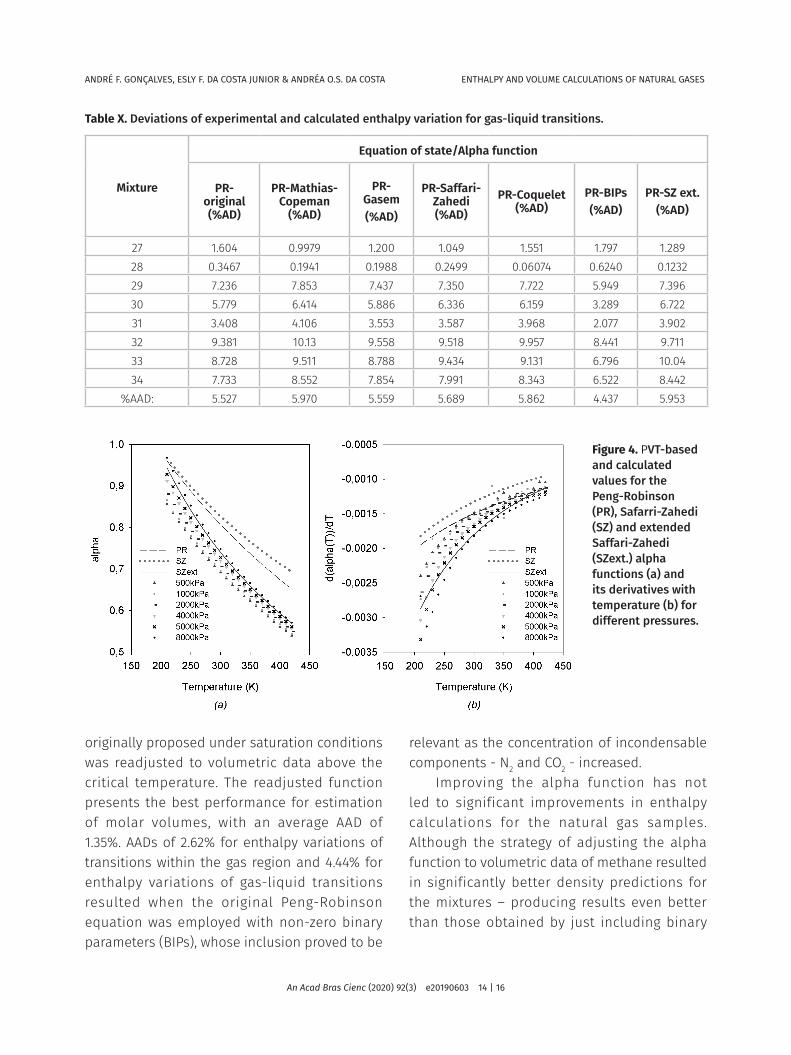
Changing the alpha function, however, does not improve significantly the enthalpy predictions. Actually, adjusting the alpha function to density data of methane can even produce worst enthalpy predictions, as seen for the Saffari-Zahedi extended model. A possible explanation would be a poor representation of the derivatives of the alpha functions with temperature, despite a good adjustment of the alpha function itself, since the residual enthalpy depends on both the alpha function and on its first derivative, as seen in equation 14. However, an examination of expected values for the alpha function and for its derivative suggests this is
Figure 2. Volume deviations (%AAD) of mixture GN1 calculated with the models PR with non-zero BIPs (a), Coquelet (b), Saffari-Zahedi (c), Mathias-Copeman (d), Gasem (e) and extended Saffari-Zahedi (f).
ANDRÉ F. GONÇALVES, ESLY F. DA COSTA JUNIOR & ANDRÉA O.S. DA COSTA ENTHALPY AND VOLUME CALCULATIONS OF NATURAL GASES
An Acad Bras Cienc (2020) 92(3) e20190603 12 | 16
not a good hypothesis. Both are represented in figure 4. Figure 4a was generated by isolating the term corresponding to the alpha function in the PR EoS and calculating its value in order to represent the PVT data from Setzmann & Wagner (1991). In figure 4b, the derivatives for each pressure were calculated by using finite differences approach, with a step size of 10 K. Although the extended model is relatively well
adjusted to the PVT-based curves (figure 4a) and the derivative presents the same tendency of monotonic increment as the other curves (figure 4b), using this model and its derivative led to worse predictions of enthalpy for the natural gas samples.
The inclusion of binary parameters has also a small effect on enthalpy calculation for processes in the gas region. When phase transitions are
Table IX. Deviations of experimental and calculated enthalpy variation for gas-gas transitions.
ANDRÉ F. GONÇALVES, ESLY F. DA COSTA JUNIOR & ANDRÉA O.S. DA COSTA ENTHALPY AND VOLUME CALCULATIONS OF NATURAL GASES
An Acad Bras Cienc (2020) 92(3) e20190603 13 | 16
presented, however, their inclusion results in more meaningful improvements, as seen in Table X.
In comparison with the calculations performed by Ashton & Haselden (1980) and except for the Saffari-Zahedi extended model, the enthalpy average deviations related to gas-gas transitions in this work were smaller than those calculated with the BWR (Benedict-Webb-Rubin) equation, with original and modified mixing rules – which resulted in deviations of 3.16% and 3.12%. Employing the generalized BWRS (Benedict-Webb-Rubin-Starling) equation with non-zero BIPs, the authors obtained an average deviation of 2.52%, which is slightly smaller than the average deviation when the PR EoS is applied with non-zero BIPs (2.62%). For gas-liquid transitions, the biggest average deviation in this work - 5.95% - was significantly smaller than that of the article previously mentioned – 9%, in the best case. As the best result, an average deviation of 4.44% was obtained with the PR-BIPs model.
CONCLUSIONS
Simulation and design of processes commonly found in the natural gas industry require accurate prediction of thermodynamic properties. For this purpose, cubic equations of state are commonly used in the industry, given the favorable balance between precision and computational time they offer. In this work, it was investigated if a better performance of the Peng-Robinson equation could be achieved by improving the temperature dependence relation – or alpha function – of its attraction parameter.
Based on experimental data, five different alpha functions were evaluated for the prediction of molar volume and enthalpy of natural gas samples. For methane, the Saffari-Zahedi model
Figure 3. Volume deviations (%AAD) of mixtures GN8 and GN9, calculated with the models PR with non-zero BIPs (a), Coquelet (b), Saffari-Zahedi (c), Mathias-Copeman (d), Gasem (e) and extended Saffari-Zahedi (f).
ANDRÉ F. GONÇALVES, ESLY F. DA COSTA JUNIOR & ANDRÉA O.S. DA COSTA ENTHALPY AND VOLUME CALCULATIONS OF NATURAL GASES
An Acad Bras Cienc (2020) 92(3) e20190603 14 | 16
Table X. Deviations of experimental and calculated enthalpy variation for gas-liquid transitions.
Figure 4. PVT-based and calculated values for the Peng-Robinson (PR), Safarri-Zahedi (SZ) and extended Saffari-Zahedi (SZext.) alpha functions (a) and its derivatives with temperature (b) for different pressures.
originally proposed under saturation conditions was readjusted to volumetric data above the critical temperature. The readjusted function presents the best performance for estimation of molar volumes, with an average AAD of 1.35%. AADs of 2.62% for enthalpy variations of transitions within the gas region and 4.44% for enthalpy variations of gas-liquid transitions resulted when the original Peng-Robinson equation was employed with non-zero binary parameters (BIPs), whose inclusion proved to be
relevant as the concentration of incondensable components - N2 and CO2 - increased.
Improving the alpha function has not led to significant improvements in enthalpy calculations for the natural gas samples. Although the strategy of adjusting the alpha function to volumetric data of methane resulted in significantly better density predictions for the mixtures – producing results even better than those obtained by just including binary
ANDRÉ F. GONÇALVES, ESLY F. DA COSTA JUNIOR & ANDRÉA O.S. DA COSTA ENTHALPY AND VOLUME CALCULATIONS OF NATURAL GASES
An Acad Bras Cienc (2020) 92(3) e20190603 15 | 16
parameters in the original equation –, it has worsened the enthalpy predictions.
AcknowledgmentsThe authors are grateful to Conselho Nacional do Desenvolvimento Científico e Tecnológico (CNPq) – and Fundação de Amparo à Pesquisa do Estado de Minas Gerais (FAPEMIG, TEC-APQ-00914-16) – for the financial support.
REFERENCES
ABUDOUR AM, MOHAMMAD SA, ROBINSON RL & GASEM KA. 2014. Generalized binary interaction parameters for the Peng–Robinson equation of state. Fluid Phase Equilibr 383: 156-173.
ASHTON GJ & HASELDEN GG. 1980. Measurements of enthalpy and phase equilibrium for simulated natural gas mixtures and correlation of the results by a modified Starling equation. Cryogenics 20: 41-47.
COQUELET C, CHAPOY A & RICHON D. 2004. Development of a new alpha function for the Peng-Robinson equation of state: Comparative study of alpha function models for pure gases (natural gas components) and water-gas systems. Int J Thermphys 25: 133-158.
DANESH A, XU DH, TEHRANI DH & TODD AC. 1995. Improving predictions of equation of state by modifying its parameters for super critical components of hydrocarbon reservoir fluids. Fluid Phase Equilibr 112: 45-61.
FLÖTER E, DE LOOS TW & DE SWAAN ARONS J. 1998. Improved modeling of the phase behavior of asymmetric hydrocarbon mixtures with the Peng-Robinson equation of state using a different temperature dependency of the parameter. Ind Eng Chem Res 37: 1651-1662.
GASEM KA, GAO W, PAN Z & ROBINSON RL. 2001. A modified temperature dependence for the Peng-Robinson equation of state. Fluid Phase Equilibr 181: 113-125.
HANNISDAL NE. 1987. Gas Compression Equations Evaluated. Oil Gas J: 38-41.
LEE AL, GONZALEZ MH & EAKIN BE. 1966. The Viscosity of Natural Gases. J Petrol Technol 18: 997-1000.
LI Z, JIA W & LI C. 2016. An improved PR equation of state for CO2-containing gas compressibility factor calculation. J Nat Gas Sci Eng 36: 586-596.
MAGEE JW, HAYNES WM & HIZA MJ. 1997. Isochoric (p,ρ,T) measurements for five natural gas mixtures from T =
(225 to 350) K at pressures to 35 MPa. J Chem Thermodyn 29: 1439-1454.
MATHIAS PM & COPEMAN TW. 1983. Extension of the Peng-Robinson equation of state to complex mixtures: Evaluation of the various forms of the local composition concept. Fluid Phase Equilibr 13: 91-108.
NEAU E, RASPO I, ESCANDELL J, NICOLAS C & HERNÁNDEZ-GARDUZA O. 2009. The Soave, Twu and Boston-Mathias alpha functions in cubic equations of state. Part II. Modeling of thermodynamic properties of pure compounds. Fluid Phase Equilibr 276: 156-164.
NOVAK N, LOULI V, SKOURAS S & VOUTSAS E. 2018. Prediction of dew points and liquid dropouts of gas condensate mixtures. Fluid Phase Equilibr 457: 62-73.
PENG DY & ROBINSON DB. 1976. A New Two-Constant Equation of State. Ind Eng Chem Fundam 15: 59-64.
QYYUM MA, QADEER K & LEE M. 2018. Comprehensive Review of the Design Optimization of Natural Gas Liquefaction Processes: Current Status and Perspectives. Ind Eng Chem Res 57: 5819-5844.
RIJKERS RP. 1991. Retrograde condensation of lean natural gas. Doctoral dissertation, Delft University of Technology. Available on: http://resolver.tudelft.nl/uuid:b650a7fd-0cb0-4396-9826-3d8731fadb09.
SAFFARI H & ZAHEDI A. 2013. A new alpha-function for the Peng-Robinson equation of state: Application to natural gas. Chinese J Chem Eng 21: 1155-1161.
SETZMANN U & WAGNER WA.1991. New Equation of State and Tables of Thermodynamic Properties for Methane Covering the Range from the Melting Line to 625 K at Pressures up to 100 MPa. J Phys Chem Ref Data 20: 1061-1155.
SIMON PP, HWANG CA, HOU H, HALL KR & HOLSTE JC. 1997. Burnett and pycnometric (p,Vm,T) measurements for natural gas mixtures. J Chem Thermodyn 29: 1455-1472.
SOAVE G. 1972. Equilibrium constants from a modified Redlich-Kwong equation of state. Chem Eng Sci 27: 1197-1203.
TERRON LR. 2017. Propriedades dos fluidos derivados de petróleo, 1a ed., LTC-Livros Técnicos e Científicos Editora Ltda, 524 p.
TREBBLE MA & BISHNOI PR. 1987. Development of a new four-parameter cubic equation of state. Fluid Phase Equilibr 35: 1-18.
ANDRÉ F. GONÇALVES, ESLY F. DA COSTA JUNIOR & ANDRÉA O.S. DA COSTA ENTHALPY AND VOLUME CALCULATIONS OF NATURAL GASES
An Acad Bras Cienc (2020) 92(3) e20190603 16 | 16
TWU CH, COON JE & CUNNINGHAM JR. 1996. An approach for the application of a cubic equation of state to hydrogen-hydrocarbon systems. Ind Eng Chem Res 35: 905-910.
U.S. EIA. 2016. Energy Information Administration. International Energy Outlook 2016 Liquid fuels [online]. Available on: https://www.eia.gov/outlooks/ieo/pdf/0484(2016).pdf. Accessed 20.11.2018.
VESTFÁLOVÁ M. 2017. Possibility of derivation of energetic state variables from simplified BWR thermal state equation for water and water steam. EPJ Web Conf. 143: 1-8.
WANG M, ZANG J, XU Q & LI K. 2011. Thermodynamic-analysis-based energy consumption minimization for natural gas liquefaction. Ind Eng Chem Res 50: 12630-12640.
YOUNGLOVE BA & ELY JF. 1987. Thermophysical Properties of Fluids. II. Methane, Ethane, Propane, Isobutane, and Normal Butane. J Phys Chem Ref Data 16: 577-798.
YUAN Z, CUI M, SONG R & XIE Y. 2015. Evaluation of prediction models for the physical parameters in natural gas liquefaction processes. J Nat Gas Sci Eng 27: 876-886.
How to citeGONÇALVES AF, COSTA AOS & COSTA JUNIOR EF. 2020. Comparison of modified alpha functions of the PR-EoS for volume and enthalpy prediction of natural gases. An Acad Bras Cienc 92: e20190603. DOI 10.1590/0001-3765202020190603.
Manuscript received on May 24, 2019; accepted for publication on July 11, 2019
ANDRÉ F. GONÇALVES https://orcid.org/0000-0002-2302-4801
ANDRÉA O.S. DA COSTAhttps://orcid.org/0000-0002-6763-9752
ESLY F. DA COSTA JUNIORhttps://orcid.org/0000-0002-9245-4223
Universidade Federal de Minas Gerais, Chemical Engineering Program, Departamento de Engenharia Química, Av. Pres. Antônio Carlos 6627, Pampulha, 31270-901 Belo Horizonte, MG, Brazil
Correspondence to: Andréa Oliveira Souza da CostaE-mail: [email protected]
Author contributionsAndré de Freitas Gonçalves proposed the analysis of the influence of alpha-functions on calculations of thermodynamic properties of natural gas samples and implemented the main codes. Esly Ferreira da Costa Jr. suggested numerical procedures regarding the adjustment of alpha-function parameters. Andréa Oliveira Souza da Costa was mainly responsible for the thermodynamic analysis of the results.


![OWNER’S MANUAL - Brystonbryston.com/PDF/Manuals/300026[BDP1].pdfPower.Switch.and.LED.Indicator. ... Bryston-MINI web app for mobile devices running ... es and alpha-numeric/dot matrix](https://static.documents.pub/doc/80x56/5ae6d7ab7f8b9a8b2b8dcaf0/owners-manual-bdp1pdfpowerswitchandledindicator-bryston-mini-web.jpg)


