Watson Comparison of motion blur measurement methods 11/13/2008 SID 2009 1 Comparison of motion blur measurement methods Motion blur is a significant display property for which accurate, valid measurement methods are needed. Recent measurements of a set of eight displays by a set of six measurement devices provide an opportunity to evaluate techniques of measurement and of the analysis of those measurements. Keywords Motion blur, LCD, BET, MPRT, EBET, metrology, display quality Andrew B. Watson Senior Scientist for Vision Research NASA Ames Research Center MS 262‐2 Moffett Field, CA 94035‐1000 (650) 604‐5419 (650) 604‐3323 fax [email protected]http://vision.arc.nasa.gov/ a) Oral presentation preferred b) Symposium topic: Display measurement c) Main author is not a student https://ntrs.nasa.gov/search.jsp?R=20110003569 2018-06-22T23:48:31+00:00Z
Transcript
Watson Comparison of motion blur measurement methods
Watson Comparison of motion blur measurement methods
11/13/2008 SID 2009 2
Objective and Background Many modern display technologies, notably LCD, are subject to motion blur. Motion blur arises when the eye
tracks a moving image, while the display presents individual frames that persist for significant fractions of a frame duration, or longer. As a result, the image is smeared across the retina during the frame duration.
There have been a number of attempts to characterize motion blur in a systematic and meaningful way. Most of these involve estimating the width of an edge subjected to motion blur. This estimation can be achieved in any of three ways(Becker, 2008; Feng et al., 2008). The first employs a pursuit camera that tracks an edge between two graylevels as it moves across the screen. The camera is simulating the eye as it pursues the moving edge. The result, after averaging over time, is a picture of the blurred edge. After averaging over the dimension orthogonal to the motion, a one-dimensional waveform representing the cross-section of the blurred edge can be obtained. We will call this the motion-blurred edge (MBE). The width of this edge is usually proportional to the speed of motion, so it is conventional to rescale the spatial domain of the edge (pixels) by dividing by the speed (pixels/frame) to obtain a waveform that is a function of time (frames). We call this the normalized motion-blurred edge (NMBE). It is also conventional to characterize the width of the NMBE in terms of the time interval (msec) between 10% and 90% points of the curve. This quantity is called the blur edge time (BET).
The second method employs a stationary high-speed camera. With a sufficiently high frame rate, it is possible to capture a sequence of frames, that, with appropriate shifting and adding, can also yield a record of the MBE. The high-speed camera avoids the mechanical challenges of the pursuit camera. The third method employs a fixed non-imaging detector such as a photodiode which measures the luminance over time as the display is switched from one graylevel to another. This temporal step response can then be convolved with a pulse of one frame duration to obtain another version of the NMBE (Watson, 2006). This last method relies on an assumption that all pixels are independent. It has been demonstrated to be accurate in many cases (Becker, 2008; Feng et al., 2008).
Outstanding questions remain regarding the accuracy and agreement among these various methods, and also regarding the analysis of the NMBE waveform. In February 2008 a unique opportunity was provided to address some of these questions. Under the auspices of the International Committee on Display Measurement (Miseli, 2008), an experiment was conducted in which eight flat panel displays were measured by six different motion blur measuring instruments. The testing facility was provided by Samsung, Inc, in Seoul, Korea. The objective of this report is to discuss preliminary results from that experiment. The primary focus will be on the degree of agreement among methods, and on the analysis of the NMBE.
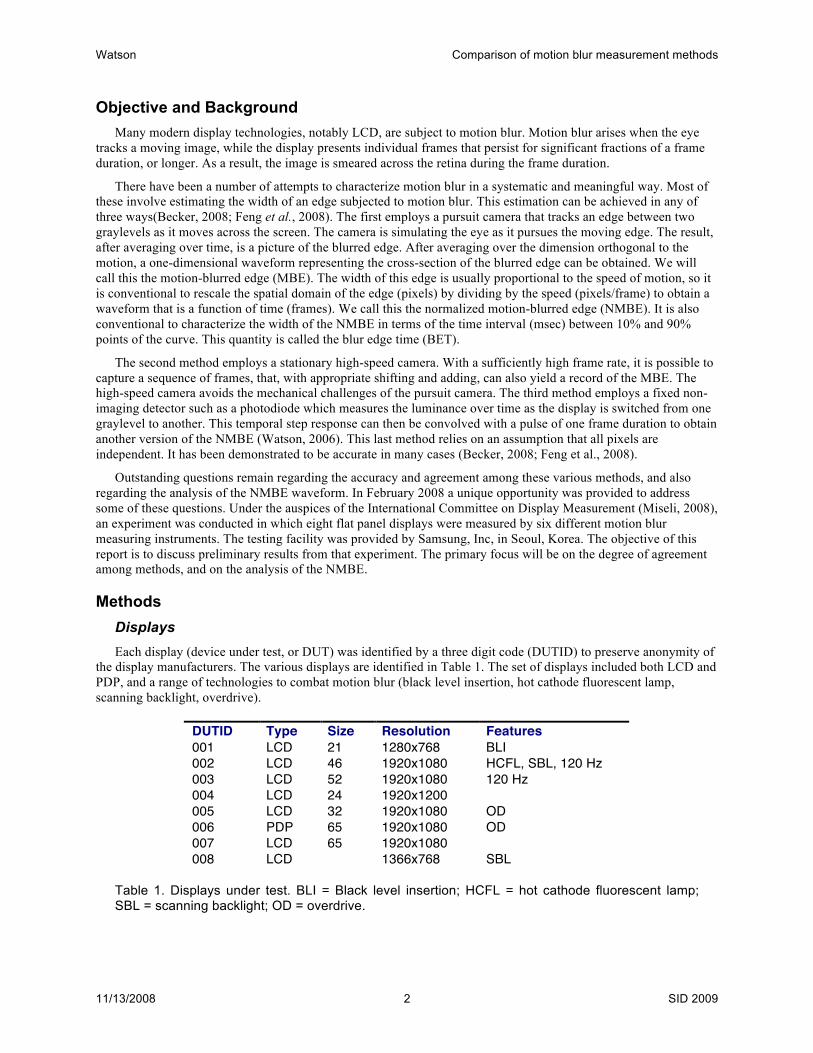
Methods Displays Each display (device under test, or DUT) was identified by a three digit code (DUTID) to preserve anonymity of
the display manufacturers. The various displays are identified in Table 1. The set of displays included both LCD and PDP, and a range of technologies to combat motion blur (black level insertion, hot cathode fluorescent lamp, scanning backlight, overdrive).
DUTID Type Size Resolution Features 001 LCD 21 1280x768 BLI 002 LCD 46 1920x1080 HCFL, SBL, 120 Hz 003 LCD 52 1920x1080 120 Hz 004 LCD 24 1920x1200 005 LCD 32 1920x1080 OD 006 PDP 65 1920x1080 OD 007 LCD 65 1920x1080 008 LCD 1366x768 SBL
Table 1. Displays under test. BLI = Black level insertion; HCFL = hot cathode fluorescent lamp; SBL = scanning backlight; OD = overdrive.
Watson Comparison of motion blur measurement methods
11/13/2008 SID 2009 3
Measurement devices The six light measurement devices (LMD) are described in Table 2. Each is identified by a code (LMDID) in
order to preserve anonymity of the methods.
LMDID Method 120560 High speed camera 222498 Time response 240456 High speed camera 505301 High speed camera 616000 Pursuit camera 979225 Pursuit camera
Table 2. Motion blur measurement devices.
Procedures The eight displays were assembled in one large room. Each team associated with one LMD collected
measurements with their device from as many displays as possible over the course of two days. Room illumination was dim but not precisely controlled. Following the experiment, data were submitted electronically to the author for analysis.
The experimental conditions consisted of 20 gray-gray transitions, consisting of the pair-wise combinations of graylevels 0, 91, 139, 150, and 255. Two speeds of edge motion were used: 8 and 16 pixels/frame. The basic data requested of each team were 1) estimates of BET, and 2) MBE waveforms for each of the 40 conditions.
Waveform standardization Before further analysis, all submitted waveforms were converted to a standard form. Some were submitted as
temporal step responses, which were converted to NMBE by convolution with a pulse of duration one frame. Some waveforms were submitted as a blurred pulse, rather than a blurred edge. These were split into leading and trailing blurred edges. Finally, all MBE for both edge speeds were converted to NMBE.
Results A total of 36 data sets were obtained, each consisting of a particular LMD applied to a particular DUT.
Altogether, these comprised 1434 NMBE, and 1299 BET estimates (some teams did not submit BET data for certain conditions). An example of one NMBE is shown in Figure 1. This particular NMBE, shown by the blue points, exhibits considerable noise. This is largely because this is a small transition between nearby graylevels (139-150). Note that the curve is expressed (like all NMBE) as a function of time in frames.
Figure 1. Example of NMBE (blue points) with fitted Gaussian (red curve). Luminance is in fractions of the peak display luminance. The estimate of sigma is shown. This particular waveform is from a transition between graylevels 139 and 150, for DUTID 001 and LMDID 616000.
To provide a summary description of each curve, we have fit it with a cumulative Gaussian of the form
0 1
0.20
0.21
0.22
0.23
0.24
0 1
Frame
RelativeLuminance
! " 0.2539
Watson Comparison of motion blur measurement methods
11/13/2008 SID 2009 4
�
GE x( ) = L + R − L( ) 12πσ
exp- t -µ( )22σ 2
⎡
⎣ ⎢ ⎢
⎤
⎦ ⎥ ⎥ −∞
x
∫ dt (Equation 1)
where L and R are the relative luminances to the left and right of the transition, and µ and σ are the mean and standard deviation of the Gaussian. The parameter σ is a useful estimate of the width of the Gaussian. It can easily be converted to an estimate of BET. The Gaussian provided a reasonable fit to nearly all of 1434 NMBE.
BET Results We collected a total of 1299 BET estimates from the measurement teams. These were derived by each team
through proprietary analyses of their own instrument data. An example of one set is shown in Figure 2. It shows BET as a function of the beginning and ending graylevels of the edge. In this particular case, there is considerable variation in BET with graylevel.
Figure 2. BET data for 8 pixel/frame for LMDID 120560 and DUTID 004.
To provide a summary picture of these results, we have computed the mean and standard deviation, over both graylevel pair and edge speed, for each combination of LMD and DUT. It must be borne in mind that this measure mixes both variation due to measurement error and due to genuine differences in BET with speed or graylevel. These values are shown for all BET data in Figure 3.
Figure 3. Mean and standard deviation of BET estimates for eight DUT and six LMD.
This figure shows that mean BET varies from about 7 to about 22 msec over the various displays. However, it also shows that there are significant differences among LMD when measuring the same DUT. These differences are evident both in the mean value, which may differ by as much as 90%, and also in the estimates of variation.
0
100
200
Begin
0
100
200
End
0
10
20
30
40
BET!msec"
120560
222498
240456
505301
616000
979225
1 2 3 4 5 6 7 80
5
10
15
20
25
301 2 3 4 5 6 7 8
DUTID
BET!mse
c"
Watson Comparison of motion blur measurement methods
11/13/2008 SID 2009 5
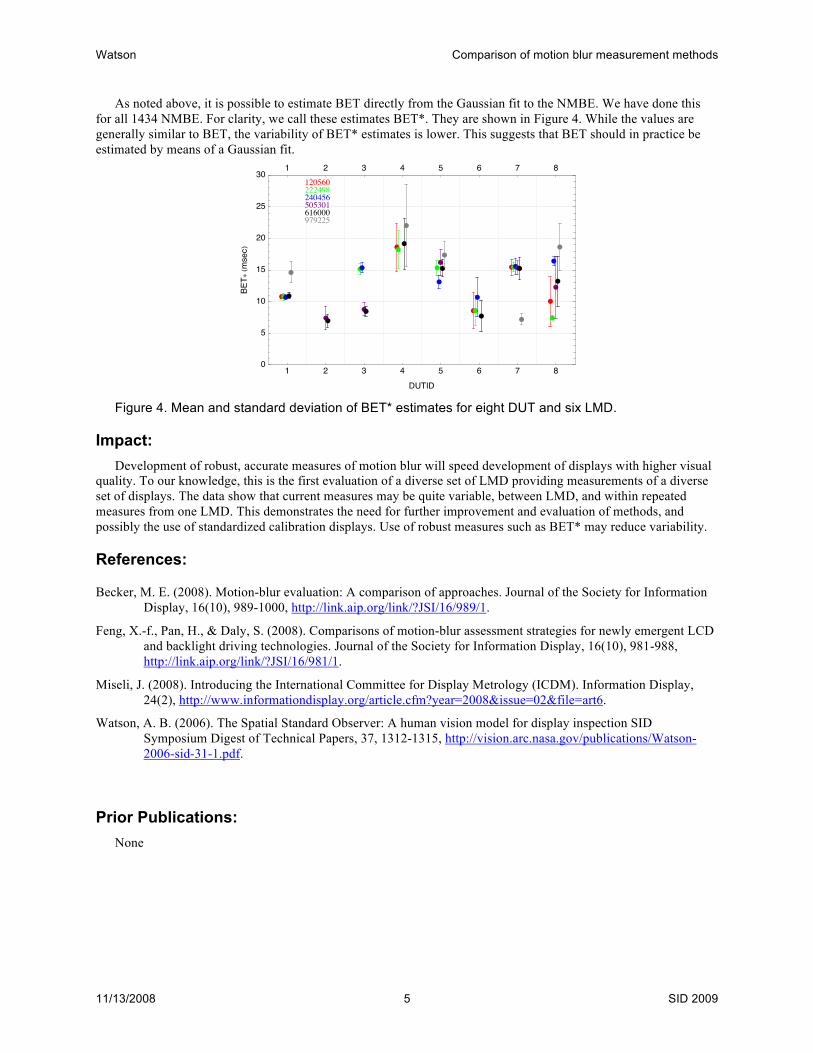
As noted above, it is possible to estimate BET directly from the Gaussian fit to the NMBE. We have done this for all 1434 NMBE. For clarity, we call these estimates BET*. They are shown in Figure 4. While the values are generally similar to BET, the variability of BET* estimates is lower. This suggests that BET should in practice be estimated by means of a Gaussian fit.
Figure 4. Mean and standard deviation of BET* estimates for eight DUT and six LMD.
Impact: Development of robust, accurate measures of motion blur will speed development of displays with higher visual
quality. To our knowledge, this is the first evaluation of a diverse set of LMD providing measurements of a diverse set of displays. The data show that current measures may be quite variable, between LMD, and within repeated measures from one LMD. This demonstrates the need for further improvement and evaluation of methods, and possibly the use of standardized calibration displays. Use of robust measures such as BET* may reduce variability.
References:
Becker, M. E. (2008). Motion-blur evaluation: A comparison of approaches. Journal of the Society for Information Display, 16(10), 989-1000, http://link.aip.org/link/?JSI/16/989/1.
Feng, X.-f., Pan, H., & Daly, S. (2008). Comparisons of motion-blur assessment strategies for newly emergent LCD and backlight driving technologies. Journal of the Society for Information Display, 16(10), 981-988, http://link.aip.org/link/?JSI/16/981/1.
Miseli, J. (2008). Introducing the International Committee for Display Metrology (ICDM). Information Display, 24(2), http://www.informationdisplay.org/article.cfm?year=2008&issue=02&file=art6.
Watson, A. B. (2006). The Spatial Standard Observer: A human vision model for display inspection SID Symposium Digest of Technical Papers, 37, 1312-1315, http://vision.arc.nasa.gov/publications/Watson-2006-sid-31-1.pdf.