COMPARISON OF NASTRAN AND STARDYNE STATIC ANALYSIS OF A GRAPHITE FIBER REINFORCED PLASTIC TRUSS STRUCTURE By George H. Honeycutt, Frank J. On, and Stuart L. Hanlein NASA Goddard Space Flight Center SUMMARY A static and buckling analysis of the ATS-F&G spacecraft reflector support truss (RST) and bridge truss assembly using NASTRAN has been conducted. The RST is fabricated from a new material, graphite fiber reinforced plastic. A comparison is made with the NASTRAN results and the results of a similar analysis conducted using the STARDYNE program. The results of an actual static load test are also compared. INTRODUCTION The ATS-F&G are a new generation of communication space- craft. The predominate feature of these spacecraft is a 30 foot parabolic dish high gain antenna as can be seen in Figure 1. The reflector dish must be accurately aligned with the feed system and this alignment must be held throughout the spacecraft life. Because of this rigid alignment requirement, a new material, graphite fiber reinforced plastic (GFRP),was selected for the reflector support truss (RST) between the feed system and the parabolic reflector. The GFRP was chosen because of its extremely low coefficient of thermal expansion and its high stiffness to weight ratio. Because of the newness of the material, particularly in an application as primary structure, there was concern about its capability to carry the launch loads. The present NASTRAN analysis was conducted to evaluate deflections, internal loads, and verify the adequacy of the RST design. During launch the reflector dish is wound around a hub and the solar arrays are folded down as shown in Figure 2. In this configuration, the RST structure must support approximately 180 kilograms at the top. Static acceleration loads were applied to the RST structure as enveloping the dynamic loads during launch. The load cases were applied 9.Og thrust plus 3.9g lateral and -3.9g thrust plus 3.9g lateral. The desired results of the analysis were the buckling strength, internal member loads, and deflections. 303 https://ntrs.nasa.gov/search.jsp?R=19720025236 2020-05-19T03:44:49+00:00Z
Transcript
COMPARISON OF NASTRAN AND STARDYNE STATIC ANALYSIS OF A GRAPHITE FIBER REINFORCED PLASTIC TRUSS STRUCTURE
By George H. Honeycutt, Frank J. On, and Stuart L. Hanlein
NASA Goddard Space Flight Center
SUMMARY
A static and buckling analysis of the ATS-F&G spacecraft reflector support truss (RST) and bridge truss assembly using NASTRAN has been conducted. The RST is fabricated from a new material, graphite fiber reinforced plastic. A comparison is made with the NASTRAN results and the results of a similar analysis conducted using the STARDYNE program. The results of an actual static load test are also compared.
INTRODUCTION
The ATS-F&G are a new generation of communication space- craft. The predominate feature of these spacecraft is a 30 foot parabolic dish high gain antenna as can be seen in Figure 1. The reflector dish must be accurately aligned with the feed system and this alignment must be held throughout the spacecraft life. Because of this rigid alignment requirement, a new material, graphite fiber reinforced plastic (GFRP),was selected for the reflector support truss (RST) between the feed system and the parabolic reflector. The GFRP was chosen because of its extremely low coefficient of thermal expansion and its high stiffness to weight ratio. Because of the newness of the material, particularly in an application as primary structure, there was concern about its capability to carry the launch loads. The present NASTRAN analysis was conducted to evaluate deflections, internal loads, and verify the adequacy of the RST design.
During launch the reflector dish is wound around a hub and the solar arrays are folded down as shown in Figure 2. In this configuration, the RST structure must support approximately 180 kilograms at the top. Static acceleration loads were applied to the RST structure as enveloping the dynamic loads during launch. The load cases were applied 9.Og thrust plus 3.9g lateral and -3.9g thrust plus 3.9g lateral. The desired results of the analysis were the buckling strength, internal member loads, and deflections.
The prime contractor for the ATS-F&G is Fairchild Industries (FI). They have used the STARDYNE program to conduct a similar analysis (Ref. 1) which allowed a comparison of results. Hercules Incorporated is the subcontractor for the RST. The results of a qualification static loads test conducted by Hercules (Ref. 2) also provided test information for comparison.
NASTRAN STATIC ANALYSIS
The results of the static analysis were obtained using Rigid Format One in the NASTRAN program. finite elements used in synthesizing the NASTRAN model of the RST and bridge truss assembly. The overall model had 107 grid points, 2 0 0 elements and 618 degrees of freedom. Note that the dots (grid points) represent the selected points at which discrete masses are assumed to be concentrated, and the lines connecting these points represent bar elements.
Figures 3 and 4 depict the
In the analyses, the RST structure was assumed to be fixed to ground via the support fittings at the Earth Viewing Module (EVM). The material in the hub, bridge truss, reflector support ring and RST stabilizer is 6061-T6 aluminum. The material for the RST is graphite fiber reinforced plastic (GFRP) . Element forces, bending moments, stresses, margins of safety and grid point deflections were obtained for two cases (Table 1) of applied loading. The two cases of loading corresponded to force and moment inputs at specific grid points and were derived from the acceleration loadings shown.
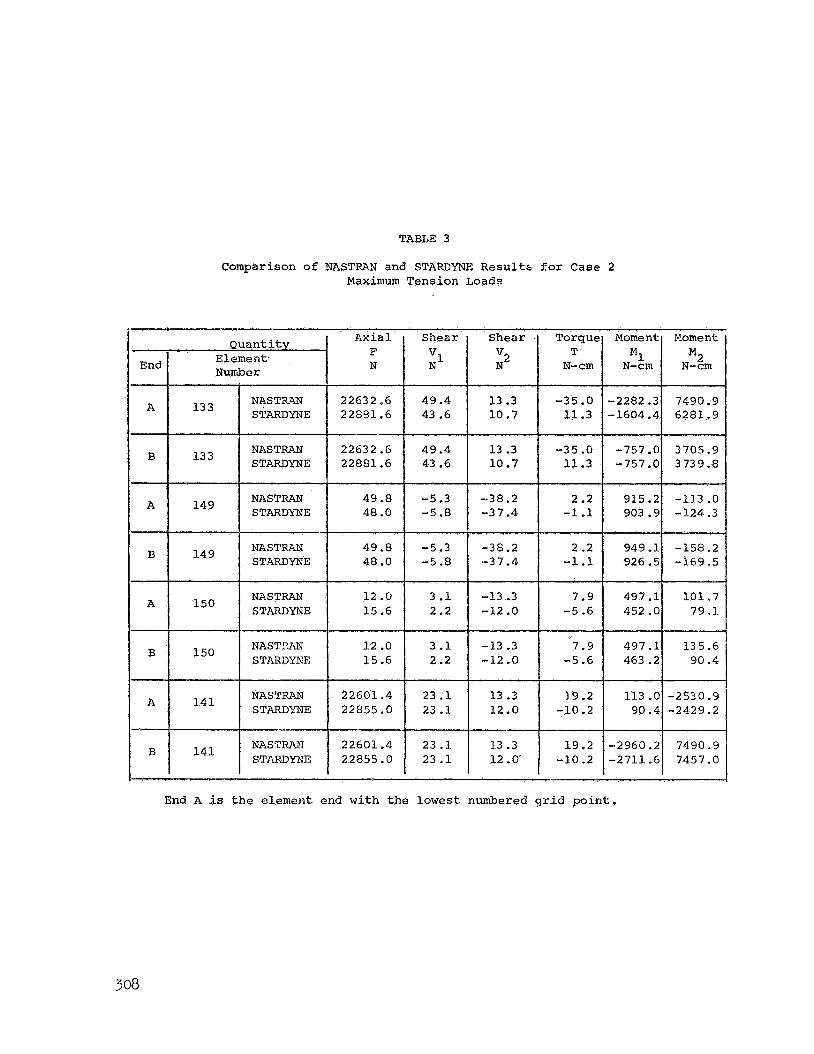
Significant results from the NASTRAN static analysis are presented in Figures 5 and 6, and Tables 2,3, and 4. Figures 5 anq 6 show the deformed structure for the specified load cases. In Tables 2 and 3, the results are tabulated for the maximum compression and tension load members. Table 4 presents a summary of grid point deflections €or Case 2.
COMPARISON OF NASTRAN AND STARDYNE STATIC ANALYSIS
A similar analysis for the same two static load cases as were investigated in the NASTRAN analysis was conducted by FI using the STARDYNE program. The STARDYNE results for the maximum compression and tension member loads and grid points deflections are also summarized in Tables 2, 3, and 4 for comparison with NASTRAN results.
In general, the NASTRAN and STARDYNE results show good agreement. Noted discrepancies in bending moment results may be attributed to differences in modeling details of the structure (e.9. in the STARDYNE analysis, the reflector hub ring was not included).
NASTRAN BUCKLING ANALYSIS
Buckling analysis for two maximum compression load conditions was investigated using Rigid Format Five of the NASTRAN program. These two load conditions corresponded to Cases 3 and 4 of Table 1.
buckling was well defined as can be seen in Figures 7 and 8. Figure 7 represents the fundamental buckling mode shape which corresponds to the eigenvalue of 4.22 for lateral load in the x direction (Case 3). For lateral load in the y direction (Case 4) the fundamental buckling mode which corresponds to the eigenvalue of 4.34 is shown in Figure 8. Since the eigen- values are multipliers of the applied loads which will cause buckling in the fundamental mode, the results show that, in both load cases investigated, the actual applied load must be exceeded by a factor of four before buckling will occur.
From the buckling analysis results, the fundamental mode of
STATIC LOAD TEST
The prototype RST was tested to qualification load levels by Hercules Incorporated (Ref. 2). The test setup is shown in Figure 9. The truss was rigidly fast-ened at the base and a simulated bridge truss was mounted on the top. and/or tension loads were produced by the two hydraulic rams. The lower hydraulic ram produced a load in the axial direction and the upper ram produced a moment or shearing load. Dial indicators and linear potentiometers were located at the top of the RST and at the stabilizer ring to record displacements. Thirty-six strain gages were attached to the GFRP tubes and fittings at critical locations. The loading of the structure was in steps of 25%, 50%, 80%, 90% and 100% of full load. The axial and lateral loadings were applied simultaneously. The truss was tested both in axial compression and tension with transverse loading in the +x and -x directions. Then the entire truss assembly was rotated 90° and the truss was tested again in axial compression and tension with transverse loading in the +y and -y directions. Thus a total of eight combined loading tests were conducted.
Thq compression
COMPARISON OF TEST RESULTS WITH ANALYSIS
Figure 10 compares the deflection test data and the NASTRAN predictions for Case 1 (see Figure 5). The test data were "normalized" since the actual test was conducted at qualification levels. The variations from the predicted values at the higher load levels are due primarily to difficulties in reading the instrumentation. The durations of the higher load levels were not long enough to allow the dial indicator gages to stabilize.
The maximum internal tube load determined from the strain gage data was 24,768 newtons which compares well with 25,760 newtons from the STARDYNE program and 24,470 newtons from the NASTRAN program. It is felt that a more detailed model of the composite material would give better values for the loads along the tubes.
CONCLUSION
The comparison of the results between NASTRAN and STARDYNE was good. The differences in the results were due to slight differences in the modeling techniques. It must be pointed out that the model was fairly simple with bar elements only used throughout. With more complex structures and different elements, the comparison of results might not be as good.
The comparison with test results was also good. It is believed that a more detailed finite element model of the composite material would yield more accurate comparison with strain gage test data.
REFERENCES
1. Informal Communication from Fairchild Industries. November 1971
2. "Qualification Test Report, Prototype Reflector Support Truss for Applications Technology Satellite." Hercules Incorporated, SC 71-6. November 11, 1971
TABLE 1
Applied Load Cases
1
2
3
4
Remarks No.
-3.9g 0.0g 9.0g Force and Moment Equiva- - l e n t t o F I STARDYNE Input
-3.99 0.09 - 3 . 9 ~ ~
-3.9g 0 -09 9 .Og Accelerat ion Loading Buckling Analysis