Comparison of NO2 vertical profiles from satellite and ground based measurements over Antarctica
Pavan S. Kulkarni1, D. Bortoli1,2, M. J. Costa1,3, A. M. Silva1,3, F. Ravegnani2 and G. Giovanelli2
1 Geophysics Centre of Évora (CGE), University of Évora, Évora, Portugal. [email protected]
2 Institute for Atmospheric Science and Climate (ISAC-CNR), Bologna, Italy
3 Department of Physics, University of Évora, Évora, Portugal
Abstract
The Intercomparison of nitrogen dioxide (NO2) vertical profiles, derived from the satellite based HALogen Occultation Experiment (HALOE) measurements and from the ground based UV-VIS spectrometer GASCOD (Gas Analyzer Spectrometer Correlating Optical Differences) observations at the Mario Zucchelli Station (MZS), in Antarctica, are done for the first time. It is shown here that both datasets are in good agreement showing the same features in terms of magnitude, profile structure, and temporal variations.
1. Introduction The discovery of the infamous ‘Ozone hole’ over Antarctica in the mid-1980’s [1] took atmospheric scientists
by surprise and lead to various field campaigns, analysis works, satellite investigation, modeling and laboratory studies to characterize the entire process that control the dynamics of Antarctic ozone (O3) hole. Stratospheric nitrogen dioxide (NO2) plays a key role in the chemical cycle of O3, particularly in the formation of Antarctic O3 hole. The monitoring of NO2 vertical distribution from satellite as well as from ground based platform is therefore of extreme importance as, satellite measurements provide greater coverage, whereas, ground-based measurements provide nearly continuous time series data over the same spot. It is of crucial importance to assure consistency between both kinds of data, hence the comparison between satellite and ground- based measurements is critical.
2. Stratospheric NOx Chemistry
The combination of NO and NO2 is referred to as NOx [2] due to the strong interdependence between these two
gases as seen from reactions (1) and (2). Similarly, NOy is the sum of all the reactive nitrogen oxides, including NOx, N2O, NO3, N2O5 and HNO3.
NO2 + hυ → NO + O (1) NO2 + O → NO + O2 (2) NO + O3 → NO2 + O2 (3)
The main source of NOx in the stratosphere is photodecomposition of N2O at around 25 km [3], through reaction (4), (5b) and (1). N2O is injected into the stratosphere from troposphere, where it has its natural and anthropogenic sources. The second minor source of NOx is polar winter descent of NOy created by auroral processes.
→ 2NO (5b) During sunlit period, the ratio of NO to NO2 in NOx is dominated by NO. As the Sun sets, the NO2 concentration rapidly increases at the cost of NO. During nighttime, additional chemical processes, but slower with respect to daytime processes, take place converting NOx into NOy:
NO2 + O3 → NO3 + O2 (6) NO2 + NO3 + M → N2O5 + M (7)
The NO3 and N2O5 are photolyzed during daytime, creating NOx again. The NO3 concentration drops rapidly at sunrise, while N2O5 is more slowly photolyzed at stratospheric temperatures, which explains the positive NO2 gradient during the day.
NOx chemistry is crucial to many stratospheric processes, including ozone depletion. Ozone (odd oxygen) is catalytically destroyed through the reaction cycle (2) and (3). In fact, photochemical loss of O3 is dominated by
NOx between 25 km and 40 km altitude [4]. In addition, NOx is an important factor in the formation of reservoir species and in the creation of HNO3-rich PSC (Polar Stratospheric Cloud) particles. The most important sink of stratospheric nitrogen inside the polar vortex is deposition of these particles to the troposphere (denitrification).
3. Instruments Descriptions
3.1 Satellite based instrument: HALOE
The HALogen Occultation Experiment (HALOE) [5] was launched onboard the Upper Atmosphere Research Satellite (UARS) in September 1991. HALOE is a solar occultation instrument with four radiometer channels and four dual radiometer/gas-filter correlation channels. It views the atmosphere in transmission with 15 sunrises and 15 sunsets per day. The occultation events occur in daily latitude bands, covering all latitudes between 80ºS and 80ºN in approximately 36 days. Vertical profiles of temperature, O3, HCl, HF, CH4, H2O, NO, and NO2 are retrieved from the measurements. The radiometer channels at the 1015, 1510, and 1600 cm-1 wave numbers are used for the NO2 retrievals. The NO2 number densities are retrieved over the altitude range 10–50 km at a vertical resolution of 2 km and are reported at 300 m intervals. The data product from the HALOE version 19 is used in this study. Numerous validations and comparisons had been done between HALOE derived vertical profiles and others derived from various satellite based instruments such as OSIRIS, POAM III, SAGE II, SAGE III, MIPAS, etc., [6]. Comparisons have also been done with vertical profiles obtained from balloon based instruments such as MKIV Interferometer [7] and Fourier Transform Infrared Radiometer (FTIR) of F. J. Murcray. In addition, HALOE retrievals have been compared with total column abundance concentration of NO2 measured with ground based instruments such as NOAA spectrometer. Randall et al. [8] compared the data product from the HALOE version 19 to the NO2 profiles obtained from the Atmospheric Trace Molecule Spectroscopy experiment (ATMOS) [9] and confirmed the good behavior of the HALOE data above 25 km (within 10%) and a bias of around 40% below 25 km.
3.2 Ground based instrument: GASCOD
The Gas Analyzer Spectrometer Correlating Optical Differences (GASCOD) instrument is a UV-VIS
spectrometer developed at the ISAC-CNR Institute [10] and installed at the ‘Mario Zucchelli’ station (MZS), (former Terra Nova Bay (TNB) station), Antarctica (74°26´ S, 164°03´ E), since December 1995. The GASCOD equipment includes: (a) the receiving Cassegrain telescope (150 cm f/5) focusing the incoming light onto the 0.1 × 2.0 mm input slit; (b) the filter wheel containing the band-pass filters to reduce the stray light in the spectrograph; the second wheel housing optical transducers acting as polarizers, neutral filters and quartz cells containing specific gases at known concentration; (c) the holographic spherical diffraction grating of 1200 grooves/mm by Jobin-Yvon, with a spectral dispersion of 2.4 nm/mm at 300 nm and a throughput similar to that of the input optics. The grating is moved with a stepper motor for the analysis of the spectral ranges from 250 to 650 nm in consecutives windows of about 60 nm; (d) the multi-channel sensor, (Hamamatsu) integrating an array of 512 MOS diodes of 0.5 x 2.5 mm each; (e) the electronic control unit for the management of the instrument and the data download, the external PC storing and processing the spectral data. The NO2 slant column densities (SCD’s) are obtained with DOAS (Differentail Optical Absorption Spectroscopy) technique applied to the raw spectral data, measured in the 423-460 nm range. Furthermore, NO2 SCD’s retrieved during sunrise and sunset events are used to calculate the vertical profiles of NO2. The methodology for trace gases vertical profile retrieval from ground-based slant column measurements was developed by McKenzie et al. and has been implemented within the forward radiative transfer model AMEFCO (Atmospheric Model for Enhancement Factor Computation) for the determination of the Air Mass Factor (AMF), in order to apply the Chahine inversion algorithm for the determination of the vertical profile of the selected compound. The methodology is based essentially on relationship between the SCD-SZA (Solar Zenith Angle) dependence and AMF variations. The radiative transfer model is used to calculate the weighting functions for each altitude, enabling the establishing of a matrix equation which is resolved through the Chahine inversion algorithm. With this algorithm the NO2 vertical profiles are retrieved from the surface up to 50 km with the vertical resolution of 2.5 km.
4. Intercomparison Methodology
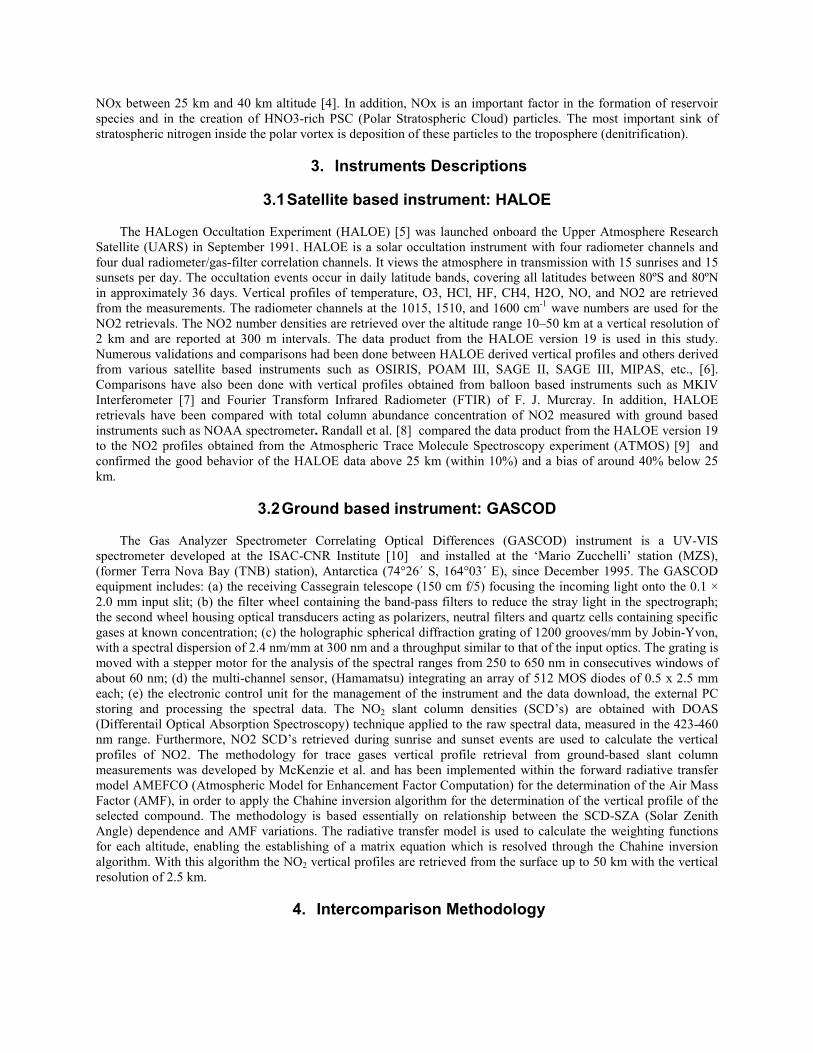
It is important to remember that the comparison between vertical profiles of NO2 from satellite based solar occultation measurements and from ground based UV-VIS spectrometer measurements may lead to significant differences (even for measurements in which the STPs are colocated in time and space). This is due to the fact that the measurement platforms are totally different. The comparison period in this study extends from October 2001 to February 2005. A latitudinal coverage of 6° (± 3°) and a longitudinal coverage of 30° (± 15°), centred at MZS (74° 42´ S; 164° 07´ E), are considered in this study. There are in total 16 coincidences, 12 sunrise events and 4 sunset events, in the aforementioned coverage area with maximum distance of 466 km from MZS. Figure 1 shows the location of MZS in Antarctica along with the scatter plot of HALOE overpasses, with GASCOD (MZS) at the centre. The absolute differences in the concentration of NO2 vertical profiles are computed with the interpolated
vertical profile of GASCOD at 300m resolution to match with HALOE data. Figure 1. Antarctic continent with the 77° 42´ S to 71° 42´ S zone (Dark red band) and 30° long by 6° lat cell (green cell) along with MZS station (red dot). The inset shows the MZS station (red dots) with HALOE overpass (Purple (SR) and Blue (SS)) in the green cell.
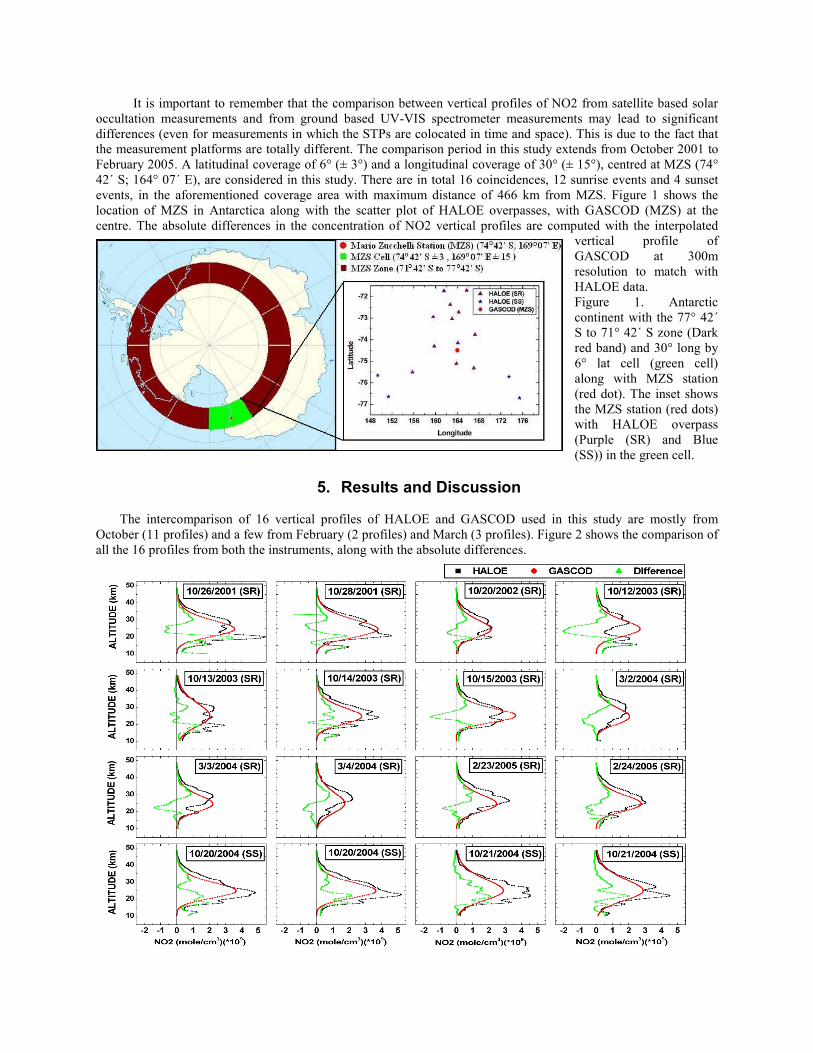
5. Results and Discussion The intercomparison of 16 vertical profiles of HALOE and GASCOD used in this study are mostly from
October (11 profiles) and a few from February (2 profiles) and March (3 profiles). Figure 2 shows the comparison of all the 16 profiles from both the instruments, along with the absolute differences.
Figure 2. Vertical profiles of NO2 concentration derived from GASCOD measurements (red) and from HALOE (black) measurements along with the absolute differences (green).
The profiles clearly show the month-to-month variation in the peak amplitude of NO2 concentration with a maximum in October and a minimum in March. Both instruments show a peak amplitude roughly at around 25-30 km. The absolute differences shown in the figure 2 are quite broad and highly variable from month to month. This could be due to the three following reasons,
(a) HALOE data has a much better vertical resolution (300m) compared to the GASCOD data (2.5km and interpolated to 300 m) and provides a better detailed structure of the NO2 vertical profiles, which leads to highly variable absolute differences.
(b) Even though, the magnitude peak amplitude of NO2 concentration of HALOE and GASCOD match closely, the altitude of peak amplitude has some mismatch, which leads to large absolute differences.
(c) The change in the position of two instruments with respect to latitude and the fact of having two distinct measurement platforms must also contribute for having these large and highly variable absolute differences.
6. Conclusions
The comparison of NO2 vertical profiles derived from two distinct platforms (space borne- HALOE and ground based spectrometer - GASCOD) reveals a fairly good agreement between profiles structure, magnitude and temporal variation. The maximum NO2 concentration found on both profiles is nearly at the same height (~ 25 km). Absolute differences in the vertical profiles of NO2 concentration is a bit large and highly variable and needs further improvement, namely in the resolution of vertical profiles from ground based measurements and in the number of satellite overhead passes in order to have a greater number of profiles to intercompare.
7. Acknowledgment
Author (P S. Kulkarni) is thankful to Geophysics Centre of the University of Evora (CGE-UE) for the
fellowship in the project ‘SPATRAM-MIGE Polar Project’, funded by FCT. This work was partially supported by the COMPETE project n. FCOMP-01-0124-FEDER-014024 with FCT reference PTDC/AAC-CLI/114031/2009.
8. References
1. J. C. Farman, B. G. Gardiner, and J. D. Shanklin, “Large losses of total ozone in Antarctica reveal seasonal CLOx/NOx interaction”, Nature, 315, 1985, pp. 207-210. 2. G. Brasseur, J. Orlando and G. Tyndall, “Atmospheric Chemistry and Global Change”, Oxford University Press, New York, USA, 1999, pp. 235 – 288. 3. P. Warneck, “Chemistry of the Natural Atmosphere”, International Geophysics Series, Volume 71, Second Edition, Academic Press, USA, pp. 119-120. 4. Dessler, A. E., “The Chemistry and Physics of Stratospheric Ozone”, Elsevier, New York, USA, 2000. 5. J. M. Russell, III, L. L. Gordley, J. H. Park, S. R. Drayson, D. H. Hesketh, R. J. Cicerone, A. F. Tuck, J. E. Frederick, J. E. Harries, and P. Crutzen: The Halogen Occultation Experiment, J. Geophys. Res., 98(D6), 1993, pp. 10,777-10,797. 6. S. M. Brohede, C. S. Haley, C. A. McLinden, C. E. Sioris, D. P. Murtagh, S. V. Petelina, E. J. Llewellyn, A. Bazureau, F. Goutail, C. E. Randall, J. D. Lumpe, G. Taha, L. W. Thomasson, and L. L. Gordley, “Validation of Odin/OSIRIS stratospheric NO2 profiles”, J Geophy Res., 112, 2007, p. D07310, doi:10.1029/2006JD007586. 7. G. C. Toon, “The JPL MKIV interferometer”, Opt. Photonics News,2, 1991, pp. 19-21. 8. C. E. Randall, J. D. Lumpe, R. M. Bevilacqua, K. W. Hoppel, E. P. Shettle, D. W. Rusch, L. L. Gordley, K. Kreher, K. Pfeilsticker, H. Boesch, G. Toon, F. Goutail, J.-P. Pommereau, “Validation of POAM III NO2 measurements”, J. Geophys. Res., 107(D20), 2002, p. 4432, doi:10.1029/2001JD001520. 9. Gunson, M. R., “The atmospheric trace molecule spectroscopy (ATMOS) experiment: Deployment on the ATLAS space shuttle missions”, Geophys. Res. Lett., 23, 1996, pp. 2333– 2336. 10. D. Bortoli, G. Giovanelli, F. Ravegnani, I. Kostadinov and A. Petritoli, “Stratospheric nitrogen dioxide in the Antarctic”, International Journal of Remote Sensing, 26(16), August 2005, pp. 3395–3412.